- 14 - Journal of Japan Association for Earthquake Engineering, Vol. 9, No. 3, 2009 FORWARD SPECTRAL FORECASTING OF GROUND MOTION WITH THE INFORMATION OF EARTHQUAKE EARLY WARNING SYSTEMS FOR STRUCTURAL CONTROL H. Serdar KUYUK 1 and Masato MOTOSAKA 2 1 Member of JAEE, PhD, Disaster Control Research Center, Tohoku University, Sendai, Japan, [email protected]2 Member of JAEE, Professor, Disaster Control Research Center, Tohoku University, Sendai, Japan, [email protected]ABSTRACT: There has been steady progress in research and development of earthquake early warning systems and its application to structural control. In this paper our proposed methodology about forecasting frequency contents of strong motion is first introduced, then its application to feed forward structural control with the usage of semi active control devices is simulated, and lastly it is showed that non-resonance structural control can be achieved before the strong motion of an upcoming earthquake reaches to a building of interest. Key Words: Earthquake early warning systems, structural control, artificial neural networks, active variable systems, Miyagi-ken offshore earthquakes INTRODUCTION Several methods and developments in earthquake early warning systems in active seismic zones such as Japan have been proposed recently. Most of them are related to backcasting, which investigates methods for calculating source parameters of earthquakes. On the other hand, the issue of forward prediction which forecasts the amplitude of ground motion, in far site has not been discussed adequately from the engineering point of view (Fig. 1). The usage of the newest technology and its engineering applications need urgent investigations. Next generation Earthquake Early Warning Systems (EEWS) will provide information to control structures equipped with active/semi-active devices or critical systems to protect them from the destructivity of earthquake ground motion. In order to mitigate the earthquake hazard, apart from warning society and taking the proper actions for damage reduction such as automatic shutdown systems of gas lines, slowdown of bullet trains etc, the attention focuses on the transmission of the necessary information to special or critical buildings, and the usage of the active or semi-active control devices in intelligent structures before the destructive energy of an earthquake reaches. Before transmitting the required information, there are some questions needed to be answered from the structural point of view, such as; what kind of parameters or functions and how these Earthquake Early Warning (EEW) information can be applied to the structures and, above all, much critically, how or which methods should be used to find the desired functions in real-time.
Transcript
- 14 -
Journal of Japan Association for Earthquake Engineering, Vol. 9, No. 3, 2009
FORWARD SPECTRAL FORECASTING OF GROUND
MOTION WITH THE INFORMATION OF
EARTHQUAKE EARLY WARNING SYSTEMS FOR
STRUCTURAL CONTROL
H. Serdar KUYUK1 and Masato MOTOSAKA
2
1 Member of JAEE, PhD, Disaster Control Research Center, Tohoku University,
Sendai, Japan, [email protected] 2 Member of JAEE, Professor, Disaster Control Research Center, Tohoku University,
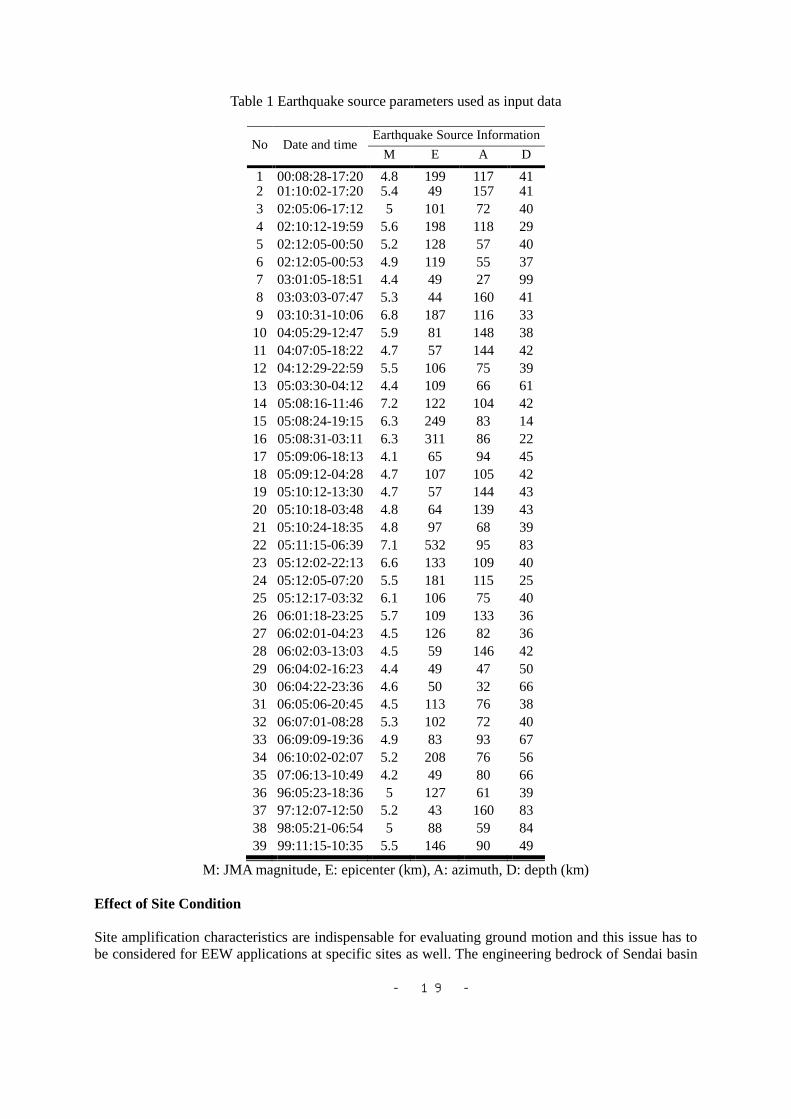
Site amplification characteristics are indispensable for evaluating ground motion and this issue has to
be considered for EEW applications at specific sites as well. The engineering bedrock of Sendai basin
- 20 -
is a Pliocene layer where the S-wave velocity is larger than 500 m/sec and SPT value (N) is greater
than 50 and seismological bedrock is the pre-Tertiary intact rock with the 3 km/sec S-wave velocity
(Satoh et al. 2001). Velocity structure of Sendai basin is reported and available in the Earthquake
Damage Survey Report for Sendai city (Earthquake Damage Survey Report for Sendai City 2003). We
calculated site-amplification factors from the seismological bedrock to engineering bedrock by the
linear one-dimensional wave propagation theory for obliquely incident S-wave. The S-wave velocity
of the seismological bedrock is assumed to be 3000 m/sec based on the refraction survey in the
Kitakami Mountains (Iwasaki 1994), about 100 km away from Sendai City, and this deep structure is
basically represented by four sedimentary layers. Then amplification factors from engineering bedrock
to surface outcrop are calculated by nonlinear one-dimensional program - the SHAKE code (Schnabel
1972). The normalized shear modulus G/Gmax and damping ratios with respect to shear strain and soil
profiles are adopted from (Earthquake Damage Survey Report for Sendai City 2003). Lastly, the two
site amplification factors are combined for each site. Nonlinearity depends on the ground motion taken
into account in frequency domain in four sites for each 39 earthquake.
Fig. 4 Simulated initial ground motion
Structural Resonance Theory
Resonance against seismic ground motion in structures can be describe as the tendency of a vibrating
system to respond most strongly to a seismic force whose frequency is close to the structures natural
frequency of vibration. Basically, let us assume that for a given structure three stiffness types may
Fig. 5 Modeled frame structure with three stiffness type
- 21 -
arise; soft, normal and stiff types which are shown in Fig. 5 by locking and unlocking the AVSs
devices at the diagonal bracings. Let M and K are the mass and stiffness matrices of the structure and
the solution of the Eigen-value problem described by Eq. (4) for each of the structure types I, II and III,
yields the corresponding first natural frequencies 1
If , 1
IIf and 1
IIIf
2 20 0
n nK w M K w M
(4)
where 1 2 3 1, , ..., 2n i iw w w w f w 1, 2 , . . . , 1i n
and is the eigenvectors. By construction of the frame, the frequencies also hold:
1 1 1
I II IIIf f f (5)
In order to avoid building resonance during the earthquake the condition that should be satisfied is:
1 1, ,..... , ,input input input I II III
k k k kf f f f f f (6)
where input
kf are the dominant spectral frequencies of the seismic ground motion. The inequity of the
above equation is used in an exact sense, the contribution in case of the near resonance should be
considered as well. In case of high-rise buildings, where the higher modes may contribute more to the
dynamic response, equation should satisfy for each natural frequency of modes.
Results and Discussion
Consistent and continuous spectral representation of earthquake wave amplitude for the usage of
advance civil engineering structures would help in controlling structural responses. It is well known
that the shape of the FAS can not be modeled accurately by only basic source information such as
magnitude and site-to-station distance. Hence, from a practical point of view, it is worthwhile to
consider only those parameters which are readily available in EEW application regarding structural
control. The advantage of this approach is that, without a complete and possibly indecisive analysis,
the approximate FAS can be estimated for a given expected earthquake using online obtainable
information.
The methodology is presented by a scenario earthquake for the ANN approach, which is
applied to four main locations in the Miyagi area of interest; Shiogama, Ishinomaki, Taiwa and Sendai
stations. Fourier amplitude spectrum of a magnitude 7.2 earthquake is given in Fig. 6. Gray lines
represent the observed Fourier amplitude (FA), the red lines are the forecasted FA. Forty circles in
each FA are the forecasted amplitude corresponding to the frequency set. To combine the discrete
points, a piecewise-polynomial approximation is used. The cubic spline data interpolation is
performed using spline algorithm (Matlab 2007). Basically, for the coefficients of the cubic
polynomials, which make up the interpolating spline, a tridiagonal linear system is constructed and is
being solved for the required intervals. We think that this method is beneficial and applicable to
similar studies due to the simplicity of its construction, ease, and accuracy of evaluation, especially its
capacity to approximate complex shapes through curve fitting. The difference between computed and
observed Fourier spectra in Fig. 6 clearly shows that the scaling characteristic of earthquake ground
motion in terms of earthquake source, initial ground motion, and site amplifications can be expected to
yield satisfactory answers in all cases for Miyagi-ken oki earthquakes. This figure is the capture of the
FAS in 5.5 sec after the first detection of P wave in Oshika. Based on our experience, the national
- 22 -
EEWS information reaches the Disaster Control Research Center (Tohoku University, Sendai) in 5.5
sec average after detection of an earthquake in the nearest point. This delay reflects the transmission
delay that is caused due to the distance between Sendai and Tokyo where the JMA/NIED (National
Institute of Earthquake Disaster) center is located. Therefore, in our hybrid approach the source
information is known after detection of earthquake in 5.5 sec and then further information and
calculations are provided by our regional system.
An error can be seen in Taiwa(MYG09) between 3 to 4 Hz which is basically due to the
limitation of forecasted points. In case the peak amplitude is in the middle of the forecasted points,
these errors are unavoidable. Although it is adequate in here as a preliminary study, increase in the
frequency of data set for prediction by at least two times could be a solution. With the increasing
points which are accompanied with increase in computation efforts, the compatibility of high
frequency ranges will also be better. Since high frequency ground motion attenuate faster than low
frequency with distance, high frequency ranges are biased in Taiwa city, which means prediction of
high frequencies in far ranges become rather difficult. However, it is no more important to predict high
frequencies in far ranges such as Taiwa city, since low frequency motions become more critical,
especially for high rise buildings with long periods (as seen the fundamental frequency is unclear in
the graph).
All the peak values, except in Taiwa (MYG09), are forecasted satisfactorily. The authors
think such error in Taiwa is in fact acceptable. Due to resonance/near-resonance phenomena, the
control algorithm will arrange a stiffness of the structure in order to adjust the natural frequency of the
structure and shift the building frequencies as far as possible from the ground motion dominant
frequency. For instance, the content of FAS motion message will be served to a AVS-equipped
structure so that it would allow for a small but satisfactory window for moving the hydraulics of the
AVS system to compensate for the frequency content of the arriving seismic signal.
Fig. 6 August 16, 2005 earthquake (7.2 magnitude), predicted and real FAS in four site
- 23 -
Overall, the agreements between the observations and forecasts are seen clearly at four sites.
It can be said that the ANN methodology forecasted well enough for an unseen and new earthquake.
The test so far suggests that the forecasted FAS are very realistic for 4.1 < M < 7.2 and for horizontal
ground motion. To understand these amplitudes we need more accelerometer records in the same area
and so we must patiently wait for this data to become available. On the other hand, in different
locations, like California, where there is more data available, the same methodology could be applied.
Numerical Example
Using the outlined process, it is now possible to deliver the frequencies of upcoming ground motions
to intelligent structures. Here, the eight story, two-bay, steel frame, shown in
Fig. 5 is simulated to describe how the methodology can be effectively used. The structure is analyzed
under the base motion corresponding to the August 16, 2005, earthquake in Miyagi prefecture. Three
structure types were chosen; the first type with all braces open and the others are closed according the
Fig. 5. As can be seen from the Fig. 7 the spectra of the records in each station have different
frequency contents (To better recognition, Fourier amplitude spectrums of displacement are
normalized according to their maximum values).
In time history analysis of the buildings, August 2005 Miyagi earthquake records from four
locations, Taiwa, Ishinomaki, Shiogama and Sendai were used. The structures are assumed to be fixed
base (without soil-structure interaction) with damping ratio of C=0.001*M+0.02*K and the floors as
rigid diaphragms with infinite in-plane stiffness. The sections and dimensions of the structure elements
are kept constant for all floors as for the columns IPE100 and the beams IPE80. The storey heights of
the frame are assumed to be constant with 3 meter and the bays are 5 meter. The modulus of elasticity
for the structural elements230kN mm , Poisson’s ratio 0.20 and mass density
325kN m are assumed and for the illustrated braces bar elements are assumed with the
2200kN mm and 10 mm2 cross section.
Fig. 7 Displacement frequency content of August 16, 2005 earthquake
Dynamic analyses of the structure subjected to earthquake were carried out by a Matlab
software program for finite element analysis. The second order differential equation is solved by the
Newmark method and for the natural frequencies of each type Eigen-value analysis is performed. First
four modes are given in Table 2. The displacement and acceleration at the top of the buildings with
stiffness types I, II and III are shown in Fig. 8 and Fig. 9.
Horizontal displacements on the top of the frame structure in Taiwa showed that due to near
resonance phenomena (first natural frequency of Type I is 0.53 Hz where seismic record is 0.40 Hz)
- 24 -
the peak displacement of softest type was three times more than Type III. In Ishinomaki, above
explanation was valid for Type II which natural frequency is 0.91 Hz and the record was 0.90 Hz. In
this station it is clear that because of the resonance stiffer configuration, Type II was 8.4 cm while
Type I was about half of it. Again the stiffest, Type III was the best choice for the smallest response
regarding to displacement. However, in Shiogama fundamental frequency of upcoming ground motion
was 3.66 Hz where natural frequency of Type III was also 3.88 Hz which indicated that the stiffest
structure’s replacement was the largest and, contrary Type I was the smallest value. Nevertheless, the
difference in displacement of the three types were not significant, this was due to the contribution of
low frequencies in the area. In Sendai similar result can be seen like Ishinomaki city that the peak
displacement was occurred in Type II.
Table 2 Natural frequency of frame structure
Modes Natural Frequencies
Type I Type II Type III
1st 0.53 0.91 3.88
2nd
1.68 2.54 6.02
3th 3.08 3.98 14.92
4th 4.82 8.37 15.26
These results are interesting because, even though a structure designer considers the response
spectrums and the amplification factors of ground in design stage; there is a possibility that the
structure can get resonance due to frequency content of impending ground motion which is caused by
rupture process of earthquake. At the end, evaluating the displacement results on top of the structure
by itself, it can be said that, Type III, Type III, Type I and Type III are the chosen configuration in
Taiwa, Ishinomaki, Shiogama and Sendai cities respectively.
On the other hand, these selections did not stand for the acceleration response. As can be
seen in Fig. 9 the peak accelerations for Type III took the biggest values at four locations. Especially
in Shiogama this was obvious that peak acceleration was six times larger for Type III. In Ishinomaki,
the peak displacement between Type I and III is about two times however this is vice-verse for the
peak acceleration. Here the decision algorithm became very important. In case the structure could
resist the peak displacement in every configuration, the best options turns to Type I acceleration
records. The authors are aware that this frame structure is not adequately representing the common
resistant buildings; however this was a good example to indicate that the frequency content of the
seismic motion is also crucially important and in case of forecasted frequency in far sites, it is not
impossible now to avoid resonance in structures due to the uncertainty of input seismic ground motion.
The innovation of this study shown in the example could be highlighted as; the best
configuration of the structure could be selected even the P-wave has not reached in Sendai and Taiwa
cities. This decision could be made 5.5 second after the detection of the earthquake. The authors
ignored the process time of FAS prediction which needed for ANN methodology due to negligible
process time (a few milliseconds). Therefore the methodology is very efficient in order to build securer,
more reliable residents.
CONCLUSIONS
Application of earthquake early warning systems currently focuses on providing information to the
public services; however, next generation EEWS will provide information to control critical systems
or structures equipped with active/semi-active devices from the destructivity of earthquake ground
motions. Providing consistent and continuous spectral representations of earthquake wave amplitudes
for the usage of advance civil engineering applications would definitely help to reduce seismic
response.
- 25 -
Fig. 8 Top displacement records of three type structure at four stations
Fig. 9 Top accleration records of three type structure at four stations
- 26 -
In this study it is proposed that Fourier amplitude spectrum of earthquake ground motion can be
forecasted in far-site ranges after detection of an earthquake in terms of initial ground motion, source
parameters, and site amplification in frequency domain which are provided by different EEWSs. For
this purpose, the authors have developed a regional warning system which integrated with the
JMA/NIED, national Japan EEWS in Miyagi Prefecture against Miyagi-ken Oki earthquakes. Our
system is providing a real-time online waveform data from the nearest inland point to the Miyagi
subduction area to the center located in Tohoku University, Sendai. Artificial neural network
methodology is used to integrate the information from the hybrid configuration. Numerical
simulations have been performed for verification in structural control. The results indicated that the
methodology of FAS forecasting will provide great contribution to structural control considering non
resonance phenomena with the usage of feed forward control algorithms Numeric simulations have been proving that structural control can be effectively achieved if
the content of propagating waves is known before arriving at the building of interest. It is therefore
particularly valuable to forecast Fourier Amplitude Spectrum in this respect for real time engineering
applications.
ACKNOWLEDGEMENTS
The K-NET data were used in this study. The authors are grateful to the concerned persons of National
Research Institute for Earth Science and Disaster Prevention (NIED). We also thank Mr. Makato
Homma for his fruitful discussions with us. The authors also express their sincere gratitude to three
anonymous reviewers for their constructive critiques during the review process.
REFERENCES
Akkar S. and Bommer J.J. (2007). “Prediction of elastic displacement response spectra in Europe and
the Middle East.” Earthquake Engineering and Structural Dynamics, Vol. 36,1275–1301.
Böse M. (2006). “Earthquake Early Warning for Istanbul using Artificial Neural Networks.” Fakultät
für Physik der Universität. Hamburg, Karlsruhe. PhD. Thesis.
Earthquake Damage Survey Report for Sendai City. Sendai, Publication of Sendai City, Dec. 2003
Garret J.H. (1994). “Where and why artificial neural networks are applicable in civil engineering.” ASCE, J Comp Civ Engng[special issue] Vol.8, No 2, 129-30.
Iwasaki T., Yoshii T., Moriya T., Kobayashi A., Nishiwaki M., Tsutsui T., Iidaka T., Ikami A. and
Masuda T. (1994). “Precise P and S wave velocity structures in the Kitakami massif, Northern
Honshu, Japan, from a seismic refraction experiment.” J. Geophys. Res. Vol. 99, No 22, 187-204.
Nakamura Y. (1985). “A concept of one point detection system and its example using personal
computer for earthquake warning.” Proceedings of 18th Earthquake Engineering Symposium,
Japan.
Kobori T, Takahashi M, Nasu T, Ogasawara K. (1993). “Seismic response controlled structure with
active variable stiffness system.” Earthquake Engineering and Structural Dynamics, Vol. 22,
925-41
Kuyuk H.S. (2008) “Forward forecasting of ground motion for earthquake early warning using
artificial neural network and its advanced engineering application”, Tohoku University, Sendai,
PhD Thesis
Matlab (2007), Spline Toolbox
Motosaka M., Homma M., Kuyuk H.S. and Arrecis F. (2008) “Development of an Integrated Early
Warning and Structural Monitoring System to Real Time Earthquake Information.” AIJ J. Technol.
Des. Vol. 14, No. 28
Pnevmatikos N.G., Kallivokas L.F. and Gantes C.J. (2004). “Feed-forward control of active variable
- 27 -
stiffness systems for mitigating seismic hazard in structures.” Engineering Structures, Vol. 26,
471-483.
Satoh T., Kawase H. and Matsushima S., (2001). “Estimation of S-Wave Velocity Structures in and
around the Sendai Basin, Japan, Using Array Records of Microtremors.” Bulletin of the
Seismological Society of America, Vol. 91, No 2, 206-218.
Schnabel B., Lysmer J. and Seed H., (1972). “SHAKE; A computer program for earthquake response
analysis of horizontally layered sites.” Report EERC 72-12, College of Engineering, University of
California, Berkely.
Sokolov V., Loh C. H. et al. (2000). “Empirical model for estimating Fourier amplitude spectra of
ground acceleration in Taiwan region.” Earthquake Engineering and Structural Dynamics, Vol. 29,
339-357.
Trifunac M.D. and Lee V.W., (1989). “Empirical models for scaling Fourier amplitude spectra of
strong ground acceleration in terms of earthquake magnitude source to station distance site
intensity and recording site conditions.” Soil Dynamics and Earthquake Engineering Vol. 8, No 3.
Yamada M., (2007). “Early Warning for Earthquakes with Large Rupture Dimension.” California
CaliforniaInstiute of Tehnolgy Pasadena, PhD Thesis.
Wu Y. M., Kanamori H. (2005). “Experiment on an Onsite Early Warning Method for the Taiwan
Early Warning System.” Bulletin of the Seismological Society of America Vol. 95, 347-353.