64
Fossil Energy, Shale Oil & Gas Joint EPS-SIF International School on Energy Varenna, Como Lake – 21-26 July, 2017 Mario Marchionna

Fossil Energy, Shale Oil & Gas
Joint EPS-SIF International School on Energy Varenna, Como Lake – 21-26 July, 2017 Mario Marchionna

1. From primary sources to energy services
2. Conventional resources
3. Unconventional resources
4. Energy outlook 2020
5. Energy scenario to 2040
6. Impact on Oil & Gas industry – role of technology innovation
7. A few examples of technology innovations in Saipem
Contents of the presentation
Fossil Energy: reasons for the success and risks for the future
2
1. From primary sources to energy services

Primary energy
Supply technologies
End-Use technologies Secondary
energy Energy services
Lifestyle Satisfaction
of Needs
Means End
Supply efficiency End-Use efficiency Lifestyle efficiency
Conversion of primary energy to energy services
4

Carrier Production
Process
Carrier Storage
Energy Source
Distribution
Final Use
Performance &
Impact on Environment
From source to energy carriers to final use
Coal, Natural Gas, Nuclear, Renewables (Hydro, Solar, Wind)) Electric Power Oil Transportation & Petro-chemistry
M. Marchionna, Treccani Encyclopedia of Hydrocarbons, 2007, Ed., 3 (4.1), 301-317 5
The availability of energy sources for its production and the variety of uses are certainly the strong points of the carrier; nevertheless, the intermediate phases of storage and distribution are even more decisive

Carrier Production
Process
Carrier Storage Oil Distribution
Final Use
Performance &
Impact on Environment
From source to energy carriers to final use
Gasoline, Diesel, Jet fuel (through refinery processes))
M. Marchionna, Treccani Encyclopedia of Hydrocarbons, 2007, Ed., 3 (4.1), 301-317 6
Liquid carriers considerably simplify the transport and storage phases. This is probably one of the keystones in the use of oil as a primary fuel, as it is not only relatively cheap and available in great amounts, but also able to produce highly appreciated liquid carriers with very high energy density per volume unit The case of Fuel Oil & Electric Energy

Source: CIA World Fact Book 2009, United Nations Development Program’s Human Development Report, 2009.
ArgentinaUK
Germany
DR Congo
Nigeria
Russia
Japan
Ethiopia
Bangladesh
India
IndonesiaChina
Brazil
South Africa
Qatar
Canada
Sweden FinlandUnited States
0.3
0.4
0.5
0.6
0.7
0.8
0.9
1
0 2000 4000 6000 8000 10000 12000 14000 16000 18000
Electricity Use Per Capita (kWh/year)
U.N
. Hum
an D
evel
opm
ent I
ndex
Electricity (very appreciated energy carrier) allows people to live better and longer
7

2. Conventional resources

Fossil Fuels are still the major energy sources
9

(Source: Shell, 2006)
Global distribution of fossil resources
Unconventional O&G
Europe32%
Africa-Middle East6%
US27%
Americas3%
Asia-Pacific32%
(Source: OGJ, 2007)
World Coal Reserves 20800 quad BTU
(Source: OGJ, 2009)
10

33 32 39 3831
1965 1975 1985 1995 2006
Impending reserves’ depletion myth is groundless
Proved oil reserves (only a part of oil resources in place) have increased thanks to exploration activities, improved technology and market conditions. Despite production increase, oil life index has grown up on average
from time to time. Moreover, oil life index doesn’t take into account future discoveries.
World oil life index (Years)
(*)
Production (Mbl/d)
1965 2006
32 83
11
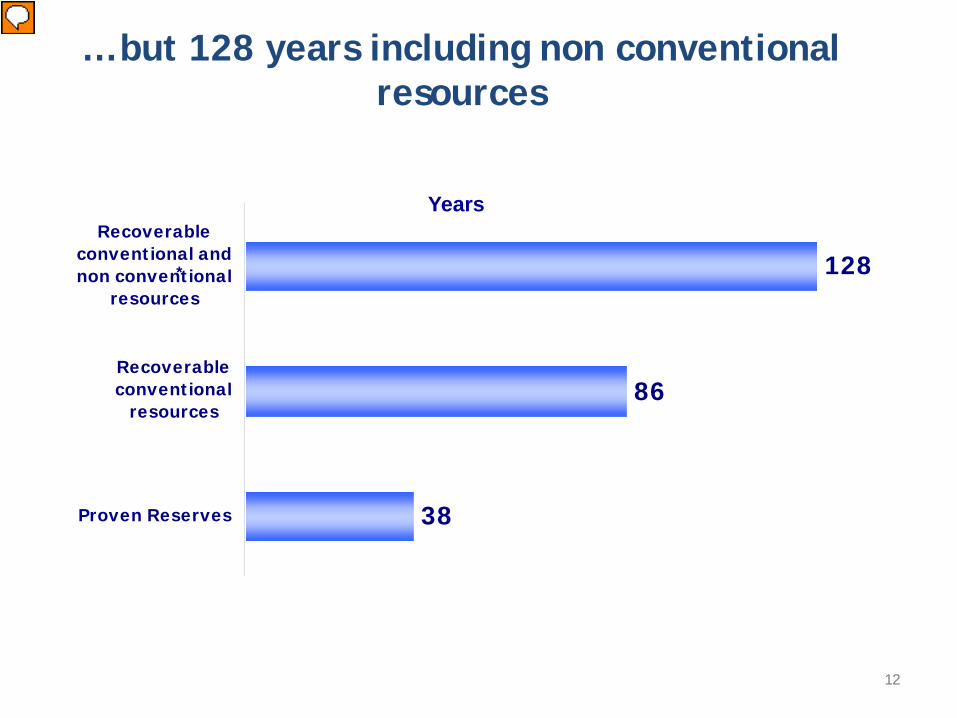
38
86
128
Proven Reserves
Recoverableconventional
resources
Recoverableconventional andnon conventional
resources
… but 128 years including non conventional resources
Years
* Recoverable conventional resources (2300-2900 Bn bl) and non conventional ones (tar sand and extra heavy oil, 1300 Bn bl)
*
12

THERE IS PLENTY OF RESOURCE …
13

Resources of Natural Gas are very abundant
Source: MIT, The future of natural gas - 2010
14

Deep water basins hold around 10% of hydrocarbon exploration potential
Unconventional oil technical reserves volume is 1,300 Bn boe, mainly located in Canada (tar sands), Venezuela (extra heavy oil) and Russia
Production of tar sands and extra heavy oil will represent 7% of 2020 global supply (3% in 2006) while 67% of production will be converted to synthetic crude oil (SCO)
About 90,000 bcm of recoverable reserves are stranded gas
Unconventional gas resources are huge: 400,000 bcm of tight gas (mostly in USA) and 180,000 bcm of coal bed methane(3) (mostly in Russia, Canada and China)
Currently, reinjected, vented or flared gas is 20% of the world gas production
High potential in unconventional oil & gas
(1) Far from markets, often located in small fields with high geological complexity (2) Natural gas trapped in low porosity stone/sand layers (3) Natural gas trapped in coal deposit
15
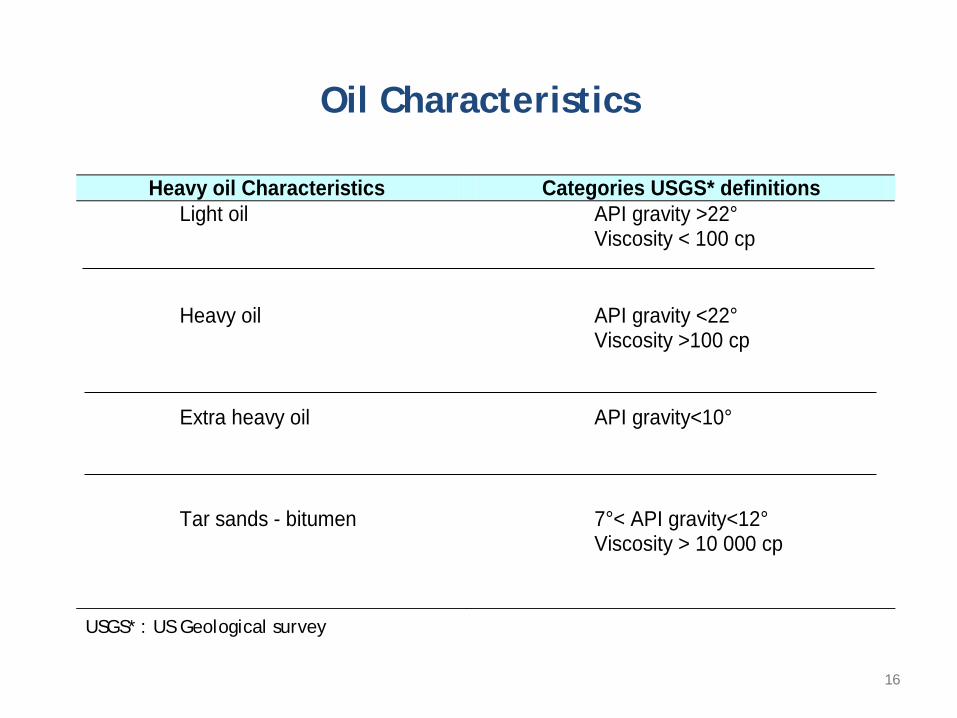
Oil Characteristics
Heavy oil Characteristics Categories USGS* definitions Light oil API gravity >22°
Viscosity < 100 cp
Heavy oil API gravity <22° Viscosity >100 cp
Extra heavy oil API gravity<10°
Tar sands - bitumen 7°< API gravity<12° Viscosity > 10 000 cp
USGS* : US Geological survey
16

0
5
10
15
20
25
30
35
Saudi Arabia Ira
qIra
n
Kazakhsta
nLib
yaAlgeri
aBrasil
Nigeria
AngolaChina
USA onshoreRussi
a
North Sea
US Gulf Mexico
Venezuela*
Canada*
Technical cost $/boe
perspective
current
Technical cost includes finding, development and production cost (F&D+Opex)
* Integrated projects include the upgrading of extra heavy oil (Venezuela) and oil sands (Canada)
“Easy” oil mainly located in the Middle East and Africa
+62%
17

What is a reservoir?
Reservoir rocks have to be permeable Its pores must be connected for oil to flow
Oil occurs only in pores of reservoir rocks (Carbonates & Sandstones).
Viscosity
18

Waterflooding – Mechanical Displacement
Improved Oil Recovery Methods: to recovery mobile oil
Supplying energy to reservoir by means of • Immiscible Gas Injection • Waterflooding
19

IMPROVED RECOVERY IMPROVED RECOVERY
ENHANCED ENHANCED RECOVERY RECOVERY
GAS GAS CONDENSATE CONDENSATE
CYCLING CYCLING
GAS GAS INJECTION INJECTION
WATER WATER INJECTION INJECTION
ADVANCED ADVANCED WELLS WELLS
OTHERS OTHERS CHEMICAL CHEMICAL GAS MISCIBLE / GAS MISCIBLE / IMMISCIBLE IMMISCIBLE
THERMAL THERMAL STEAM FLOODING STEAM H&P HOT WATER IN SITU COMBUSTION
HYDROCARBONS NITROGEN CARBON DIOXIDE FLUE GAS WATER - ALTERNATE GAS “GEOLOGICAL SEQUESTRATION”
POLYMER ALKALINE SURFACTANT FOAM GAS & WATER SHUT OFF
BIOLOGICAL CARBONATED WATER ELECTROMAGNETIC MECHANICAL (e.g. VIBRATING, MINING ..) . . . . . . . . . . . .
PRIMARY SECONDARY
TERTIARY
IMPROVED RECOVERY IMPROVED RECOVERY
ENHANCED ENHANCED RECOVERY RECOVERY
GAS GAS CONDENSATE CONDENSATE
CYCLING CYCLING
GAS GAS INJECTION INJECTION
WATER WATER INJECTION INJECTION
ADVANCED ADVANCED WELLS WELLS
OTHERS CHEMICAL GAS MISCIBLE IMMISCIBLE
THERMAL
STEAM H&P HOT WATER
HYDROCARBONS NITROGEN CARBON DIOXIDE FLUE GAS WATER - - GAS “GEOLOGICAL SEQUESTRATION” of CO2
POLYMER ALKALINE SURFACTANT FOAM GAS & WATER SHUT OFF
CARBONATED WATER ELECTROMAGNETIC MECHANICAL . . . . . . . . . . . .
SECONDARY
TERTIARY
(I.O.R)
(E.O.R)
Increase of reservoir recovery factor
20

Challenges and Dilemmas Sustainability
Increasing of water production from oil reservoirs
21

Water Management
22

Uses of Water in Upstream O&G Systems
• Drilling operations
• Desalting of crude oil
• Assist oil dehydration (water recycling)
• Well completion, well workovers, well kill
• EOR operations, e.g. water injection, WAG, polymer or surfactant floods, SAGD for heavy oil (steam)
• Heat Exchangers / Heaters / Cooling water
• Separation train sand jetting operations/tank jetting
• Make up water for chemicals
• Potable water
• Fire water
• Safety systems (deluge)
23

Exploration & Production (E&P) Companies Are :
Major Water Producers 86 million bbl/day global oil production 220 million bbl/day global water production, typically brine Water “cut” up to 95 percent in certain older fields Most is re-injected at significant cost ($2-$14/bbl)
Major Freshwater Users 14 million bbl/day in stimulation of unconventional gas resources 0.5 million bbl/day in thermal recovery of heavy oil 1 million bbl/day in secondary recovery (waterflood) of conventional oil
Major Water Production/Use Trends
Unconventional gas will require hundreds million bbl/day of water by 2025 Coal bed methane dewatering in US will contribute 4 million bbl/day by 2025
24
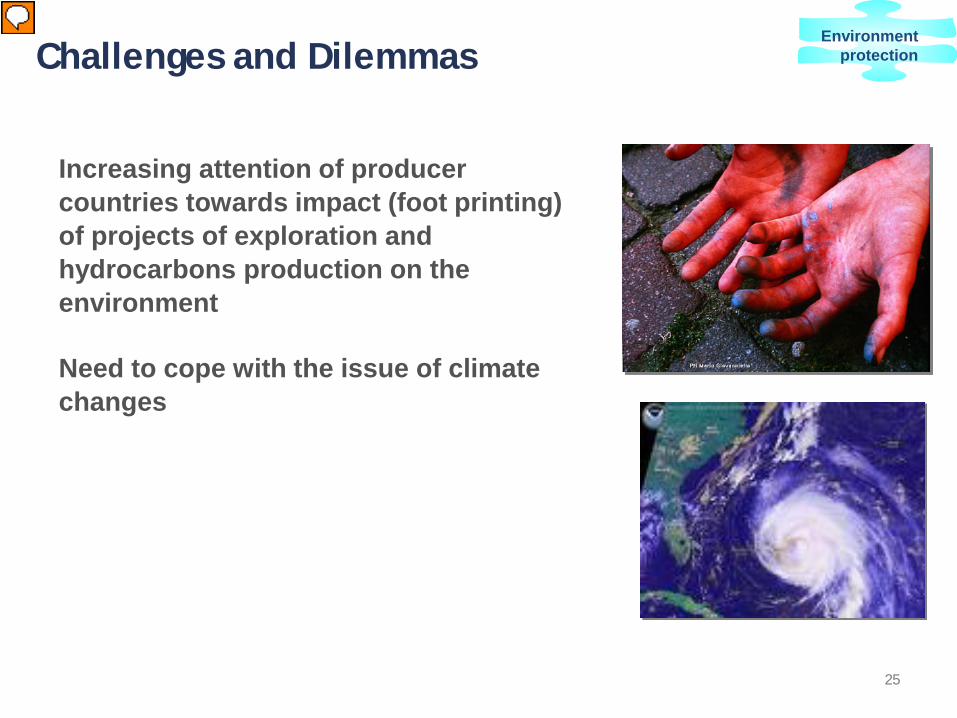
Increasing attention of producer countries towards impact (foot printing) of projects of exploration and hydrocarbons production on the environment
Need to cope with the issue of climate changes
Challenges and Dilemmas Environment
protection
25

Environmental concerns represent the real obstacle to fossil fuel based growth
Environment protection
Source: World Resource institute, 2006
OTHER
Total global man-made CO2 emissions
Current GHG
emissions
Current CO2 emissions from
the energy sector
Energy Land use & deforestation
Agriculture Waste Industrial(non-energy)
Power generation Industry
Transport Domestic Heating Other
>60% >40%
26

Technologies for reducing direct CO2 emissions from industry
27

SULPHUR MANAGEMENT CURRENT FORMING, STORAGE & SHIPPING TECHNOLOGY
Storage of sulphur above ground is typically used to manage high quantities of Sulphur recovered by Production facilities upstream Sulphur chain
Conventional sulphur blocks are subject to deterioration leading to environmental issues including: − Acid run-off due to the action of micro-organisms
(Thiobacilli Oxidans) − Sulphur dust blown from site
Significant maintenance is required for Long term storage sulphur blocks to ensure adequate protection of the environment and also to maintain sulphur quality.
This require ongoing investments.
28

Pouring Cutting Wrapping Transportation
Solid Sulphur Box
made using
“CONCREWALL PANELS”
Tailor-made solutions have been developed for the managing of solid sulphur, such as a safe “Long term storage” and a “zero emissions” transportation
SAIPEM INNOVATIVE APPROACH TO SULPHUR MANAGEMENT
TWO SOLUTIONS: LONG TERM STORAGE AND «HANDLING» SYSTEM (SSMS)
29

3. Unconventional Resources THE “SHALE” REVOLUTION

Oil & Gas - containing shales
31
Shale is fissile and laminated (meaning that the rock is made up of thin layers) Shales may contain organic material that sometime breakdown to form NG and oil

THE REALITY ABOUT SHALE
It is sodium carbonate and calcium carbonate. Shale is ubiquitous. More countries with shale than without. The energy glut was caused by US shale producers initially recovering 3%-5% of the hydrocarbons in a shale development. With better technology, we will soon recover 10%-12%. Production costs are declining.
32

Shale Gas Production Technology
(Source: Financial Times, March 2010)
33
-
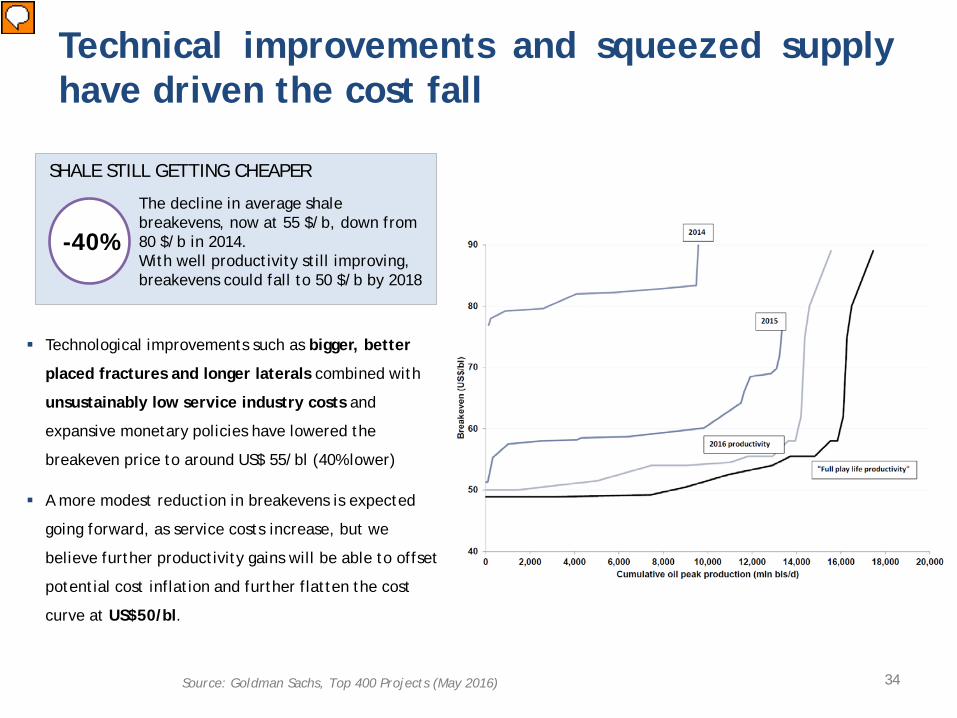
Technical improvements and squeezed supply have driven the cost fall
Technological improvements such as bigger, better
placed fractures and longer laterals combined with
unsustainably low service industry costs and
expansive monetary policies have lowered the
breakeven price to around US$ 55/bl (40% lower)
A more modest reduction in breakevens is expected
going forward, as service costs increase, but we
believe further productivity gains will be able to offset
potential cost inflation and further flatten the cost
curve at US$50/bl.
Source: Goldman Sachs, Top 400 Projects (May 2016) 34
SHALE STILL GETTING CHEAPER
-40%
The decline in average shale breakevens, now at 55 $/b, down from 80 $/b in 2014. With well productivity still improving, breakevens could fall to 50 $/b by 2018

Shale Oil producers in the US

US shale today is the marginal producer, managing the market rebalance
At current oil price levels many new initiatives are at risk
Price at 5th Aug 16
Forecast Price @2020
Source – elaboration on Goldman Sachs, June 2016 36

Average Wellhead Breakeven Oil Price For Horizontal Shale Wells
0
20
40
60
80
100
120
2012 2013 2014 2015 2016
USD
/bbl
EOG Resources
Devon Energy
Pioneer Natural Resources
Concho Resources
Cimarex Energy
Energen
Diamondback Energy
Source: Rystad Energy NASWell Cube Premium, April 2016
37

-
Unconventional Oil & Gas Outside North America Potentially significant in the long term
• Significant production from shale in this decade will be limited to Russia, Argentina, and China
• Production from shale and tight formations outside North America will represent ~ 3% of global supply in 2040 for both oil and gas
Source: IHS (July 2016) 38
4. Global Energy Outlook 2020

Total Population @ 2016: 7.403 Mln
3% 16%
8%
4%
55%
7% 7%
World Population Trend
∆ Population increase by Area 2016 vs 2021
(total ~ 404,7mln)
Middle East 22,1
Africa 154,8
Europe 6,2
Russia & Caspian Sea 2,7
Asia Pacific 172,5
North America 22,6
South America 23,9
2016 World Population Split by Area
Africa Population @ 2016: 1.212 mln Population @ 2021: 1.366 mln
CAGR 2013-2016: 2,6% CAGR 2017-2021: 2,4%
Russia and Caspian Population @ 2016: 287 mln Population @ 2021: 289 mln
CAGR 2013-2016: 0,3% CAGR 2017-2021: 0,2%
Middle East Population @ 2016: 244 mln Population @ 2021: 266 mln
CAGR 2013-2016: 1,9% CAGR 2017-2021: 1,7%
Europe Population @ 2016: 618 mln Population @ 2021: 624 mln
CAGR 2013-2016: 0,3% CAGR 2017-2021: 0,2%
North America Population @ 2016: 493 mln Population @ 2021: 515mln
CAGR 2013-2016: 0,9% CAGR 2017-2021: 0,9%
Asia Pacific Population @ 2016: 4.180 mln Population @ 2021: 4.389 mln
CAGR 2013-2016: 1% CAGR 2017-2021: 0,8%
South America Population @ 2016: 508 mln Population @ 2021: 532 mln
CAGR 2013-2016: 1% CAGR 2017-2021: 0,9%
=
Source - IHS Energy Rivalry Scenario – Summer 2016 40

Energy growth driven by world economy The energy mix is changing
Annual demand growth by fuel (Mln toe per annum)
Consumption by region (Bn toe)
Source - BP Energy Outlook-2016 *Includes biofuels
• Consumption driven by China and Asia. OECD almost flat • Coal offset by renewables, stable hydrocarbons, with gas growing more than others
41

Natural Gas Market: more and more attracting the Majors
42

MAIN TAKE AWAYS (outlook to 2020)
Average growth of world GDP ~ 3% per year…
…sustains recovery of energy demand…
…which together with spare capacity reduction…
…triggers a humble oil price increase…
However cheap shale abundance and slow down in energy demand may be an hurdle for price recovery
With the current price trends many initiatives (especially the most costly such as deep water) are still at risk
Oil Companies focus on more cooperation in the supply chain and new technologies in order to bring costs down
Long term drivers for O&G are still solid, but environmental issues and increasing efficiency of alternative sources trigger the need to evaluate alternative scenarios for the long term
43

-
Sources – IEA, Rystad Energy, Morgan Stanley Research June 2016
… and excessive delay in investments could be a trigger for an oil price shock
… Meanwhile depletion requires new investments even to maintain production
Mb
/d
44

5. Global Energy Outlook 2040
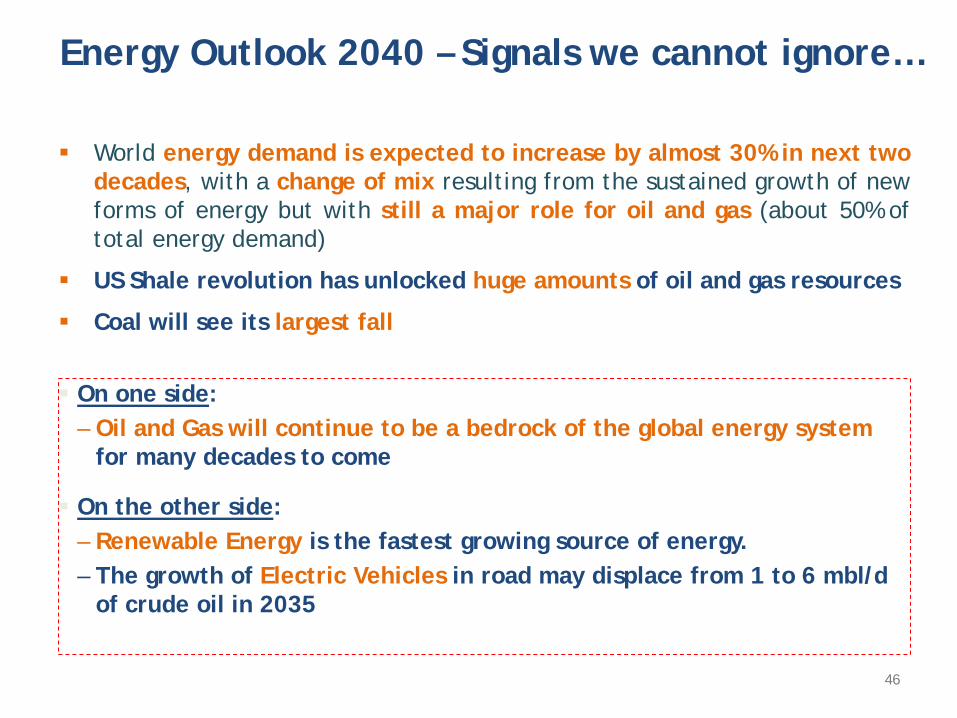
On one side: – Oil and Gas will continue to be a bedrock of the global energy system
for many decades to come
On the other side: – Renewable Energy is the fastest growing source of energy. – The growth of Electric Vehicles in road may displace from 1 to 6 mbl/d
of crude oil in 2035
World energy demand is expected to increase by almost 30% in next two decades, with a change of mix resulting from the sustained growth of new forms of energy but with still a major role for oil and gas (about 50% of total energy demand)
US Shale revolution has unlocked huge amounts of oil and gas resources
Coal will see its largest fall
Energy Outlook 2040 – Signals we cannot ignore…
46

0
5
10
15
20
2016 2020 2030 2040
Bn T
oe
Biofuels and OtherRenewablesHydro, Solar andWind PowerNuclear Power
Natural Gas
Oil
Solid Fuels
0,0
0,5
1,0
1,5
2,0
Solid Fuels Oil Natural Gas NuclearPower
Hydro,Solar and
Wind Power
Biofuelsand Other
Renewables
Bn T
oe
Source - IHS Energy Rivalry Scenario – Summer 2016
54% 7,5 Bn Toe
53% 9,8 Bn Toe +30%
+ 2,3 Bn Toe
2016 14,0 Bn Toe
2040 18,3 Bn Toe
World Energy Requirement 2016-40 (+ 4,3 Bn Toe)
Notes Oil consumption includes international marine/aviation bunkers; does not include biofuels, which at the primary energy level are not associated with petroleum. Coal includes steam and coking coal. Renewables include solar, wind, geothermal, and tide/wave/ocean energy.
In the base scenario, no revolutions are expected:
fossils still satisfy most of energy demand by far.
In absolute terms, natural gas is the most growing
source, replacing the role of coal
The current base scenario Fossil fuels dominating the energy mix in the long term
World Energy Trend 2016-40
47

Savings in every source, less in oil & gas…
Each source is undertaking a process of improvement and new sources are better positioned than O&G (also due to different level of maturity)
Source: IEA, World Energy Outlook 2015 48

0
2
4
6
8
10
12
14
16
18
20
2016 2040 Base 2040 Pessimistic
Bn T
oe
Oil Natural gas Coal Hydro Nuclear Renewables
Source - IHS Energy – Summer 2016
Very strong expansion of environmental policies and actions – The Paris COP21 Agreement results in greater-than-expected success in countries
meeting their targets and expanding their goals further
Weaker global energy demand – Driven by weaker economic growth over the near term and stronger environmental
policy, efficiency, and changing consumer behavior over the longer term
Stronger renewables technology and cost advances – Driven by very strong environmental policies and rising commercial “pull” from the
power sector
Stronger battery technology and cost advances – Driven by very strong environmental policies and rising commercial “pull” from the
automotive and power sectors.
Stronger integrated solar photovoltaics (PV)/battery installations (mainly in developing economies)
– Micro grid development in Africa, rural India, and other unconnected parts of the world.
– Grid-integrated development in urban areas of emerging markets
Stronger electric vehicle (EV) penetration and expansion – Driven by policy support, tech advances, cost improvement, and commercial “pull”
from evolving transport sector (car sharing, autonomous vehicles, etc.)
Mixed success of natural gas – Cheap/abundant gas that is also supported by environmental and energy security
policy outpaces coal in India, China, and parts of SE Asia – Growth in gas use suffers in some places due to inroads by cheap renewables and
grid-scale battery storage
Falling carbon dioxide (CO2) emissions (as a result of all of the above)
– 2040 levels remain above the 2 degrees Celsius (°C) target
But alternative scenarios tell a different story Change in demand pattern may be mainly driven by: • ongoing social and political concerns over the environment (also in China & India)
• combined with improvement in technology and costs for renewable energy and batteries: cheaper to be clean
49
-
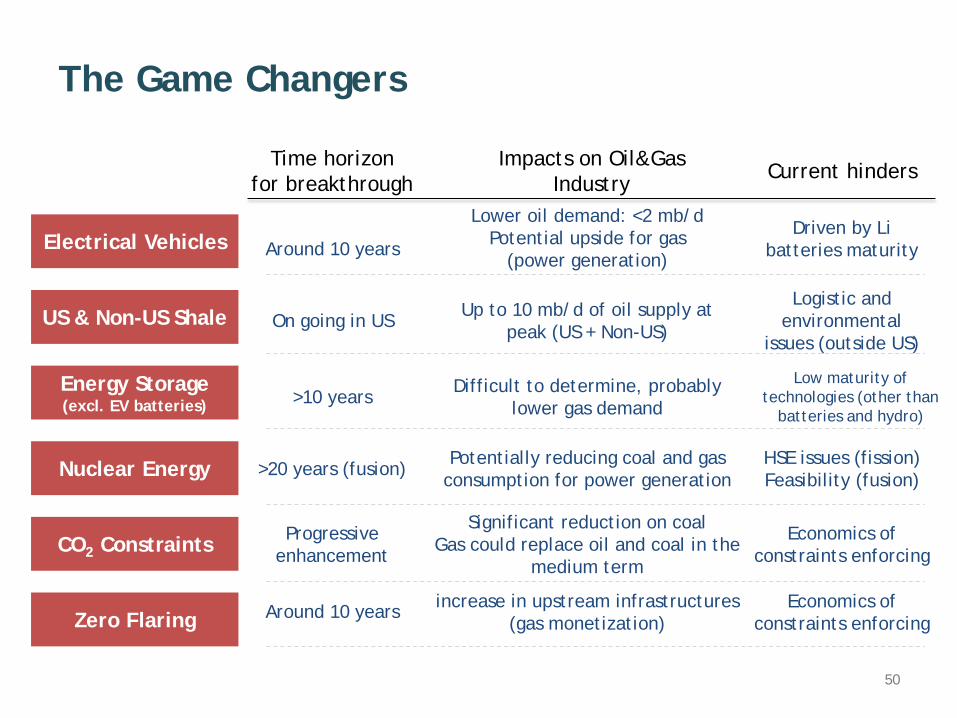
The Game Changers
Electrical Vehicles
US & Non-US Shale
Energy Storage (excl. EV batteries)
Nuclear Energy
CO2 Constraints
Zero Flaring
Current hinders Time horizon for breakthrough
Impacts on Oil&Gas Industry
Driven by Li batteries maturity Around 10 years
Lower oil demand: <2 mb/d Potential upside for gas
(power generation)
Logistic and environmental
issues (outside US) On going in US Up to 10 mb/d of oil supply at
peak (US + Non-US)
Low maturity of technologies (other than
batteries and hydro) >10 years Difficult to determine, probably
lower gas demand
HSE issues (fission) Feasibility (fusion) >20 years (fusion) Potentially reducing coal and gas
consumption for power generation
Economics of constraints enforcing
Progressive enhancement
Significant reduction on coal Gas could replace oil and coal in the
medium term
Around 10 years increase in upstream infrastructures (gas monetization)
Economics of constraints enforcing
50

Oil demand and electric vehicles

3% 58%
16% 5%
6%
12%
In the long term Transport continue to tow oil Light Duty Vehicles (LDV*) will be responsible for just a part of the future demand
Source: WEO (Nov. 2015), IHS, Bloomberg, NE
6% 55%
13% 5% 8%
13%
Power Generation
Transport
Petrochemicals
Other Industry
Buildings
Other
*LDV: passengers cars, light trucks, SUVs and minivans
Non-LDV includes all other ways of transport: heavy-duty, aviation, naval,…
World oil demand by sector
Transport: +8 mln b/d
Petrochem: +4 mln b/d
2014 2030
Oil demand will be driven by transport (+8 mln b/d) and
petrochemical (+4 mln b/d) sectors up to 2030
Almost all growth is due to non-OECD countries
Demand growth prospects for both aviation and commercial
trucks look extremely strong, driven mainly by non-OECD
markets, and breakthrough changes in these areas look far
less clear-cut.
Aggregate chemicals demand growth of ~50% by 2040e looks
quite feasible
856
1.085 1.212
0,5 10 105
2010 2020 2030
Conventional LDV EV
LDV: 26 mln b/d
Non-LDV: 23 mln b/d LDV:
28 mln b/d
Non-LDV: 29 mln b/d
Oil displaced: around 2 mln b/d
49 mln b/d
57 mln b/d
TRANSPORT
52

Key on-road fuel demand drivers that will impact future demand
IHS Energy Scenarios to 2040 / July 2016
Automotive fuel demand drivers that impact future demand
© 2016 IHS; 60629-3 Source: IHS
53

Even with low oil prices, other factors point toward greater electrification and new urban mobility options
IHS Energy Scenarios to 2040 / July 2016
Source: IHS Energy © 2016 IHS
Factors moving the market toward greater electrification and new urban mobility options
54
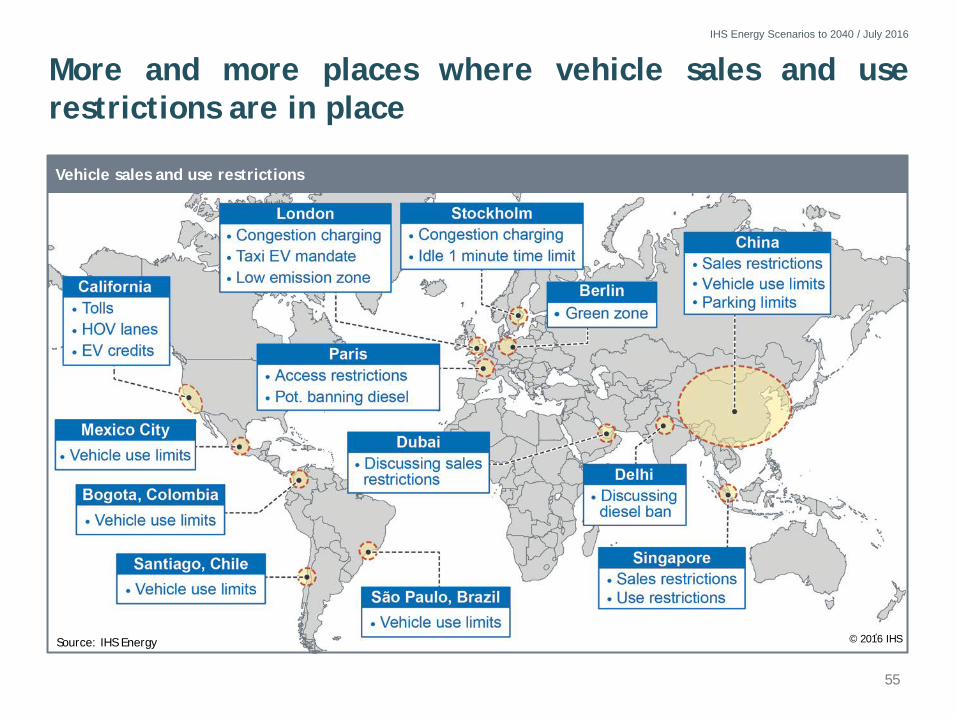
More and more places where vehicle sales and use restrictions are in place
IHS Energy Scenarios to 2040 / July 2016
Source: IHS Energy © 2016 IHS
Vehicle sales and use restrictions
55

Urbanization is not a new trend, but have we reached a point where it is increasingly disruptive to transport behavior?
IHS Energy Scenarios to 2040 / July 2016
Beijing bus stop during rush hour
Source: IHS
Source: Shutterstock with permission
Urbanization rates
Country 2015 2025
United States 83% 87%
Europe 77% 82%
China 52% 71%
Source: IHS © 2016 IHS
Congestion creates economic and environmental problems.
Cities today are already plagued with congestion and
are exploring ways to improve mobility at the city level.
© 2016 IHS
© 2016 IHS
56

The amount of oil displaced by electric cars will depend on when vehicles take off
Gasoline
Flex fuel Diesel
Bloomberg
After 2030
57

58
6. Impacts on O&G Industry – Role of Technology Innovation
59
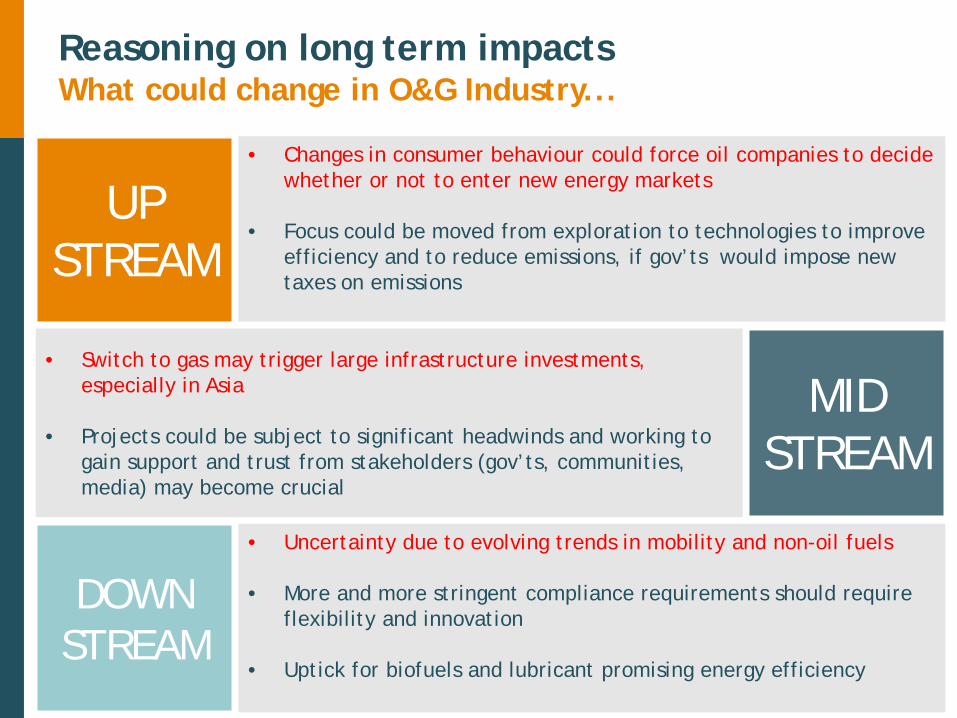
Reasoning on long term impacts What could change in O&G Industry...
UP STREAM
• Changes in consumer behaviour could force oil companies to decide whether or not to enter new energy markets
• Focus could be moved from exploration to technologies to improve efficiency and to reduce emissions, if gov’ts would impose new taxes on emissions
MID STREAM
• Switch to gas may trigger large infrastructure investments, especially in Asia
• Projects could be subject to significant headwinds and working to gain support and trust from stakeholders (gov’ts, communities, media) may become crucial
Large consuming nations, such as Asia, will drive midstream investments But new midstream projects such as pipelines and LNG terminals may face
significant headwinds, either from stricter government regulations or consumer objections to fossil fuel projects.
Working to gain trust and support from governments, local communities and the media will be an important prerequisite to any investments.
DOWN STREAM
• Uncertainty due to evolving trends in mobility and non-oil fuels
• More and more stringent compliance requirements should require flexibility and innovation
• Uptick for biofuels and lubricant promising energy efficiency

60
Reasoning on long term impacts ... and what in Oilfield Service Companies
BUSINESS MODEL AND STRATEGIES
• Following traditional clients potential revolutions, OFS companies may consider changing their business mode
• Potential reuse in new energy markets of traditional strength of OFS players (manage risks in complex projects)
• Opportunity for innovating OFS to drive standardisation and innovation across the sector
TECHNOLOGIES AND MARKETS
• Traditional technologies and relevant assets could be made obsolete or useless in the long term by new materials (e.g. composite pipes) or new concepts (subsea factory) or by saturation of deployed infrastructures
• Carbon constraining regulation should provide impetus to newer technologies
OILFIELD SERVICES

61
7. A few examples of technology innovations in Saipem

62
Pipelayer
LNG Carrier
FSRU
Drill Ship
Regasification LNG
Plant Petrochemicals
Refinery
Power Drilling Rig
Plant Gas Liquefaction
Station Compressor
Production Oil & Gas
Gas-to-Solids
Pipelaying
Yard
Repair System Sircos - Pipeline
Trenching Machine Beluga - Deepwater
Remotely Operated Vehicle ROV
Pipelay Vessel Semisubmersible
FPSO
Field Development Ship
Drilling Rig Semisubmersible
Vessel Subsea Construction
Heavylift
Operating in more than 60 countries
~ 37,000 employees from >120 nationalities
More than 20 engineering and project execution centers worldwide
9 fabrication yards in 5 continents
REVENUES 2015 11.5 B€
2016 ≃10.0 B€
BACKLOG March 31, 2017 12.5 B€
(*) Source: 1Q 2017 Results Presentation
Saipem is a global leader in the field of O&G services, by realizing complex projects of Engineering & Construction
63
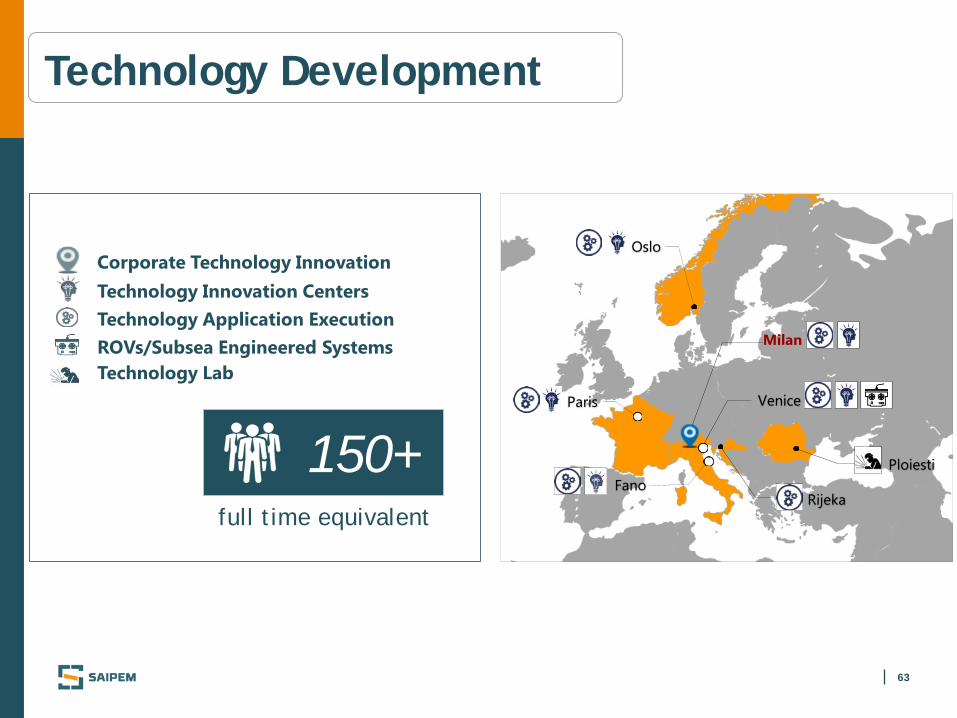
Technology Development
Technology Lab
Technology Application Execution
Corporate Technology Innovation
ROVs/Subsea Engineered Systems
Technology Innovation Centers
Milan
Paris
Oslo
Ploiesti
Venice
Rijeka Fano
full time equivalent
150+

64
Saipem’s history based on a strong propensity to innovate A few very recent achievements
Qualified the Electrical Heat Traced Pipe-in-Pipe technology for rigid J-Lay installation, that extends the application of the most efficient active heating method to larger diameter risers and flowlines, for even longer tie-back lines.
Installed the largest, deepest & heaviest Free-Standing Hybrid Riser, with the longest and heaviest Buoyancy Tank ever built.
Snamprogetti™ SuperCups technology qualified in a long-run demo test in an Urea plant in Pakistan, increasing production yield, lowering steam's specific consumption and emission of greenhouse gases.
SPRINGS® technology is moving forward, thanks to the cooperation with Total and Veolia, aimed to the industrialization of a subsea water treatment plant capable to remove the sulphates from seawater, before being injected in the reservoir.
Delivered the first prototypes of the Innovator 2.0 the new generation high power, work class ROV developed and manufactured by Sonsub.
Internal Plasma Welding technology successfully used on Kashagan field, to enhance productivity and reduce the cost of quality in welding clad and carbon steel sealines.
Progressing the development and industrialization of Hydrone, the subsea platform composed by an advanced AUV, a resident hybrid ROV/AUV and a work class, temporary resident ROV, now fully defined and proposed to Clients.
64


