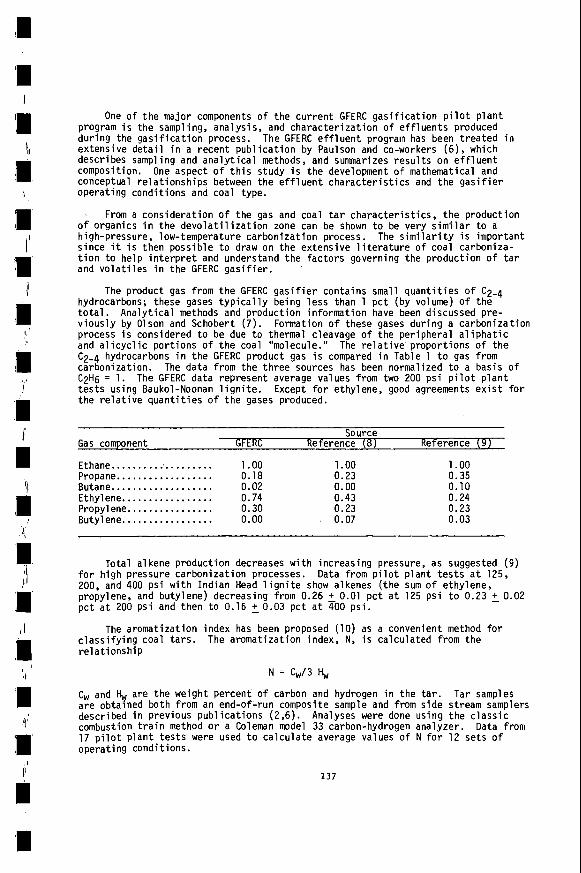
FOSSIL FUEL ECONOMICS Christian W. Knudsen Paul 0. Hedman Office of Engineering, Economics and Standards Fossil Energy U.S. Department of Energy Washington, D.C. 20545 College of Engineering Sciences and Technology Brigham Young University Provo, Utah ABSTRACT A large number of fossil energy processes are now in various stages of research and development around the world to produce substitute fuels for conventional oil and gas. of the development process to guide R&D to the most promising processes and to place experimental emphasis on technical problems of greatest priority. Types of design and cost estimation are described as well as the uncertainties involved in the re- sulting estimates as they depend on data quality and the level of estimate detail. Project and process contingencies are given which have been found to be appropriate to account for the expected underestimation. Cost evaluations are described for coal gasification processes taken from the recent C.F. Braun & Co. report which compares new process developments with commer- cial Lurgi coal gasification. Costs of approximately $5 per million Btu are indi- cated. of development are discussed. Liquid product costs are indicated between about $3.50 and $5.00 per million Btu. term new and retrofitted plants as well as the longer range potential of combined cycle technology. Process design and cost estimation of new processes is an invaluable part Coal liquefaction costs for processes currently at the pilot plant stage Power g e n e r a t i o n is examined on the basis of near- INTRODUCTION Preliminary design and cost estimating of fossil energy processes is the prin- cipal mans of determining the practical advantages and disadvantages that a given process has compared with others which produce similar products. The results of such comparisons are of particular importance to research and development. They not only indicate those processes which offer promise of technical and economic feasibility in a future market, but also those sections of a process flow scheme which should receive the greatest attention during further development. I t becomes quickly apparent that certain unit operations create the heaviest economic burdens on plant investment and product selling price. These areas then become prime tar- gets for innovative engineering. Successful process-related companies rely greatly on such process analysis to guide their development efforts and to point to new research projects. pay close attention as well since the royalty they will receive on a new patent will be negotiated as a portion of the savings created relative to the next best alter- native. U.S. Government research and development activities in fossil energy have grown beyond $500 million annually and decisions about program and project direction are strongly influenced by process analyses. Inventors 1
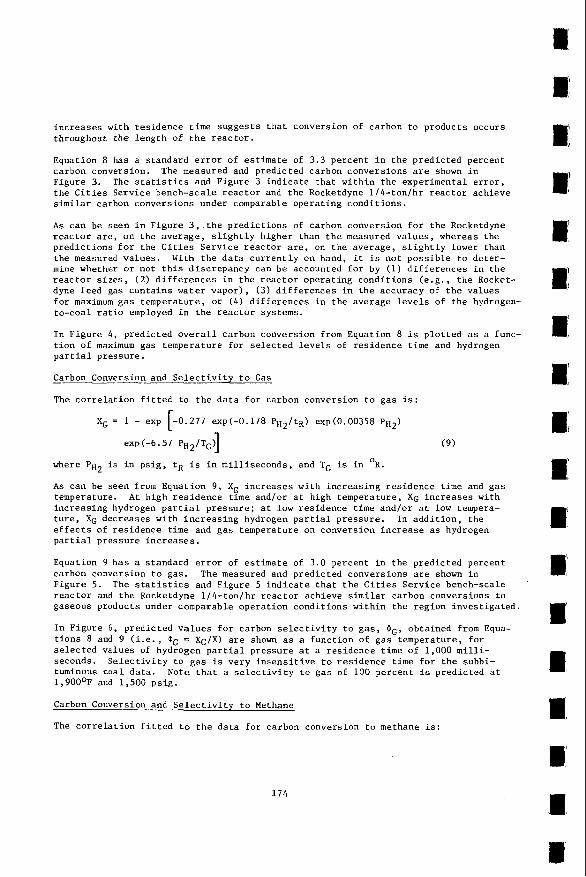
Transcript
FOSSIL FUEL ECONOMICS
Christian W . Knudsen Paul 0. Hedman
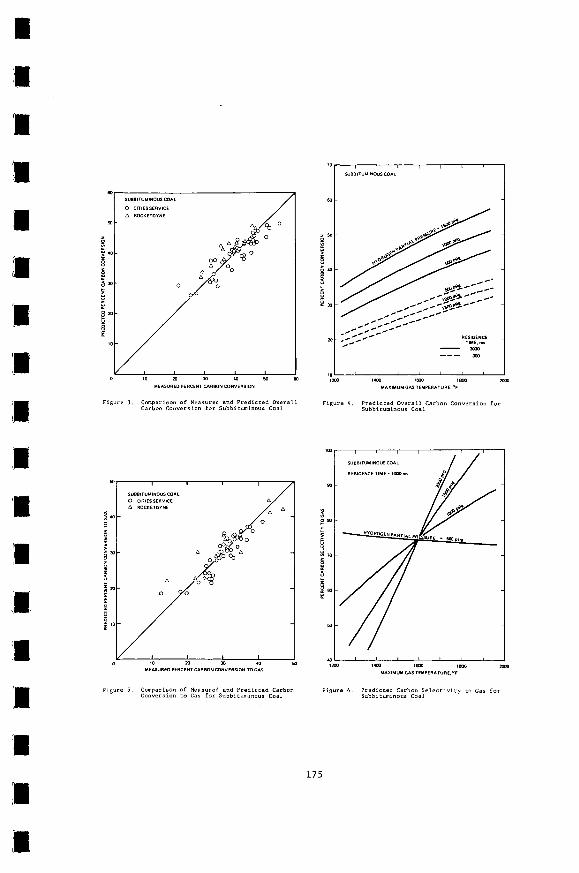
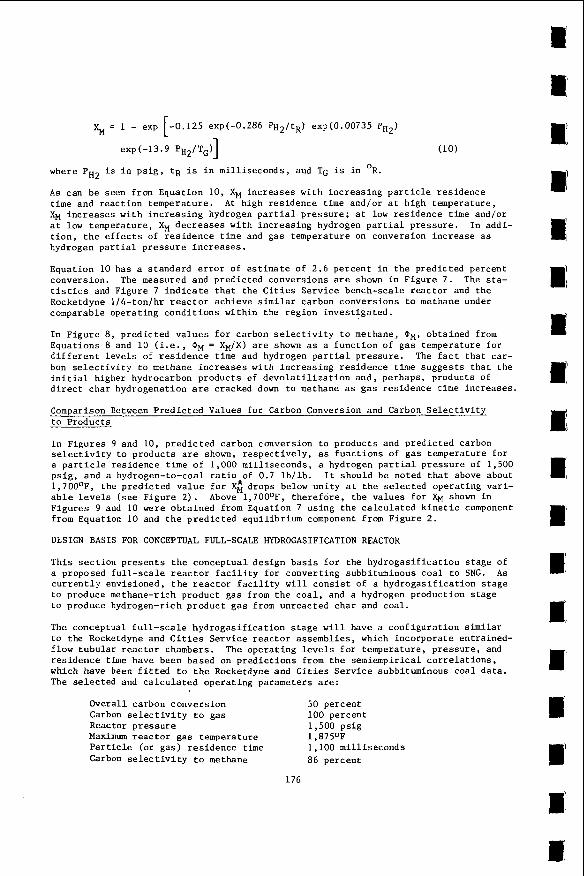
Office of Engineering, Economics and Standards Fossil Energy
U.S. Department of Energy Washington, D . C . 20545
College of Engineering Sciences and Technology Brigham Young University
Provo, Utah
ABSTRACT
A large number of fos s i l energy processes a re now in various s tages of research and development around the world to produce subs t i t u t e fue ls f o r conventional o i l and gas. of the development process t o guide R&D t o the most promising processes and t o place experimental emphasis on technical problems o f g rea tes t p r ior i ty . Types of design and cost estimation a re described as well as the uncertainties involved in the re- su l t ing estimates as they depend on data qua l i ty and the level of estimate d e t a i l . Project and process contingencies a r e given which have been found to be appropriate t o account for the expected underestimation.
Cost evaluations are described fo r coal gas i f ica t ion processes taken from the recent C.F. Braun & Co. repor t which compares new process developments with commer- c ia l Lurgi coal gas i f ica t ion . Costs of approximately $5 per mill ion B t u a r e i n d i - cated. of development a re discussed. L i q u i d product costs a re indicated between about $3.50 and $5.00 per mill ion B t u . term new and r e t r o f i t t e d plants as well as the longer range potential of combined cycle technology.
Process design and cos t estimation of new processes i s an invaluable part
Coal l iquefaction costs for processes cur ren t ly a t the p i l o t plant stage
Power generation i s examined on the bas i s of near-
INTRODUCTION
Preliminary design and cost estimating of fo s s i l energy processes i s the prin- cipal mans of determining the prac t ica l advantages and disadvantages t h a t a given process has compared with others which produce s imi la r products. The r e su l t s of such comparisons a re of par t icu lar importance t o research and development. They not only indicate those processes which o f fe r promise of technical and economic f eas ib i l i t y in a fu ture market, but a l so those sections of a process flow scheme which should receive the g rea t e s t a t t en t ion during fur ther development. I t becomes quickly apparent t h a t cer ta in u n i t operations c rea te the heaviest economic burdens on plant investment and product s e l l i ng price. These areas then become prime tar- gets for innovative engineering.
Successful process-related companies re ly grea t ly on such process analysis t o guide the i r development e f fo r t s and t o point t o new research projects. pay close a t ten t ion as well s ince the royalty they will receive on a new patent will be negotiated as a portion of the savings created r e l a t ive to the next best a l t e r - native.
U.S. Government research and development a c t i v i t i e s in fos s i l energy have grown beyond $500 mill ion annually and decisions about program and pro jec t direction a re strongly influenced by process analyses.
Inventors
1
PROCESS DEVELOPMENT AND ANALYSIS
New heavy- indust ry process development i s an expensive and r i s k y e n t e r p r i s e u s u a l l y conducted by l a r g e companies and governments, sometimes i n j o i n t venture. The 15 t o 20 y e a r development t ime t o f i r s t c o m e r c i a l i z a t i o n which has been e s t i - mated fo r new coa l convers ion processes, f o r example, p r a c t i c a l l y mandates govern- ment- indust ry c o s t sha r ing .
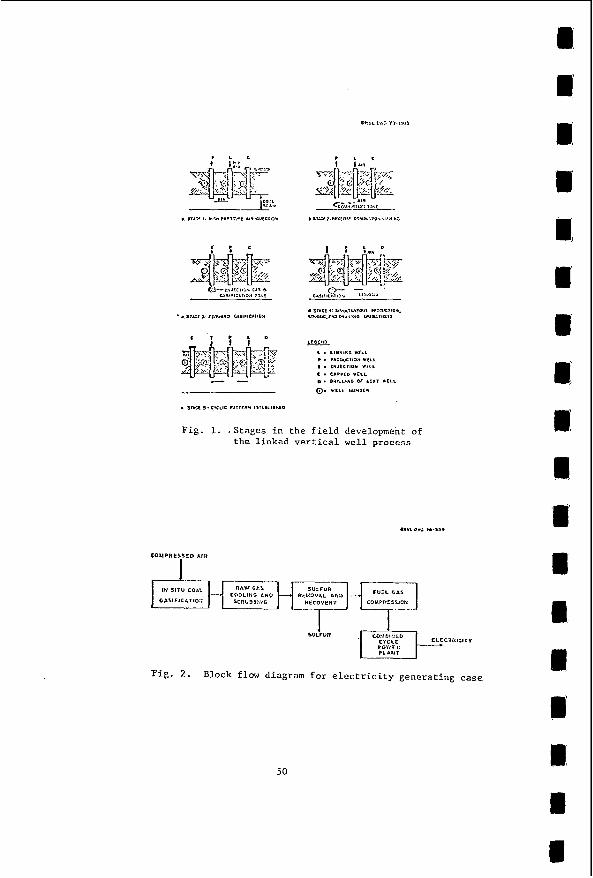
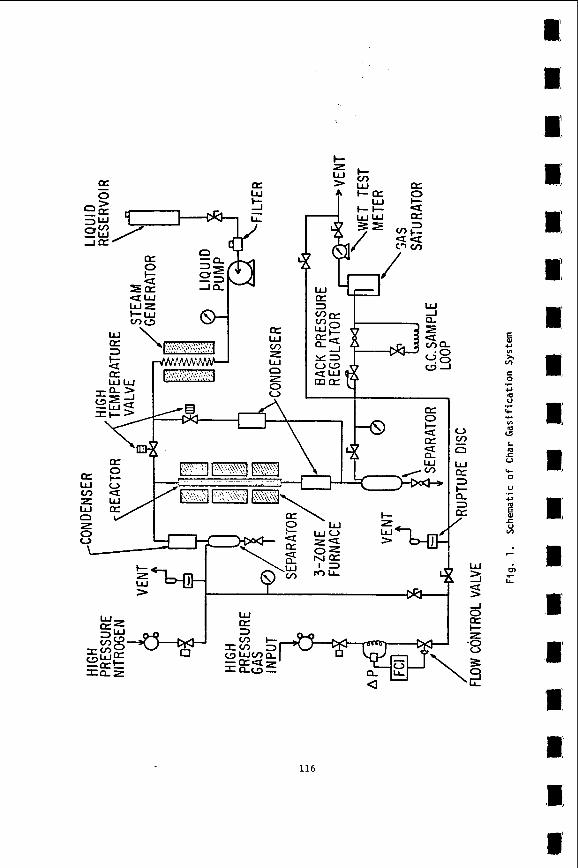
development o f new coa l convers ion processes i s i l l u s t r a t e d by F igu re 1. It repre- sents a l o g i c a l developmental sequence f o r a h y p o t h e t i c a l case. A l though no speci - f i c case would n e c e s s a r i l y f o l l o w t h i s example c l o s e l y , perhaps t h e composite o f a number o f cases would be reasonably c lose .
The example i n d i c a t e s t h a t a f t e r conceptual work, e x p l o r a t o r y research f o l l o w s t o t e s t s c i e n t i f i c f e a s i b i l i t y i n a u n i t capable o f about one t o n o f d a i l y coa l throughput . Over a p e r i o d o f one t o f o u r yea rs f o r t h i s phase, $10 m i l l i o n o r more may be consumed. Next, a process development u n i t (PDU) i s shown t o ga the r t h e necessary phys i ca l , chemical and engineer ing data. About f i v e years and $20 t o $30 m i l l i o n i s r e q u i r e d f o r t h i s phase. phase o f development and r e q u i r e s about seven years t o complete. a 100 ton per day p l a n t may approach $100 m i l l i o n . F i n a l l y , t he l a s t two stages shown by F igure 1 r e p r e s e n t success i ve l y l a r g e r commercial p ro to type p l a n t s i n f i n - a l p repara t i on f o r a f u l l - s i z e d 50,000 b a r r e l p e r day p l a n t ( o r i t s thermal equiva- l e n t i f the product i s o t h e r than o i l ) . Th i s development scheme i s admi t ted l y con- s e r v a t i v e and perhaps f o r some cases t h e e x p l o r a t o r y research and PDU phases cou ld be combined. L i kew ise t h e p i l o t p l a n t and demonstrat ion p l a n t phases might be accomplished j o i n t l y by a p l a n t s i z e o f severa l hundred tons pe r day capaci ty . Nevertheless, t h e t ime t o reach comnerc ia l i za t i on would s t i l l be a lmost 1 5 y e a r s .
Guiding process development by des ign and c o s t engineer ing ana lys i s i s ve ry impor tan t , b u t compl icated by t h e need t o compare es t ima tes taken f rom va r ious sources. Engineering des ign and c o s t e s t i m a t i n g procedures and da ta w i l l d i f f e r somewhat when d i f f e r e n t process groups have been invo lved . Any s i g n i f i c a n t d i f f e r - ences u s u a l l y can be r e s o l v e d when t h e ' m a t e r i a l i s w e l l documented. However, two o t h e r f a c t o r s must be considered when two o r more es t ima tes a r e t o be compared. The f i r s t concerns t h e degree o f engineer ing e f f o r t expended i n t h e des ign and c o s t i n g o f each est imate. r a t e than t h a t t aken from sma l le r u n i t s such as PDU-sized e q u i m e n t . The second concerns the q u a l i t y o r r e l i a b i l i t y o f the data be ing used f o r t h e des ign. from t h e demonstrat ion o r commercial development phase i s obv ious l y more accurate than t h a t taken f rom s m a l l e r u n i t s such as PDU-sized equipment.
p r o j e c t and process cont ingencies. These a re al lowances t o account f o r d i f f e r e n c e s i n t h e l e v e l o f eng inee r ing e f f o r t and i n data r e l i a b i l i t y , respec t i ve l y . Appl ica- t i o n of these con t ingenc ies ad jus ts an est imate t o a va lue e q u i v a l e n t t o t h e com- p l e t i o n of development when f u l l da ta i s a v a i l a b l e f o r a l l sec t i ons o f t h e p l a n t and an accurate d e t a i l e d es t ima te can be made.
process est imates i n t h e F o s s i l Energy Procyam, U.S. Department o f Energy, a r e shown i n F igure 2. The process cont ingency i s c a l c u l a t e d as a percentage o f t h e o n s i t e p o r t i o n of t h e p l a n t and represents t h e a d d i t i o n a l investment necessary t o improve o r expand process equipment t o reach des ign c o n d i t i o n s , s i n c e data taken w h i l e developing a process tend t o be o o t i m i s t i c . P r o j e c t cont ingency i s ca lcu- l a t e d as a percentage of t h e t o t a l o n s i t e ( i n c l u d i n g process cont ingency) and o f f - s i t e investment and i s t hen added t o o b t a i n t h e f i n a l investment. It al lows f o r e r r o r s i n cost e s t i m a t i n g due t o des ign assumptions, l a b o r p r o d u c t i v i t y and r a t e assumptions, l a t e d e l i v e r y o f c o n s t r u c t i o n m a t e r i a l s , and t h e l i k e . Therefore, i t
An example of l i b e r a l government cos t sha r ing w i t h i n d u s t r y t o induce s teady
A l a r g e p i l o t p l a n t i s t y p i c a l l y t h e nex t P r o j e c t cos t for
Greater engineer ing e f f o r t g e n e r a l l y produces more accu-
Data
These t w o sources o f i ncons is tenc ies i n es t ima tes can be reso lved by means o f
P r o j e c t and process con t ingenc ies which a r e be ing used t o compare and r e s o l v e
2
r e f l e c t s o n l y t h e u n c e r t a i n t y o f c o n s t r u c t i n g a g i ven p l a n t f o r a g i v e n c o s t and does n o t depend on the u n c e r t a i n t y o f t h e t e c h n i c a l data. I t does depend on t h e type O f es t ima te made as shown i n t h e f i g u r e . i n g these est imates f o r a 50,000 b a r r e l pe r day coa l convers ion o l a n t a r e g i ven i n parentheses.
U.S. process ing f i r m s over t h e l a s t two years and a r e based on t h e i r process develop- ment and p l a n t c o n s t r u c t i o n experience. Corporat ion.
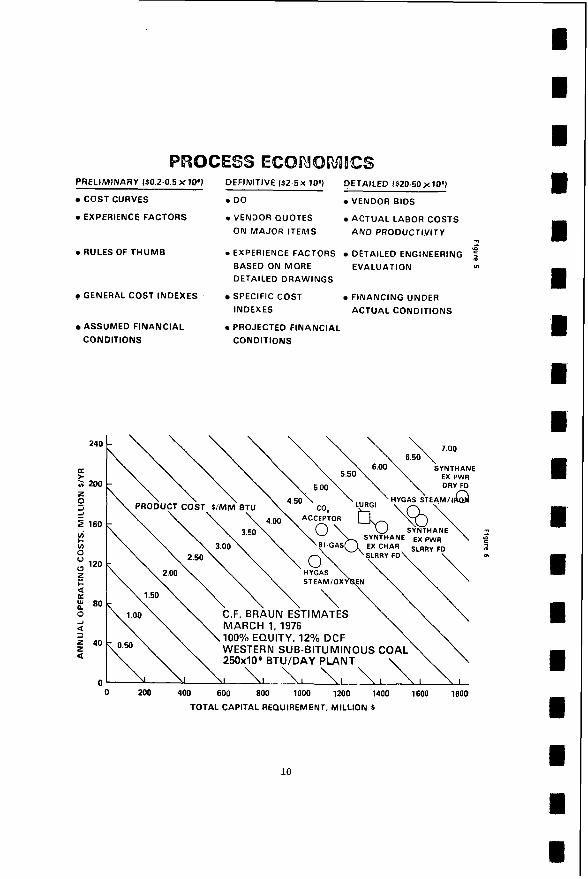
A b e t t e r understanding o f va r ious l e v e l s o f c o s t est imates and the accuracy which can be expected from them can be gained by cons ide r ing F igures 3, 4 and 5. Together these f i g u r e s desc r ibe t h e bas i c d i f f e r e n c e s between p r e l i m i n a r y , d e f i n i - t i v e and d e t a i l e d est imates.
Typ ica l engineer ing cos ts of produc-
The cont ingency f i g u r e s shown i n F igu re 2 r e s u l t e d from discuss ions w i t h l a r g e
Major c o n t r i b u t i o n was rece ived from Exxon
The f i r s t s t e p i n developing an es t ima te i s s e t t i n g t h e des ign bas i s . t h ree est imate types r e q u i r e t h e same t yoe o f des ign bas i s i n fo rma t ion , w i t h t h e except ion t h a t t he s i t e s p e c i f i c a t i o n f o r t h e t h r e e d i f f e r s . For example, a de- t a i l e d des ign i n c l u d i n g d e t a i l e d mechanical drawings r e q u i r e s s p e c i f i c a t i o n o f an ac tua l s i t e and co re d r i l l i n g s may be necessary t o determine founda t ion design.
The next s tep i n process e s t i m a t i n g i s t h e process des ign i t s e l f (F iqu re 4) . D i f ferences i n es t ima te accuracy a r e most obvious from c o n s i d e r a t i o n o f t h e va ry ing e f f o r t s expended i n t h i s s tep. equipment l i s t , w h i l e i n a d e f i n i t i v e des ign d e t a i l e d s p e c i f i c a t i o n s a re prepared, i n c l u d i n g p i p i n g and ins t rumen ta t i on s p e c i f i c a t i o n s . Th is a d d i t i o n a l i n fo rma t ion requ i res a g r e a t deal more engineer ing e f f o r t t o develop, b u t i t i s impor tan t t o accuracy s ince process p l a n t s c o n t a i n p i p i n g and ins t rumen ta t i on t h a t may represent up t o 40 percent o f t h e p l a n t c a p i t a l investment. A d e t a i l e d des ign i nc ludes t h e l a t t e r elements p lus d e t a i l e d engineer ing drawings and p lans which may r e q u i r e hundreds o f thousands o f man-hours t o produce, O f course, t h i s e f f o r t i s app rop r i - a t e on l y when a c t u a l c o n s t r u c t i o n i s planned.
For p r e l i m i n a r y estimates, cos t curves, experience f a c t o r s , and r u l e s o f thumb a r e used, whereas f o r a d e f i n i - t i v e estimate, a more d e t a i l e d e s t i m a t i n g procedure i s requ i red . s p e c i f i c cos t indexes, and p r o j e c t e d f i n a n c i a l c o n d i t i o n s a r e approp r ia te . d e t a i l e d study, one seeks vendor b ids , f inances under a c t u a l cond i t i ons , and s tud ies ac tua l l a b o r r a t e s and p r o d u c t i v i t y f o r t h e area i n ques t i on . Actual l abo r costs and p r o d u c t i v i t y a r e ext remely impor tan t f a c t o r s which a r e g e n e r a l l y over- looked. i n d i f f e r e n t p a r t s o f t h e Un i ted States and can have a l a r g e e f f e c t on t h e f i n a l p l a n t cost .
Reconsidering F igu re 2, i t i s c l e a r t h a t a f i n a l investment es t ima te v a r i e s a g rea t deal as a r e s u l t o f t h e cont ingencies aDDlied t o i t . Consider, f o r example, a coal l i q u e f a c t i o n p l a n t producing 50,000 b a r r e l s o f product o i l d a i l y . investment might be rough ly $750 m i l l i o n and o f f s i t e investment about $250 m i l l i o n . If these investments had been c a l c u l a t e d u s i n g data o f POU q u a l i t y by a p r e l i m i n a r y type o f est imate, process and p r o j e c t con t ingenc ies would be taken as 25 and 20 per- cent, r e s p e c t i v e l y . Apply ing these cont ingencies r e s u l t s i n a t o t a l investment est imate o f $1,425 m i l l i o n o r an increase o f about 43 pe rcen t above t h e investment base o f $1,000 m i l l i o n w i t h o u t cont ingencies.
COAL GASIFICATION ESTIMATES
A l l
I n a p r e l i m i n a r y des ign the e f f o r t ends w i t h an
The l a s t s tep i s t h e cos t e s t i m a t i n g process i t s e l f .
Vendor quotes, For a
The a v a i l a b i l i t y o f s k i l l e d craf tsmen and t h e s p e c i f i c s o f un ion r u l e s vary
Onsi te
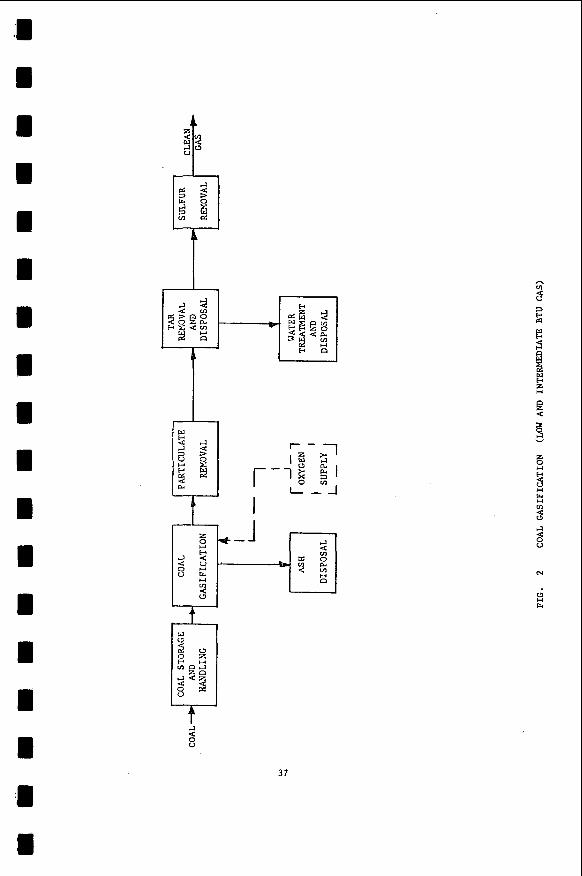
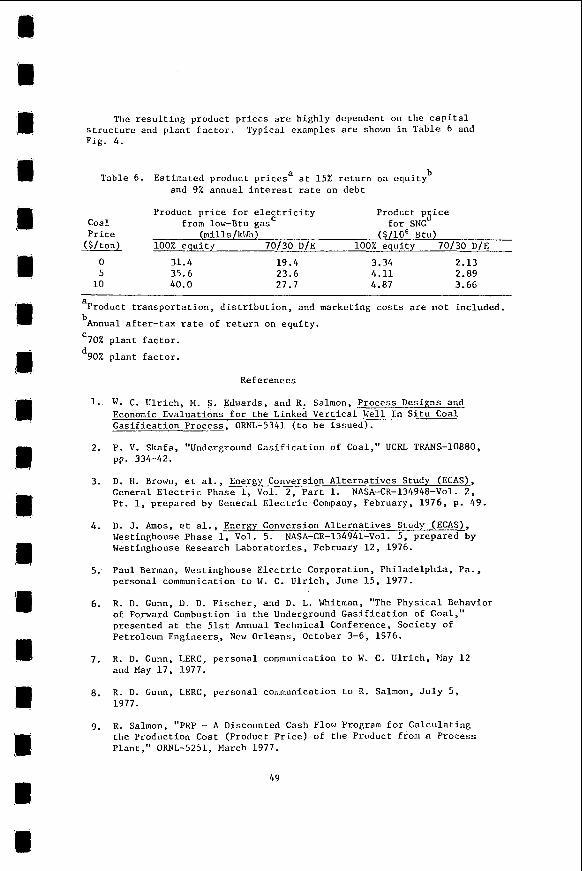
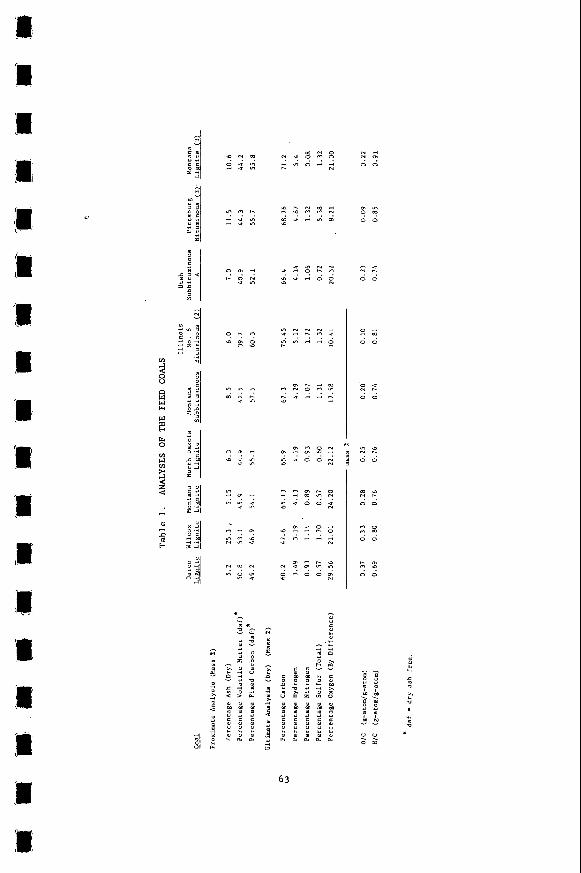
Consis tent cos t est imates f o r coal g a s i f i c a t i o n processes which a re now under development have been made by C.F. Braun & Co. us ing western U.S. subbituminous
3
coal with 250 mi l l ion standard cubic f e e t per day of subs t i t u t e natural gas pro- duction assumed as the standard p l a n t s i ze . The study examines the investments, operating cos t s , and the resu l t ing prices of the HYGAS, BI-GAS, C02 Acceptor and Synthane processes compared with s imi la r f igures f o r the presently-commercial Lurgi gas i f ica t ion technology. l i shed examines the same processes using eas te rn U.S. coals.
Braun f o r western coa l , assuming 100 percent equity financing, 1 2 percent discount- ed cash flow (DCF) r a t e of re turn , and 1976 constant do l l a r s . Braun used a 15 per- cent project contingency f o r a l l of these cases, but included no process contingen- c i e s i n the ons i te investments. Note t h a t product costs can be plotted as s t r a igh t l i n e s when annual operating cos ts a r e plotted against t o t a l cap i ta l requirement.
Another phase of the same study which will soon be pub-
Figure 6 i s a p lo t of product cos ts f o r the various processes calculated by
From the f igu re one sees tha t the HYGAS case with the residual char gas i f ied using a steam-oxygen g a s i f i e r appears to be the most a t t r a c t i v e process a t approxi- mately $4.25 per mill ion B t u of product cos t . The Lurgi process i s about $5.50 per mi l l ion B t u as i s the case f o r Synthane where excess char i s sold outside the p lan t and s lu r ry coal feeding t o the gas i f i e r s i s used. approach the low-cost HYGAS case. However, the HYGAS case w i t h residual char gas i f ied using a steam-iron g a s i f i e r i s l e s s a t t r a c t i v e t h a n LURGI, as are two Synthane cases which export e l ec t r i ca l power f o r s a l e ou ts ide the p lan t .
liminary study and the 15 percent project contingency used i s reasonable. no process contingencies were used t o r e f l e c t the d i f fe r ing data qua l i ty ava i lab le f o r the individual estimates. data except Lurgi, process contingencies of 15 t o 25 percent a r e indicated. value of f ive percent is su i t ab le f o r the Lurgi estimate. Application of these additional fac tors t o L u r g i and the three estimates on the f igure which a re lower cos t t h a n Lurgi narrows t h e i r cos t advantage over L u r g i by about 50 cents per mill ion B t u . T h i s has the r e s u l t t h a t only the HYGAS process re ta ins an apparent advantage over Lurgi technology. compared w i t h Lurgi technology.
BI-GAS and CO2 Acceptor
The type of cos t estimate performed by the Braun study i s equivalent to a pre- However,
Given the P D U and p i l o t data quali ty of a l l of the A
Other processes appear marginal o r higher cos t
COAL LIQUEFACTION ESTIMATES
A t present several coal 1 iquefaction processes a re under development. These include such processes a s Exxon Donor Solvent (EDS) , H-Coal, and Solvent Refined Coal (SRC). Each of these processes makes l iqu id fue ls w i t h d i f fe ren t physical properties. However, each of the processes has some f l e x i b i l i t y t o operate over a range between a heavier bo i le r fuel type o f primary product and a l i gh te r syn- t h e t i c crude primary product, depending on l iquefaction reac tor space velocity.
A recent paper by Gulf ( 2 ) concerning the SRC process operated t o produce a synthe t ic crude (although they view i t s best use as fuel t o a bo i l e r ) ind ica tes a pr ice of $3.21 per mill ion B t u assuming 100 percent equity financing, 1 2 percent DCF and 1976 constant do l la rs . no process contingency was applied. Including a 20 percent process contingency increases the cos t t o about $3.60 per mill ion B t u . This i s equivalent t o about $22 per barrel .
Preliminary estimates of other l iquefaction processes w i t h i n Fossil Energy ind ica te prices of $30 per barrel and grea te r when using this same economic basis t o produce a synthe t ic crude. mates have been made by d i f f e ren t concerns, i t i s not c l ea r whether these cos t differences are due to t rue process differences o r merely to design philosophy differences among the various firms involved. study.
A 20 percent pro jec t contingency i s included, b u t
However, since the various designs and cos t e s t i -
T h i s matter i s cur ren t ly under
4
POWER GENERATION ESTIMATES
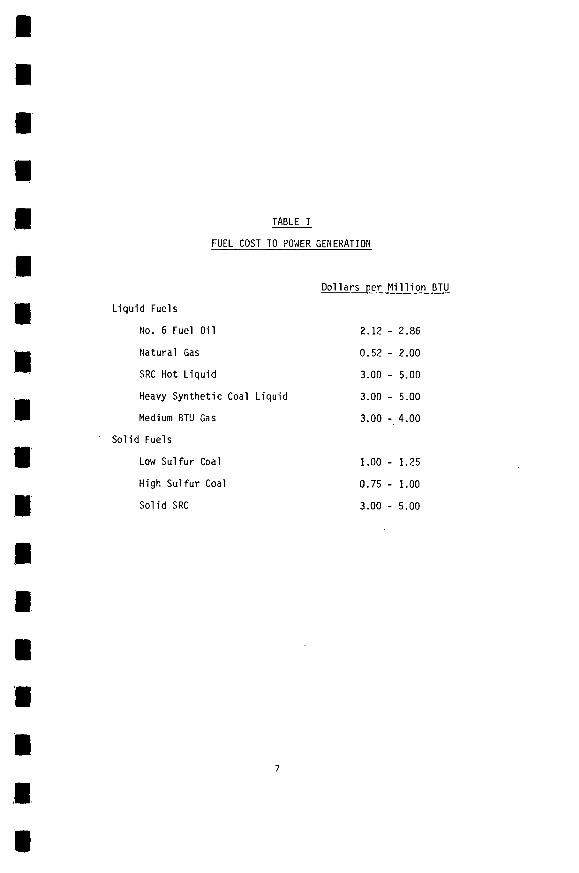
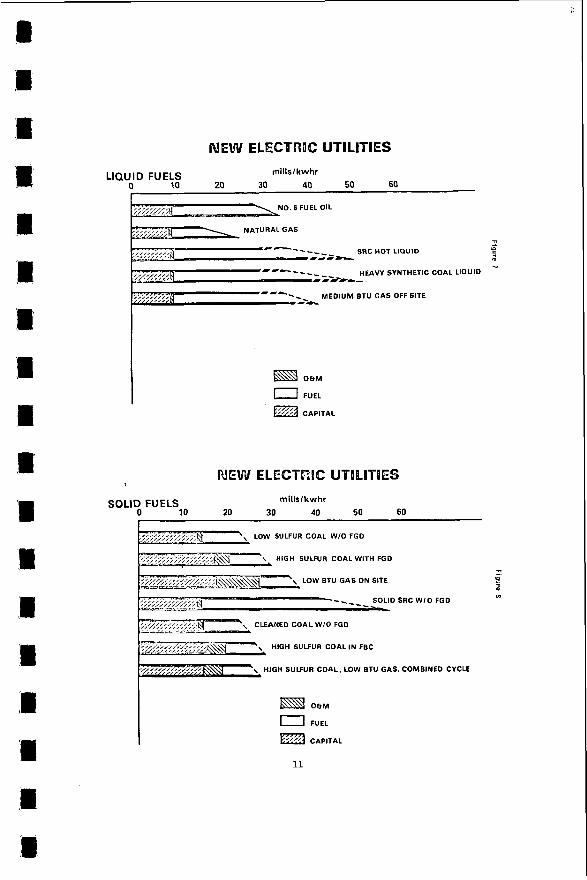
New e l e c t r i c generation f a c i l i t i e s can be based on a number of l iqu id and solid a l te rna t ive fos s i l fue l s . Figures 7 and 8 contrast var ious base load a l t e r - natives, showing the cap i t a l , operation and maintenance ( O & M ) , and fuel components Of to ta l cost expressed as mills per kilowatt-hour of power generated. Power costs were derived from recent work done by Gilbert Associates ( 3 ) which determined capi ta l and O&M costs f o r various a l te rna t ives . The fue l component was added t o these by choosing recent cost ranges f o r the basic fue ls used (Table I ) . An 800 megawatt e l e c t r i c plant s i z e operating a t 70 percent capacity fac tor i s assumed and the basis i s u t i l i t y economics equivalent t o a 10 percent DCF r a t e of return i n 1975 constant do l la rs . A 15 percent project continqency was used i n a l l cases w i t h no process contingency.
I n Figure 7 , the No. 6 fuel o i l case shows a var ia t ion i n power cost of 28 t o 33 mills per kilowatt-hour ( t h e variation in the fuel component of t h i s and a l l other cases represents the range shown i n Table I ) . The natural gas case i s l e s s , b u t t h i s fuel i s now i n scarce supply in the United S ta tes . SRC hot l iquid r e fe r s to the Solvent Refined Coal l iquefaction process operated so as t o make a heavy liquid product which would so l id i fy i f cooled. t he t i c coal l iquid both indicate a s ign i f icant cost increase compared to No. 6 fuel o i l . The dashed area i s added to emphasize the r e l a t ive uncertainty of these estimates. Finally, medium B t u gas made off s i t e and bought by the power plant a t the range shown by Table I is a l so r e l a t ive ly expensive. and O&M components f o r a l l of these l iquid cases a re subs tan t ia l ly the same a n d only the fuel components vary.
The so l id fuel cases shown i n Figure 8 show some in te res t ing var ia t ions . Low su l fur coal without f l u e gas desulfurization (FGD) i s very a t t r a c t i v e and compares favorably w i t h the use of n a t u r a l gas on the previous figure. The high su l fu r coal case with FGD i l l u s t r a t e s the f a c t tha t the additional cap i ta l and O&M components due t o the FGO equipment a re no to f f se t by the lower fuel cos t of high su l fur coal. Similarly, i n s t a l l a t ion and operation of an on s i t e low B t u gas p l an t using h i g h su l fur coal is n o t o f f s e t by the cheaper fue l .
These
This case and tha t f o r heavy syn-
Note t h a t the capi ta l
The so l id SRC case without FGD has the same low capital and O&M components a s the low su l fur coal case but the expensive fuel prices this a l t e rna t ive well above the others. low su l fur coal. F ina l ly , the two high su l fu r coal cases u s i n g f lu id ized bed com- bustion and a low B t u gas, combined cycle system b o t h look very competitive.
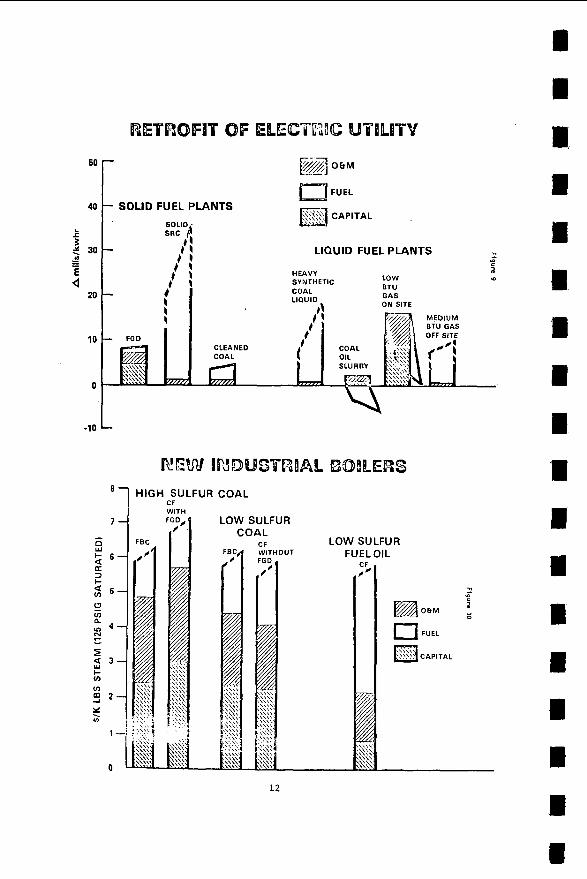
Retrofit of base load e l e c t r i c u t i l i t i e s i s i l l u s t r a t ed by Figure 9 using the same economic basis as before. Here the incremental cost of modifying so l id and l iquid fuel plants i s shown by the three cost components. FGD adds only about 10 mills per kilowatt-hour b u t so l id SRC adds over 20 mills. Among a l t e rna t ives f o r r e t ro f i t t i ng so l id fuel p lan ts , cleaned h i g h su l fu r coal adds the l e a s t o r about five mills. For l iqu id p lan ts , the heavy synthetic coal l iqu id and the medium B t u gas off s i t e cases add about 10 mills per kilowatt-hour o r more. The low B t u gas on s i t e case adds nothing because the savings in fuel cos t by using h i g h su l fu r coal to Generate the gas o f f se t s the capital a n d O&M components. case indicates a reduction, since the needed capi ta l and O&M a re not large and the savings i n No. 6 fuel o i l substi tuted by l e s s expensive low su l fu r coal more t h a n o f fse t s them.
The economics of steam generation by fluidized bed combustion (FBC) have recently been studied (4 ) . for both high and low su l fu r coa l ; conventional f i r i ng w i t h low s u l f u r fuel o i l i s shown f o r comparison. These cos ts show cap i t a l , Q&M and fue l components (see Table I ) calculated i n 1975 constant do l la rs a t a 10 percent DCF r a t e of return for
Next, cleaned high su l fur coal without FGD appears competitive w i t h
The coal oil s lur ry
Figure 10 cont ras t s FBC with conventional f i r i ng (CF)
5
a 100,000 pound per hour boiler;. cent project contingency was used.
f i r i ng with FGD. ever. o i l i s much less than the o the r cases. r e l a t ive ly higher cost of t h e fuel o i l .
No process contingency was assumed, b u t a 20 per-
For high su l fu r coa l , t h e FBC case i s de f in i t e ly lower cos t than conventional
Note that the cap i t a l and O&M costs f o r a bo i le r based on low su l fu r fuel There i s no r e l a t ive improvement when u s i n g low su l fu r coa l , how-
Of course, this i s f u l l y of fse t by the
SUMMARY
Consistent process design and cos t estimating procedures play an important ro l e in guiding research and development. Application of proper process and pro jec t contingencies i s a key element in obtaining r e a l i s t i c and comparable estimates.
power generation a l t e rna t ives now under development in the United S ta tes . Coal gas i f ica t ion and power aeneration economics a r e presently the most f u l l y developed, b u t a number o f s tud ies a r e planned t o be t te r define the prospects f o r coal l iquefaction.
Preliminary estimates have been made for many of t he coal conversion and
REFERENCES
1. Detman, R . , "Factored Estimates f o r Western Coal Comnercial Concepts - Interim Report," prepared fo r t he U.S. Energy Research and Development Administration and the American Gas Association by C.F. Braun E Co., October 1976.
Fuels," presented a t the F o u r t h Annua l International Conference on Coal Gasi- f ica t ion , Liquefaction and Conversion t o E lec t r i c i ty , Univertisy of Pit tsburgh, Pit tsburgh, Pa. (August 2-4, 1977).
"Assessment of Fossil Energy Technologies f o r Elec t r ic Power Generation," Vol. 1, prepared for the Off ice o f Program Planninq and Analysis, Fossil Energy, by Gilbert Associates, Inc . , October 1976.
Farmer, M.H., Magee, E . M . , and Spooner, F.M., "Application of Fluidized Bed Technology t o Indus t r ia l Boilers ," prepared f o r U.S. FEA/ERDA/EPA by Exxon Research and Engi neeri ng Company, Linden, N. J . , January 1977.
2 . Schmid, B.K. and Jackson, D . M . , "Recycle SRC Processing fo r Liquid and Solid
3.
4.
6
TABLE I
FUEL COST TO POWER GENERATION
Dollars per Million BTU
Liquid Fuels
No. 6 Fuel Oil
Natural Gas
SRC Hot Liquid
Heavy Synthet ic Coal Liquid
Medium BTU Gas
Sol id Fuels
Low Sulfur Coal
H i g h Sulfur Coal
Sol id SRC
7
2.12 - 2.86
0.52 - 2.00
3.00 - 5.00
3.00 - 5.00
3.00 - 4.00
1.00 - 1.25
0.75 - 1.00
3.00 - 5.00
Purpose, Size, Cost of Individual Coal Conversion Units
25 PDU
50
Chemical.
Pmducts
20
25
PROJECT AND PROCESS CONTINGENCIES*
TYPE OF COST ESTIMATE
5
\ I
5 5
STUDY ($2-5 x 10')
PRELIMINARY 152-5 x 10')
DEFINITIVE ($2-5 x 10')
20
15
20
10
20
15
10
15
5
15
U
D
1 B
PRELIMINARY ($0.2-0.5 X 10') DEFINITIVE ($2-5 X 10'1 DETAILED ($20-50 X 10')
0 EXPERIENCE FACTORS 0 VENDOR QUOTES ACTUAL LABOR COSTS
ON MAJOR ITEMS AND PRODUCTIYITY 2
0 RULES OF THUMB 0 EXPERIENCE FACTORS DETAILED ENGINEERING $ BASED ON MORE EVALUATION 'n
DETAILED DRAWINGS
GENERAL COST INDEXES SPECIFIC COST FINANCING UNDER INDEXES ACTUAL CONDITIONS
ASSUMED FINANCIAL e PROJECTED FINANCIAL CONDITIONS CONDITIONS
240
a > 2 200 z 0 d Z 160
-I
vj c In 0 u " 120
z t a ; 80
a
a
0
3 2 40 2
2
0 0 200 400 600 800 1000 1200 1400 1600 1800
TOTAL CAPITAL REQUIREMENT. MILLION S
10
NEW ELECTWlC UTILITIES millslkwhr
0 10 20 30 40 50 60 LIQUID FUELS
SRC HOT LIQUID
HEAVY SYNTHETIC COAL LIQUID ---__ -m--- m - c - - .
ObM
FUEL
c:::M CAPITAL
rnills/kwhr 20 30 40 50 60
SOLI? FUELSlo
'\ LOW SULFUR COAL W/O FGD
FwgNI- HIGH SULFUR COAL WITH FGD
D SRC W I O FGO
CLEANED COAL WIO FGD
HIGH SULFUR COAL I N FBC
IGH SULFUR COAL. LOW BTU GAS, COMBINED CYCLE
ObM
01
FUEL
CAPITAL
11
60
40
P s 5 30
f - U
20
10
0
-10
COAL
FUEL
- SOLID FUEL PLANTS
LIQUID FUEL PLANTS
LOW BTU GAS ON SITE
HEAVY SYNTHETIC
MEW !kJDUS$R!Ah EX38LERS HIGH SULFUR COAL
CF WITH
LOW SULFUR
7 -
12
ECONOMICS OF THE KOPPERS K-T GASIFICATION PROCESS FOR SYNTHETIC
GAS AND CHEMICAL MANUFACTURE
John F. Kamody and J. Frank Cannon
Koppers Company, I nc . Engineer ing and Cons t ruc t i on Group
P i t t sbu rgh , PA 15219
INTRODUCTION
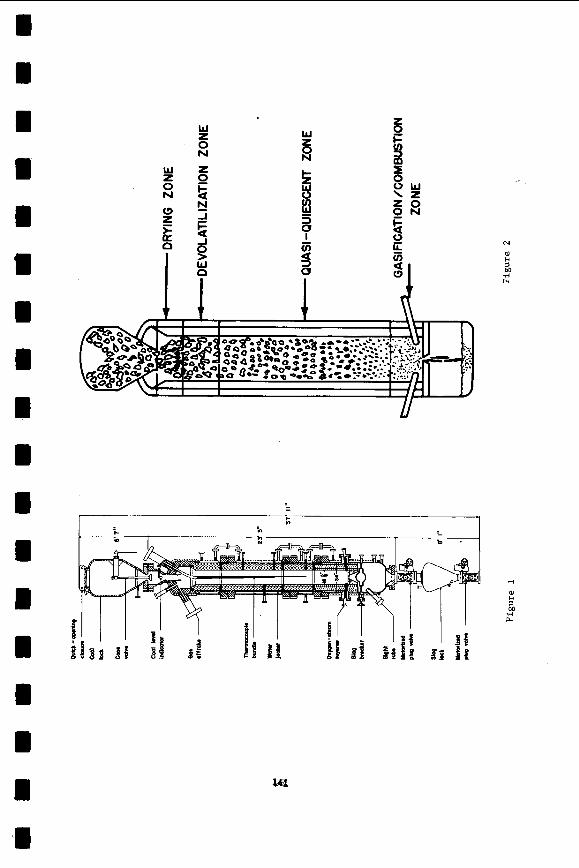
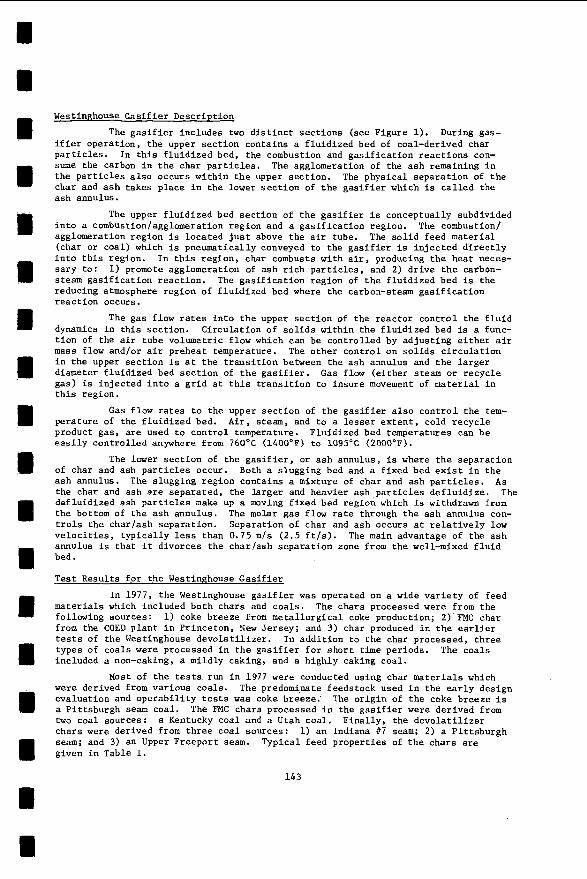
The commercial ly proven Koppers K-T g a s i f i c a t i o n process i s employed f o r t h e g a s i f i c a - t i o n o f coal and o t h e r carbonaceous f u e l s t o produce a carbon monoxide and hydrogen r i c h gas. steam a t h igh temperature.
Since 1952 a t o t a l o f 39 g a s i f i e r s have been i n s t a l l e d a t 13 l o c a t i o n s i n t h e Eastern Hemisphere. An a d d i t i o n a l p l a n t a t Ta lcher , I nd ia , i s scheduled f o r s t a r t - u p some- t ime d u r i n g 1978. Almost e x c l u s i v e l y t h e p l a n t s have been u t i l i z e d f o r t h e p roduc t i on o f ammonia f rom coa l . However, t h e l a t e s t commissioned p l a n t i n Modderfontein, South A f r i c a , produces 65 m e t r i c t ons pe r day o f methanol as w e l l as 1000 m e t r i c tons p e r day o f anhydrous ammonia.
I nhe ren t f ea tu res o f t h e K-T process r e s u l t i n t h e p roduc t i on o f a gas which i s ext remely w e l l s u i t e d f o r chemical syn thes i s a p p l i c a t i o n s . These f a v o r a b l e cha rac te r - i s t i c s o f t h e gas i nc lude :
The process i nvo l ves t h e ent ra inment r e a c t i o n o f t h e f u e l w i t h oxygen and
Tars, phenols, and o t h e r condensib le h y d r x a r b o n s a r e t o t a l l y absent f rom t h e raw gas. f ea tu re , problems a r e avoided w i t h gas p u r i f i c a t i o n and w i t h c a t a l y t i c process ing o f t h e gas.
The gas t y p i c a l l y con ta ins 85-90 volume percent ( d r y bas i s ) carbon monoxide plus hydrogen. The t h i r d p r i n c i p a l c o n s t i t u e n t i s carbon d i o x i d e which, o f course, i s recove rab le o r o the rw ise does n o t i n t e r f e r e i n chemical processing. S u l f u r i n t h e f u e l i s conver ted predominant ly t o hydrogen s u l f i d e and carbonyl s u l f i d e , bo th o f which a r e r e a d i l y recoverable from the gas. I n e r t compounds, such as n i t r o g e n and argon, a r e t y p i c a l l y present a t o n l y 1 volume percent ( d r y bas i s ) .
N e g l i g i b l e methane i s produced, thus avo id ing t h e need f o r employing c o s t l y steam re fo rm ing i n a p p l i c a t i o n s such as hydrogen o r ammonia p roduc t i on .
The gas can a1 t e r n a t i v e l y o r s imul taneously be employed as an excel l e n t i n d u s t r i a l f u e l gas, thereby adding t o v e r s a t i l i t y i n ope ra t i on .
U n l i k e n a t u r a l gas, hydrogen t o carbon monoxide r a t i o s o f 1 : l o r lower a re r e a d i l y ob ta inab le w i t h o u t t h e need f o r ex te rna l u t i l i z a t i o n o f excess hydrogen o r i m p o r t a t i o n o r carbon d iox ide . Th is f e a t u r e can make t h e K-T process more p r a c t i c a l l y s u i t e d than n a t u r a l gas f o r growing a p p l i c a t i o n s i n oxo-synthesis, methanol product ion, o r Fischer-Tropsch technology.
As ide f rom t h e obvious environmental advantages of t h i s
An a d d i t i o n a l major advantage t o t h e process i s i t s a b i l i t y t o handle a v a r i e t y o f feed- s tocks, i n c l u d i n g a l l ranks o f coa l , char and pet ro leum coke. I n a d d i t i o n , l i q u i d feed- stocks, such as heavy r e s i d u a l s o r t a rs , can be processed. Th is advantage i s impor tant i n c o n t r a c t i n g f o r an economical f u e l supply o r i n sw i t ch ing t o a l t e r n a t e f u e l s du r ing t h e l i f e o f t h e p l a n t . P resen t l y designed u n i t s can process a maximum o f 850 tons per day o f s o l i d carbonaceous f u e l .
1 3
PROCESS DESCRIPTION
For t h e sake o f b r e v i t y and due t o t h e f a c t t h a t many people a r e now reasonably f a m i l i a r w i t h the bas ic f e a t u r e s o f t h e K-T process ve ry l i t t l e d i scuss ion h e r e i n i s made on the process d e s c r i p t i o n . Koppers p u b l i c a t i o n s .
The g a s i f i e r employs t h e l o w pressure p a r t i a l o x i d a t i o n o f p u l v e r i z e d coa l i n suspension w i t h oxygen and steam. Reac t ion temperature ranges f rom 3500°F a t t h e burners t o 2700'F a t t h e g a s i f i e r o u t l e t . The g a s i f i e r i s a steam-jacketed, r e f r a c t o r y l i n e d carbon s t e e l vessel . A four-headed g a s i f i e r employs f o u r burner assemblies s i t u a t e d 90. apa r t , w h i l e a two-headed g a s i f i e r employs a p a i r o f burner assemblies l o c a t e d 180' apa r t . i s t i c a l l y , the gas produced con ta ins 50-55% carbon monoxide and 30-35% hydrogen, b o t h on a d r y bas is . make up t h e balance.
Heat i s recovered f rom t h e gas l e a v i n g t h e g a s i f i e r by means o f a waste heat b o i l e r where up t o 1500 p s i g s a t u r a t e d steam i s generated. Gas from t h e waste heat b o i l e r i s scrubbed o f p a r t i c u l a t e s and i s t h e n compressed as necessary f o r t h e in tended a p p l i c a t i o n . S u l f u r compounds are removed f rom the gas and u l t i m a t e l y conver ted t o s u l f u r b y a v a r i e t y o f means which a r e se lec ted based on gas a p p l i c a t i o n .
F u r t h e r i n fo rma t ion and performance data can be found i n o t h e r
Character-
Carbon d i o x i d e , s u l f u r compounds (H2S and COS), and n i t r o g e n p r i n c i p a l l y
GENERAL ECONOMIC CONSIDERATIONS FOR COAL GASIFICATION
While i t i s n o t t h e i n t e n t o f t h i s paper t o compare the K-T process t o c o m p e t i t i v e coa l g a s i f i c a t i o n processes, i t i s s a f e t o conclude t h a t a l l a p p l i c a t i o n s o f coa l g a s i f i c a - t i o n w i l l be more expensive than p r e s e n t l y a v a i l a b l e sources o f o i l and n a t u r a l gas. Paradoxica l ly , however, t h e r e i s growing evidence t h a t t h e c o s t of coal g a s i f i c a t i o n i s s i m i l a r , i f n o t l ess , t han t h e c o s t o f develop ing some new sources of n a t u r a l gas. The h i g h c o s t o f new n a t u r a l gas today tends t o be d i sgu ised by t h e lower c o s t o f o l d gas p roduc t i on . j us tmen t and o f course t h e s i t u a t i o n w i l l be d r a m a t i c a l l y changed w i t h i n e v i t a b l e gas de regu la t i on . However, w i t h gas f rom coal t h e r e a r e p r e s e n t l y few we l l -de f i ned i n s t i t u - t i o n a l mechanisms f o r e q u i t a b l y d i s t r i b u t i n g t h e cost . Consequently t h e r e i s re luc tance f rom p r i v a t e sec to rs t o i n v e s t i n coa l g a s i f i c a t i o n .
Synthes is gas i s p r e s e n t l y produced b y re fo rm ing n a t u r a l gas o r by p a r t i a l o x i d a t i o n o f o i l . I t i s s t r i c t l y a m a t t e r o f t ime be fo re t h e supply s i t u a t i o n o r governmental p o l i c y w i l l r e s t r i c t o r p r o h i b i t such use o f n a t u r a l gas. was d i r e c t e d toward SNG, o r h igh methane con ten t gas. However, i t o f t e n i s i l l o g i c a l t o produce SNG whenever i n d u s t r i a l users a r e s t i l l r e fo rm ing o r bu rn ing n a t u r a l gas. Thus, t h e p roduc t i on o f CO-H r i c h gas f o r i n d u s t r i a l use i s be ing favo red as a more e f f i c i e n t and economical approaci t o coal g a s i f i c a t i o n . a p p l i c a t i o n s , t h i s gas has e x c e l l e n t p r o p e r t i e s as an i ndus t r i , a l f u e l .
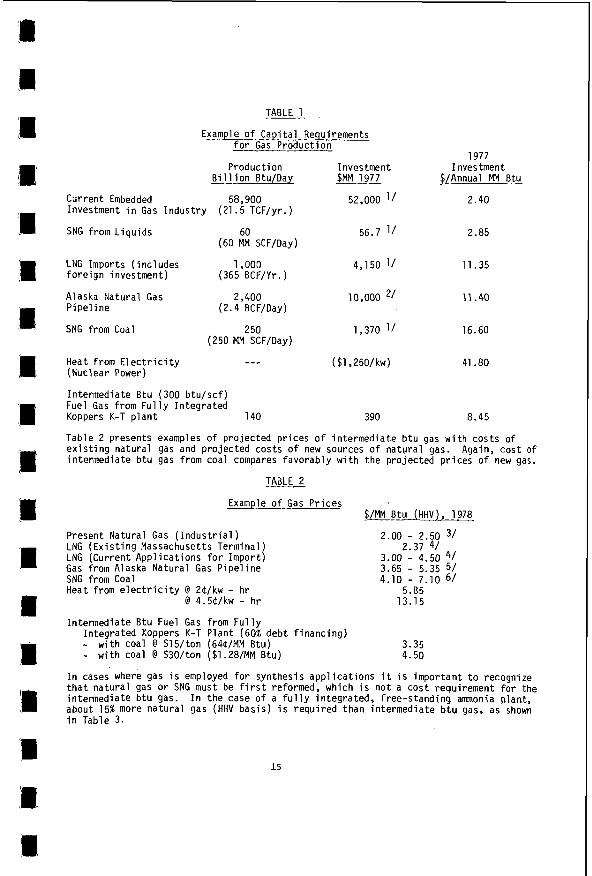
Table 1 mediate b t u fue l gas w i th investment requ i red f o r severa l p r o j e c t s i n v o l v i n g p roduc t i on of n a t u r a l gas, SNG, and e l e c t r i c i t y . The K-T f u e l gas p l a n t would d e l i v e r 140 b i l l i o n b tus per day of 300 b t u p e r cub ic f o o t gas ( i n t e r m e d i a t e . B t u gas) a t e leva ted pressure t o a number o f i n d u s t r i a l users.
A l though t h e a c t u a l c o s t s o f some o f t he new n a t u r a l gas o r SNG p r o j e c t s can be debated, t h e i n t e n t of p resen t ing t h e t a b l e i s mere ly t o i n d i c a t e t h a t t h e costs o f new sources of gas a r e much h ighe r than i n t h e past . i n te rmed ia te b t u gas should be regarded as an e q u a l l y v i a b l e venture. A l l o f t h e e f f o r t s by t h e gas i n d u s t r y t o i nc rease p roduc t i on a r e impor tant , and t h e r e a r e many areas such as r e s i d e n t i a l markets, where methane i s d i f f i c u l t t o rep lace. syn thes i s gas p roduc t i on w i l l ease t h e burden o f supply. accounts f o r ove r 60% of n a t u r a l gas consumption.
T h i s s i t u a t i o n i s g r a d u a l l y s h i f t i n g w i t h t h e advent o f t h e f u e l cost ad-
E a r l i e r emphasis on coa l g a s i f i c a t i o n
I n a d d i t i o n t o t h e many syn thes i s gas
compares t h e investment o f a f u l l y i n t e g r a t e d Koppers K-T p l a n t producing i n t e r -
Furthermore i t i s apparent t h a t p roduc t i on o f
I n d u s t r i a l f u e l o r P resen t l y i n d u s t r i a l usage
14
TABLE 1
Example of Cap i ta l Requirements f o r Gas Produc t ion
Product ion Investment B i l l i o n Btu/Day $MM 1977
Current Embedded 58,900 52,000 Investment i n Gas I n d u s t r y
SNG from L i q u i d s 60 56.7
(21.5 TCFlyr.)
(60 MM SCFIDay)
LNG Imports ( i nc ludes 1,000 4,150 fo re ign investment) (365 BCF/Yr. )
P i p e l i n e (2.4 BCFIDay)
SNG from Coal 250 1,370
Alaska Na tu ra l Gas 2,400 10,000 2/
(250 MM SCFIDay)
Heat from E l e c t r i c i t y --- ($1,25O/kw) (Nuclear Power)
1977 Investment
$/Annual MM Btu
2.40
2.85
11.35
11.40
16.60
41.80
In te rmed ia te B tu (300 b t u / s c f ) Fuel Gas f rom F u l l y I n t e g r a t e d Koppers K-T p l a n t 140 390 8.45
Table 2 presents examples of p ro jec ted p r i c e s of i n te rmed ia te b t u gas w i t h cos ts o f e x i s t i n g na tu ra l gas and p ro jec ted cos ts o f new sources o f n a t u r a l gas. Again, c o s t o f i n te rmed ia te b t u gas f rom coal compares f a v o r a b l y w i t h t h e p ro jec ted p r i c e s o f new gas.
TABLE 2
Example o f Gas P r i c e s $/MM B t u (HHV), 1978
Present Natura l Gas ( I n d u s t r i a l ) LNG ( E x i s t i n g Massachusetts Terminal ) LNG (Current A D P ~ i c a t i o n s f o r Imoor t ) Gas from Alaska’ Na tu ra l Gas P i p e l i n e ’ SNG from Coal Heat f rom e l e c t r i c i t r @ Eb/kw - hr
@ 4.5b/kw - h r
2.00 - 2.50 3/ 2.37 41
3.00 - 4.50 4/ 3.65 - 5.35 5 1 4.10 - 7.10 61
5.85 13.15
In te rmed ia te B tu Fuel Gas from F u l l y I n teg ra ted Koppers K-T P l a n t (60% deb t f i nanc ing )
- w i t h coal @ $30/ton ($1.28/MM B tu ) 4.50 - w i t h coal @ $15/ton (64b/MM Btu) 3.35
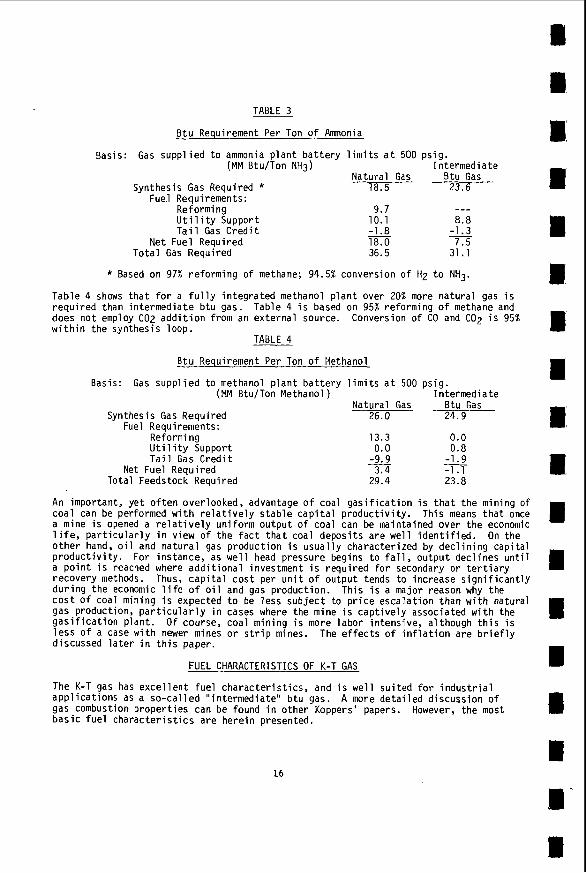
I n cases where gas i s employed f o r syn thes i s a p p l i c a t i o n s i t i s impor tan t t o recognize t h a t n a t u r a l gas o r SNG must be f i r s t reformed, which i s n o t a c o s t requi rement for the i n te rmed ia te b t u gas. I n t h e case o f a f u l l y i n teg ra ted , f ree-standing ammonia p lan t , about 15% more n a t u r a l gas (HHV bas i s ) is r e q u i r e d than in te rmed ia te b t u gas, as shown i n Table 3 .
15
TABLE 3
B t u Requirement Per Ton o f Ammonia
Basis: Gas s u p p l i e d t o ammonia p l a n t b a t t e r y l i m i t s a t 500 ps ig . (MM Btu/Ton NH3) I ntermediate
Synthes is Gas Required * Fuel Requirements:
Reforming U t i l i t y Support T a i l Gas C r e d i t
Net Fuel Required T o t a l Gas Requi red
Natura l Gas B tu Gas 18.5 23.6
--- 9.7
- J .8 10.1 8.8
18.0 36.5
-1.3 7.5
31.1
__
* Based on 97% r e f o r m i n g o f methane; 94.5% convers ion o f H2 t o NH3.
Tab le 4 shows t h a t f o r a f u l l y i n t e g r a t e d methanol p l a n t over 20% more n a t u r a l gas i s r e q u i r e d than in te rmed ia te b t u gas. Table 4 i s based on 95% re fo rm ing o f methane and does n o t employ C02 a d d i t i o n from an e x t e r n a l source. w i t h i n t h e synthes is loop.
Conversion o f CO and C02 i s 95%
TABLE 4
B t u Requirement Per Ton o f Methanol
13.3 0.0 0.0 0.8
-1.9 3.4 -1.1
- -9.9
Basis: Gas s u p p l i e d t o methanol p l a n t b a t t e r y l i m i t s a t 500 ps ig . (MM Btu/Ton Methanol) I n te rmed ia te
Na tu ra l Gas B tu Gas Synthesis Gas Requi red 26.0 24.9
Fuel Requirements: Reforming U t i l i t y Support T a i l Gas C r e d i t
Net Fuel Requi red Tota l Feedstock Required 29.4 23.8
An important, y e t o f t e n over looked, advantage of coa l g a s i f i c a t i o n i s t h a t t h e m in ing o f c o a l can be performed wi th r e l a t i v e l y s t a b l e c a p i t a l p r o d u c t i v i t y . Th i s means t h a t once a mine i s opened a r e l a t i v e l y un i fo rm o u t p u t o f coa l can be maintained ove r t h e economic l i f e , p a r t i c u l a r l y i n v iew o f t h e f a c t t h a t coa l depos i t s a r e w e l l i d e n t i f i e d . o t h e r hand, o i l and n a t u r a l gas p roduc t i on i s u s u a l l y cha rac te r i zed by d e c l i n i n g c a p i t a l p r o d u c t i v i t y . For i ns tance , as w e l l head pressure begins t o f a l l , o u t p u t d e c l i n e s u n t i l a p o i n t i s reached where a d d i t i o n a l investment i s r e q u i r e d f o r secondary o r t e r t i a r y recove ry methods. Thus, c a p i t a l c o s t per u n i t o f ou tpu t tends t o increase s i g n i f i c a n t l y d u r i n g t h e economic l i f e o f o i l and gas p roduc t i on . c o s t of coal min ing i s expected t o be l e s s s u b j e c t t o p r i c e e s c a l a t i o n than w i t h natura l gas product ion, p a r t i c u l a r l y i n cases where t h e mine i s c a p t i v e l y assoc iated w i th t h e g a s i f i c a t i o n p lan t . O f course, coa l m in ing i s more l a b o r i n tens i ve , a l though t h i s i s l e s s of a case w i t h newer mines o r s t r i p mines. The e f f e c t s o f i n f l a t i o n a r e b r i e f l y d iscussed l a t e r i n t h i s paper.
On t h e
Th is i s a major reason why the
FUEL CHARACTERISTICS OF K-T GAS
The K-T gas has e x c e l l e n t f u e l c h a r a c t e r i s t i c s , and i s w e l l s u i t e d f o r i n d u s t r i a l a p p l i c a t i o n s as a s o - c a l l e d " i n te rmed ia te " b t u gas. A more d e t a i l e d d i scuss ion o f gas combustion p r o p e r t i e s can be found i n o t h e r Koppers' papers. b a s i c fue l c h a r a c t e r i s t i c s a r e h e r e i n presented.
However, t h e most
16
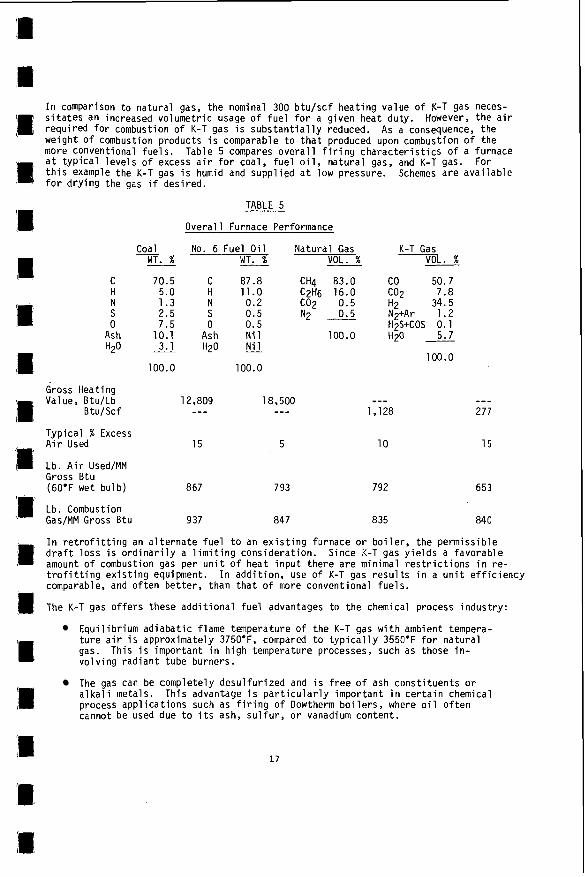
I n comparison t o n a t u r a l gas, t h e nominal 300 b t u / s c f h e a t i n g va lue o f K-T gas neces- s i t a t e s an increased vo lumet r i c usage o f f u e l f o r a g i ven heat duty . r e q u i r e d fo r combustion o f K-T gas is s u b s t a n t i a l l y reduced. As a consequence, the we igh t Of combustion products i s comparable t o t h a t produced upon combustion o f t he more conventional f u e l s . a t t y p i c a l l e v e l s o f excess a i r f o r coal , f u e l o i l , n a t u r a l gas, and K-T gas. t h i s example the K-T gas i s humid and supp l i ed a t low pressure. f o r d r y i n g the gas i f desi red.
However, the a i r
Table 5 compares o v e r a l l f i r i n g c h a r a c t e r i s t i c s o f a furnace
Schemes a r e a v a i l a b l e For
TABLE 5
O v e r a l l Furnace Performance
- Coal No. 6 Fuel O i l Na tu ra l Gas K-T Gas E VOL. % VOL. %
C 70.5 C 87.8 CH4 83.0 co 50.7 H 5.0 H 11.0 7.8 N 1 . 3 N 0.2 co9 n s 0
. . -
2.5 S 0.5 7.5 0 0.5
Ash 10.1 Ash N i l H20 3.1 H20
100.0 100.0
Gross Heating Value, Btu/Lb
Btu/Scf 12,809 18,500 _-- ---
Typ ica l % Excess A i r Used 15 5
100.0 H i 0 5.7 100.0
--- 1,128
10
Lb. A i r Used/MM Gross B tu (60'F wet bu lb ) 867 793 792
Lb. Combustion Gas/MM Gross Btu 937 847 835
--- 277
15
653
840
I n r e t r o f i t t i n g an a l t e r n a t e f u e l t o an e x i s t i n g furnace o r b o i l e r , t h e p e r m i s s i b l e d r a f t l o s s i s o r d i n a r i l y a l i m i t i n g cons ide ra t i on . amount o f combustion gas per u n i t o f hea t i n p u t t h e r e a r e minimal r e s t r i c t i o n s i n r e - t r o f i t t i n g e x i s t i n g equipment. I n a d d i t i o n , use o f K-T gas r e s u l t s i n a u n i t e f f i c i e n c y comparable, and o f t e n b e t t e r , than t h a t o f more convent ional f u e l s .
The K-T gas o f f e r s these a d d i t i o n a l f u e l advantages t o t h e chemical process i n d u s t r y :
Since K-T gas y i e l d s a f a v o r a b l e
Equ i l i b r i um a d i a b a t i c f lame temperature o f t h e K-T gas w i t h ambient tempera- t u r e a i r i s approx imate ly 3750eF, compared t o t y p i c a l l y 3550°F f o r n a t u r a l gas. v o l v i n g r a d i a n t tube burners.
The gas can be complete ly desu l fu r i zed and i s f r e e o f ash c o n s t i t u e n t s o r a l k a l i metals. process a p p l i c a t i o n s such as f i r i n g o f Oowtherm b o i l e r s , where o i l o f t e n cannot be used due t o i t s ash, s u l f u r , o r vanadium content .
Th is i s impor tan t i n h i g h temperature processes, such as those i n -
Th is advantage i s p a r t i c u l a r l y impor tan t i n c e r t a i n chemical
17
The wide flamnability limits of the gas promote good combustion efficiency and permit safe control of combustion temperature by use of a relatively h i g h amount of excess a i r . The wide flammability limits permit reduced nitrogen oxide emissions by means of staged combustor f i r ing.
The versatile K-T fuel gas can be used as a fuel or as a synthesis gas, without the necessity of a reforming operation.
Within most industries, a re l iable fuel supply i s important. proven history of re l iab i l i ty . Gasifier outages, such as those which occur during annual plant turn around, can be compensated by use of spare gasifier capacity or by the temporary use of a l ternate fuels. If natural gas i s used as a back-up fuel, systems can be designed whereby air-ballasted natural gas i s automatically used without necessitating burner alterations.
The K-T process has a
ECONOMICS FOR FUEL GAS OR SYNTHESIS GAS PRODUCTION
I t i s d i f f icu l t to generalize the economics of producing synthesis gas from coal since costs are greatly influenced by a number of variables which are specific t o each appli- cation. f a c i l i t i e s , and cost of coal. I n addition, specific financing variables such as capital structure, ra te of return, and interest ra tes affect gas cost.
As an example of synthesis gas costs, a case i s presented for a large plant which pro- duces gas a t 170 psig for delivery to industrial customers within a 100 mile radius. The plant consists of f i f teen four-headed gasifiers, including one spare, to produce a net output of 140 bi l l ion btus per day ( H H V ) of gas with a gross heating value of 300 Btu/scf. bituminous coal, w i t h 5.7 w t . % moisture content and gross heating value of 11,810 Btu/lb. Gas i s desulfurized and dried t o a -18'F dew point before entering the distribution system. The plant sa t i s f ies i t s own u t i l i t y requirements, except for 94 megawatts of imported electr ic i ty , by combustion of a portion o f gas within an auxiliary boiler. The plant i s a "grass-roots'' plant and a l l general f a c i l i t i e s and coal hand1 ing f a c i l i t i e s a re i ncl uded.
Plant investment (mid 1978) would be about $410 MM, while total capital requirements would amount t o a b o u t $510 MM. The total capital includes the plant investment plus interest during construction, start-up costs, and working capital (60 day cash supply).
Figure 1 i s based on th i s plant and shows the effect of coal cost on gas cost for a debt t o equity ratio of 60/40 and a 12 percent discounted cash flow rate of return. The cash flow method of analysis i s representative of private investor financing. Figure 2 i l lust rates the effect of capital structure, or fraction of debt, on gas cost for a coal cost of $22.50/ton (95d per MM B t u ) . a 10 Year ( sum of years d i g i t s ) depreciation schedule. Federal income taxes are taken as 48%. annual payments.
These variables include s i t e selection, plant s ize , availability of off-s i te
Raw material for the plant consists of 9700 tons per day of 2" x 0"
Project l i f e i s 20 years, with
Debt i s re t i red over the 20 year l i f e of the project by a series of
APPLICATIONS OF K-T GAS FOR CHEMICAL SYNTHESIS
Generally, there are three categories of chemical synthesis applications of the gas, either fo r captive or merchant markets. These are:
Hydrogen Production CO-H? Based Synthesis CO Production
18
Hydrogen Product ion
The major present commercial use o f hydrogen i s i n c a p t i v e markets, t h a t i s , those areas where t h e hydrogen i s used i n t e g r a l l y w i t h t h e process. P r i n c i p a l l y t h i s market r e l a t e s t o ammonia p roduc t i on o r pet ro leum r e f i n i n g a p p l i c a t i o n s , such as h y d r o d e s u l f u r i z a t i o n o r hydrocrack ing. Ammonia i s , o f course, t h e base m a t e r i a l f o r such impor tan t chemicals as caprolactam, a c r y l o n i t r i l e , urea (and r e s i n s t h e r e o f ) , n i t r i c ac id , and f e r t i l i z e r s .
An impor tan t growing c a p t i v e use f o r hydrogen w i l l be i n t h e area o f coa l l i q u e f a c t i o n . I n t y p i c a l l i q u e f a c t i o n processes hydrogen i s generated by g a s i f y i n g char o r r e s i d u e which i s recovered i n t h e processes. I n 1975 t h e K-T process was success fu l l y used t o g a s i f y FMC-COED char du r ing t e s t s i n Spain. i s w e l l s u i t e d f o r accommodating the h i g h ash con ten t c h a r a c t e r i s t i c o f such res idues.
Wi th r e s i d u e t ype feedstock t h e K-T process
CO-H:, Based Synthes is
Th is a p p l i c a t i o n i s based on d i r e c t syn thes i s o f chemicals f rom t h e CO-Hz gas. use i s of p a r t i c u l a r i n t e r e s t t o the chemical i n d u s t r y due t o the wide range o f va lu - a b l e products which can be made. gress which i s be ing made i n CO-H2 syn thes i s technology, e s p e c i a l l y i n rega rd t o c a t a l y s t improvements which p e r m i t improved y i e l d s and reduced syn thes i s pressures.
The modern schemes o f syn thes i s g e n e r a l l y r e q u i r e , s t o i c i o m e t r i c a l l y , a t l e a s t a 1 :1 r a t i o o f H2 t o CO, as f o r example i n va r ious oxo-synthes is processes. Higher r a t i o s a r e requ i red i n o t h e r a p p l i c a t i o n s , such as i n methanol o f Fischer-Tropsch synthes is , where a 2: l r a t i o o f H2 t o CO i s requ i red . H2:CO r a t i o o f t y p i c a l l y 0.6, i t i s s t r a i g h t f o r w a r d t o o b t a i n increased r a t i o s by mere ly s h i f t i n g a p o r t i o n o f t he gas. On t h e o t h e r hand, reformed n a t u r a l gas has a 3.0: l t o 4.0:l r a t i o o f hydrogen t o carbon ox ides. Thus, t o comply s t o i c i o m e t r i c a l l y w i t h c e r t a i n synthes is a p p l i c a t i o n s i t i s necessary w i t h n a t u r a l gas based CO-H2 t o remove o r o therwise u t i l i z e as f u e l t h e excess hydrogen i n t a i l gas. Conversely, CO t o C02 cou ld be added somewhere i n t h e process schemes. Hence a t t imes t h e p r a c t i - c a l i t y , cost , o r energy i nvo l ved i n syn thes i s based on n a t u r a l gas can be r e s t r i c t i v e .
Methanol from coal i s be ing considered f o r use as a d i r e c t f u e l . Methanol has t h e ad- vantage o f being e a s i l y s tored. Present economics do n o t j u s t i f y t h e use o f methanol as a f u e l unless coal i s inexpensive. With coa l a t $10 pe r ton, methanol by t h e K-T process would c o s t 35-554 p e r g a l l o n depending on p l a n t f i n a n c i n g and o t h e r f a c t o r s . Methanol a l s o has t r a d i t i o n a l impor tan t chemical a p p l i c a t i o n s , such as, i n t h e produc- t i o n o f formaldehyde, methyl methacry la te, a c e t i c ac id , and isoprene rubber . Mobi l O i l Co rpo ra t i on i s develop ing a process f o r p roduc t i on o f gaso l i ne from methanol. technology i s under development f o r p roduc t i on o f o l e f i n s , such as propylene, f rom methanol. These o l e f i n s can be used i n oxo-synthes is . Oxo-synthesis i s t h e process whereby aldehydes and o t h e r oxygenated compounds a r e produced by c a t a l y t i c r e a c t i o n s o f CO and H2 w i t h o l e f i n s . Products i n c l u d e p a i n t s , laquers, butyraldehyde, detergents , so lvents , and p l a s t i c i z e r s . Recent developments i n oxo-synthes is technology by Union Carbide, Davy Power Gas and Johnson Matthey have l e d t o p r a c t i c a l use o f l ow pressure technology and improved c a t a l y s t s e l e c t i v i t y f o r a t l e a s t one a p p l i c a t i o n (butyra ldehyde) .
CO Product ion
Fo r carbon monoxide p roduc t i on t h e K-T gas i s w e l l s u i t e d due t o i t s h igh CO content . Pure CO can be produced from t h e gas e i t h e r c r y o g e n i c a l l y o r by s e l e c t i v e abso rp t i on methods such as t h e Cosorb process developed by Tenneco Chemicals, I nc . Recent dev- elopments i n CO recovery technology a r e expected t o g r e a t l y increase markets f o r CO. A major market f o r CO l i e s i n d i r e c t o r e reduc t i on . Chemical syn thes i s a p p l i c a t i o n s i n c l u d e phosgene, to luene d i isocyanate, and s y n t h e t i c ac ids. Developments a r e aimed a t extending CO use t o p roduc t i on o f t e r e p h t h a l i c a c i d and p-cresol , and t o use i t as a co-monomer i n the rmop las t i cs .
T h i s
I t i s p a r t i c u l a r l y encouraging t o observe t h e pro-
S ince K-T gas f rom coal has i n i t i a l l y a
Add i t i ona l
19
ECONOMICS FOR ANHYDROUS AMMONIA PRODUCTION
An example o f cos ts f o r anhydrous ammonia i s g i ven f o r a 2000 t o n pe r day p l a n t . The p l a n t i s complete ly i n t e g r a t e d and inc ludes coa l r e c e i v i n g f a c i l i t i e s and a l l general f a c i l i t i e s , except raw wa te r t reatment . Four 4-headed g a s i f i e r s a r e used and no spare g a s i f i c a t i o n c a p a c i t y i s prov ided. A t o t a l o f 2845 tons pe r day o f as-received b i tum- inous coal i s r e q u i r e d f o r g a s i f i c a t i o n . A d d i t i o n a l coal i s used f o r f i r i n g an a u x i l i a r y b o i l e r t o meet a l l p l a n t u t i l i t y requirements, except f o r t he i m p o r t a t i o n o f about 17.5 megawatts o f e l e c t r i c i t y . Coal i s t h e same as t h a t used i n the economics o f syn thes i s gas discussed p rev ious l y . F lue gas from t h e a u x i l i a r y b o i l e r i s t r e a t e d (Wellman-Lord Process) w i t h recovered SO2 sen t t o t h e Claus p l a n t , a long w i t h H2S from t h e g a s i f i c a t i o n p o r t i o n o f the p l a n t . P l a n t investment (mid 1978) i s approx imate ly $250 MM, w h i l e t o t a l c a p i t a l i s about $310 MM.
F i g u r e 3 i l l u s t r a t e s t h e e f f e c t o f coa l c o s t on ammonia s e l l i n g p r i c e . Bases a r e rep re - s e n t a t i v e f o r p r i v a t e f i n a n c i n g and inc lude :
12% Return on e q u i t y 9% I n t e r e s t on deb t 60/40 Debt t o e q u i t y r a t i o
48% Federa l income tax .
1 0 Year d e p r e c i a t i o n (sum o f yea rs d i g i t s ) 20 Year debt r e t i r e m e n t (annual payments)
t
F i g u r e 4 shows t h e e f f e c t o f c a p i t a l s t r u c t u r e , i . e . , t h e e x t e n t o f debt f i n a n c i n g on ammonia p r i ce . A l l coa l conve rs ion processes a r e c a p i t a l i n tens i ve , and i t w i l l p robably be necessary t o adopt non-conventional methods o f f i n a n c i n g t o make coal d e r i v e d products more c o m p e t i t i v e w i t h those f rom o i l and n a t u r a l gas. Many o f t h e r e c e n t d iscuss ions concern ing syn fue l p r o j e c t s have, t he re fo re , touched upon concepts such as government l o a n guarantees, l eve raged- leas ing arrangements, t ax f r e e bonds, and even 100% government ownership as a means o f reducing t h e f i n a n c i a l burden o f syn fue l energy cost .
ECONOMICS OF HYDROGEN PRODUCTION
The economics o f hydrogen a r e b r i e f l y d iscussed here s i n c e a more thorough d i scuss ion appears i n a r e c e n t Koppers Company p r e ~ e n t a t i o n . ~ / hydrogen cos t whenever b i tuminous coal c o s t i s $20 pe r t o n (81 t per m i l l i o n b t u ) .
Table 6 presents a summary o f
TABLE 6
Cost o f Producing 100 MMSCFD o f Hydrogen
B a t t e r y L i m i t s P l a n t F u l l y I n t e g r a t e d P lan t
P l a n t Investment, $MM 185.0 T o t a l C a p i t a l , $MM 229.0 S e l l i n g P r i c e ,
B/MSCF 1.79 $ / M i l l i o n Btu (HHV) 5.50
288.0 352.5
2.27 7.00
I 1 I I
Bases f o r cost e s t i m a t i o n i n c l u d e 75% deb t a t 9% i n t e r e s t r a t e and 25% e q u i t y a t 12% d iscoun ted cash f l o w r a t e o f r e t u r n ove r t h e 20 yea r p r o j e c t l i f e .
Hydrogen produced i s 97.4 v o l . % p u r i t y and i s a v a i l a b l e a t 500 ps ig. The p r i n c i p a l i m p u r i t i e s c o n s i s t o f methane, n i t rogen , and argon. 5 ppmv, wh i l e molecular s ieves a r e employed t o c o n t r o l t o t a l carbon d i o x i d e and water c o n t e n t a t about 3 ppmv. t h e c o s t o f so do ing would be h ighe r than those shown above.
Residual carbon monoxide i s about
Technology e x i s t s f o r producing 99.9 + v o l . % hydrogen, however,
20
Again, as i s c h a r a c t e r i s t i c o f a c a p i t a l i n t e n s i v e p r o j e c t t h e ex ten t o f deb t f i nanc ing has an impor tan t e f f e c t . For instance, when producing hydrogen w i t h i n a b a t t e r y l i m i t s p l a n t , cos ts would r i s e sha rp l y from $5 .50 /m i l l i on B tu (see Table 6 ) t o $7 .45 /m i l l i on B tu whenever 25% e q u i t y f i n a n c i n g i s rep laced by 100% e q u i t y f i n a n c i n g a t 12% d i s - counted cash f l o w r a t e o f r e t u r n .
EFFECTS OF INFLATION
I n today ' s i n f l a t i o n dominated economy any c o s t a n a l y s i s i s incomplete un less t h e p ro - j e c t i o n of f u t u r e energy p r i c e s i s considered. Long term p r e d i c t i o n s o f energy cos t a r e d i f f i c u l t t o make, however, i t i s c e r t a i n t h a t cos ts w i l l con t i nue t o c l imb . I t i s l i k e l y i n f a c t t h a t energy cos ts w i l l be a major c o n t r i b u t o r t o i n f l a t i o n a r y forces, and hence i t would n o t be s u r p r i s i n g i f t h e r a t e o f p r i c e e s c a l a t i o n o f conven t iona l f ue l s becomes h ighe r than t h e general i n f l a t i o n r a t e .
There a r e a number o f reasons why i t i s expected t h a t cos ts f o r a l t e r n a t e f u e l s w i l l esca la te more r a p i d l y than cos ts from a coa l g a s i f i c a t i o n p l a n t , p a r t i c u l a r l y i n cases where t h e coal mine i s c a p t i v e l y assoc iated w i t h t h e g a s i f i c a t i o n p l a n t . i nc lude :
These reasons
O i l and gas p roduc t i on i s cha rac te r i zed by d e c l i n i n g c a p i t a l p r o d u c t i v i t y , whereas the m in ing o f coa l i s much l e s s s u b j e c t t o such dec l i nes .
Present p r i c e r e g u l a t i o n s on o i l and gas p roduc t i on a r e expected t o eventu- a l l y be e l im ina ted o r d imin ished t o a p o i n t where o i l o r gas p r i c e s a r e more rep resen ta t i ve o f t r u e market f o rces . I nhe ren t l y , t h e convenience o f con- ven t iona l f u e l s should command a much h ighe r f r e e market p r i c e than coa l .
P r o j e c t s i n v o l v i n g new o i l and gas p roduc t i on a r e ve ry c o s t l y , and some o f these p r o j e c t s cou ld i n f a c t be more expensive than t h e coal g a s i f i c a t i o n op t i ons .
P r i c e o f coal i s l e s s d i r e c t l y i n f l uenced by f o r e i g n p r i c i n g .
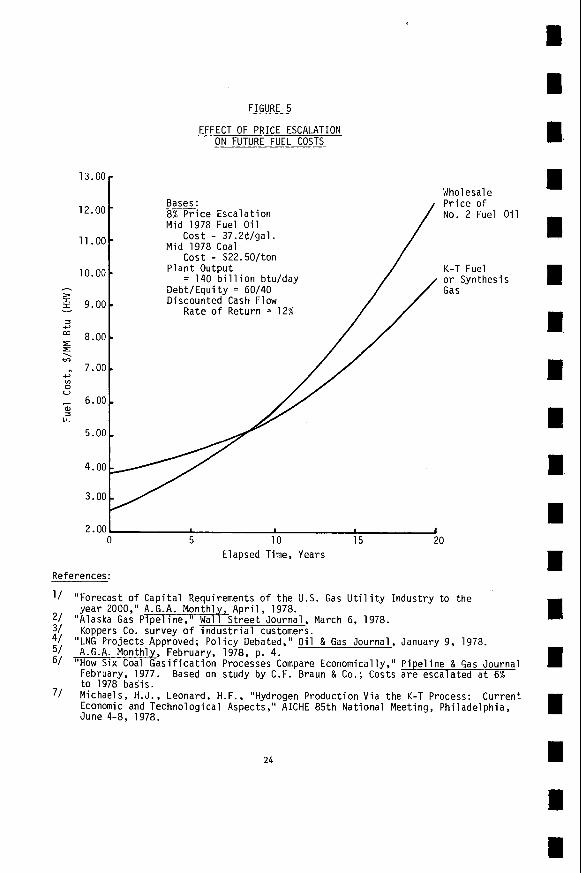
F igu re 5 i l l u s t r a t e s how t h e c o s t o f f u e l gas o r syn thes i s gas might compare t o c o s t o f No. 2 f u e l o i l over t h e 20 yea r p l a n t l i f e , whenever i n f l a t i o n o r p r i c e e s c a l a t i o n occurs a t an average r a t e o f 8 percent pe r year . ga l . ($2.65/MM Btu), which i s t he repo r ted wholesale p r i c e o f t h i s commodity accord ing t o U.S. Department o f Labor r e c e n t s t a t i s t i c s . (956 pe r m i l l i o n B tu ) . (140 b i l l i o n B tu pe r day) f o r which economics were presented e a r l i e r i n t h i s paper.
Once t h e g a s i f i c a t i o n p l a n t i s b u i l t t h e c a p i t a l assoc iated charges a r e n o t escalated. I n determin ing f u t u r e c o s t o f gas f rom t h e K-T p l a n t i t was assumed t h a t a l l o p e r a t i n g cos ts a r e subjected t o i n f l a t i o n , except f o r coal , where i t was assumed t h a t o n l y about 60% o f t h e coal cos t i s sub jec t t o i n f l a t i o n . Th is 60% value appears t o be representa- t i v e o f non-capi ta l assoc iated cos ts (such as l a b o r ) which a r e i nvo l ved i n coa l m in ing . N a t u r a l l y i f coal were purchased on t h e open market, r a t h e r than by long- term c o n t r a c t , t h e f u l l cos t o f coal would demand e s c a l a t i o n .
As F i g u r e 5 i l l u s t r a t e s , a p o i n t i s reached ( i n t h i s case a t about n i n e y e a r s ) where the c o s t o f f u e l o i l exceeds t h e p r i c e of K-T gas. More thorough ana lys i s i n v o l v i n g d i f f e r - e n t i n f l a t i o n r a t e s has u s u a l l y i n d i c a t e d t h a t t h e average c o s t o f K-T gas o r t h e present wor th c o s t o f K-T gas t u r n s o u t t o be lower than t h e cos t o f a l t e r n a t e f u e l s over t h e 20 yea r pe r iod . o u s l y mentioned t h i s t ype o f l ong term a n a l y s i s i s d i f f i c u l t and t h e i n t e n t o f p resen t ing F igu re 5 i s merely t o show r e l a t i v e e f f e c t s o f p r i c e e s c a l a t i o n which a r e d i f f i c u l t t o genera l ize, y e t impor tan t t o consider . The i m p l i c a t i o n i s t h a t s t r i c t l y f rom a c o s t s tandpo in t t h e r e can be sound f i n a n c i a l bas i s f o r present investment i n a g a s i f i c a t i o n p l a n t .
The 1978 p r i c e o f t h e o i l was taken as 37.24/
P r i c e o f coal was taken a t $22.50 per t o n The f u e l gas p l a n t dep ic ted i n F igu re 5 i s t h e same l a r g e p l a n t
Th is more d e t a i l e d a n a l y s i s i s beyond t h e scope o f t h i s paper. As p r e v i -
21
4.50
4.00
3.50
FIGURE 1
EFFECT OF COAL COST ON GAS COST
@ 170 p s i g Debt /Equi ty = 60/40 Discounted Cash Flow Rate o f Return = 12%
3. OOI I I I 1 10
4.50 -
4.00 -
3.50 -
15 20 25 30 Coal Cost, $/Ton
FIGURE 2
EFFECT OF CAPITAL STRUCTURE ON GAS COST
Bases : -Cost = $22.50/ton P l a n t Output
= 140 B i l l i o n Btu/Day
3.00 20 40 60 80 100
Percent Debt
22
FIGURE 3 ___ EFFECT OF COAL COST
ON AMMONIA COST
P r o d z n = 2000 tons/day Debt /Equi ty = 60/40 Discounted Cash Flow Rate o f Return = 12%
EFFECT OF P R I C E ESCALATION ON FUTURE FUEL COSTS
Bases : m i c e E s c a l a t i o n Mid 1978 Fuel O i l
Cost - 37.26/gal.
Cost - $22.50/ton
= 140 b i l l i o n btu/day
Ra te o f Return = 12%
Mid 1978 Coal
P l a n t Output
D e b t l E q u i t y = 60/40 Discounted Cash Flow
Elapsed Time, Years
References:
1/ "Forecast o f C a p i t a l Requirements of t h e U.S. Gas U t i l i t y I n d u s t r y t o t h e
2/ "Alaska Gas Pipel ine," Wal: S t r e e t Journal , March 6, 1978. 3/ 4/ 5/ A.G.A. Monthl , February, 1978, p. 4. 6/ "How Six Coal i a s i f i c a t i o n Processes Compare Economically," P i p e l i n e & Gas Journal
7/ Cur ren t
yea r 2000," A.G.A. Monthl , A p r i l , 1978.
Koppers Co. survey o f i n d u s t r i a l customers. "LNG Pro jec ts Approved; P o l i c y Debated," O i l & Gas Journal , January 9, 1978.
February, 1977. Based on s tudy by C.F. Braun ti Co.; Costs a r e esca la ted a t 6% t o 1978 bas is . Michaels, H.J., Leonard, H.F., "Hydrogen Product ion V i a t h e K-T Process: Economic and Techno log ica l Aspects," A ICHE 85 th Nat ional Meeting, Ph i l ade lph ia , June 4-8, 1978.
24
E C O N O M I C S O F THE H-COAL@ P R O C E S S
J o h n G . Kunesh , M i c h a e l C a l d e r o n , G a b r i e l A . P o p p e r , M a r v i n S . Rakow
H y d r o c a r b o n R e s e a r c h , I n c . P . O . B o x 6 0 4 7
L a w r e n c e v i l l e , New J e r s e y 0 8 6 4 8
I N T R O D U C T I O N
The e s c a l a t i n g c o s t o f e n e r g y i n t h e U.S. h a s s t i m u l a t e d a n i n t e n s i v e i n t e r e s t i n a l t e r n a t e s o u r c e s . H o w e v e r , e v e n i f m a j o r b r e a k t h r o u g h s a r e made i n s u c h a r e a s a s m a g n e t o - h y d r o d y n a m i c s , f u s i o n a n d s o l a r p o w e r , t h e n e e d f o r l i q u i d a n d g a s e o u s f u e l s f o r t r a n s p o r t a t i o n , home h e a t i n g a n d e x i s t i n g p o w e r p l a n t s w i l l be w i t h u s u n t i l w e l l p a s t t h e y e a r 2000.
C o a l l i q u e f a c t i o n o f f e r s t h e p o t e n t i a l o f s u b s t a n t i a l l y r e - d u c i n g t h e b a l a n c e o f p a y m e n t s d e f i c i t w h i l e u t i l i z i n g t h e e n o r m o u s U.S. c o a l r e s e r v e s w h i c h a r e o t h e r w i s e e n v i r o n m e n t a l l y u n a c c e p t a b l e . H R I ' s H - C o a l @ P r o c e s s i s on t h e v e r g e o f b e i n g e c o n o m i c a l l y com- p e t i t i v e w i t h i m p o r t e d o i l , p a r t i c u l a r l y i n t h e c e n t r a l p o r t i o n s o f t h e U n i t e d S t a t e s . The s t u d i e s r e p o r t e d h e r e i n s t a r t f r o m t w o b a s i c o v e r a l l p l a n t i n t e g r a t i o n schemes a n d t h e n e x a m i n e t h e s e n s i t i v i t y o f t h e r e q u i r e d f u e l o i l p r i c e t o some o f t h e m o r e p r o b a b l e e x p e c t e d v a r i a t i o n s i n p r o c e s s a n d f i n a n c i a l p a r a m e t e r s .
H-COAL
The H - C o a l P r o c e s s d e v e l o p e d b y H y d r o c a r b o n R e s e a r c h , I n c . , a s u b s i d i a r y o f D y n a l e c t r o n Corp . , i s a d i r e c t c a t a l y t i c h y d r o - l i q u e f a c t i o n p r o c e s s . It h a s b e e n u n d e r d e v e l o p m e n t s i n c e 1 9 6 3 a n d h a s a c c u m u l a t e d o v e r 53,000 h o u r s o f e x p e r i m e n t a l o p e r a t i o n i n 25 l b l d a y b e n c h u n i t s a n d a 3 t o n / d a y P r o c e s s D e v e l o p m e n t U n i t . A 6 0 0 t o n / d a y P i l o t P l a n t i s c u r r e n t l y u n d e r c o n s t r u c t i o n i n C a t l e t t s b u r g , K e n t u c k y a d j a c e n t t o t h e A s h l a n d O i l Co. R e f i n e r y . The P i l o t P l a n t p r o j e c t i s s p o n s o r e d b y t h e U.S. D e p a r t m e n t o f E n e r g y , The E l e c t r i c Power R e s e a r c h I n s t i t u t e , S t a n d a r d O i l Co. ( I n d i a n a ) , M o b i l O i l Co rp . , Conoco C o a l D e v e l o p m e n t Co., A s h l a n d O i l , I n c . a n d t h e Commonweal th o f K e n t u c k y .
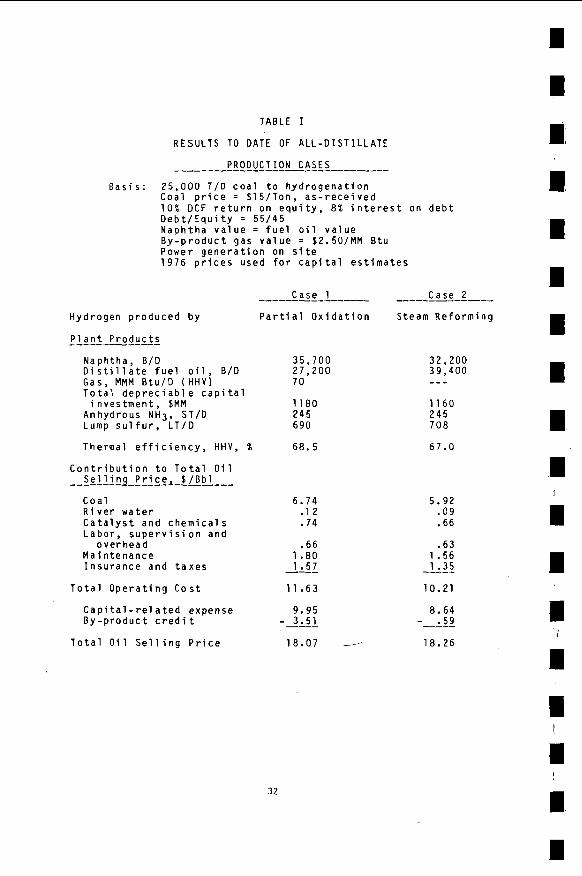
I n t h e H-Coa l p r o c e s s , c r u s h e d a n d d r i e d c o a l i s s l u r r i e d w i t h r e c y c l e o i l s , m i x e d w i t h h y d r o g e n a n d l i q u e f i e d i n d i r e c t c o n t a c t w i t h c a t a l y s t i n an e b u l l a t e d b e d r e a c t o r . The r e a c t o r e f f l u e n t i s s e p a r a t e d i n t o r e c y c l e a n d n e t p r o d u c t s t r e a m s i n c o n - v e n t i o n a l p r o c e s s i n g e q u i p m e n t . C o n v e r s i o n a n d y i e l d s t r u c t u r e a r e d e t e r m i n e d b y r e a c t o r c o n d i t i o n s , c a t a l y s t r e p l a c e m e n t r a t e a n d r e c y c l e s l u r r y o i l c o m p o s i t i o n . The s t u d i e s r e p o r t e d i n t h i s p a p e r a r e b a s e d o n a n o p e r a t i n g s e v e r i t y w h i c h p r o d u c e s a n a l l - d i s t i l l a t e p r o d u c t . T h i s mode o f o p e r a t i o n s p r o d u c e s a p r o d u c t s l a t e w h i c h m e e t s c u r r e n t EPA s u l f u r s p e c i f i c a t i o n s w i t h o u t f u r t h e r h y d r o t r e a t i n g . P l a n t s i z e was s e t a t 25 ,000 TPD c o a l t o t h e l i q u e f a c t i o n s e c t i o n t o b e c o n s i s t e n t w i t h o t h e r p r e v i o u s l y p u b l i s h e d s t u d i e s . ( l )
I n o p t i m i z i n g t h e o v e r a l l p r o c e s s f l o w scheme, t h e means b y w h i c h t h e r e q u i r e d h y d r o g e n i s m a n u f a c t u r e d i s a v e r y i m p o r t a n t v a r i a b l e . T h e t w o p r i m a r y a l t e r n a t e s a r e s t e a m r e f o r m i n g o f t h e
25
l i g h t g a s e s made i n t h e l i q u e f a c t i o n s t e p ( a p r o v e n p r o c e s s ) a n d p a r t i a l o x i d a t i o n o f t h e m i x t u r e o f a s h , u n c o n v e r t e d c o a l and r e s i d u u m w h i c h comes f r o m t h e b o t t o m o f t h e H-Coa l vacuum d i s t l l a - t i o n u n i t ( u n d e r d e v e l o p m e n t ) . A s e c o n d k e y f a c t o r i s w h e t h e r t h e l i q u e f a c t i o n f a c i l i t y p u r c h a s e s p o w e r o r g e n e r a t e s i t s own. A f i n a l s i g n i f i c a n t i t e m i s w h e t h e r t h e r e i s a c u s t o m e r f o r t h e n e t p r o d u c t g a s .
a r e s u m m a r i z e d i n T a b l e I . B o t h c a s e s assume o n - s i t e p o w e r g e n e r a t i o n . I n C a s e I , t h e o p e r a t i n g s e v e r i t y i s a d j u s t e d s u c h t h a t t h e vacuum b o t t o m s , when f e d t o p a r t i a l o x i d a t i o n , p u t t h e p l a n t i n t o h y d r o g e n b a l a n c e . P l a n t f u e l comes f r o m i n t e r n a l s t r e a m s a n d n e t g a s i s assumed s a l e a b l e a t $2.50/MM B t u . I n Case 1 1 , t h e b o t t o m s a r e c a r b o n i z e d a n d t h e r e s u l t a n t c o k e i s f e d t o t h e p o w e r p l a n t . E x c e s s c o k e i s g a s i f i e d t o p r o u c e a l o w B t u f u e l g a s f o r u s e i n t h e p l a n t . H2 i s p r o d u c e d b y s t e a m r e f o r m i n g . As may b e s e e n , t h e p a r t i a l o x i d a t i o n c a s e h a s a s l i g h t e c o n o m i c a d v a n t a g e f o r t h e a s s u m p t i o n s used . T a b l e I 1 g i v e s t h e p r o d u c t p r o p e r t i e s f o r t h e t w o c a s e s . The n e t g a s p r o d u c e d v i a Case I d o e s n o t m e e t i n t e r s t a t e p i p e 1 i n e i n t e r c h a n g e a b i l i t y s p e c . i f i c a - t i o n s . F o r p u r p o s e s o f t h i s s t u d y , t h e g a s was assumed s a l e a b l e a s - i s t o an i n d u s t r i a l c u s t o m e r . I f t h i s i s n o t p o s s i b l e , t h e n e t g a s c a n b e s e n t t o c r y o g e n i c p u r i f i c a t i o n w i t h C3 a n d C4 b e i n g r e c o v e r e d a s s a l e a t r l e l i q u i d p r o d u c t s , a n d a n e t i n t e r c h a n g e a b l e g a s b e i n g p r o d u c e d w i t h some h y d r o g e n b e i n g r e c y c l e d t o t h e p r o - c e s s . The e f f e c t o f t h i s a d d i t i o n a l p r o c e s s i n g c a n be a c c o u n t e d f o r i n t h e v a l u e a s s i g n e d t o t h e m i x e d o f f - g a s as o p p o s e d t o f i n a l p r o d u c t v a l u e s . T h i s a1 so a p p l i e s t o p r o d u c t gas t r a n s p o r a t i o n c o s t .
I n t h e p r e s e n t s t u d y , t w o b a s e c a s e s w e r e g e n e r a t e d . These
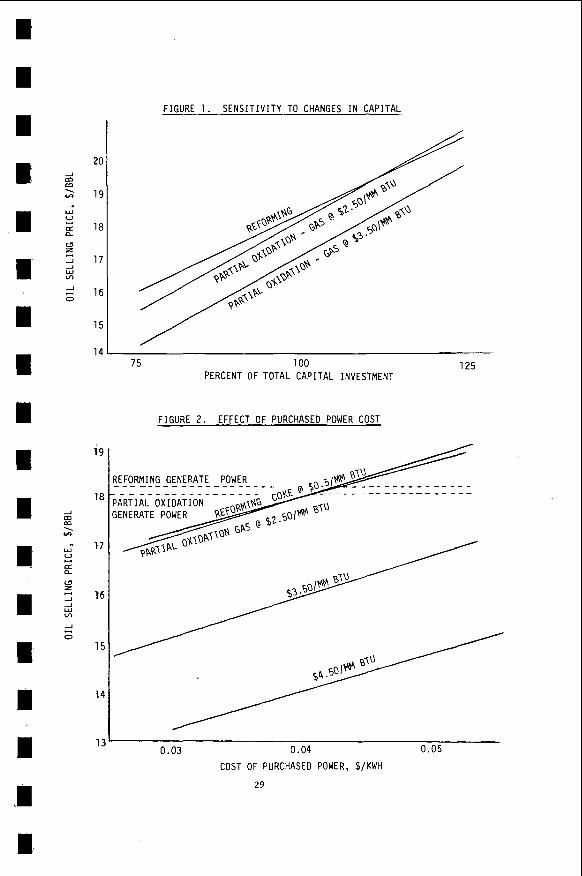
SENSIT IV ITY T O CAPITAL COST ESTIMATE
B e c a u s e o f t h e many a s s u m p t i o n s r e q u i r e d f o r s t u d i e s o f t h i s t y p e , a s e r i e s o f s i n g l e v a r i a b l e s e n s t i t i v t y a n a l y s e s w e r e r u n . The f i r s t , a n d m o s t o b v i o u s l y n e e d e d , i s t h e s e n s i t i v i t y t o e r r o r i n t h e c a p i t a l i n v e s t m e n t . F i g u r e I shows t h e r e q u i r e d f u e l o i l s e l l i n g p r i c e t o y i e l d 1 0 % DCF o n e q u i t y v e r s u s p e r c e n t a g e c h a n g e i n t o t a l c a p i t a l i n v e s t m e n t . W i t h g a s a t $2.50/MM B t u i n f l a t i o n f r o m 1 9 7 6 t o t h e p r e s e n t a p p e a r s t o g i v e t h e e d g e t o s t e a m r e f o r m i n g . I f n e t g a s c a n be s o l d f o r $3.50/MM B t u , r e f o r m i n g i s a l w a y s t h e m o r e e x p e n s i v e a l t e r n a t i v e . T h i s i s b a s e d o n t h e a s s u m p t i o n t h a t b o t t o m s m u s t b e u t i l i z e d o n s i t e , by g a s i - f i c a t i o n i f n e c e s s a r y .
SOURCE AND COST OF POWER
M o s t o f t h e c o m m e r c i a l s t u d i e s t o d a t e h a v e assumed t h a t p o w e r m u s t b e g e n e r a t e d on s i t e . The c a s e s p r e s e n t e d h e r e i n a d h e r e t o t h i s p o s i t i o n . T h e r e a r e t w o m a i n r e a s o n s f o r i n c l u d i n g p o w e r g e n e r a t i o n i n t h e f a c i l i t y :
1. I t i s g e n e r a l l y assumed t h a t t h e p l a n t w i l l b e l o c a t e d a d j a c e n t t o a new c o a l m i n e . I t may, t h e r e f o r e , b e i m p r a c t i c a l , o r a t l e a s t i n o r d i n a t e l y e x p e n s i v e , t o b r i n g i n t h e r e q u i r e d power .
2. T h i s f a c i l i t y i s e s t i m a t e d t o r e q u i r e a b o u t 200 m e g o w a t t s . Even i n an i n d u s t r i a l i z e d a r e a , t h i s may b e m o r e t h a n t h e l o c a l u t i l i t y c a n s u p p l y .
26
I
I
I.
I I
I
I
I
I 1 I
I
I
I
I
I
I
I
I n o r d e r t o e v a l u a t e t h e e f f e c t o f p u r c h a s e d v e r s u s g e n e r a t e d
1 . I f p o w e r c a n b e p u r c h a s e d , g a s c a n b e s o l d .
2 . I f p o w e r c a n b e p u r c h a s e d , c a r b o n i z e d b o t t o m s c a n be
p o w e r , t h e f o l l o w i n g a s s u m p t i o n s w e r e made:
s o l d . The v a l u e o f t h e c o k e was s e t u s i n g t h e A G A - D O E g u i d e l i n e s f o r g a s i f i e r c h a r s a s 7 5 % o f t h e f u e l v a l u e o f t h e f e e d c o a l : i n t h i s c a s e , $0.50/MM B t u .
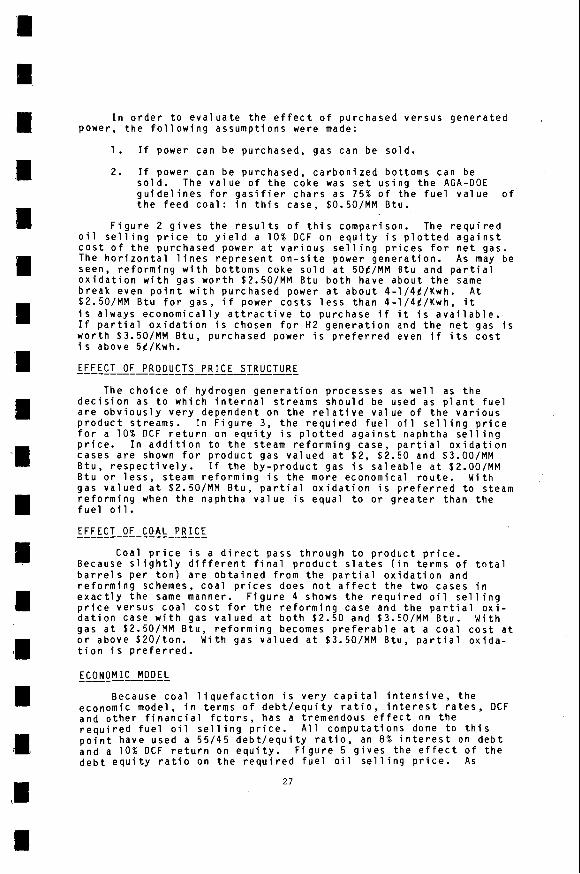
F i g u r e 2 g i v e s t h e r e s u l t s o f t h i s c o m p a r i s o n . The r e q u i r e d o i l s e l l i n g p r i c e t o y i e l d a 1 0 % DCF o n e q u i t y i s p l o t t e d a g a i n s t c o s t o f t h e p u r c h a s e d p o w e r a t v a r i o u s s e l l i n g p r i c e s f o r n e t g a s . The h o r i z o n t a l l i n e s r e p r e s e n t o n - s i t e p o w e r g e n e r a t i o n . As may be s e e n , r e f o r m i n g w i t h b o t t o m s c o k e s o l d a t 50t /MM B t u a n d p a r t i a l o x i d a t i o n w i t h g a s w o r t h $2.50/MM B t u b o t h h a v e a b o u t t h e same b r e a k e v e n p o i n t w i t h p u r c h a s e d p o w e r a t a b o u t 4 - 1 / 4 t / K w h . A t $2.50/MM B t u f o r g a s , i f p o w e r c o s t s l e s s t h a n 4 - 1 / 4 t / K w h , i t i s a l w a y s e c o n o m i c a l l y a t t r a c t i v e t o p u r c h a s e i f i t i s a v a i l a b l e . I f p a r t i a l o x i d a t i o n i s c h o s e n f o r H 2 g e n e r a t i o n and t h e n e t g a s i s w o r t h $3.50/MM B t u , p u r c h a s e d p o w e r i s p r e f e r r e d e v e n i f i t s c o s t i s a b o v e 5 f / K w h .
EFFECT OF PRODUCTS P R I C E STRUCTURE
T h e c h o i c e o f h y d r o g e n g e n e r a t i o n p r o c e s s e s as w e l l as t h e d e c i s i o n a s t o w h i c h i n t e r n a l s t r e a m s s h o u l d be u s e d a s p l a n t f u e l a r e o b v i o u s l y v e r y d e p e n d e n t on t h e r e l a t i v e v a l u e o f t h e v a r i o u s p r o d u c t s t r e a m s . I n F i g u r e 3 , t h e r e q u i r e d f u e l o i l s e l l i n g p r i c e f o r a 1 0 % DCF r e t u r n on e q u i t y i s p l o t t e d a g a i n s t n a p h t h a s e l l i n g p r i c e . I n a d d i t i o n t o t h e s t e a m r e f o r m i n g c a s e , p a r t i a l o x i d a t i o n c a s e s a r e shown f o r p r o d u c t g a s v a l u e d a t $ 2 , $ 2 . 5 0 a n d $3.00/MM B t u , r e s p e c t i v e l y . If t h e b y - p r o d u c t g a s i s s a l e a b l e a t $L.OO/MM B t u o r l e s s , s t e a m r e f o r m i n g i s t h e m o r e e c o n o m i c a l r o u t e . W i t h g a s v a l u e d a t $2.50/MM B t u , p a r t i a l o x i d a t i o n i s p r e f e r r e d t o s t e a m r e f o r m i n g when t h e n a p h t h a v a l u e i s e q u a l t o o r g r e a t e r t h a n t h e f u e l o i l .
EFFECT OF COAL PRICE _____----I--__
C o a l p r i c e i s a d i r e c t p a s s t h r o u g h t o p r o d u c t p r i c e . B e c a u s e s l i g h t l y d i f f e r e n t f i n a l p r o d u c t s l a t e s ( i n t e r m s o f t o t a l b a r r e l s p e r t o n ) a r e o b t a i n e d f r o m t h e p a r t i a l o x i d a t i o n a n d r e f o r m i n g schemes, c o a l p r i c e s d o e s n o t a f f e c t t h e t w o c a s e s i n e x a c t l y t h e same manner . F i g u r e 4 shows t h e r e q u i r e d o i l s e l l i n g p r i c e v e r s u s c o a l c o s t f o r t h e r e f o r m i n g c a s e a n d t h e p a r t i a l o x i - d a t i o n c a s e w i t h g a s v a l u e d a t b o t h $2 .50 a n d $3.50/MM B t u . W i th g a s a t $2.50/MM B t u , r e f o r m i n g becomes p r e f e r a b l e a t a c o a l c o s t a t o r a b o v e $ Z O / t o n . W i t h g a s v a l u e d a t $3.50/MM B t u , p a r t i a l o x i d a - t i o n i s p r e f e r r e d .
E C O N O M I C MODEL
B e c a u s e c o a l l i q u e f a c t i o n i s v e r y c a p i t a l i n t e n s i v e , t h e e c o n o m i c m o d e l , i n t e r m s o f d e b t l e q u i t y r a t i o , i n t e r e s t r a t e s , DCF a n d o t h e r f i n a n c i a l f c t o r s , h a s a t r e m e n d o u s e f f e c t on t h e r e q u i r e d f u e l o i l s e l l i n g p r i c e . A l l c o m p u t a t i o n s done t o t h i s p o i n t h a v e u s e d a 5 5 / 4 5 d e b t l e q u i t y r a t i o , an 8% i n t e r e s t on d e b t a n d a 1 0 % DCF r e t u r n o n e q u i t y . F i g u r e 5 g i v e s t h e e f f e c t o f t h e d e b t e q u i t y r a t i o o n t h e r e q u i r e d f u e l o i l s e l l i n g p r i c e . As
27
w o u l d b e e x p e c t e d , i n c r e a s i n g d e b t r a t i o d e c r e a s e s t h e f u e l o i l p r i c e . T h e q u a n t i t a t i v e e f f e c t i s q u i t e p r o n o u n c e d i n t h a t a c h a n g e f r o m 4 0 t o 8 0 % d e b t d e c r e a s e s t h e f u e l o i l p r i c e b y a b o u t $ 2 . 5 D / B b l . F i g u r e 6 shows t h e e f f e c t o f r e q u i r e d D C F ' r e t u r n on e q u i t y on f u e l o i l s e l l i n g p r i c e . A g a i n t h e e f f e c t i s s i g n i f i c a n t a n d e x p e c t a b l y a l m o s t l i n e a r . An i n c r e a s e o f 2 % i n t h e r e q u i r e d r e t u r n on e q u i t y a t t h e 4 5 % e q u i t y l e v e l r a i s e s t h e r e q u i r e d o i l s e l l i n g p r i c e b y a b o u t $ 1 . 5 0 / B b l . These c o m p u t a t i o n s r e i n f o r c e t h e a s s e r t i o n s made b y many t h a t t h e c o n s t r u c t i o n o f t h e l i q u e f a c - t i o n p l a n t s i s s e n s i t i v e t o t h e t e r m s a n d c o n d i t i o n s o f f i n a n c i n g a n d t o t a x a t i o n p o l i c y .
c o ri c L us I ON
These s t u d i e s show t h e e c o n o m i c e f f e c t o f a number o f f a c t o r s w h i c h a r e s i t e s p e c i f i c . T h u s , t h e o v e r a l l p l a n t c o n f i r g u r a t i o n c a n n o t be f i n a l l y o p t i m i z e d u n t i l a r e a s o n a b l y f i r m l o c a t i o n i s s e l e c t e d .
A 600 t o n p e r d a y H-Coa l P i l o t P l a n t i s c u r r e n t l y u n d e r c o n s t r u c t i o n i n C a t l e t t s b u r g , K e n t u c k y . O p e r a t i o n i s s c h e d u l e d t o b e g i n i n t h e f i r s t q u a r t e r o f 1975 . The n o r m a l c o m m e r c i a l i z a t i o n p r o c e s s m i g h t w a i t u n t i l P i l o t P l a n t o p e r a t i o n s w e r e c o m p l e t e d b e f o r e m o v i n g ahead . H o w e v e r , t h e o p e r a t i o n s o n t h e 3 TPD P r o c e s s D e v e l o p m e n t U n i t h a v e c o n f i r m e d t h e o p e r a b i l i t y o f t h e b a s i c p r o - c e s s and t h e r e a l f u n c t i o n o f t h e P i l o t P l a n t i s e q u i p m e n t t e s t i n g a n d f i n e - t u n i n g o f t h e e n g i n e e r i n g . T h e r e f o r e , t h e commer- c i a l i z a t i o n p r o c e s s c a n b e a c c e l e r a t e d b y i m m e d i a t e l y b e g i n n i n g s u c h a c t i v i t i e s a s s i t e s e l e c t i o n , p e r m i t a c q u i s i t i o n a n d p r e l i m i - n a r y p r o c e s s d e s i g n . Changes t o t h e y i e l d s t r u c t u r e due t o t h e s c a l e d i f f e r e n c e b e t w e e n t h e P D U a n d P i l o t P l a n t w i l l p r o b a b l y n o t b e much g r e a t e r t h a n t h e y i e l d v a r i a t i o n o b s e r v e d i n d i f f e r e n t b a t c h e s o f c o a l f r o m t h e same seam. T h e r e f o r e , p r e l i m i n a r y e n g i - n e e r i n g c a n b e g i n i m m e d i a t e l y ; t h i s w o u l d r e d u c e t h e commer- c i a l i z a t i o n t i m e t a b l e b y a s much a s t w o y e a r s . I f s u c h a p r o c e d u r e i s f o l l o w e d , a c o m m e r c i a l H - C o a l p l a n t c o u l d b e o n s t r e a m b y 1983 .
ACKNOWLEDGMENTS
The a u t h o r s w i s h t o e x p r e s s t h e i r a p p r e c i a t i o n t o t h e D e p a r t m e n t o f E n e r g y , t h e E l e c t r i c Power R e s e a r c h I n s t i t u t e , A s h l a n d O i l , I n c . , S t a n d a r d O i l Company o f I n d i a n a , Conoco C o a l D e v e l o p m e n t Company, M o b i l O i l C o r p o r a t i o n a n d t h e Commonweal th o f K e n t u c k y , a n d t o t h e D y n a l e c t r o n C o r p o r a t i o n f o r s u p p o r t a n d a s s i s t a n c e i n t h e d e v e l o p m e n t o f t h e H-Coa l P r o c e s s .
REFERENCES
1 . "H-Coa l@ C o m m e r c i a l Eva1 u a t i o n " , b y F1 u o r E n g i n e e r s a n d
- ---______
C o n s t r u c t o r s , I n c . , E R D A C o n t r a c t No. 4 9 - 1 8 - 2 0 0 2 .
I I
I
I
I
im I I
28
I
I
I
u I
I
I
I
I
I
I
I
I
1 I
I
,I
I
FIGURE 1. S E N S I T I V I T Y TO CHANGES I N CAPITAL
19
18
17
16
15
14
13
75 100 125 PERCENT OF TOTAL CAPITAL INVESTMENT
FIGURE 2 . EFFECT OF PURCHASED POWER COST
0.03 0.04 0.05
COST OF PURCHASED POWER, $/KWH
29
FIGURE 3. EFFECT OF NAPHTHA PRICE AND BY-PRODUCT GAS ON THE ECONOMICS OF D I S T I L L A T E PRODUCTION
J m m 1 tft
CASE 1 - HYDROGEN PRODUCED BY P A R T I A L OXIDATION OF VACUUM BOTTOMS
CASE 2 - HYDROGEN PRODUCED BY STEAM REFORMING \ 16 18 20
NAPHTHA PRICE, $/BBL
FIGURE 4 . EFFECT OF COAL PRICE
2 2
22
21
20
19
18
17
16 ’ 15 20 2 5
COAL COST, $/TON
30
1 I
I
I 1 I
I
I
I
I
I
I
I
I
I
I I
I
I
I
I
I
I I
I
I
I
I
I
I
P
1 I (B
:I
'I
I !
I
I
-I
\ tFt
w
DI
a z J J W v)
J
0
m m
2 a
w
w
J m m -. * W 0
cf 0 a
-1 -1 W LC
-1
0
c
5
w
20
19
18
17
1 6
15
FIGURE 5. EFFECT OF DEBT/EQUITY R A T I O
40 60 80
PERCENT DEBT
FIGURE 6. EFFECT OF DCF RATE OF RETURN
1 6 I 10 1 2 14
PERCENT RETURN ON EQUITY (DCF)
31
TABLE I
RESULTS TO DATE OF ALL-DIST ILLATE
PRODUCTION C A S E S
B a s i s : 25 ,000 T/O c o a l t o h y d r o g e n a t i o n C o a l p r i c e = $ 1 5 / T o n , a s - r e c e i v e d 1 0 % DCF r e t u r n o n e q u i t y , 8 % i n t e r e s t o n d e b t O e b t / E q u i t y = 5 5 / 4 5 N a p h t h a v a l u e = f u e l o i l v a l u e B y - p r o d u c t g a s v a l u e = $2.50/MM B t u P o w e r g e n e r a t i o n on s i t e 1 9 7 6 p r i c e s u s e d f o r c a p i t a l e s t i m a t e s
Case 1 Case 2
I H y d r o g e n p r o d u c e d b y P a r t i a l O x i d a t i o n Steam R e f o r m i n g
P l a n t P r o d u c t s
N a p h t h a , B/D 35 ,700 D i s t i l l a t e f u e l o i l , B/D 27 ,200 Gas , MMM B t u / D (HHV) 7 0 T o t a l d e p r e c i a b l e c a p i t a l
A n h y d r o u s NH3, ST/D 245 Lump s u l f u r , LT /D 6 9 0
T h e r m a l e f f i c i e n c y , HHV, % 68.5
i n v e s t m e n t , SMM 1 1 8 0
C o n t r i b u t i o n t o T o t a l O i l S e l l i n g P r i c e , $ / B b l
C o a l R i v e r w a t e r C a t a l y s t a n d c h e m i c a l s L a b o r , s u p e r v i s i o n a n d
o v e r h e a d M a i n t e n a n c e I n s u r a n c e a n d t a x e s
T o t a l O p e r a t i n g C o s t
C a p i t a l - r e l a t e d e x p e n s e B y - p r o d u c t c r e d i t
T o t a l O i l S e l l i n g P r i c e
6.74 .12 .74
.66 1 .80 1.57
11.63
9.95 - 3.51
_--__
--__ 18 .07 --_
32,200 39 ,400 - - - 1 1 6 0 2 4 5 7 0 8
67.0
5.92 .09 .66
.63 1.56 1.35
10 .21
8 . 6 4 - .59
18.26
32
I
I
I , I
I b
I ii
i I
I I' I
I
I I
I
I
I
I
'1
ii
'I
(1 ' 'I I
1;1 1
,i 'I
1
TABLE I 1
S U M M A R Y OF PRODUCT PROPERTIES I N CASES STUDIED TO DATE
Case 1 P a r t i a l Case 2
S team R e f o r m i n q O x i d a t i o n
IBP-400 F N a p h t h a
A P I H i g h e r H e a t i n g V a l u e , MM B t u / B b l
400 -975 F D i s t i l l a t e
OAPI W t % S u l f u r H i g h e r H e a t i n g V a l u e , MM B t u / B b l
Vo lume %
400-650°F 650-975OF
Gas __ H i g h e r H e a t i n g V a l u e , B tu /SCF
__ C o m p o s i t i o n , V o l . %
"2 N2 C O c1
33
47.0 4 9 . 6 5.53 5 .50
21.3 1 3 . 5 0 .08 0.1 2 6 .13 6.31
89.6 10.4
1114 .0
28.8 2 .9 2.1
37.7 16 .0
7 . 8 4 . 1
100.0 ---
63.5 3 6 . 5
RECENT DEVELOPMENTS ON THE SMALL GASIFIER
ROBERT W. CULBERTSON STANLEY KASPER
DRAVO CORPORATION ONE OLIVER PLAZA
PITTSBURGH, PENNSYLVANIA 15222
During t h e y e a r s p r i o r t o World War 11, thousands of gas producers of t h e Wellman-Galusha type were u t i l i z e d i n t h e United S t a t e s t o convert c o a l t o low BTU gas . u t i l i t y and i n d u s t r i a l a p p l i c a t i o n s .
c o s t n a t u r a l gas t o eastern markets . The s m a l l g a s i f i e r could no longer com- p e t e and t h e s e i n s t a l l a t i o n s were closed u n t i l on ly t h r e e s t i l l opera te .
t o deregula te the p r i c e of n a t u r a l gas . It t h e r e f o r e appears t h a t t h e s m a l l g a s i f i e r may once aga in become competi t ive and could provide a s u b s t a n t i a l volume of i n d u s t r i a l f u e l g a s f o r use by American i n d u s t r y .
z a t i o n of low BTU gas i n i n d u s t r i a l a p p l i c a t i o n s . A t o t a l of six ( 6 ) p r o j e c t s were undertaken wi th p a r t i a l funding by t h e Federa l Government. Four commer- c i a l l y a v a i l a b l e s m a l l g a s i f i e r s a r e be ing u t i l i z e d :
These so c a l l e d "small g a s i f i e r s " produced gas f o r a l l types of
After World War 11, t h e gas t ransmiss ion system w a s expanded b r i n g i n g low
The energy b i l l p r e s e n t l y be ing worked on by Congress i n c l u d e s p r o v i s i o n s
In t h e s p r i n g of 1976, DOE i n i t i a t e d a program t o demonstrate t h e u t i l i -
1. The Wellman-Galusha Three ( 3 ) P r o j e c t s 2 . The STOIC One (1) P r o j e c t 3. The Wellman-Incandescent One (1) P r o j e c t 4 . The I G I One (1) P r o j e c t The c o a l s inc lude a n t h r a c i t e as w e l l as bi tuminous from Wyoming, Utah and
1. Fuel f o r b r i c k k i l n s . 2 . Boi le r feed f o r space h e a t i n g of campus b u i l d i n g s . 3. Boi le r feed f o r h e a t i n g and c o o l i n g of housing, shopping
c e n t e r s , s c h o o l s , i n d u s t r i a l park , e tc . 4 . B o i l e r feed f o r process s t e a m and spray dry ing of m i l k whey. 5. Fuel f o r tunnel k i l n s and dryers . 6. Fue l f o r an i n d u s t r i a l park. The range of gas c lean-up f o r t h e s e p r o j e c t s is : 1. Hot raw gas (no t rea tment a f t e r l e a v i n g g a s i f i e r ) . 2 . Gas t h a t has t a r and p a r t i c u l a t e s removed. 3 . G a s w i t h complete clean-up inc luding d e s u l f u r i z a t i o n . In a d d i t i o n t o t h e s e f e d e r a l l y funded p r o j e c t s s e v e r a l p r i v a t e l y funded
commercial p r o j e c t s have got ten underway. Le t ' s t a k e a d e t a i l e d look a t the " s m a l l g a s i f i e r " : Figure 1 shows t h e Wellman-Galusha g a s i f i e r . In a d d i t i o n t o t h e types mentioned above, o t h e r s m a l l g a s i f i e r s inc lude
This equipment i s a se l f -conta ined u n i t and r e q u i r e s no investment f o r
E a s t e r n Kentucky. The a p p l i c a t i o n s a r e :
Wi lput te and Riley Morgan.
a b o i l e r p l a n t when producing low BTU gas . Adequate p r o v i s i o n f o r steam f o r gas making is inc luded i n t h e engineer ing des ign of t h e p l a n t . s t o r a g e b i n s a r e provided as an i n t e g r a l p a r t o f t h e u n i t . This f i x e d bed gasi- f i e r opera tes a t a tmospher ic pressure .
t i o n i s a s t o r a g e b i n and is u s u a l l y f i l l e d by a bucket e l e v a t o r . compartment is s e p a r a t e d from t h e upper compartment by d i s c v a l v e s through which f u e l i s fed as requi red . S i m i l a r va lves cover t h e en t rance of each of t h e
Ample f u e l and ash
A two compartment f u e l b i n forms t h e t o p of t h e machine. The upper sec- The lower
I
I
I
I
I
1
I
I
i
I.
I:
I'
I.
I
I
I
I
I
I
I I
I
34
FIGURE 1. Wellman - Galusha Agitotor Type Gas Producer
35
heavy s t e e l p i p e s connec t ing t h e lower b i n t o t h e f i r e chamber, Fue l from t h e lower bin flows cont inous ly through t h e s e feed p ipes t o f i l l t h e f i r e chamber.
Fuel feed p i p e v a l v e s a r e normally open, b u t f o r b r i e f i n t e r v a l s they a r e c losed , d u r i n g which t i m e t h e upper va lves i n t h e lower compartment a r e open i n order to f i l l t h e f e e d i n g compartment wi th f u e l . A s imple i n t e r l o c k i n g mecha- nism prevents t h e opening of t h e upper v a l v e s u n l e s s a l l lower v a l v e s are t i g h t l y c losed . I t a l s o prevents opening any lower va lves whi le any t o p va lve i s open. This p r e v e n t s t h e escape of gas from t h e gas making chamber through t h e coal compartments t o t h e atmosphere.
The gas making chamber is completely water j a c k e t e d . Waste h e a t i n t h e water j a c k e t g e n e r a t e s steam requi red f o r making gas . Steam and a i r a r e i n t r o - duced a t t h e bottom o f t h e bed. The bed i s suppor ted by revolv ing g r a t e s through which dry a s h i s cont inous ly e j e c t e d t o t h e ash hopper.
c a l l y below t h e s u r f a c e of t h e f u e l bed, r e t a r d s channel ing and main ta ins a uniform f u e l bed. This f a c i l i t a t e s t h e product ion of uniform q u a l i t y gas .
Raw gas c o n t a i n i n g p a r t i c u l a t e s , tars, o i l s , hydrogen s u l f i d e , e tc . , leaves t h e g a s i f i e r at a temperature of between 800°F and 1250'F.
These s m a l l g a s i f i e r s a r e designed t o produce e i t h e r low BTU gas o r i n t e r - mediate BTU gas. and is produced by u s i n g a i r i n t h e g a s i f i e r . ing value of approximately 300 BTU/SCF and is produced by u s i n g oxygen i n t h e g a s i f i e r . ing value of approximately 1000 BTU/SCF.
s t e p s i n t h e manufacture of c lean gas from r e c e i p t of c o a l through s u l f u r re- moval.
systems. There a r e s i x t e e n (16) cases considered: l A , l B , 1 C and 1 D ; 2A, 2B, 2C and 2D; 5A, 5B, 5C and 5D; 10A, 10B, 1 O C and 10D. The numbers i n d i c a t e t h e number of g a s i f i e r s i n t h e p l a n t - one, two, f i v e o r ten . The let ters A , B, C and D r e f e r t o t h e type of g a s produced and t h e type and cos t o f c o a l used. Cases A and B are air-blown g a s i f i e r s which produce low BTU gas - about 150 BTU p e r cu. f t . Cases C and D are oxygen-blown g a s i f i e r s which produce medium BTU gas - about 300 BTU p e r cu. f t . ton is u t i l i z e d w h i l e i n cases B and D l o w s u l f u r coa l a t $35 p e r t o n is used.
The second l i n e of Table 1 shows t h e Coal Feed t o t h e system i n t o n s per day of s i z e d coa l (2" x 1-1/4"). Severa l t h i n g s should be noted: t h e e f f e c t of modules and t h e e f f e c t of t h e use of oxygen. and 1 0 g a s i f i e r c a s e s is 2, 5 and 10 t i m e s t h a t o f t h e comparable s i n g l e gas- i f i e r cases . When oxygen i s used i n s t e a d of a i r , t h e coa l feed (and r e s u l t a n t BTU conversion) is s u b s t a n t i a l l y increased - 132 tons p e r day v e r s u s 78 tOnS per day f o r t h e s i n g l e g a s i f i e r cases .
The informat ion r e l e v a n t to Gas Product ion i s shown on t h e next t h r e e lines of t h e Table: m i l l i o n s of s t a n d a r d cubic f e e t p e r day produced; t h e hea t ing v a l u e of t h e gases produced (158 BTU p e r cu. f t . air-blown and 285 BTU p e r cu. f t . f o r oxygen-blown); and t h e t o t a l BTU produced i n b i l l i o n s p e r day.
You w i l l n o t e t h a t a lmost 40% more BTU are produced f o r a given number of g a s i f i e r s by u s i n g oxygen i n s t e a d of air.
The next l i n e shows t h e l a n d a r e a requi red . based on s t o r i n g 30 days c o a l supply.
The l i n e "Total P l a n t Investment" i n c u r r e n t d o l l a r s , inc ludes c o a l s torage and handl ing , g a s i f i c a t i o n , p a r t i c u l a t e removal, tar removal, ash d is - p o s a l , and w a s t e w a t e r t rea tment and d i s p o s a l .
For Cases A and C (High S u l f u r Coal ) , s u l f u r removal f a c i l i t i e s are a l s o included. Cases C and D (Oxygen-blown G a s i f i e r ) , oxygen p l a n t s a r e requi red . In a l l c a s e s , T o t a l P l a n t Investment i n c l u d e s an Adminis t ra t ion and Maintenance
A s lowly r e v o l v i n g water cooled h o r i z o n t a l a r m , which a l s o s p i r a l s v e r t i -
Low BTU gas has a h e a t i n g v a l u e of approximately 150 BTU/SCF In termedia te BTU gas has a hea t -
For comparison purposes , n a t u r a l gas of p i p e l i n e q u a l i t y has a heat-
Figure 2 is a s i m p l i f i e d flow diagram showing t h e v a r i o u s process ing
Table 1 summarizes t h e c a p i t a l c o s t s and o p e r a t i n g c o s t s of smal l g a s i f i e r
In cases A and C high s u l f u r c o a l a t $25 per
The c o a l usage i n the 2 , 5 ,
These l a n d requirements are
P I
I
I 36
U
37
r t
Building, but excludes land c o s t s . u t i l i t i e s w i l l be purchased. Therefore , no c a p i t a l c o s t s a r e included f o r cool ing water, steam genera t ion and compressed a i r f a c i l i t i e s .
It i s expected t h a t S m a l l G a s i f i e r F a c i l i t i e s w i l l b e g e n e r a l l y l o c a t e d near an e x i s t i n g i n d u s t r i a l f a c i l i t y . t reatment f a c i l i t i e s w i l l e x i s t a s w e l l as s u i t a b l e o f f i c e space f o r adminis- t r a t i o n and maintenance f a c i l i t i e s . t h e d e l e t i o n of t h e s e items from T o t a l P l a n t Investment.
anyone cons ider ing b u i l d i n g a c o a l g a s i f i c a t i o n f a c i l i t y . They have been ca l - cu la ted on f o u r d i f f e r e n t bases . The f i r s t l i n e , ( I ) , r e s u l t s from use o f t h e U t i l i t y Financing Method a s o u t l i n e d in ERDA's Gas Cost Guide l ines . The c o s t s s t a t e d are average gas c o s t s and e n t a i l use of t h e fo l lowing parameters :
For a l l cases, i t i s assumed t h a t needed
Therefore , i n many c a s e s was te water
The l i n e Adjusted P l a n t Investment r e f l e c t s
The l a s t group of numbers, Estimated Gas Cos ts , a r e most s i g n i f i c a n t t o
1. 20-year p r o j e c t l i f e . 2. 20-year s t r a i g h t - l i n e d e p r e c i a t i o n on p l a n t investment ,
allowance f o r funds used dur ing c o n s t r u c t i o n and c a p i t a l i z e d p o r t i o n of s t a r t - u p c o s t s .
3. Debt-equity r a t i o of 75/25. 4. Percent i n t e r e s t on debt of 9 percent . 5. 6. Federa l income t a x rate o f 4 8 percent . ERDA maintenance c o s t s a r e p r o p o r t i o n a l t o t h e p l a n t s e c t i o n investment 1. 6 percent f o r c o a l feed p r e p a r a t i o n , c o a l g a s i f i c a t i o n , gas quench
2. 3 percent f o r s u l f u r recovery, product gas compression and dry ing ,
3. 1 percent f o r a l l o t h e r o f f s i t e s . We used 3 percent of t o t a l p l a n t investment as a s i m p l i f i c a t i o n . Included i n t h e t o t a l c a p i t a l requirements a r e : 1. Est imated i n s t a l l e d c o s t of bo th o n s i t e and o f f s i t e f a c i l i t i e s . 2 . P r o j e c t contingency at 15 percent of t h e es t imated c o s t of t h e
3. I n i t i a l charge of c a t a l y s t and chemicals . 4 . Paid-up r o y a l t i e s . 5. Allowance f o r funds used during cons t ruc t ion . 6. S ta r t -up c o s t s . 7. Working c a p i t a l . Operat ing c o s t s a r e based on a 90 percent p l a n t s e r v i c e f a c t o r .
1. Purchased u t i l i t i e s . 2 . Raw m a t e r i a l s 3. C a t a l y s t s and chemicals. 4 . Purchased water . 5. Labor. 6 . Adminis t ra t ion. 7. Suppl ies . 8. Local t a x e s and insurance . 9. Ash d isposa l . No c r e d i t is taken f o r byproducts such a s s u l f u r , t a r s , o i l s , etc. A s
P e r c e n t r e t u r n on equi ty of 1 5 percent a f t e r taxes.
and s o l i d s removal.
oxygen p l a n t , l i q u i d and s o l i d e f f l u e n t t r e a t i n g and water t r e a t i n g .
f a c i l i t i e s .
Included i n o p e r a t i n g c o s t s are:
s t a t e d above, i t i s assumed t h a t power, steam and water w i l l b e purchased. The cos t o f power i s 2.7C p e r KW hour. Steam c o s t i s assumed t o be $3.14 per 1000 pounds. Cooling water is 3 . 8 ~ per 1000 g a l l o n s and make-up water 4 0 ~ p e r 1000 ga l lons .
The gas c o s t s r e s u l t i n g from t h e s e c a l c u l a t i o n s range from $2.37 per m i l l i o n BTU f o r t h e 1 0 air-blown g a s i f i e r system t o $5.35 f o r t h e s i n g l e oxygen blown g a s i f i e r system. These gas c o s t s are based on t h e U t i l i t y F inancing )lethod and a r e s l i g h t l y d i f f e r e n t from t h e c o s t s which r e s u l t from i n c o r p o r a t i n g
39
commercial f i n a n c i n g c o n s i d e r a t i o n s and p r i v a t e i n v e s t o r r e t u r n requirements . The same parameters and method of c a l c u l a t i o n were used t o determine the
g a s c o s t s shown on t h e n e x t l i n e , (2 ) , Adjusted P l a n t Investment , U t i l i t y Financing. A s i n d i c a t e d above, t h e Adjusted Investment r e f e r s t o t h e d e l e t i o n of t h e Adminis t ra t ion Bui ld ing and Waste Water Treatment F a c i l i t i e s from t h e G a s i f i e r System. Costs f o r comparable c a s e s a r e s l i g h t l y reduced as expected.
Providing 100% e q u i t y w i t h z e r o r e t u r n on investment r e s u l t s i n sub- s t a n t i a l l y lower gas c o s t a s shown on l i n e (3 ) - t h e range of c o s t s is from $2.06 per mi l l ion BTU t o $4.45 p e r m i l l i o n B'F'LT.
With a d j u s t e d inves tment , t h e s e gas c o s t s are reduced even f u r t h e r as shown on l i n e ( 4 ) .
Some g e n e r a l conclus ions can b e drawn from t h e gas c o s t c a l c u l a t i o n s : 1. The l a r g e r t h e p l a n t , the lower t h e c o s t of t h e gas produced. 2. The c o s t of 150 BTU g a s is less than t h e c o s t of 300 BTU gas. 3. The c o s t of producing gas by t h i s s m a l l g a s i f i e r system is
lower than any o t h e r known technology. This has been sub- s t a n t i a t e d by s t u d i e s performed by Dravo on f a c i l i t i e s up to approximately 25 b i l l i o n BTU p e r day. I n d i c a t i o n s are t h a t t h e s m a l l g a s i f i e r is compet i t ive f o r f a c i l i t i e s of cons iderably h igher c a p a c i t i e s .
A l l of the c o s t s d i s c u s s e d so f a r have been appl ied t o t h e b a t t e r y l i m i t s of t h e g a s i f i e r f a c i l i t y .
When an e x i s t i n g p l a n t i s converted from u s e of n a t u r a l gas t o e i t h e r 300 BTU gas o r 150 BTU g a s changes must b e considered i n burners , f u e l gas p i p i n g , ins t ruments , f l u e gas p ip ing , compressors, forced and induced d r a f t f a n s , exhaust s tocks , etc. This is n e c e s s i t a t e d by t h e changes i n f u e l gas volume, f l u e gas volume and flame temperatures .
S p e c i a l p recaut ions must b e taken w i t h r e s p e c t t o t h e t o x i c i t y o f t h e gas produced. Both 150 BTU g a s and 300 BTU gas conta in l a r g e percentages of carbon monoxide which is c o l o r l e s s and odor less . The t o x i c e f f e c t s of t h i s gas depend on t h e concent ra t ion l e v e l and t i m e of exposure. The d i s t r i b u t i o n system, t h e r e f o r e , should i n c l u d e va lv ing and alarms a s w e l l as t h e use of an odorant .
c o s t s of producing t h e f u e l gas , b u t a l s o t h e c o s t s of adapt ing t h e e x i s t i n g p l a n t t o i t s use. The s m a l l g a s i f i e r should n o t b e considered t h e answer t o every c o a l g a s i f i c a t i o n problem. A s the s i z e of t h e f a c i l i t y i n c r e a s e s o t h e r processes such a s Lurg i , Koppers-Totzek and Babcock and Wilcox must be con- s i d e r e d . When second genera t ion technology has been proven those processes a l s o must be considered.
f o r many i n d u s t r i a l p l a n t s . The d i s t r i b u t i o n and r e t r o f i t c o s t s and t h e a p p l i c a t i o n s of t h e gas a l o n g wi th t h e b a t t e r y l i m i t s costs w i l l determine whether t h e gas produced should b e 150 BTU o r 300 BTU. up" of t h i s gas w i l l depend upon environmental r e g u l a t i o n s , process requirements and t h e coa l used.
The f e a s i b i l i t y s t u d y f o r a given a p p l i c a t i o n should inc lude not only t h e
A t the present t i m e , however, t h e s m a l l g a s i f i e r is a r e a l i s t i c answer
The degree of "clean-
40
I
8 I
D
P I
I
m I R I II
I
I I I I
B
THE ECONOMICS OF E L E C T R I C I T Y AND SNG FROX I N S I T U COAL G A S I F I C A T I O N
W. C. U l r i ch , >I. S . Edwards, and R. Salmon*
Abs t r ac t
Conceptual process des igns and c o s t e s t i m a t e s a r e p re sen ted f o r two p o t e n t i a l a p p l i c a t i o n s of underground c o a l g a s i f i c a t i o n : a 900 FllJ(e) combined-cycle e l e c t r i c gene ra t ing p l a n t f u e l e d by l o w Btu gas , and a s u b s t i t u t e n a t u r a l gas (SNG) p l a n t producing 155 ENscfd of 954 Btu/scf gas . ob ta ined a t t h e Laramie Energy Research Center on subbituminous c o a l u s ing the l i n k e d v e r t i c a l w e l l i n s i t u g a s i f i c a t i o n process . Respec t ive c a p i t a l investments were e s t ima ted t o be $395 and $351 m i l l i o n i n f i r s t - q u a r t e r 1977 d o l l a r s . c u l a t e d a s a f u n c t i o n of t h e deb t / equ i ty r a t i o , t h e annual ea rn ing r a t e s on d e b t and e q u i t y , t h e c o s t of c o a l , and p l a n t f a c t o r (onstream e f f i c i e n c y ) . Using a deb t / equ i ty r a t i o of 70/30, a n i n t e r e s t rate on deb t of 9 % , an a f t e r - t a x ea rn ing r a t e on e q u i t y of 15%. and a c o a l f eed c o s t of $5 / ton , product p r i c e s w e r e 24 m i l l s / kWh f o r e l e c t r i c i t y a t 70% p l a n t f a c t o r and $2.89/106 Btu f o r SNG a t 90% p l a n t f a c t o r . , C a l c u l a t e d o v e r a l l thermal e f f i c i e n c i e s f o r t h e two f a c i l i t i e s were 24 and 38% r e s p e c t i v e l y , based on in-place c o a l .
Designs were based on expe r imen ta l d a t a
Product p r i c e s were c a l -
I n t r o d u c t i o n
T h i s paper d e s c r i b e s two concep tua l p l a n t s designed f o r u t i l i z i n g g a s produced from a l i n k e d v e r t i c a l w e l l (LVN) i n s i t u c o a l g a s i f i c a t i o n p rocess and g i v e s r e s u l t s of economic eva lua t ions based on the designs. The two p l a n t s are a 900 IW(e) combined-cycle e l e c t r i c g e n e r a t i n g p l a n t f u e l e d by low-Btu gas , and a s u b s t i t u t e n a t u r a l gas p l a n t producing 155 PMscf/day of 954 Btu/scf gas .
d e s i g n c o a l is subbituminous. A i r i n j e c t i o n i s used f o r t h e low-Btu g a s case , and a steam/oxygen mix tu re f o r t h e SNG case .
each o t h e r , b u t a r e intended t o r e p r e s e n t two p o s s i b l e modes of u t i l i z a - t i o n of underground c o a l g a s i f i c a t i o n .
Th i s work was done f o r t h e O f f i c e of Program P lann ing and Analysis , DOE/Fossil Energy, and r epor t ed i n O R N L - 5 3 4 1 . (1)
The f a c i l i t i e s a r e assumed t o be loca ted i n sou the rn Wyoming. The
The two c a s e s p re sen ted h e r e a r e n o t eva lua ted as compe t i to r s with
Linked V e r t i c a l Well P rocess
There a r e s e v e r a l modes i n which t h e LVW process can be ope ra t cd for l a r g e - s c a l e g a s product ion. These d i f f e r e n t o p e r a t i o n a l modes a r i s e
* Work performed a t Oak Ridge Na t iona l Laboratory, Oak Ridge, TN 37830.
41
pr imar i ly from v a r i a t i o n s i n t h e w e l l sequencing p a t t e r n s used, and t h e d i r e c t i o n i n which t h e c o a l seam is g a s i f i e d r e l a t i v e t o t h e d i r e c t i o n of i n j e c t i o n gas and product gas flow. The system i l l u s t r a t e d by Fig. 1 is termed t h e d i r ec t - f low or forward system because t h e d i r e c t i o n of g a s i f i c a t i o n of t h e c o a l seam i s t h e same as t h e d i r e c t i o n i n which t h e i n j e c t i o n g a s and product gas t r a v e l . (2) The w e l l sequencing p a t t e r n t h a t develops i s s u c h t h a t each borehole is used s u c c e s s i v e l y f o r l i n k - i n g , product ion, and i n j e c t i o n .
gas . g a s c o n s i s t i n g of n m i x t u r e of steam and oxygen, i n which case t h e product would be a n intermediate-Btu (200 t o 400 B t u / s c f ) gas .
Laramie Energy Research Center (LERC) t o be used f o r development of t h e f i e l d a r e a s of t h e concep tua l p l a n t des igns evaluated i n t h i s r e p o r t . It should be p o i n t e d o u t t h a t l a rge - sca l e o p e r a t i o n of t h i s system has n o t y e t been demonstrated a t LERC, al though i t was used by t h e Russians a t t h e Podmoskovnaya and Shatskaya underground c o a l g a s i f i c a t i o n s t a t i o n s . I n LERC t e s t s t o d a t e , r e v e r s e combustion l i n k i n g has been fol lowed by a i r i n j e c t i o n f o r forward g a s i f i c a t i o n through t h e same w e l l used f o r t h e l i n k i n g a i r i n j e c t i o n . demonstrated by LERC, b u t a three-day i n j e c t i o n a t Hoe Creek by Lawrence Livermore Labora to ry (LLL) subsequent t o a i r i n j e c t i o n w a s s u c c e s s f u l . LERC and LLL work h a s been completed thus f a r only i n two-well systems.
I f air is i n j e c t e d , t h e product is a low-Btu (100 t o 200 B tu / sc f ) The LVW p r o c e s s i s a l s o p o t e n t i a l l y capable of u s i n g an i n j e c t i o n
The procedure shown i n F ig . 1 vas suggested by r e s e a r c h e r s a t t h e
Steam-oxygen i n j e c t i o n has n o t y e t been
P r o c e s s Deqcr ip t ions and Flow Diagrams
The p l a n t s a r e d iv ided i n t o t h r e e major p a r t s : (1) f i e l d develop- ment, (2) g a s t r a n s f e r p ip ing , and (3) main p l a n t . Well d r i l l i n g and g a s i f i c a t i o n o p e r a t i o n s a r e c a r r i e d out i n t h e f i e l d development a r e a s . The gas t r a n s f e r p i p i n g systems, which may be a m i l e or two i n l e n g t h , connect t h e f i e l d development a r e a s with t h e main p l a n t a r e a s . The main p l a n t a r e a s c o n t a i n t h e major gas t r e a t i n g process u n i t s , power p l a n t s , and u t i l i t i e s sys t ems r equ i r ed t o form complete, s e l f - s u f f i c i e n t f a c i l i t i e s .
Low-Btu G a s Combined-Cycle E l e c t r i c Generat ing P l a n t Case
For t h i s c a s e , t h e raw low-Btu gas from t h e w e l l s is c l eaned , com- pressed, and burned in gas t u r b i n e s connected to e l e c t r i c a l g e n e r a t o r s . Hot exhaust g a s e s from t h e t u r b i n e s a r e d i r e c t e d to heat-recovery b o i l e r s t o gene ra t e 1000 psig/100O0F steam which d r i v e s t u r b i n e g e n e r a t o r s f o r a d d i t i o n a l e l e c t r i c i t y product ion.
A t des ign throughput [900 MW(e)], 48 producing w e l l s a r e on-l ine. These 48 w e l l s are a r r anged i n s i x p a r a l l e l t r a i n s of e i g h t w e l l s each. Each t r a i n r e q u i r e s e i g h t i n j e c t i o n we l l s and e i g h t l i n k i n g w e l l s , so t h a t . a t r a i n c o n s i s t s of a t o t a l of 24 w e l l s .
F i e l d development p l a n I n i t i a l p roduc t ion s t a r t s with o n l y one t r a i n of w e l l s . The remain-
i n g f i v e t r a i n s a r e brought on-l ine a t i n t e r v a l s of roughly two weeks. A w e l l has a producing l i f e t i m e of about 73 days. As each row of w e l l s i s exhausted, t h e t r a i n is moved t o the nex t ad jacen t row. For a g iven t r a i n , t hese moves o c c u r a t 12-week i n t e r v a l s . S ince t h e r e a r e s i x t r a i n s , a move t a k e s p l a c e every two weeks. t r a i n i s brought on s t r eam, t h e f i r s t t r a i n i s s h u t down.
S h o r t l y a f t e r t h e s i x t h During t h e
I
I I a
I 8 I
m
4 2
ensuing 14 days, the field equipment and piping used by the first train are disconnected, moved, and reconnected to the next row of wells, and production from this train is resumed. Each of the six trains follows this same cyclic pattern of relocation.
Process flow description Figure 2 shows the block flow diagram for the electricity gener-
ating case. The facility consists of the following sections:
Plant Section No. Process Unit 1 Field development area
2 Raw gas gathering and gasification air transfer piping
Heat exchange and raw gas scrubbing 3 Stretford sulfur plant
Electric generating plant
Stack, cooling towers, water plant, waste water treating, and oil re- covery plants
Compressed air is piped from the main plant area about one mile to the field development area, where it is injected into the coal seam. Air for the linking process is supplied by a mobile field-located compressor.
sulfur-bearing compounds before being burned to generate electricity. The raw gas is cooled by humidification to condense about 90% of the o i l , which is transferred to an oil recovery system, and is cleaned of remaining particulate matter and oil in venturi scrubbers. raw gas is cooled before going to Stretford treating plants, where the H2S content is reduced to less than 100 ppm by volume.
heated by exchange with the raw gas, burned, and expanded through gas turbines which drive the electric generators, combustion air compressors, and fuel gas compressors. i s provided by the gas turbine generators. vided by steam turbines using waste heat from the exhaust gases. of the steam is used to drive the gasification air compressors and other auxiliary equipment.
Design of the combined-cycle electric generating plant is based on information appearing in Energy Conversion Alternatives Studies (ECAS) reports. ( 3 ) ( 4 ) This was supplemented by information supplied for a similar system which was proposed for use with low-Btu gas. (5) The resulting combined-cycle plant developed for this evaluation was assumed to have a net efficiency of 42%.
Raw gas is piped to the main plant area for cleaning and removal of
The scrubbed
Treated gas (fuel gas) from the Stretford units is compressed,
About 2 / 3 of the electric generating capacity The remaining 1 / 3 is pro-
Part
Substitute Natural Gas (SNG) Production Case
In the SNG case, raw intermediate-Btu gas from the wells is cleaned, compressed, and fed to CO shift reactors to adjust the CO/H2 ratio for the methanation reaction. resulting sweet gas is methanated, compressed, and dried to final product specifications.
After shifting, H2S and Cot are removed. The
63
A t des ign throughput (155 MMscf/day of 954 Btu/scf gas) 60 producing wells are on l i n e . These a r e a r ranged i n s i x p a r a l l e l t r a i n s of 10 wells each. Each t r a i n a l s o r e q u i r e s 10 i n j e c t i o n wells and 10 l i n k i n g w e l l s , s o t h a t a t r a i n c o n s i s t s of a t o t a l of 30 wells. The arrangements of t r a i n s i n a f i e l d development a r e a and of t h e i n j e c t i o n , l i n k i n g , and producing w e l l s f o r a s i n g l e t r a i n are similar t o those of t h e e lec t r ic i ty gene ra t ing case. F i e l d development a l s o i s s i m i l a r .
P rocess f low d e s c r i p t i o n F igure 3 shows the b lock flow diagram f o r t h e SNG case .
c o n s i s t s of t h e f o l l o w i n g sec t ions : The p l a n t
P l a n t S e c t i o n No.
1
2
3
4
5
6
7 8
9
10
11
Process Uni t
F i e l d development area
Raw g a s ga the r ing , oxygen, and steam t r a n s f e r p ip ing
Heat exchange and raw gas scrubbing
CO s h i f t
Oxygen p l a n t
Benf i e ld HiPure p l a n t
Methanation
Fue l gas t r e a t i n g
S t r e t f o r d s u l f u r p l a n t
O i l r ecovery and was te water t r e a t i n g
Steam gene ra to r and o f f s i t e s
Oxygen and steam are piped s e p a r a t e l y from t h e main p l a n t t o t h e f i e l d . The oxygen and s team are mixed a t t h e wel lheads f o r i n j e c t i o n i n t o t h e c o a l s e a m .
Raw gas is p iped to t h e main p l a n t area, cooled by h e a t exchange, humidi f ied , and scrubbed as i n t h e p rev ious case.
Af t e r s c rubb ing , the r a w gas is sepa ra t ed i n t o two streams. One s t r eam goes t o a DEA t r e a t i n g u n i t f o r a c i d gas removal and subsequent u s e a s a f u e l gas . The o t h e r stream is cooled and compressed t o 450 p s i a f o r f u r t h e r p r o c e s s i n g i n t o SNG product .
and s e n t t o t h e CO s h i f t u n i t , where i t is s h i f t e d t o an Hz/CO r a t i o of about 3 . A f t e r h e a t r ecove ry and coo l ing t h e s h i f t e d gas goes t o t h e Benf i e ld HiPure u n i t . S t r e t f o r d s u l f u r p l a n t .
z i n c oxide guard beds , which remove t h e l as t t r a c e s of HzS.
r e a c t o r s . Reac t ion t empera tu re is c o n t r o l l e d by a combination of h e a t r ecove ry and ho t p roduc t gas r e c y c l e .
a t r i e t h y l e n e g l y c o l d r y i n g u n i t t o meet p i p e l i n e g a s s p e c i f i c a t i o n s .
Af t e r compression, t h e gas i s hea ted by exchange wi th t h e raw g a s
Acid gas from t h e Benf i e ld u n i t is p iped t o t h e
Trea ted gas from t h e Benf ie ld u n i t i s hea ted and proceeds through
Nethanat ion i s c a r r i e d o u t i n a series of t h r e e fixed-bed c a t a l y t i c
Af t e r me thana t ion , t h e gas i s cooled , compressed, and dehydra ted i n
44
U t i l i t i e s Systems
The major u t i l i t i e s systems f o r t h e two p l a n t s i nc lude steam, e l e c t r i c power, f u e l gas and o i l , and coo l ing water . U t i l i t i e s genera- t i o n and consumption a r e summarized i n Table l.
Table 1. U t i l i t i e s summary
E l e c t r i c i t y g e n e r a t i o n casea SNG c a s e
Steam ( l b / h r ) 1,032,500 3,668,700 E l e c t r i c i t y (kW) 21,000 47,000
Purchased wa te r (gpm) 4,350 5,430 A i r coo l ing l o a d (MMBtu/hr) 550 2,260
Fue l gas and o i l (mfBtu/hr) - 3,710
% t i l i t i e s consumed i n t h e combined-cycle gene ra t ing p o r t i o n of t h e f a c i l i t y a r e no t included he re .
I n t h e e l e c t r i c i t y gene ra t ing case , t h e g a s i f i c a t i o n a i r compressors consume about 10% of t h e t o t a l energy produced by t h e f a c i l i t y . An a d d i t i o n a l 5% i s used t o meet o t h e r p l a n t requirements . requirements were es t ima ted t o b e about 21 MW.
A l l o t h e r u t i l i t i e s r e q u i r e d by t h e f a c i l i t i e s a r e generated on site. P rocess coo l ing is provided both by a i r and water cool ing. towers were used based on t h e assurnption t h a t adequate wa te r supply (about 5000 gpm) would be a v a i l a b l e . w i l l n o t b e a v a i l a b l e , o i l w i l l b e used.
P l a n t e l e c t r i c i t y
I n both c a s e s , f r e s h water (raw water) is assumed t o be purchased.
Wet c o o l i n g
During s t a r t - u p s when f u e l g a s
O v e r a l l Thermal E f f i c i e n c i e s
O v e r a l l thermal e f f i c i e n c i e s f o r t h e conversion of c o a l t o elec- t r i c i t y and SNG a r e shown i n Tab le 2. E f f i c i e n c i e s were c a l c u l a t e d a s t h e h i g h e r h e a t i n g v a l u e of t h e p roduc t s divided by t h e h i g h e r h e a t i n g v a l u e of t h e in -p lace c o a l . e l e c t r i c i t y produced was c r e d i t e d a t 3413 Btu/kWh. for SNG was taken a t 60'F. No thermal c r e d i t was taken f o r by-product s u l f u r .
I n t h e low-Btu gas combined-cycle c a s e , t h e The h e a t i n g v a l u e
Table 2. Overa l l thermal e f f i c i e n c i e s
Overa l l thermal Product e f f i c i e n c y (%)
E l e c t r i c i t y 24 SNG 38
45
B a s i s f o r Design and Process Assumptions
The des ign b a s i s f o r t h e l i nked v e r t i c a l w e l l (LVGI) p rocess was developed from exper imenta l r e s u l t s ob ta ined a t t h e Laramie Energy Research Center (LERC). F i e ld t e s t Hnnna 11, Phase I1 was used as t h e b a s i s f o r o p e r a t i n g cond i t ions and y i e l d s f o r t h e e l e c t r i c i t y gene ra t ing case . Th i s t e s t was conducted i n the Hanna No. 1 seam of subbituminous c o a l a t Hanna, Carbon County, Wyoming. Because of the l a c k of publ i shed exper imenta l d a t a f o r t h e steam-oxygen i n j e c t i o n p rocess , t h e b a s i s f o r ope ra t ing c o n d i t i o n s and y i e l d s f o r t h i s mode of g a s i f i c a t i o n was a l i n e a r permeation mathematical model of forward combustion which was developed a t LERC. ( 6 - 8 ) Table 3 shows t h e process des ign parameters developed f o r t h e two cases .
Table 3. LVW g a s i f i c a t i o n process des ign parameters
Parameters common t o low-Btu and SNG cases
Type of c o a l Seam t h i c k n e s s Depth of s e a m Well p a t t e r n and spac ing G a s i f i c a t i o n r e a c t i o n zone
Process sweep e f f i c i e n c y Process the rma l e f f i c i e n c y Overa l l p rocess e f f i c i e n c y Raw gas wel lhead tempera ture Linking a i r i n j e c t i o n p res su re Linking a i r i n j e c t i o n r a t e Reverse combustion l i n k i n g r a t e
advance rate
Subbituminous (Hanna No. 1 seam) 30 f t 300 f t Square; 150 f t x 150 f t 2 f t / d a y
80% 80% 64% 640'F 1 p s i g f f t o€ depth 33,000 s c f f f t of l i n k 7 f t f d a y
Parameters a p p l i c a b l e t o low-Btu gas case
S ing le w e l l p roduct ion r a t e 30 MMscfd A i r i n j e c t i o n requirement Dry gas p roduced /a i r i n j e c t e d
73,570 s c f / t o n maf c o a l 1.45 s c f l s c f
Parameters a p p l i c a b l e t o SNG case
S ing le w e l l p roduct ion r a t e 17 MMscfd Steam/oxygen i n j e c t i o n gas
Steam + 02 i n j e c t i o n requirement Dry raw gas produced/steam + 0 2 1.92 s c f l s c f
60/40 mole %
23,270 s c f f t o n maf c o a l composi t ion
i n j ec t ed
C a p i t a l Inves tments
Estimated t o t a l c a p i t a l inves tments f o r t h e two conceptua l f a c i l i - The c a p i t a l inves tments do n o t i nc lude t i e s a r e summarized i n Table 4.
t h e cos t of t h e c o a l (o r land and minera l r i g h t s ) r equ i r ed f o r t h e f a c i l i t i e s . Coal is charged t o t h e f a c i l i t i e s a s a raw m a t e r i a l as p a r t o f t he o p e r a t i n g c o s t s . The c o s t , i n $ / t o n , is t r e a t e d as a v a r i a b l e i n t h e economic c a l c u l a t i o n s .
46
Table 4 . C a p i t a l inves tment summary
C a p i t a l Investment, $10' C a p i t a l investment f o r p l a n t s e c t i o n s 900 m ( e ) p l a n t SNG p l a n t
S i t e development I n i t i a l d r i l l i n g c o s t s F i e l d g a s t r e a t i n g p l a n t F i e l d p ip ing system Raw gas t r e a t i n g p l a n t CO s h i f t p l a n t Oxygen p l a n t Benf ie ld p l a n t Methanat i on p l a n t Fue l gas t r e a t i n g p l a n t S t r e t f o r d p l a n t E l e c t r i c gene ra t ing p l a n t Tankage, o f f s i t e s , u t i l i t i e s T o t a l f o r p l a n t s e c t i o n s
Capi ta l inves tment f o r f a c i l i t y
Engineer ing Cons t ruc t ion overhead Cont ingencies Con t rac to r ' s f e e Spec ia l .charges T o t a l f o r f a c i l i t y
1.8 1.3 8.6
11.3 17.2 - -
- 6.5
255.7 10 .6
313.0 -
8.1 7.6
32.7 9.8
23.8 82.0 - __ -
2.1 1.6
11.1 20.3 19.0 28.5 81.5 17.9 28.1
6.7 4.8 -
43.5 265.1
12.9 16.5 29.3 8.8
18.7 86.2 -
T o t a l c a p i t a l inves tment 395.0 351.3
I n i t i a l w e l l d r i l l i n g and p r e p a r a t i o n work which occur s du r ing t h e p l a n t c o n s t r u c t i o n pe r iod is inc luded i n p l a n t c a p i t a l c o s t s . A f t e r t h e p l a n t i s s t a r t e d up, t h i s c o s t i s inc luded as an ope ra t ing charge .
A l l c o s t s g iven he re are re fe renced t o first q u a r t e r 1977 and are expressed i n f i r s t q u a r t e r 1977 d o l l a r s .
Opera t ing Costs
Operating c o s t s i n c l u d e raw m a t e r i a l s , c a t a l y s t s and chemica ls , w a t e r , o t h e r ope ra t ing s u p p l i e s and m a t e r i a l s , maintenance mater ia ls and l a b o r , o p e r a t i n g l a b o r and supe rv i s ion , and gene ra l and a d m i n i s t r a t i v e overhead. They do not i n c l u d e d e p r e c i a t i o n ( recovery of c a p i t a l ) , i n t e r e s t on d e b t , r e t u r n on inves tment , or t a x e s , which are accounted f o r i n t e r n a l l y by t h e o v e r a l l economics program. b u t i o n c o s t s were n o t inc luded .
v a r i e d p a r a m e t r i c a l l y from 0 t o $lO/ton.
w e l l s once pe r q u a r t e r . l a b o r c o s t s f o r t h e i n i t i a l i n s t a l l a t i o n . Add i t iona l q u a r t e r l y c o s t s f o r l a b o r and equipment used i n moving f i e l d systems were $120,000 and $135,720 i n t h e e l e c t r i c i t y gene ra t ing and SNG cases , r e s p e c t i v e l y .
Marketing and d i s t r i -
The in-p lace c o a l c o s t , i n $ / t o n , was t r e a t e d as a v a r i a b l e and w a s
F i e l d equipment moving expenses a r e based on moving each t r a i n of The moving c o s t v a s e s t ima ted from material and
47
Operating c o s t b a s e s a r e summarized i n Table 5 . Other assumptions
* PlanL o p e r a t i n g l i f e t i m e : 20 y e a r s used a r e as fo l lows:
Cons t ruc t ion p e r i o d (pre-opera t iona l pe r iod ) : 2 y e a r s Working c a p i t a l is 12% of f ixed c a p i t a l investment.
* Maintenance i s 4% of d e p r e c i a b l e c a p i t a l p e r year . * P l a n t f a c t o r (ope ra t ing f a c t o r ) i s 70% f o r e l e c t r i c gene ra t ing
p l a n t , 9OZ f o r SNC p l a n t . * Direct l a b o r rate is $8.25/hr.
Labor burden i s 35% of d i r e c t l a b o r . * Superv is ion is 15% of l a b o r p l u s l a b o r burden. * Opera t ing s u p p l i e s are 30% of d i r e c t ope ra t ing l a b o r . * Overhead i s 135% of l a b o r p l u s supe rv i s ion . - F e d e r a l income t a x rate is 48%. - S t a t e income t a x r a t e is 3X. * Local t a x e s and i n s u r a n c e are 3% of c a p i t a l p e r yea r .
Coal
Tab le 5. Opera t ing c o s t b a s i s
Low-Btu Gas
Coal used ( in-p lace b a s i s ) at 100% p l a n t f a c t o r :
tons /day l o 6 t ons /y r
D r i l l i n g : Depth o f h o l e s ( f t ) D r i l l i n g c o s t ($/f$) Number of w e l l s / y r
blen/shif t Opera t ing l abor :
C a t a l y s t s and chemica ls a t 100% p lan t f a c t o r :
By-product s u l f u r : (lo6 S/y r )
( long tons /day)
18,073 6.60
300 30
144/212/100
48
0.217
29
SNG -
22,951 8.25
300 30
180/270/l50
45
4.235
38
aF ina l yea r of c o n s t r u c t i o n / f i r s t through nex t - to - l a s t o p e r a t i n g y e a r / l a s t o p e r a t i n g y e a r .
Economic Ana lys i s
P r i c e s of e l e c t r i c i t y and SNG were c a l c u l a t e d a s a func t ion of c o a l c o s t and annua l a f t e r - t a x rate of r e t u r n on e q u i t y c a p i t a l . done by t h e d i scoun ted c a s h f low procedure for two c a p i t a l s t r u c t u r e s , 100% e q u i t y and 70/30 deb t / equ i ty . Annual a f t e r - t a x r a t e of r e t u r n on e q u i t y w a s t r e a t e d a s a parameter u s i n g rates of r e t u r n of 10, 1 2 , 15, and 1 7 % . Annual i n t e r e s t rate on deb t reas assumed t o be 9%. c r e d i t v a s i nc luded f o r s u l f u r a t $60/long t o n . used for t h e s e c a l c u l a t i o n s . (9 )
T h i s was
By-product A computer program was
48
The r e s u l t i n g product p r i c e s a r c h igh ly dependent on t h e c a p i t a l s t rucLure and p l a n t f a c t o r . Fig. 4.
Typica l examples are shown i n Table 6 and
b Table 6. Es t imated product p r i c e s a a t 15% r e t u r n on e q u i t y and 9% annual i n t e r e s t r a t e on deb t
Product p r i c e f o r e l e c t r i c i t y Product p g i c e Coal from low-Btu gasC f o r SNG P r i c e (mi l l s /k l Jh j ($ / lo6 Btu)
($ / ton) 100% e q u i t y 70/30 D/E 100% equ i ty 70/30 D/E
0 5
10
31.4 35.6 40.0
19.4 23.6 27.7
3.34 2.13 4.11 2.89 4.87 3.66
aProduct t r a n s p o r t a t i o n , d i s t r i b u t i o n , and marke t ing c o s t s are n o t i nc luded .
bAnnual a f t e r - t a x ra te of r e t u r n on equ i ty .
'70% p l a n t f a c t o r .
d g ~ % p l a n t f a c t o r .
References
1.
2.
3.
4.
5 :
6.
7.
a.
9.
w. C. U l r i ch , El. S. Edwards, and R. Salmon, P rocess Designs and Economic Eva lua t ions f o r t h e Linked V e r t i c a l Well I n S i t u Coal G a s i f i c a t i o n Process ; ORVL-5341 ( t o be i s sued) .
P. V. Skafa, "Underground G a s i f i c a t i o n of Coal," UCRL TWS-10880, pp. 334-42.
D. H. Brown, e t a l . , Energy Conversion A l t e r n a t i v e s Study (ECAS), General E l e c t r i c Phase 1, Vol. 2 , P a r t 1. NASA-CR-134948-Vol. 2, P t . 1, prepared by Genera l E l e c t r i c Company, February , 1976, p. 49.
D. J. Amos, et a l . , Energy Conversion A l t e r n a t i v e s Study (ECAS), Westinghouse Phase 1, Vol. 5. NASA-CR-134941-Vol. 5, p repared by Westinghouse Research Labora to r i e s , February 12 , 1976.
Pau l Berman, Westinghouse E l e c t r i c Corpora t ion , P h i l a d e l p h i a , Pa., pe r sona l communication t o I{. C. U l r i c h , June 15, 1977.
R. D. Gunn, D . D. F i s c h e r , and D. L. Whitman, "The P h y s i c a l Behavior of Forward Combustion i n t h e Underground G a s i f i c a t i o n of Coal," presented a t t h e 51st Annual Techn ica l Conference, Soc ie ty of Petroleum Engineers , N e w Or leans , October 3-6, 1976.
R . D. Gunn, LERC, pe r sona l communication t o W. C. Ulr i ch , May 1 2 and May 17 , 1977.
R. D. Gunn, LERC, pc r sona l communication t o R. Salmon, J u l y 5, 1977.
R. Salmon, "PKP - A Discounted Cash Flow Program f o r C a l c u l a t i n g t h e Product ion Cost (Product P r i c e ) of t h e Product from a Process P lan t , " ORNL-5251, Elarch 1977.
49
Fig . 1 . .S tages i n the f i e l d development of the l inked vertical w e l l process
COUPRESSCD AIR
1% 5 l l U C O I L
CASIFlCATI0:I 5CRUIIS1115 COVPPESS,ON
F i g . 2 . Block flow diagram for e l e c t r i c i t y generating case
50
.,...-.. .,..
Fig . 3 . Block f l o w diagram for SNG c a s e
F i g . 4 . E l e c t r i c power and SNG c o s t s
51
ECONOMICS OF PRODUCING AMMONIA FROM COAL BY PRESSURIZED ENTRAINED AND KOPPERS-TOTZEK GASIFICATION
W i l l i a m C. Morel and Yong J a i Y i m '
U.S. Department o f Energy Process E v a l u a t i o n O f f i c e
P.O. Box 863, Morgantown, WV 26505
The demand f o r f e r t i l i z e r w i l l s t e a d i l y inc rease as the w o r l d p o p u l a t i o n cont inues t o grow a t a r a p i d r a t e . A lmost a l l n i t r o g e n f e r t i l i z e r i s d e r i v e d from ammonia. Natu- r a l gas i s t he raw m a t e r i a l used t o produce a lmost a l l the ammonia i n the U n i t e d Sta tes , b u t i t s a v a i l a b i l i t y f o r i n d u s t r i a l use w i l l decrease s i g n i f i c a n t l y i n the f u t u r e . Domes- t i c consumption o f n a t u r a l gas w i l l have t o p p r i o r i t y e s p e c i a l l y d u r i n g the w i n t e r months. By 1990 the present a d m i n i s t r a t i o n s p lans t o phase o u t n a t u r a l gas f o r i n d u s t r i a l use. There fore , a s u b s t i t u t e raw m a t e r i a l f o r ammonia p r o d u c t i o n w i l l be needed t o supplement and e v e n t u a l l y rep lace n a t u r a l gas. Coal, o u r r i c h e s t f o s s i l energy resource, w i l l make a s t r o n g b i d t o r e p l a c e n a t u r a l gas.
d e r i v e d n i t r o g e n , based on a 1,000-ton-per-day c a p a c i t y , i s presented. g a s i f i c a t i o n systems f o r p roduc ing t h e hydrogen requ i rement a r e compared--one t h a t oper- a tes a t 30 atmospheres,2 and t h e o t h e r , Koppers-Totzek, a commerc ia l l y a v a i l a b l e system, t h a t opera tes a t a s l i g h t l y h i g h e r than atmospher ic pressure. No. 6 and Montana subbi tuminous--were cons idered f o r each system. on January 1977 c o s t indexes. Average s e l l i n g p r i c e s o f t he ammonia were determined by u s i n g d iscounted cash f l o w (DCF) r a t e s o f 12, 15, 20 percent a t v a r i o u s coa l cos ts . No i n f l a t i o n f a c t o r s a re i n c l u d e d d u r i n g t h e l i f e o f t h e p l a n t . P o l l u t i o n abatement consid- e r a t i o n s have been i n c o r p o r a t e d . Some o f t h e economic and techn ica l d e t a i l s a re inc luded f o r t h e two systems.
ENTRAINED GASIFICATION AT 30 ATMOSPHERES
I n t h e system, hydrogen r e q u i r e d i n the ammonia s y n t h e s i s w i t h n i t r o g e n i s p re -
1.
2.
3.
4.
An economic eva lua t i on , o f ammonia p r o d u c t i o n f rom c o a l - d e r i v e d hydrogen and a i r - Two coa l e n t r a i n e d
Two d i f f e r e n t c o a l s - - I l l i n o i s The es t imates are based
pared f rom synthes is gas produced b y coa l e n t r a i n e d g a s i f i c a t i o n a t 30 atmospheres. (1) (2 ) F i g u r e 1, a f l ow diagram o f t h e process, i n c l u d e s t h e f o l l o w i n g s teps :
mine coa l t o 70 percent th rough 200-mesh.
p e r a t u r e . The s y n t h e s i s gas i s coo led t o 750" F by water i n j e c t i o n .
separa tors fo l lowed by e l e c t r o s t a t i c p r e c i p i t a t o r s f o r r e s i d u a l d u s t removal .
i n t h e presence o f a s u l f u r - r e s i s t a n t c a t a l y s t . q u i r e d i n the p u r i f i c a t i o n u n i t i s produced i n the f i r s t h e a t recovery system.
5. duce t h e C02 conten t t o 2.0 p e r c e n t and remove e s s e n t i a l l y a l l o f t he H2S and COS. (3 ) Char towers are p r o v i d e d f o r removal o f r e s i d u a l s u l f u r compounds.
6. t o 281.5: l i n t h e presence o f a low-temperature c a t a l y s t . A d d i t i o n a l 50 p s i g s a t u r a t e d steam i s produced i n t h e second waste heat recovery u n i t .
7 . f i c a t i o n u n i t w6ich i s s i m i l a r t o t h e f i r s t stage p u r i f i c a t i o n u n i t .
8. e l c a t a l y s t . The produc t gas i s c o o l e d t o 100" F and then mixed w i t h s u f f i c i e n t
Coal p r e p a r a t i o n , wh ich i n c l u d e s c rush ing , screening, and s i z i n g o f the r u n - o f -
Ent ra ined oxygen-coal g a s i f i c a t i o n a t 30 atmospheres w i t h a 2,200' F o u t l e t tem-
A dus t removal u n i t removes e n t r a i n e d d u s t f rom the s y n t h e s i s gas w i t h cyc lone
F i r s t stage s h i f t convers ion o f t h e c l e a n s y n t h e s i s gas t o a H2:CO r a t i o o f 2.3:l
F i r s t stage p u r i f i c a t i o n u n i t u t i l i z e s a h o t potassium carbonate s o l u t i o n t o r e -
Second stage s h i f t convers ion u n i t inc reases t h e H2:CO r a t i o o f t h e s y n t h e s i s gas
The CO c o n t e n t o f t h e s h i f t e d gas i s reduced t o 0.1 percent i n the second p u r i -
The remaining carbon o x i d e s a r e conver ted t o methane i n the presence o f a n i ck -
P a r t o f t h e 50 p s i g s a t u r a t e d steam r e -
1Mr. Y i m has res igned f rom t h e Department o f Energy, and i s l oca ted w i t h Bechte l Corpo-
zBased on U.S. Bureau of Mines r e s e a r c h i n the 1950 's w i t h f u l l commercial development r a t i o n , 50 Beale S t r e e t , San Franc isco , CA 94119.
incomplete.
52
n i t r o g e n from t h e oxygen p l a n t t o y i e l d a syn thes is gas h a v i n g a H2:Nz r a t i o o f 3: l which i s compressed t o 2,000 ps ig .
The makeup gas mixes w i t h coo led recyc le . gas and i s then coo led t o 0' F i n a r e f r i g e r a t i o n - t y p e condenser t o reduce t h e NH3 c o n t e n t t o 1.5 percent . densed ammonia removes t h e l a s t t r a c e s o f water.
E i g h t y - f i v e p e r c e n t o f t h e gas stream i s heated t o 706" F by p r o d u c t gas i n a heat exchanger l o c a t e d below t h e c a t a l y s t bed p r i o r t o e n t e r i n g the c a t a l y s t bed. The remain ing 15 percent i s d i v i d e d i n t o th ree quench streams f o r c o n t r o l o f c a t a l y s t temperature.
11. The produc t gas i s coo led t o 47" F i n a s e r i e s o f h e a t exchangers. The gas stream i s separated f r o m the condensed ammonia, recompressed t o 2,000 ps ig , and then r e c y c l e d t o mix w i t h t h e makeup stream.
A smal l p o r t i o n o f t h e r e c y c l e stream i s purged from the system t o p revent b u i l d u p o f methane. To inc rease t h e ammonia y i e l d , t h e purge stream i s coo led t o -12" F be fore b e i n g vented.
The l i q d i d ammonia produc t i s coo led t o -12" F, and then t h e pressure i s reduced t o 200 p s i g t o remove t h e d i s s o l v e d gases. The produc t i s s t o r e d i n low temperature atmospher ic p ressure s t r ge tanks.
I t i s assumed t h a t 15 percent 948 o f t he t o t a l H2 and N2 e n t e r i n g the c o n v e r t e r i s synthesized t o ammonia. on a gas space o f 20,000 s c f s y n t h e s i s g a s / f t 3 c a t a l y s t / h r . o f t h e o v e r a l l p l a n t i s 31.4 percent , based on gross h e a t i n g values i n B t u p e r pound o f 10,700, 9,800 and 3,990 f o r coa l , ammonia, and s u l f u r , r e s p e c t i v e l y .
9. The con-
10.
12.
13.
The des ign o f t he ammonia s y n t h e s i s vesse ls was based The thermal e f f i c i e n c y
KOPPERS-TOTZEK ENTRAINED GASIFICATION
Hydrogen r e q u i r e d i n t h i s system i s prepared f rom s y n t h e s i s gas produced by coal e n t r ' n d g a s i f i c a t i o n i n Koppers-Totzek u n i t s which opera te a t 0.5 atmo- sphere. (Ej 76) F igure 2 i s a f l o w diagram o f t he process and i n c l u d e s the f o l l o w - i n g s teps :
1. Coal p r e p a r a t i o n i s t h e same t ype o f u n i t descr ibed i n t h e e n t r a i n e d gas i - f i c a t i o n system a t 30 atmospheres.
2. l e t temperature. Pa r t o f t he 800 p s i g steam used i n t h e steam t u r b i n e s i s produced i n t h e h e a t recovery u n i t .
o r i f i c e washers f o l l o w e d by a d j u s t a b l e o r i f i c e washers f o r removal o f f i n e s . The dedusted gas i s then compressed t o 355 ps ig .
Ent ra ined oxygen-coal g a s i f i c a t i o n a t 0.5 atmosphere w i t h a 2,732' F ou t - The s y n t h e s i s gas i s coo led t o 2,100' F b y water i n j e c t i o n .
3. A d u s t removal u n i t removed t h e e n t r a i n e d ash and unburned carbon w i t h f i x e d -
The remain ing s teps a re t h e same as those f o r t h e o t h e r system.
CAPITAL INVESTMENT
The t o t a l inves tment i s es t imated t o be $196 m i l l i o n f o r the e n t r a i n e d g a s i f i - c a t i o n system o p e r a t i n g a t 30 atmospheres o f $49.5 m i l l i o n lower than the inves tment f o r the Koppers-Totzek g a s i f i c a t i o n system, u s i n g an I l l i n o i s No. 6 c o a l . Montana subbituminous coa l , t he t o t a l inves tment i s reduced 12 p e r c e n t t o $173 m i l - l i o n , and 9 percent t o $223 m i l l i o n f o r t he p r e s s u r i z e d e n t r a i n e d and Koppers-Totzek systems r e s p e c t i v e l y .
Table 1 i s a c a p i t a l requirement comparison o f t h e two systems, and f i g u r e 3 shows the d i s t r i b u t i o n o f c a p i t a l requ i rement f o r ma jor processes. D e t a i l e d cos t summaries o f t he major p rocess ing u n i t s a r e n o t inc luded, b u t the c o s t s o f t h e i n d i - v idua l u n i t s a re l i s t e d . General f a c i l i t i e s i nc lude a d m i n i s t r a t i v e b u i l d i n g s , shops, warehouses, r a i l r o a d spurs, r o l l i n g s tock , roads, waste water t rea tment , and fences. The cos ts o f steam and power d i s t r i b u t i o n , c o o l i n g water towers, p l a n t and ins t rument a i r , f i r e p r o t e c t i o n , and s a n i t a r y water a r e i n c l u d e d i n p l a n t u t i l i t i e s .
Using a
53
OPERATING COST
Table 2 presents the estimated operating cos t comparison f o r the two entrained gas i f i ca t ion systems. An assumed 90-percent operating f ac to r allows 35 days f o r downtime, two 10-day shutdowns f o r equipment inspection and maintenance and 15 days f o r unscheduled opera t iona l i n t e r rup t ions . With labor a t $7.50 per hour, payroll overhead a t 35 percent of payro l l , and deprec ia t ion a t 5 percent of the subto ta l for deprec ia t ion , allowing c r e d i t f o r s u l f u r recovered a t $40 per ton, and w i t h t he cost of coal a s a var iab le , the following opera t ing cos t s a r e derived:
Annual operating c o s t , do l l a r s per ton of ammonia ~~
Cost of I l l i n o i s No. b c o a l coal , Entrained Koppers-
per ton a t 30 atm. Totzek 817 $146.97 I $ 173.41
Cost of Montana subbituminous
per ton a t 30 atm. Totzek coa l , Entrained Koppers-
per ton a t 30 A t m . Totzek $1 7 $249.46 $300.37
20 258.45 309.87 23 267.74 319.37
The OCF computer program takes in to account the cap i t a l expenditure p r io r t o a r tup so t h a t i n t e r e s t during cons t ruc t ion i s de le ted from the cap i t a l requirement.
UNIT COST SUMMARY
15-percent DCF 20-percent DCF Entrained Koppers- Entrained Koppers- a t 30 A t m . Totzek a t 30 A t m . Totzek
The se l l i ng p r i ce used t o determine the high-cost elements in the process was based on a 15-percent OCF f o r a 20-year l i f e , with coal a t $20 f o r the I l l i n o i s No. 6 and $9 f o r the Montana subbituminous. two systems i s shown in t ab le 3 and p lo t ted i n f igure 5.
A breakdown of the cos t elements f o r the
SUMMARY O F COMPARISON
As shown i n t a b l e 1 , the t o t a l investment f o r the pressurized en t ra ined gas i - f i ca t ion system, u s i n g I l l i n o i s No. 6 c o a l , i s $196 mi l l i on , or about 80 percent of the Koppers-Totzek investment. About 45 percent of t he d i f fe rence i s due t o the additional compressor investment required f o r processing the raw gas product leaving the gas i f i ca t ion u n i t a t e s s e n t i a l l y atmospheric conditions. The Koppers- Totzek system a l s o r equ i r e s a more complex and expensive gas i f i ca t ion , an ex t r a heat
cost of coal,
pe r t o n $7
9 11
54
12-percent DCF 15-percent DCF 20-percent DCF Entrained Koppers- Entrained Koppers- Entrained Koppers- a t 30 A t m . Totzek a t 30 A t m . Totzek a t 30 Atm. Totzek
recovery u n i t , and a wet d u s t removal system t h a t i s more expensive than t h e d r y System used i n t h e p r e s s u r i z e d system. The c a p i t a l inves tment f o r t h e p r e s s u r i z e d e n t r a i n e d g a s i f i c a t i o n system i s reduced about 12 p e r c e n t when a Montana subb i tumi - nous coa l i s used. About 7 0 ' p e r c e n t o f t h e r e d u c t i o n i s due t o t h e e l i m i n a t i o n o f t h e f l u e gas process ing u n i t . D i f f e r e n c e s i n c a p i t a l cos ts f o r t h e two systems a re shown i n f i g u r e 3.
I l l i n o i s No. 6 coa l i s $48.5 m i l l i o n , o r about 85 p e r c e n t o f t he Koppers-Totzek cos t , as shown i n t a b l e 2. Inc reases i n maintenance, overhead, and i n d i r e c t and f i x e d cos ts , which a re d i r e c t l y r e l a t e d t o the c a p i t a l investment, r e p r e s e n t t h e main d i f - fe rence. p r e s s u r i z e d system i s reduced about 25 percent . The cheaper western coa l accounts f o r about 75 percent o f t h e r e d u c t i o n .
f o r I l l i n o i s No. 6 c o a l , t he s e l l i n g p r i c e f o r t he ammonia f rom t h e p r e s s u r i z e d e n t r a i n e d g a s i f i c a t i o n system i s $249.50 t o $367.50 per ton o r $51 t o $77 pe r t o n l e s s than from t h e Koppers-Totzek system. Th is represents about a 20-percent de- crease. When a Montana subbi tuminous coa l i s used i n p lace o f I l l i n o i s No. 6 coa l , i n t h e p r e s s u r i z e d system, t h e s e l l i n g p r i c e i s a l s o reduced about 20 percent . About the same percent r e d u c t i o n i n s e l l i n g p r i c e i s o b t a i n e d by s u b s t i t u t i n g western coa l i n t h e Koppers-Totzek system.
CONCLUSION
The o p e r a t i n g c o s t f o r t he p r e s s u r i z e d e n t r a i n e d g a s i f i c a t i o n system u s i n g
By s u b s t i t u t i n g a Montana subbi tuminous coa l , t he o p e r a t i n g c o s t o f t he
Over the 12 t o 20 percent OCF range a t v a r y i n g coa l p r i c e s ($17 t o 23 p e r t o n )
Resu l ts o f t h i s s tudy show t h a t t he p r e s s u r i z e d e n t r a i n e d g a s i f i c a t i o n system i s more economical t h a n the Koppers-Totzek system f o r p r o d u c t i o n o f ammonia f rom c o a l . The s e l l i n g p r i c e o f t h e ammonia can be reduced about 20 percent by s u b s t i - t u t i n g a western subbi tuminous coa l f o r an e a s t e r n b i tuminous coa l f o r bo th o f t h e systems. Al though t h e s e l l i n g p r i c e i s $20 t o $100 pe r ton h i g h e r than t h e c u r r e n t p r i c e o f ammonia a t t h e l o w e s t percent DCF, a s u b s t i t u t e f o r n a t u r a l gas, p resent - l y used as the raw m a t e r i a l , w i l l be r e q u i r e d i n t h e near f u t u r e as gas reserves a r e dep le ted . F u r t h e r research on these coa l g a s i f i c a t i o n processes w i l l be r e q u i r e d t o reduce the manufac tur ing c o s t o f t he ammonia produc t . as the L u r g i , Wink le r , and Texaco g a s i f i c a t i o n systems ,should be cons idered as a1 t e r - na t i ves .
Various o t h e r processes such '
55
TABLE
4,224 3,455
623
1,287 2,713
11,919 735
1,186 5,143
1. - Capital requirements: Comparison of pressurized entrained gasif icat ion system w i t h Koppers-Totzek system
(91,000)
4,970 3,672
710
1,473 2,691
12,967 735
1,186 5,143
Item
-92
-1,280 -1 ,466 -1,075
-22,080
Coal preparation ......... Gasification ............. Heat recovery No. l . . . . . . Dust removal ............. Compression No. 1 ........ Shi f t conversion No. l . . . Heat recovery No. Z . . . . . .
' Purif icat ion No. 1 ....... Shi f t conversion No. Z . . . Heat recovery No. 3 . . . . . . Purif icat ion No. 2 .......
Methanation .............. Compression No. 2 ........ Ammonia synthesis ........ Flue gas processing.. .... Sulfur recovery plant .... Oxygen plant ............. Steam and power plant .... Plant faci 1 i t ies . . ....... Plant u t i l i t i e s ..........
Total construction..
I n i t i a l catalyst requirement.. .
Total plant cost . . ..
construction ........... In t e re s t during
Subtotal f o r depreciation.. . . . .
Working capital ..........
+379
-1% 1 -1,374
-23,300
Total investment . . . .
4,316 4,735 1,466 1,698
1,305 7,001
13,949 688 592
4,293
22,080
'ressurized entrained
4,591 4,519 1,317 2,084
23,300
975 9,329
15,071 729 592
4,293 +594 +850
+29 -599
-1,998 0
0
+594
+850 1: +29
-599
-90
1,467 15,625 33,656
Koppers-Totzek
1,467 15,625 33,656
coal I coal
1,438 16,224 33,656 18,350
900
1,438 16,224 33,656
650 16,352
900
11,170 19,700 9,762
13,992
153,909
1,002
154,911
23,237
178,148
17,815
195.963
560
11,946 19,850 8,749
12,540
137,940
1,038
138,978
20,847
159,825
12,786
172,611
Difference PE-KT PE-KT
12,000 19,809 12,338 16,450
193,288
802
12,200 19,979 11,322 16,227
178,496
780
-4,288 -6,638 -2.030 -18 I -2,104
-830 -1 09
-2,576 -2,458
-39,379
+zoo -39,179
-5,877
-45,056
-4,505
-49,561
.+47 I +6
-254
-2:;;; T
I
I -46,342 I
-3,687
-40,556
+258
-40,298
-6,044
-3,708-
-50,050
56
TABLE 2. - Annual operat ing cost : Comparison o f pressur ized ent ra ined g a s i f i c a t i o n system w i t h Koppers-Totzek system
($1,000)
1,435
2,880
576
4,320
7,776
Cost i tem
1,285
2,574
51 5
3,861
6,950
D i r e c t cost : Coal I . . ................. Raw water ............... Ca ta l ys t and chemicals.. Methane .................
Subtotal ............. D i r e c t labor ............ D i r e c t labor superv is ior
Subtotal ............. Maintenance labo r . . . . . . . Maintenance labo r
superv is ion ........... Maintenance ma te r ia l
and contracts ......... Subtotal . ............
Pay ro l l overhead ........
To ta l d i r e c t cost..
I n d i r e c t cost.. ........... Fixed cos t :
Operating suppl ies. . ....
Taxes and insurance ..... Depreciat ion ............
Tota l , before c r e d i t .
S u l f u r c r e d i t . . ...........
Tota l , a f t e r c r e d i t
1,587
3,600
720
5,400
9,720
Pressurized ent ra ined
703
1,435
3,312
662
4,968
8,942
1,248 1,117 187 1 168
1,468 1,555
1,312 1,390
1,772 1,944
31,007 20,520
5,383 4,812
4,647 4,169 8,908 7,991
49,945 37,492 -1 __-. -1,444 -133
48,501 37,359
1,623 1,789
Koppers-Totzek s stem
I l l i n o i s Montana
17,759 a ,865
790
20,072 10,112
35,095
6,625
5,823 11,160
58,703
-1,447
57,256
1,380 1,248 207 1 187
23,901
6,083
5,378 10,309
45,671
-117
45,554 ' I l l i n o i s No. 6 coal @ $17/ton; Montana subbituminous coal @ $7/ton.
57
D i
PE-KT Illinoir No. 6 coa l
-952 -256
-4 -87
-1,299
-1 32 -20
-1 52
-720
-1 44
-1,080
-1,944
-304 -389
-4,088
-1,242
-1,176 -2,252
-8,758
+3
-8,755
-
ference PELKT
rfon tana- subbituminous
coal
-164 -471 + l o 6
-529
-131 -1 9
-1 50
-738
. -147
-1,107
-1,992
-31 1 -399
-3,381
-1,271
-1 ,209 -2,318
-8,179
-16
-8,195
TABLE 3. - U n i t c o s t comparison
U n i t
Coal p repara t ion . . ............ G a s i f i c a t i o n .................. Oust removal .................. Compression No. 1 ............. S h i f t conversion 110. 1 ........ P u r i f i c a t i o n No. 1 ............ S h i f t conversion No. 2 ........ P u r i f i c a t i o n No. 2 ............ Methanat ion ................... Compression No. 2 ............. Ammonia syn thes is ............. Flue gas processing.. ......... S u l f u r recovery. . .............
Cost pe r ton o f p r Pressur ized e n t r a i n e d
NOTE:--Coal cos t , d o l l a r s per t o n - - I l l i n o i s No. 6 i s $20 and Montana subbituminous i s $9.
REFERENCES
1. In t ra -Depar tment Repor t No. 78-2, "An Economic E v a l u a t i o n o f Ammonia Produc t ion v i a Synthes is o f N i t r o g e n and Hydrogen Using an Oxygen-Coal Pressur ized E n t r a i n e d G a s i f i c a t i o n System For Hydrogen Produc t ion , 1,000-Ton-Per-Day P l a n t , I l l i n o i s No.6 Coal ." Process E v a l u a t i o n Of f i ce , U.S. Department o f Energy, Morgantown, W. Va., November 1977.
2. Intra-Department Repor t No. 78-8, "An Economic E v a l u a t i o n o f Animonia Produc t ion v i a Synthesis o f N i t r o g e n and Hydrogen Using and Oxygen-Coal Pressur ized E n t r a i n e d G a s i f i c a t i o n System For Hydrogen Produc t ion , 1,000-Ton-Per-Day P l a n t , Montana Sub- b i tuminous Coal ," Process E v a l u a t i o n O f f i c e , U.S. Department o f Energy, Morgantown, W . Va., A p r i l , 1978.
3. "Hot Carbonate P u r i f i c a t i o n Computer Program,
4. B r e s l e r , Sidney A., and G. Russel James. Ammonia Plants," Chem. Eng., June 21, 1965, p. 116.
5. In t ra -Depar tment Repor t No. 78-3, "An Economic E v a l u a t i o n o f Ammonia Produc t ion v i a Koppers-Totzek Coal G a s i f i c a t i o n System f o r Hydrogen Produc t ion ( I l l i n o i s No. 6 Coal) , 1,000-Ton-Per-Day P l a n t , " Process E v a l u a t i o n O f f i c e , U.S. Department o f Energy, Morgantown, W. Va., December 1977.
6. Intra-Department Repor t No. 78-7, "An Economic E v a l u a t i o n o f Ammonia Produc t ion v i a Koppers-Totzek Coal G a s i f i c a t i o n System f o r Hydrogen Produc t ion (Montana Subbi- tuminous Coal), 1,000-Ton-Per-Day P lan t , " Process E v a l u a t i o n O f f i c e , U.S. Department o f Energy, Morgantown, W . Va., A p r i l 1978.
~
Wellman, P., and S. K a t e l l . U.S. Bureau ;f Mines I n f o r m a t i o n C i r c u l a r 8366, March 1968.
"Quest ions and Answers on Today's
58
Power. steam SULFUR RECOVERY PLANT STACK GAS CLEANUP
- Sulfur Steam 37.200 I b l h r ( 1 ) 41.000 I b l h r (H)
H2S. C02
Elo1rture zss 7.1 tph ( 1 )
16.6 tph (M) OXYGEN PLANT
I
2.6 tph ( 1 ) 0.4 tph ( M I
I 4
Ash, unburned coal AEPlONlA SYNTHESIS
FIGURE I . - Plant b lock d iagram-entra ined coal gas i f i ca t i on
( I ) - I l l i n o i s NO. 6 coal. (M) - Montana subbituminous coal.
41.7 tph ( I & H)
Steam, power t o process
Sulfur 2.5 tph ( I ) 0.4 tph ( M )
co2
Purge I Ash, unburned carbon
FIGURE 2. - Plant b lock diagram-Koppers-Totzek coal gas i f i ca t i on
( I ) - I l l i n o i s NO. 6 coal . (M) - Uontana subbituminous coal 41.67 tph
( 1 6 U)
5 9
400
300
20c
1oc
0
I): I L L I N O I S tion 6 COAL, $353,64 (I)
'MI : MONTANA SUBBITUMINOUS COAL, -
$299,20
$20/TON
$Q/TON
' / I B- $293'53 (1) COAL PREPARATION
/
FIGURE 5. - SELLING FRICE OF AFlMONIA AND ITS DISTRIBUTION BASED ON UNIT COST PROCEDURE AT 15 PERCENT DCF
61
THE MODELING OF INITIAL STAGE HYDROGASIFICATION OF VARIOUS
RANKED COALS
Edwin J. Hippo James L . Johnson*
I n s t i t u t e of Gas Technology 3424 S . S t a t e
Chicago, I l l i n o i s 60616
In t he p a s t twenty y e a r s , a l a r g e e f f o r t h a s been made i n t h e Uni ted S t a t e s t o deve lop commercial c o a l g a s i f i c a t i o n technology. I t has been observed from exper i - menta l work t h a t t h e b e h a v i o r of c o a l du r ing t h e i n i t i a l s t a g e s of c o a l hea t -up , and du r ing a s h o r t t ime i n t e r v a l fo l lowing heat-up, a r e c r u c i a l t o e f f i c i e n c i e s of gas- i f i c a t i o n processes . Most carbon ox ides , s team, o i l and t a r s , and s i g n i f i c a n t por- t i o n s o f l i g h t hydrocarbon gases a r e evolved du r ing t h e i n i t i a l s t a g e . knowledge of t h e k i n e t i c s of t h i s s t a g e is e s s e n t i a l t o optimum r e a c t o r des ign .
A d e t a i l e d
However, as p o i n t e d o u t p r e v i o u s l y (l), most s t u d i e s have been concerned w i t h k i n e t i c c o r r e l a t i o n s of t o t a l methane y i e l d a f t e r t h e c o a l h a s d e a c t i v a t e d t o a r e l a t i v e l y i n e r t c h a r . On t h e o t h e r hand, t h i s p r o j e c t h a s been concerned w i t h r e a c t i o n s t h a t t a k e p l a c e i n t h e r e l a t i v e l y h i g h l y r e a c i t v e i n i t i a l s t a g e of t r a n - s i e n t r e a c t i v i t y , c a l l e d " r a p i d - r a t e methane f o r m a t i o n . "
Experimental
D e t a i l s of t h e r e a c t o r system have been p resen ted p r e v i o u s l y (1). In b r i e f , i t is a 1 . 6 mm d i ame te r , 60 m long h e l i c a l c o i l e d t r a n s p o r t r e a c t o r . Nine p a i r s o f e l e c t r o d e s a t t ached a long t h e l e n g t h of r e a c t o r provide an energy source f o r h e a t i n g . Temperatures i n t h e n ine zones can be ad jus t ed independent ly t o provide c o n s t a n t o r l i n e a r tempera ture p r o f i l e s a c r o s s t h e l e n g t h of t h e r e a c t o r . t o 0.089 mm d i ame te r s ) a r e e n t r a i n e d i n a gas (hydrogen o r he l ium wi th less than 0.1% s o l i d s by volume) and passed through t h e r e a c t o r . Gas-solid s e p a r a t i o n occur s i n a s i n t e r e d metal f i l t e r (hea ted t o 300°C) a t t h e r e a c t o r o u t l e t . L iquids a r e condensed i n a series of cooled t r a p s . The d ry gas is ana lyzed by p e r i o d i c mass s p e c t r o g r a p h y and by continuous flame i o n i z a t i o n . e thane , and benzene. Proximate and u l t i m a t e ana lyses of c o a l and cha r s a r e d e t e r - mined f o r each run . Condens ib le l i q u i d s , "heavy hydrocarbons," and s team y i e l d s a r e d i f f i c u l t to de te rmine e x p e r i m e n t a l l y because a l a r g e s u r f a c e a r e a is a v a i l a b l e on which t h e small y i e l d can condense. and heavy hydrocarbons a r e de te rmined by carbon ba lance .
Coal p a r t i c l e s (0 .074
Gases de t ec t ed have inc luded CO, C02, H2, methane,
Steam y i e l d s a r e determined by oxygen ba lance ,
I so thermal t e m p e r a t u r e s have v a r i e d from 700 t o 1040 K , and r e s idence t imes have been va r i ed up t o 13 seconds (depending on the t o t a l gas flow r a t e ) f o r v a r i o u s coa l s . Maximum tempera ture f o r l i n e a r tempera ture p r o f i l e s range from 700 t o 1140 K f o r con- s t a n t hea t ing r a t e s of 3 0 , 60 , and 80 K/s. A r e a c t o r i n l e t t empera ture of 590 K w a s main ta ined f o r a l l c o n s t a n t h e a t i n g runs . T o t a l o p e r a t i n g p r e s s u r e s have ranged from 18 t o 52 atmospheres; most runs have been performed a t 35 a tmospheres .
The g a s i f i c a t i o n k i n e t i c s of a Montana l i g n i t e , a Montana subbi tuminous c o a l , a North Dakota l i g n i t e , two Texas l i g n i t e s , and a Utah subbituminous c o a l have been i n v e s t i g a t e d . The i r proximate and u l t i m a t e ana lyses a r e inc luded i n Table 1. Anal- y s e s of coa l s i n v e s t i g a t e d i n o t h e r s t u d i e s (2 , 3) are a l s o inc luded . The i r g a s i f i - c a t i o n behavior w i l l b e d i s c u s s e d in terms of t h e model cons t ruc t ed from t h e d a t a ob ta ined from t h e mass t r a n s p o r t r e a c t o r .
1 e 1.
* Deceased.
62
0 - C I
. 0 m o o l o . . .
63
Typica l Resu l t s
Typ ica l r e s u l t s f o r h y d r o g a s i f i c a t i o n of c o a l s i n t h e mass t r a n s p o r t r e a c t o r h a v e been r e p o r t e d e l s e w h e r e (1). Due t o t h e volume of d a t a c o l l e c t e d , o n l y t h e ten- t a t i v e model f o r y i e l d s of oxygenated s p e c i e s w i l l b e d i s c u s s e d i n t h i s pape r . f o r c o a l hydrogen e v o l u t i o n have been t e n t a t i v e l y proposed and w i l l b e p r e s e n t e d a t a la te r d a t e .
Models
Previously ( 4 ) , t h e e v o l u t i o n of oxygen-containing s p e c i e s d u r i n g r a p i d - r a t e methane formation and d e v o l a t i l i z a t i o n have been modeled by assuming t h a t a set of r e a c t i o n s occurs to l i b e r a t e each s p e c i e s . Each s e t of r e a c t i o n s w a s r ep resen ted by a f i r s t - o r d e r rate e q u a t i o n , b u t t h e r a t e c o n s t a n t had a cont inuous d i s t r i b u t i o n o f a c t i v a t i o n ene rg ie s . However, evolved s p e c i e s can a r i s e by d i f f e r e n t pa ths . Data s c a t t e r i n g and t h e narrow band of a c t i v a t i o n e n e r g i e s p rev ious ly used t o f i t t h e d a t a a l low a s impl i fy ing a s sumpt ion t o b e made - namely, t h a t t h e fo rma t ion o f each s p e c i e s by each rou te can be r e p r e s e n t e d by a s i n g l e r a t e e q u a t i o n c o n t a i n i n g a s i n g l e e f f e c t i v e a c t i v a t i o n energy. Thus, t h e fol lowing o v e r a l l model can be used t o f i t t h e d a t a :
ni = C bn. .xi . 1) i , j 1 . 3 7 1
where -
n . = t o t a l amount of s p e c i e s i formed (g-atom o f i lg-atom of f eed carbon)
An. , = maximum amount of s p e c i e s i t h a t can b e formed by r o u t e j (g-atom of i lg-atom I*’ feed carbon)
x . = f r a c t i o n of i conver t ed by r o u t e j a t any t ime such t h a t - 1.j
where -
and -
= r a t e c o n s t a n t € O K t h e f irst o r d e r r e a c t i o n f o r fo rma t ion of s p e c i e s i by r o u t e ko. 1, j j ,s-’
ko: = pre -exponen t i a l f a c t o r f o r t h e f i r s t - o r d e r r a t e equa t ion f o r t h e formation i , j of s p e c i e s i by r o u t e j
Ei . >I = a c t i v a t i o n energy f o r formation of s p e c i e s i from t h e c o a l by r o u t e j .
From these assumptions and r e l a t i o n s h i p s , t h e f r a c t i o n o f s p e c i e s i formed can be expressed as -
1 - x . . = exp [- J e ko: exp (-Ei . /RT) dY 9 1
0 l , j 1.1 3 )
6 4
f o r i so the rma l conve r s ion , and
f o r a c o n s t a n t heat-up ra te c o n d i t i o n , where pa rame te r s are de f ined as above and -
Tf = maximum tempera tu re o f t h e c o i l r e a c t o r , K
To = e n t r a n c e t empera tu re of t h e r e a c t o r , K
a = heat-up r a t e of c o a l , K / s
F i g u r e l a r e p o r t s t h e carbon d i o x i d e (C02) fo rma t ion and t o t a l carbon ox ides formation as a f u n c t i o n o f maximum tempera tu re under cons t an t heat-up and i so the rma l c o n d i t i o n s f o r Montana and North Dakota l i g n i t e s g a s i f i e d i n hydrogen. The t o t a l carbon ox ide y i e l d s i n c r e a s e wi th i n c r e a s i n g maximum temperature . CO2 formation i s cons t an t up t o 920 K and then d e c r e a s e s w i t h an i n c r e a s e i n maximum tempera tu re due t o t h e water-gas s h i f t r e a c t i o n . 755 K , and when c o r r e c t e d f o r s h i f t , remains c o n s t a n t a t h ighe r t empera tu res . Th i s y i e l d , n
The pr imary Cog y i e l d i n hydrogen occur s below
H2, can be expres sed from Equat ion 1 as - C@2
where xco = 1 f o r t empera tu res above 755 K. 2,O
The t o t a l carbon ox ides formed i n hydrogen a r e t h e sum of t h e CO and C02 formed. Thus, from Equat ion 1, t h e t o t a l carbon o x i d e s formed i n hydrogen can be expres sed a s -
2 + nCO 6) = n H
"CO + co2 c02
CO formation appea r s t o be d e r i v e d from one r o u t e and t h e d a t a can b e f i t t e d u s i n g Equations 3 , 4 , and 6 . The s o l i d l i n e s i n F igu re 1 r e p r e s e n t such a f i t f o r i so - thermal c o n d i t i o n s ( l i n e 1) and cons t an t heat-up c o n d i t i o n s ( l i n e 2 ) .
The t o t a l carbon ox ides and carbon d i o x i d e y i e l d s f o r t h e Montana l i g n i t e i n helium a r e shown i n F igu re l b . Both carbon d i o x i d e and t o t a l carbon ox ides i n c r e a s e with i n c r e a s i n g temperature . two pa ths . second p a t h is assumed t o b e a f i r s t - o r d e r r e a c t i o n . be expressed a s :
In hel ium, CO2 fo rma t ion , nCo2He, appea r s t o occur by
Thus, t o t a l C 0 2 fo rma t ion can One path i s d e s c r i b e d by t h e model f o r C 0 2 formation i n hydrogen; t h e
where nCO2"2 has been d i s c u s s e d and Anco2,1 X C O ~ , ~ can be eva lua ted from t h e d a t a us ing Equat ions 3 , 4 , and 6. CO fo rma t ion appea r s t o be t h e same in helium and i n hydrogen. Thus, t h e t o t a l carbon oxide fo rma t ion in helium can be expres sed as:
The s o l i d l i n e s i n F igu re l b r e p r e s e n t solutions t o Equat ions 3 , 4 , 7, and 8.
Steam fo rma t ion can b e t r e a t e d i n t h e same g e n e r a l manner as carbon ox ides fo r - ma t ion , b u t d a t a must b e c o r r e c t e d f o r t h e s h i f t e f f e c t . Th i s is done by assuming t h a t primary Cog y i e l d i n hydrogen i s c o n s t a n t above 750 K and t h a t d i f f e r e n c e s be- tween t h e amount formed by primary g a s i f i c a t i o n and t h e amount measured are equiva- l e n t t o t h e amount o f steam formed by t h e s h i f t r e a c t i o n . The steam y i e l d s f o r Montana and North Dakota l i g n i t e s i n hel ium are p l o t t e d i n F i g u r e 2 a , and c o r r e c t e d y i e l d s f o r t h e t w o c o a l s i n hydrogen a r e p l o t t e d i n F i g u r e 2b. A s p e c i f i c amount o f s t eam i s formed by one r o u t e below 750 K. T h i s " in s t an taneous" y i e l d can b e modeled s imi la r t o CO2 fo rma t ion below 750 K . Th i s steam y i e l d can b e d e s i g n a t e d nH20,0. a d d i t i o n a l amount of s t eam is formed i n he l ium by a n o t h e r r o u t e above 750 K , such t h a t t h e t o t a l steam y i e l d s i n he l ium, nHZoHe, a r e d e s c r i b e d by -
An
He = '"H 0 , o XH 0 , o + An H20,1 X H 2 0 , 1 9) 2 2
The l i n e s drawn i n F igu re 2a were based on t h e s o l u t i o n s of Equat ions 3 , 4 , and 9 . Assuming t h a t d e v o l a t i l i z a t i o n i s t h e same i n hydrogen as i n hel ium, i t can be seen from F igure 2b t h a t an a d d i t i o n a l amount of steam fo rma t ion , b e s i d e t h a t p r e d i c t e d by Equation 9 , o c c u r s i n hydrogen. The amount of oxygen i n t h e a d d i t i o n a l steam i s e q u a l t o the amount o f oxygen i n t h e i n c r e a s e d CO2 y i e l d i n hel ium. Thus, i n hydro- gen, a c e r t a i n f r a c t i o n of coal-oxygen is evolved a s steam by a n assumed f i r s t - o r d e r r e a c t i o n t h a t i n h i b i t s C 0 2 fo rma t ion , which would o t h e r w i s e occur i n an i n e r t atmo- s p h e r e . Again t h e a d d i t i o n a l steam y i e l d is modeled by a f i r s t - o r d e r r a t e e q u a t i o n , and t h e t o t a l steam y i e l d i n hydrogen can b e modeled by -
10 1
The s o l i d l i n e s i n F i g u r e s 2a and 2b a r e s o l u t i o n s t o Equat ions 3 , 4 , 9 , and 10 f o r t h e d i f f e r e n t c o a l s c o n s i d e r e d .
The t o t a l oxygen evo lved from c o a l can be e s t i m a t e d as t h e sum of oxygen evolved as C O , CO2, and H20. Curves f o r p r e d i c t e d coal-oxygen e v o l u t i o n f o r t h e Montana and North Dakota l i g n i t e s i n hydrogen under i s o t h e r m a l and c o n s t a n t heat-up c o n d i t i o n s a r e included i n F i g u r e 3a. Actual d a t a a r e a l s o r e p o r t e d t o show t h e c l o s e f i t . A similar p l o t of oxygen y i e l d a s a f u n c t i o n o f t empera tu re , shown i n F i g u r e 3b, r e - v e a l s t h a t t h e model developed f o r oxygen e v o l u t i o n i n he l ium f i t s t h e d a t a f o r he l ium g a s i f i c a t i o n o f a Montana l i g n i t e .
Table 2 l ists t h e k i n e t i c parameters t h a t were used t o g e n e r a t e t h e s o l i d l i n e s i n F igu res 1 through 3. Note t h a t t h e pa rame te r s are n o t l i s t e d f o r t h e " i n s t a n t a - neous" formation o f C 0 2 and steam (below 750 K) because rate d a t a were n o t ob ta ined a t t h e s e t empera tu res .
T a b l e 2 . KINETIC PARAMETERS FOR EVOLUTION OF OXYGENATED SPECIES FROM COALS
V o l a t i l e Component
nC02, 1
" H 2 0 , l
"H20,2
"CO
Pre-Exponent ia l F a c t o r A c t i v a t i o n Energy koa, E (kcal /mol)
2.0 x l o 5 27.83
5.42 x lo9 38.89
6.45 x l o 9 44.98
5.47 x l o 5 25.80
66
The e v o l u t i o n of CO, CO2, and H20 can be c o r r e l a t e d w i t h c o a l rank. The p l o t s of maximum v o l a t i l e y i e l d s i n hydrogen of CO, CO2, and H20. expressed as g-atom oxy- gen y i e l d p e r g-atom feed ca rbon , v e r s u s c o a l r ank ( expres sed as g-atom oxygen p e r g-atom carbon i n t h e r a w c o a l ) , a r e approximately s t r a i g h t l i n e s ( F i g u r e 4 ) . These y i e l d s a r e c l o s e l y r e l a t e d t o va r ious f u n c t i o n a l groups i n t h e c o a l . Fo r example, COP c o r r e c t e d f o r s h i f t can be shown to have t h e fo l lowing r e l a t i o n s h i p :
(5) = G f o r n <0.1 11) = "carboxyl 0
An = 0.4 (noo - 0.1) f o r noo 3 0 . 1 12) CO2
where -
= maximum C 0 2 y i e l d (g-atom oxygen/g-atom o f feed carbon) COZ
On
n o = t o t a l oxygen i n raw c o a l (g-atom O/g-atom carbon)
ncarboxyl = t o t a l ca rboxy l oxygen i n r a w c o a l (g-atom O/g-atom c o a l C).
Steam y i e l d s can b e expres sed as -
(5) = 0.65 (noo) f o r noo 5 0 .23 AnHZO = nhydroxyl
An = 0 . 1 3 + 2 (noo - .23) f o r n 2 0.23 H20
where -
AnH 0 = maximum steam y i e l d (g-atom O/g-atom feed carbon)
"hydroxyl
2 = hydroxyl oxygen i n r a w c o a l (g-atom O/g-atom c o a l carbon)
Carbonyl oxygen forms CO e x c l u s i v e l y , as can b e seen i n t h e fo l lowing c o r r e l a t i o n s :
ncarbonyl(5) = 0.32 (noo - 0.1) n > 0 .1
= 0 .31 (noo - 0.1) noo > 0.1
15 )
16 1 An co
where -
= maximum CO y i e l d (g-atom O/g-atom feed carbon) co An
ncarbonyl = ca rbony l oxygen i n feed c o a l (g-atom O/g-atom feed ca rbon) .
Thus, i t appea r s t h a t v o l a t i l e y i e l d s c o n t a i n i n g oxygen can b e e s t i m a t e d from a s i n g l e parameter : c o a l rank expressed as t h e O/C r a t i o .
Using t h e above model and t h e maximum y i e l d s of i n d i v i d u a l p roduc t s measured f o r each c o a l , y i e l d s a t t h e v a r i o u s maximum tempera tu res can be p r e d i c t e d w i t h t h e a i d of Equat ions 1-10. I l l i n o i s No. 6 bi tuminous c o a l ( 2 ) and p y r o l y s i s o f a l i g n i t e and P i t t s b u r g h N O . 9 bituminous Coal ( 3 ) .
These models a l s o p r e d i c t behav io r f o r h y d r o g a s i f i c a t i o n o f a
Figure 5 p r e s e n t s a comparison of t h e p r e d i c t e d t o t a l oxygen y i e l d s from Equa- t i o n 1-10 and t h e a c t u a l expe r imen ta l y i e l d s f o r t h e v a r i o u s c o a l s g a s i f i e d under a v a r i e t y of c o n d i t i o n s . S i m i l a r p l o t s f o r carbon ox ides i n hydrogen, carbon ox ides i n helium, steam i n hydrogen, and s team i n hel ium, can b e made. The c o r r e l a t i o n s a r e adequate i n p r e d i c t i n g y i e l d s of oxygenated s p e c i e s f o r given t empera tu re h i s - t o r i e s i n most c a s e s .
I n summary, even though t h e h y d r o g a s i f i c a t i o n i s n o t completely understood, i t can b e seen t h a t s i g n i f i c a n t s t r i d e s have been made i n i d e n t i f y i n g i n d i v i d u a l reac- t i o n paths t h a t c o n t r i b u t e t o t h e g a s i f i c a t i o n phenomena.
References C i t ed
1. Johnson, J . L . , " K i n e t i c s o f I n i t i a l Coal Hydrogas i f i ca t ion S t a g e s , " ACS Fue l A b s t r a c t s 2, No. 1, 17-37 (1977) March.
2 . Feldmann, H. F . , Mina, J . A. and Yavorsky, P. M . , "P res su r i zed Hydrogas i f i ca t ion of Raw Coal i n a Di lu t e -Phase Reactor ," Adv. Chem. S e r . 131 (1974).
3. Suuberg, E. M., "Rapid P y r o l y s i s and Hydropyrolysis o f Coal ," Ph.D. T h e s i s , Massachuset ts I n s t i t u t e of Technology, August 1977.
4 . Johnson, J . L . , " K i n e t i c s of D e v o l a t i l i z a t i o n and Rapid Rate Methane Formation," 1975 Annual Report t o A . G . A . from I n s t i t u t e of Gas Technology, P r o j e c t IU-4-11.
5. Van Krevelen, D. W . , Coa l Sc ience , E l s e v i e r , Amsterdam, 1961.
68
I \
0 4 . 4
I I I I
2 2 t
0 N
0
0. I I s! n 0 x
0
0
X
w’ oa Nl- m a
W
I W
e
0
I-
m
m U
C
z:
0 Ll
M .r(
Ir
I 0 I S
0.
O C
0
N
I I 0
0
Y)
0 -
U O q l D l pa84 UIOID-O~WOIO-~ ' l l3AlOA3 N30hXO
I I Y)
I
0 2 Y)
0 -
UOqJD3 paaj WOW-6/W01D-o '03AlOh3 N30AXO
71
0
x P
2 0 3 %;
W
L W
p m
0
c
m 8
P d
C
h E L r 1 d
ar l m a , > z rl o c > .rl ti
m a u m .rl M C
o r l c 2 D m m 1 M .rl Fr
m
d m h u Fr .rl
C V M m .rl > 4
rl o m > u t i 0
* G c m m M O xc !4 X U Q O h *
0 c: r lz m c u m .r(
w v m
m m o c m u h C 3 0
M T .rl Lr
o n 00
3 4
'd 0 a u w a
DETERMINATION OF THE KINETICS OF HYDROGASIFICATION OF CHAR USING
A THERMOBALANCE
S . P. Chauhan and J. R. Longanbach
B a t t e l l e ' s Colrrmbus Laborator ies 505 King Avenue
Columbus, Ohio 43201
INTRODUCTION
The g a s i f i c a t i o n of c o a l with f a i r l y pure hydrogen, r e f e r r e d t o as "d i rec t hydro- gas i f ica t ion" , is considered t o be an a t t r a c t i v e approach f o r t h e product ion of subst i - t u t e n a t u r a l gas (1,Z). Conceptually, d i r e c t hydrogas i f ica t ion processes involve two s t a g e s of g a s i f i c a t i o n , one f o r hydrogas i f ica t ion of t h e c o a l and another f o r steam- oxygen g a s i f i c a t i o n of t he char from t h e f i r s t s t a g e as shown i n Figure 1. required by the hydrogas i f ica t ion s t a g e is produced i n t h e steam-oxygen g a s i f i c a t i o n s tage. i n t h e g a s i f i e r (3,4). Thus, t h e requirement f o r c a t a l y t i c methanation is g r e a t l y reduced compared t o s ingle-s tage steam-oxygen processes . s e v e r a l t echnica l advantages, which add up t o a s i g n i f i c a n t economic advantage, of d i r e c t hydrogas i f ica t ion processes over s ing le-s tage steam-oxygen processes (1-6). Some examples of t he d i r e c t hydrogas i f ica t ion processes under development are: (a) t h e Hydrane process (1.3) be ing developed by t h e P i t t sburgh Energy Research Center (PERC), (b) t h e Rocketdyne Process ( 7 ) . and (c) a c a t a l y t i c hydrogas i f ica t ion process be ing developed by Bat te l le ' s Columbus Laborator ies (4 ,8 ,9) .
The hydrogen
About 85-95 percent of t h e methane i n t h e f i n a l product gas is formed d i r e c t l y
Process ana lyses i n d i c a t e
I n support of t h e hydrogas i f ica t ion processes under development, it is necessary t o obta in accura te k i n e t i c and y i e l d d a t a f o r design and scale up. These d a t a should properly t ake i n t o account t h e suppressing effect of t h e primary product of r eac t ion , namely, CH4, on t h e rate o f conversion of coa l . Unfortunately, however, t h e r e is only a l imi ted amount of d a t a presented i n l i t e r a t u r e (10.11) on t h e k i n e t i c s of hydrogasi- f i c a t i o n i n the presence of CH The bulk of t h e ava i lab le d a t a a r e f o r g a s i f i c a t i o n wi th e s s e n t i a l l y 100 percent hydrogen. Another problem with a v a i l a b l e d a t a is t h a t most i f it have been obtained using preoxidized coal whi le a l l t h e d i r e c t hydrogas i f ica t ion processes under development do not employ preoxidat ion.
present a t l e v e l s represent ing commercial design. 4
I n t h i s paper w e provide k i n e t i c d a t a on t h e hydrogas i f ica t ion of c o a l cha r ,
The d a t a are c o r r e l a t e d employing a combination of k i n e t i c models produced by p a r t i a l hydrogas i f ica t ion of r a w , caking bituminous coa l , wi th mixtures of H2 and CH . proposed by johnson (11) and Gardner, e t a1 (12). Although the d a t a were obtained f o r t h e Hydrane process , genera l a p p l i c a b i l i t y t o o t h e r d i r e c t hydrogas i f ica t ion processes is suggested. I n t h e Hydrane process , which operates at a t o t a l p ressure of about 1000 psig, t h e required carbon conversion f o r t h e .hydrogasif icat ion s t a g e is about 50 percent f o r achieving balanced operat ion, i.e., t o avoid excess HZ o r char from the steam-oxygen s t ep . countercurrent s tages as shown i n Figure 2. raw c o a l is contacted i n a f r e e f a l l , d i l u t e phase wi th a mixture of pr imar i ly H and M ca4bon. The char from t h e f i r s t hydrogas i f ica t ion s t e p is f u r t h e r hydrogas i f ied i n a f l u i d bed wi th e s s e n t i a l l y pure H and the r e s u l t i n g product gas is f e d t o t h e f i r s t hydrogasif icat ion s t a g e (3 ) . It zs t h i s second s t a g e of hydrogas i f ica t ion f o r which t h e k i n e t i c da t a reported i n t h i s paper were obtained (13).
The hydrogas i f ica t ion s t a g e i t s e l f c o n s i s t s of two I n t h e f i r s t hydrogas i f ica t ion s t a g e ,
( g r e a t e r than about 40 percent of each) t o hydrogasify about 25 percent of t t e
73
EXPERIMENTAL DETAILS
The hydrogas i f ica t ion experiments were c a r r i e d ou t i n a thermobalance reac tor descr ibed elsewhere (8,131. By cont inuously recording t h e m a s s of a sample held in a wire-mesh basket t h e progress o f a r e a c t i o n can b e e a s i l y monitored in such a system. The opera t ion i s e s s e n t i a l l y isothermal and t h e gas conversion is l imi ted t o a f e w percent. A t y p i c a l experiment i n t h e thermobalance involves br inging the r e a c t o r t o operat ing condi t ions first and then lowering t h e sample basket , measuring 0.63 inch O.D. and conta in ing a 0.5 t o 1.0 gram sample of char , a t t h e r a t e of about one inch per second u n t i l i t reaches t h e des i red p o s i t i o n i n t h e r e a c t o r ( I . D . = 0.75 inch) . Thus, t h e r e is no weight trace f o r about t h e f i r s t 0.15 minute during which t h e sample is exposed t o t h e r e a c t i v e atmosphere. requi red f o r t h e sample t o reach operat ing temperature. The temperature i s measured by a thermocouple placed 1/4-inch below t h e sample baske t .
An a d d i t i o n a l minute o r s o is
The e igh t char samples employed in t h i s s tudy w e r e produced a t PERC i n a d i l u t e phase hydrogas i f ie r operated a t a nominal feed rate of 10 l b / h r of coal . der ived from a P i t t s b u r g h No. 8 hvAb and an I l l i n o i s No. 6 hvCb c o a l each processed i n t h e d i l u t e phase r e a c t o r a t four temperatures: 725 C , 800 C, 850 C , and 900 C. Typical analyses of chars from the two types of c o a l are shown in Table 1.
The chars were
The raw coa l
TABLE 1. TYPICAL ANALYSES OF CHARS FROM DILUTE PHASE HYDROGASIFIER
Coal Source P i t t sburgh No. 8 I l l i n o i s No. 6
Analysis, w t X hvAb hvCb
Proximate, as received
Moisture 2.5 Ash 7.5 Vola t i le matter 9.2
80.8
TOTAL 100.0 Fixed carbon (by d i f fe rence) -
Ultimate, dry
Carbon Hydrogen Nitrogen Sul fur Ash Oxygen (by d i f fe rence)
(a) The chemical ana lyses above correspond t o t h e +50 mesh f r a c t i o n .
14
w a s -50+100 mesh (U.S. s i e v e s e r i e s ) b u t t h e char p a r t i c l e s i z e was much l a r g e r , as shown i n Table 1. due t o swel l ing during hydrogas i f ica t ion . The average carbon conversion during d i l u t e phase hydrogas i f ica t ion was 26 percent and t h e r e s u l t i n g chars had an average v o l a t i l e matter content of about 10 percent. The v a r i a t i o n i n proxi- mate and u l t imate analyses of var ious chars was small. diameter of t h e chars from Pi t t sburgh No. 8 c o a l was about t h r e e t i m e s (about 1800 vm) t h a t of chars from I l l i n o i s No. 6 c o a l due t o t h e h igher FSI o f P i t t sburgh No. 8 seam coa l s .
However, t h e mean p a r t i c l e
Each of t h e e i g h t char samples were hydrogasif ied a t a f ixed t o t a l p r e s s u r e of 1000 p s i g (69 atm) at s e v e r a l d i f f e r e n t temperatures ranging from 700 C t o 1000 C and employing t h r e e feed gas compositions: ( a ) 100 percent hydrogen, (b) 74 percent H2-26 percent CH4, and (c) 48 percent €I2-52 percent 1334. To contain t h e samples i n the 100 mesh screen basket , only t h e +50 mesh f r a c t i o n , which near ly represented t h e bulk of t h e samples, was used. char p a r t i c l e s i z e and gas ve loc i ty , employing chars produced a t 800 C , t o determine t h e inf luence of mass t r a n s f e r on r a t e of hydrogas i f ica t ion .
These experiments were preceded by s t u d i e s on t h e e f f e c t of
In some experiments some carbon was deposi ted on t h e sample baske t due t o cracking of methane present in t h e feed gas. t i o n on the basket so as t o obta in t r u e char hydrogas i f ica t ion r a t e d a t a .
A cor rec t ion w a s made f o r t h i s deposi-
RESULTS AND DISCUSSION
General Observations and Def in i t ions
It is wel l recognized t h a t bituminous coa ls exhib i t an i n i t i a l , t r a n s i e n t period of extremely high hydrogas i f ica t ion r e a c t i v i t y followed by a r a t h e r slow ra te of hydrogas i f ica t ion regime. The i n i t i a l , h igh- reac t iv i ty per iod, which is general ly over in a few seconds a t temperatures above 850 C, cons is t s of g a s i f i c a t i o n of the v o l a t i l e matter as w e l l as some f ixed carbon. t h e amount of which depends on the p a r t i a l pressure of hydrogen (2) . because of l i m i t a t i o n s on rate of hea t ing of coa l .
In t h e thermobalance, t h i s r e g i m e lasts longer
The rate of hydrogas i f ica t ion in t h e f i r s t k i n e t i c regime is so much h igher than the rate f o r t h e second regime t h a t a "knee" is apparent in t h e curves showing f r a c t i o n a l conversion, X, versus t i m e as shown in Figure 3. The d e f i n i t i o n of X is
-AW x = - wO
where -AW is t h e weight loss of as-received char due t o g a s i f i c a t i o n and W is t h e i n i t i a l weight. Because of t h e heat up e f f e c t s during t h e f i r s t minute thg thermo- balance is not s u i t a b l e f o r determining t h e rate of hydrogas i f ica t ion i n t h e rapid- hydrogas i f ica t ion k i n e t i c regime. onset of t h e s low-hydrogasif icat ion k i n e t i c regime which is made p o s s i b l e by not ing t h e "knee" i n t h e X versus t i m e curves. two regimes, designated as Xcp, w a s determined f o r each hydrogas i f ica t ion run. The cut-off reac t ion time w a s found t o b e as much as about 2.5 minutes a t 700 C and as s h o r t a s about 0.5 minutes a t 1000 C. Johnson (11) used 2 minutes as t h e cut-off t i m e f o r hydrogas i f ica t ion runs a t temperatures of 850 C o r higher .
However, i t is q u i t e s u i t a b l e f o r determining t h e
This boundary o r "cut-off po in t" between the
The thermobalance da ta were cor re la ted i n terms of t h e conversion of base carbon
The f r a c t i o n a l conversion of base carbon is defined as which is t h a t p o r t i o n of t h e t o t a l carbon in char which is not assoc ia ted with t h e ASTM v o l a t i l e matter ( 1 0 , l l ) .
x-v X B C =1-A-v
75
where V is the ASTM v o l a t i l e mat te r ( inc luding moisture) and A is t h e ash content of char , each expressed a s weight f r a c t i o n of as-received char. p o r t i o n of the base carbon is hydrogasif ied i n t h e rapid-hydrogasif icat ion regime.
A s mentioned above, a
The t o t a l amount of t h i s " r a p i d base carbon" is represented base carbon can be termed "slow base carbon". Now another can be defined based on t h e slow base carbon content of char :
3)
It was assumed i n w r i t i n g Equations 2 and 3 t h a t a l l v o l a t i l e mat te r , inc luding mois- t u r e , is hydrogasif ied during t h e rapid-hydrogasif icat ion regime and t h a t t h e r a t e of carbon conversion r e l a t i v e t o t h e rate of ash-free char conversion is cons tan t a f t e r d e v o l a t i l i z a t i o n . mined by u l t imate and proximate analyses d a t a f o r chars hydrogasif ied t o var ious l e v e l s of conversion.
Both of t h e assumptions were found t o be q u i t e reasonable as deter-
Rapid Hydrogasif i c a t i o n Regime
The e f f e c t s of gas-film and pore d i f f u s i o n on t h e y i e l d of rap id base carbon , were i n v e s t i g a t e d by varying t h e gas ve loc i ty and p a r t i c l e s i z e , conversion,
respectivelyl(BRCAll experiments were performed a t 1000 C temperature using a feed gas conta in ing only H2. r e s u l t e d in only a s l i g h t i n c r e a s e i n X i c a s shown i n Figure 4. And increas ing t h e mean p a r t i c l e diame,ter from 450 to 2100 urn d i d not a f f e c t qc a s shown i n Figure 5. Anthony, e t a l , on t h e o t h e r hand, reported a s i g n i f i c a n t increase i n t h e y i e l d of rap id base carbon wi th decreasing p a r t i c l e diameter. d i f f e r e n c e may be t h a t Anthony, e t a l . worked with r a t h e r dense p a r t i c l e s compared t o t h e char p a r t i c l e s used i n t h i s s tudy which had a popcorn-like consis tency i n which case t h e i n t e r n a l s u r f a c e s of p a r t i c l e may b e equal ly access ib le t o H2 f o r p a r t i c l e s of varying o u t e r diameters .
I n c r e a s i n g t h e s u p e r f i c i a l gas ve loc i ty from 0.04 t o 0.23 f t / s e c
One explanat ion f o r t h i s
The +50 mesh samples denoted by closed symbols in Figure 5 were employed f o r determining the dependence o f as a func t ion of temperature, p ressure , and feed gas composition as w e l l a s t h e cgar prepara t ion ( d i l u t e phase hydrogas i f ica t ion) temperature. type of coal .
The char prepara t ion temperature d id not appear t o a f f e c t qc f o r e i t h e r
S ince t h e v a r i a t i o n among t h e ind iv idua l va lues of average values of f o r t h e e i g h t chars were used t o t h e e f f e c t of tempera- t u r e and p a r t i a l pregsure of H2 and CH4. The average X&, values were found t o depend on temperature and m2 b u t n o t on pm4.
The d a t a were c o r r e l a t e d using t h e fol lowing equat ion which is Furthermore, temperature seemed to a f f e c t
only below 800 C. t o the one given by Johnson (11) f o r temperatures exceeding about 850 C:
R where k is a func t ion of temperature. Figure 6 shows t h e dependence of X B c on %2 f o r temperaiures ranging from 800 t o 1000 C. temperatures a r e summarized below:
The k values obtained a t d i f f e r e n t 1
-1 Temperature, C k,, atm
700 0.0016 750 0.0023
)800 0.0030
76
It should be pointed o u t t h a t Johnson d id not apply Equation 4 f o r temperatures below about 850 C.
The e f f e c t of temperature w a s found t o be q u a l i t a t i v e l y s i m i l a r t o t h a t observed by o t h e r s (2,10,14,15), i .e.. $c increases with temperature u n t i l about 850 C and then l e v e l s o f f . Actual ly , t h e r e l a t i o n s h i p between and temperature may be q u i t e complex a s shown by Pyricioch, e t a1 (lo), and Anthon3‘et a 1 (2). A t temperatures exceeding 850 C, Johnson found t h e value of k t o be 0.0092 f o r a i r p r e t r e a t e d I r e l a n d mine coa l char , containing 28.4 percent v o l a t i l e mat ter , a s opposed t o 0.0030 f o r t h i s s tudy. The d i f f e r e n c e i n these k values is because some rap id base carbon is hydro- g a s i f i e d during d i l u t e phase h y d r i g a s i f i c a t i o n i n t h e Hydrane Process .
Slow Hydrogasif icat ion Regime
I t is necessary t h a t a s i g n i f i c a n t p o r t i o n of t h e base carbon b e g a s i f i e d i n t h e slow hydrogas i f ica t ion regime i f t h e following condi t ions a r e t o be met f o r a process involving t h e d i r e c t hydrogas i f ica t ion of h igh-vola t i le bituminous c o a l toge ther with steam-oxygen g a s i f i c a t i o n of char: (a) process opera tes a t a t o t a l p ressure of 1000 ps ig o r lower. (b) t h e hea t content of gas a f t e r methanation of t h e CO produced in t h e d i r e c t hydrogas i f ica t ion s t a g e is equal t o o r g r e a t e r than 950 Btu /scf , (c) there is no excess char produced. Therefore , t h e thermobalance d a t a were analyzed t o deter- mine t h e k i n e t i c parameters f o r t h e slow hydrogas i f ica t ion regime.
Rate Expression
The slow hydrogas i f ica t ion reac t ion has been s tudied by a number of researchers (10-12,15-19) and a number of r a t e expressions have been employed f o r t h e same. of these r a t e expressions can be w r i t t e n i n t h e fol lowing genera l ized form:
Most
where X is t h e f r a c t i o n of t h e base carbon t h a t remains i n t h e char a f t e r t h e rapid hydroga%fication s t a g e is complete, and kc, nl, n , and n3 a r e parameters t h a t depend on r e a c t i o n condi t ions. l i t e r a t u r e :
Following a r e some spec i fzc forms of Equation 5 t h a t appear i n
2 --P dXSC k,f”(l-Xsc) 2’3exp(-a Xsc)
d t 6b)
The f i r s t of t h e s e is t h e s imples t , but not genera l ly found t o b e a p p l i c a b l e t o hydro- g a s i f i c a t i o n (11.12). a t o be 0.97. A t t h i s value o a, however, Equation 6b can b e approximated by E u a t i o n 6a s i n c e t h e va lue of ( l -XSC) l f3 is with in 3 percent of t h e va lue of exp(-0.97 4 ) f o r sc values up t o 0.6 which covers t h e range of i n t e r e s t . Equation 6 c was developEd by Gardner, et a l , who assumed t h a t bRT was independent of temperature (121, un l ike t h e r e s u l t s of our s tudy, discussed l a t e r .
The second equation w a s used by Johnson who found t h e value of
Equation 6a, which is a good approximation f o r Equation 6b a s d iscussed above, was found t o be u n s a t i s f a c t o r y f o r hydrogas i f ica t ion of Hydrane char , p a r t i c u l a r l y at ten+ peraturea below 900 C. This is i l l u s t r a t e d i n F igure 7 which shows t h e p l o t s of
77
ln(1-X 6a t o val id . However, Equation 6c was found t o b e appl icable a t a l l condi t ions and was therefore used in t h i s study. is a continuous, exponent ia l decay in t h e r e a c t i v i t y of the char as hydrogas i f ica t ion proceeds.
) as a funct ion of t i m e , which a r e expected t o be s t r a i g h t l i n e s f o r Equation
The b a s i c hypothesis behind Equation 6c is t h a t there
The determination of parameters k tak ing t h e i n t e g r a l of each s i d e a s fohows:
and b required rearranging Equation 6c and
7)
where t is measured from t h e end of t h e rapid hydrogas i f ica t ion regime. on t h e l e f t hand s i d e of Equation 7 was numerically evaluated for var ious values of b t o give the bes t s t r a i g h t l i n e when p l o t t e d aga ins t t . Samples of s t r a i g h t l i n e s thus obtained a r e shown in Figure 8.
The i n t e g r a l
E f f e c t of Gas-Film and Pore Diffusion
The e f f e c t of gas-film d i f f u s i o n on t h e i n i t i a l r a t e of hydrogas i f ica t ion , k2, was found t o be s i g n i f i c a n t only below a gas v e l o c i t y of about 0.15 f t / s e c a s shown in Figure 9. Wen, e t a l , s i m i l a r l y found t h a t gas-film d i f fus ion was not an important f a c t o r in t h e i r experiments w i th Hydrane char at 0.2 f t / s e c (17). used f o r studying the e f f e c t s of t h e v a r i a b l e s discussed next were kept high enough so t h a t gas-film d i f f u s i o n w a s no t a f a c t o r .
The gas v e l o c i t i e s
The e f f e c t of p a r t i c l e s i z e on k f o r Hydrane char was found t o be q u i t e d i f f e r e n t from t h a t found by o t h e r s f o r preoxidjzed coa l chars . S p e c i f i c a l l y , t h e va lue of k2 f o r Hydrane char was found t o increase s i g n i f i c a n t l y with mean p a r t i c l e diameter as shown in Figure 10. But, Tomita, et a l , found t h a t changing t h e p a r t i c l e s i z e range of l o w v o l a t i l e coal char from -40+100 t o -200+325 U.S. mesh resu l ted in a 1.6-fold increase i n the hydrogas i f ica t ion r a t e a t 400 ps ig and 980 C (19). Johnson, on the o ther hand, used a r a t e expression which assumed t h e r a t e to be independent of p a r t i c l e s i z e (11). The reason f o r t h e pecul ia r behavior of t h e Hydrane char is y e t unknown. It is suspected t h a t t h e v a r i a t i o n in i n t e r n a l sur face proper t ies with p a r t i c l e s i z e w i l l explain t h i s p e c u l i a r behiavor. l a r g e enough t o explain it.
E f f e c t of Char Prepara t ion Conditions and Coal Type
Var ia t ion in t h e ash content was not found t o be
1
The char prepara t ion temperature w a s not found t o a f f e c t the i n i t i a l r a t e of hydrogasif icat ion, k . However, t h e P i t t sburgh No. 8 seam chars were found t o be more reac t ive than I f l i n o i s No. 6 seam chars as shown in Figure 10. in t h e r e a c t i v i t i e s of t h e +50 mesh f r a c t i o n s , which near ly represented t h e e n t i r e char sample as shown i n Table 1, w a s even more pronounced due t o the d i f fe rence in the mean p a r t i c l e diameter . On t h e average, t h e +50 mesh Pi t t sburgh No. 8 chars were about 25 percent more r e a c t i v e than the +50 mesh I l l i n o i s No. 6 chars. Johnson, on the o t h e r hand, using preoxidized chars found t h e P i t t sburgh No. 8 chars t o b e about 10 percent less r e a c t i v e than I l l i n o i s No. 6 chars (20). Again t h i s d i f fe rence is unexplained but is suspected t o be due t o v a r i a t i o n in sur face proper t ies . thing, t h e bulk densi ty of P i t t sburgh No. 8 chars was found t o be considerably lower than t h a t of I l l i n o i s No. 6 chars .
The d i f fe rence
For one
In order t o determine t h e e f f e c t of preoxidat ion on r e a c t i v i t y , the k2 values f o r Hydrane char from our s tudy were compared with those reported in l i t e r a t u r e f o r o ther chars. The comparison, which was complicated due t o v a r i a t i o n in coal sources
78
and k i n e t i c expressions used t o determine r a t e cons tan ts , d id n o t conclusively show t h a t Hydrane char is more r e a c t i v e than chars produced by preoxidat ion. example, the k2 value f o r P i t t sburgh No. 8 Hydrane char a t 900 C using H2 only was found t o be 0.074 h r - l a t m - l . reported 0.021 and 0.117 hr - l a t m - l , r espec t ive ly , f o r preoxidized chars from s i m i l a r coals . Also, we found t h a t the k2 value f o r preoxidized Synthane char was 0.037 hr- l a tm-1 for t h e same c o a l (13).
Ef fec t of Pressure and Temperature
For
On t h e o t h e r hand, Johnson (11) and Gardner, e t a1 ( 1 2 )
Since t h e char prepara t ion temperature d id n o t s i g n i f i c a n t l y a f f e c t t h e k values , these were averaged over t h e four types of chars f o r each c o a l source. s e t of temperature and pressure , two k2 values , one f o r each c o a l source, were obtained.
s i g n i f i c a n t cont r ibu t ion a t higher temperatures and methane p a r t i a l p ressures . f a c t , t h e value of k pressures of H and &I were 33.1 and 35.9 atm, respec t ive ly . A s i m p l i f i e d form of t h e following c o r r e l a t l o n , developed by Johnson. was wed:
Thus, Zor each
The back reac t ion of methane t o form carbon on char was found t o make a very
was found t o be near ly zero a t about 850 C when t h e p a r t i a l I n
2
L
l + k p k = 2 H Z
where. k and k b r i m constant f o r t h e formation of CH However, a t t h e condi t ions used i n t h i s s tudy, k4 p~~ is expected t o be l a r g e compared t o one (11). Thus, Equation 8 can be s i m p l i f i e d a s fol lows:
a r e cons tan ts t h a t depend on temperature only and KE is t h e e q u i l i - 3 4 by r e a c t i o n of H 2 with 8-graphite.
But, k is expected t o show an Arrhenius type dependence 5
9)
on temperature. Thus,
Figure 11 shows t h a t Equation 10 is a p p l i c a b l e f o r I l l i n o i s No. 6 ahars only above
For t h i s range of a p p l i c a b i l i t y about 850 C. S imi la r r e s u l t s were found f o r P i t t sburgh No. 8 chars. t h e following values of ko and E
Below 850 C, k does not appear t o be t o o s e n s i t i v e t o temperature. 2
were determined f o r t h e two c o a l sources:
Coal Source ko, min-' atm-' Eo, kcal/mole
P i t t sburgh No. 8 seam 106.2 . 26.5 I l l i n o i s No. 6 seam 1067.1 32.5
I n Figure 11, t h e da ta poin ts f o r higher CH p a r t i a l p ressures appear t o f a l l , somewhat below those a t lower CH Hydrane char is somewhat higher than t h e v a l u e f o r 8-graphite. by t h e f a c t t h a t t h e va lue of k2 f o r Hydrane char a t 850 C, p~~ and p c ~ 33.1 and 35.9 a t m , respec t ive ly , w a s p o s i t i v e , though near ly zero , whil:! i t is expected t o be negat ive f o r @-graphi te at temperatures above 840 C f o r t h e same p a r t i a l pressures of H 2 and CH4.
pressures . Thls suggests t h a t t h e va lue of KE f o r 4 This is a l s o supported values of
79
I t is easy t o see from Equation 6c and 10 t h a t E corresponds t o t h e a c t i v a t i o n energy f o r hydrogas i f ica t ion a t Xs equal t o zero. Xs increases , t h e e f f e c t i v e a c t i v a t i o n energy, El, increases sgnce bRT is p o s i t i v e an$ Equations 6c and 10 can be combined as follows:
Equation 1 2 shows t h a t t h e char becomes l e s s r e a c t i v e as sc increases . a l , assumed but did n o t show t h a t bRT is independent of temperature and pressure. However, bRT f o r Hydrane char was found t o depend both on temperatures and p a r t i a l p ressure of H2 and CH 4 average values based on e i g h t chars s i n c e t h e c o a l source and char prepara t ion tempera- t u r e d id not s i g n i f i c a n t l y a f f e c t bRT. Three th ings a r e t o be noted i n Figure 12. F i r s t , bRT decreases wi th temperature, i.e., h igher temperatures he lp maintain t h e r e a c t i v i t y . Second, t h e bRT is more o r less independent of temperature above 850 C which i s t h e reglme t h a t Gardner, e t a l , operated in . And t h i r d , bRT decreases wi th increas ing m2. of r e a c t i v i t y with increas ing X
Gardner, et
as shown i n Figure 12. The bRT values p l o t t e d i n Figure 1 2 a r e
I n o t h e r words, higher p ~ ~ , j u s t as higher temperature, impedes decay
SC'
The value of bRT a t 850 C o r higher f o r 100 percent H case was found t o be 3.6 kcal/mole. func t ion of Xsc f o r P i t t sburgh No. 8 chars a s
For these condi t ions one can w r i t e t h e apparene a c t i v a t i o n energy a s a
El(kcal/mole) = 26.5 + 3.6 Xsc.
Gardner, et a l , on t h e o t h e r hand, found t h e fol lowing re la t ionship f o r preoxidized Pi t t sburgh No. 8 char
13)
El = 29.3 + 2.43 kF where WF can be approximated by Xs . r a t e o f deac t iva t ion are not a f f e c t e g much on preoxidat ion of coal . t h a t t h e k i n e t i c d a t a f o r t h e slow hydrogas i f ica t ion regime reported i n t h i s paper a re genera l ly appl icable t o d i r e c t hydrogas i f ica t ion processes whether they employ pre- oxidat ion o r not.
Thus, t h e i n i t i a l a c t i v a t i o n energy, E , and This sugggsts
Although t h e r e s u l t s on bRT are prel iminary and somewhat sketchy, they provide important ins ight i n t o t h e f a c t o r s respons ib le f o r deac t iva t ion of chars during hydrogasif i ca t ion .
Conditions f o r Achieving Required Carbon Conversion
As mentioned e a r l i e r , about 50 percent of t h e carbon present i n r a w c o a l needs t o be hydrogasified i n t h e d i l u t e phase and f l u i d bed s tages f o r balanced operat ion. The condi t ions required t o achieve t h i s l e v e l of carbon conversion were therefore determined by combining t h e d i l u t e phase and thermobalance data . t o t a l carbon conversion, inc luding 26 percent f o r d i l u t e phase hydrogas i f ica t ion , as a funct ion of time, temperature, and gas composition f o r Pi t tsburgh No. 8 char. The curves i n Figure 1 3 a r e a p p l i c a b l e when t h e second-stage hydrogas i f ica t ion takes place i n a f l u i d bed r e a c t o r with p e r f e c t backmixing of gas. product gas composition f o r t h e second-stage r e a c t i o n is t o be used t o determine the appropriate curve i n Figure 13. p l o t t e d s ince t h e CH4 concent ra t ion i n t h e gas from t h e f l u i d bed s t a g e w i l l be between
Figure 13 shows the
Under such condi t ions t h e
Note t h a t t h e d a t a f o r 100 percent H2 case a re not
80
25 and 50 percent , probably g r e a t e r than 40 percent .
CONCLUSIONS
Kine t ic da ta were obtained on a thermobalance (TGA) f o r hydrogas i f ica t ion of chars produced i n a d i l u t e phase hydrogas i f ie r , f o r designing a scaled-up, d i r e c t , f l u i d - bed hydrogas i f ica t ion r e a c t o r f o r t h e Hydrane process . were observed a t any set of condi t ions. hydrogas i f ica t ion of v o l a t i l e matter as w e l l as some base carbon and was over i n less than 2.5 minutes i n t h e TGA. w a s found t o be p r a c t i c a l l y independent of gas v e l o c i t y , p a r t i c l e s i z e , and char type. The y i e l d of The y i e l d of forward reac t ion between c o a l carbon and H CH a t a l l condi t ions. Increas ing t h e temperatures r e s u l t e d i n an i n c r e a s e i n u n t i l about 800 C, a f t e r which it d i d n o t change.
Two d i s t i n c t k i n e t i c regimes The f i r s t regime corresponded t o rap id
For t h i s regime t h e y i e l d of base carbon conversion, X i c , increased cont inuously with pH which w a s t he most important va r i ab le . w a s found t o be independent o f 2 p a . Apparently t h e rate of t h e
w a s muck higher than t h e rate of cracking of XBRC
2 4
The second k i n e t i c regime corresponded t o t h e s l o w hydrogas i f ica t ion of base carbon. A k i n e t i c model w a s employed t h a t properly accounted f o r t h e f a c t t h a t there w a s continuous deac t iva t ion of char with increas ing f r a c t i o n a l conversion. The rate of deac t iva t ion w a s found t o b e lower a t h igher temperatures and p ~ ~ . Again, t h e char prepara t ion temperature d i d not a f f e c t t h e r e a c t i v i t y . But, t h e r e w e r e two unexpected r e s u l t s . F i r s t , t h e i n i t i a l r a t e of hydrogas i f ica t ion , k , increased wi th p a r t i c l e s i ze . And second, t h e P i t t sburgh No. 8 chars were found $0 be more r e a c t i v e than I l l i n o i s No. 6 chars r a t h e r than t h e opposi te . It is p o s s i b l e t h a t t h e s e two unexpected r e s u l t s can be explained on t h e b a s i s of d i f f e r e n c e s i n s u r f a c e p r o p e r t i e s . s u c h as s u r f a c e a rea , average pore s i z e , etc. Although t h e s u r f a c e proper t ies of Hydrane char may be d i f f e r e n t from those of preoxidized chars, t h e i n i t i a l a c t i v a t i o n energy and rate of deac t iva t ion with l e v e l of conversion are no t . Also, i t cannot b e conclusively shown t h a t i n i t i a l r a t e of g a s i f i c a t i o n of Hydrane chars is higher than t h a t of pre- oxidized coa l chars.
ACKNOWLEDGMENTS
This work was supported by t h e Energy Research and Development Adminis t ra t ion (now DOE). The technica l a s s i s t a n c e provided by D r s . J i m A. Gray and Mike Baird of PERC and Mr. Herman Feldmann of Bat te l le is g r e a t l y appreciated.
REFERENCES
Feldmann, H. F. and Yavorsky, P. M . , Proceedings of t h e F i f t h Synthe t ic P ipe l ine Gas Symposium, A.G.A. Catalog No. L5 1173, 1974, p 287.
Anthony, D. B. and Howard, J. B. , AIChE Journa l , &? (4 ) , 625 (1976).
Gray, J. A . , Donatel l i . P. J., and Yavorsky, P. M . , P r e p r i n t s of F u e l Chemistry Division, ACS, 0 ( 4 ) , 103 (1975).
Feldmann, H. F., Chauhan, S. P., Longanbach, J. R . , Hissong, D . W . , Conkle, H. Curran, L. M. , and Jenkins, D. M . , "A Novel Approach t o Coal G a s i f i c a t i o n Using Chemically Incorporated CaO", Phase I1 Summary Report t o ERDA, B a t t e l l e Report NO. B M I 1986 (UC-gOc), November 11, 1977, p 33.
Wen, C. Y . , L i , C. T., Tscheng, S. H. , and O'Brien, W. S . , "Comparison of Al te rna te Coal Gas i f ica t ion Processes f o r P i p e l i n e G a s Production", paper presented a t 65th Annual AIChE Meeting. New York, November 26-30, 1972.
N . ,
Ho t t e l , H. C. and Howard, J. B . , New Energy Technology, MIT Press , Cambridge, Mass.. 1971.
81
Gray, J. A. and Sprouse. K. M., "Hydrogasif ier Development f o r t h e Hydrane Process", F i r s t Quarter Report, FE 2518-4 (UC-9Oc), June, 1977.
Chauhan, S. P., Feldmann, H. F., Stambaugh, E. P. , and Oxley, J. H., P r e p r i n t s of Fuel Chemistry Div i s ion , ACS, 2 (4) , 207 (1975).
Chauhan, S. P. , Feldmann, H. F., Stambaugh, E. P., Oxley, J . H., Woodcock, K., and Witmer, F. , P r e p r i n t s of Fue l Chemistry Divis ion, ACS, 2 ( l ) , 38 (1977).
Pyrcioch, E. J. and coworkers, IGT Res. Bu l l . No. 39, Chicago, November, 1972.
Johnson, J. L., Coal Gas i f i ca t ion , Advances i n Chemistry S e r i e s No. 131, Ed. by L. G. Massey, American Chemical Society, Washington, D.C., 1974, p 145.
Gardner, N. , Samuels, E. , and Wilks, K., i b f d , p 217.
Longanbach, 3. R. and Chauhan, S. P., "Study of Hydrogasif icat ion Rate of Reaction f o r Hydrane Char by t h e Thermobalance Method", Phase 111 Summary Report t o ERDA, B a t t e l l e Report No. BMI-X-680, May 5, 1977.
Feldmann, H. F., Mima, J. A., and Yavorsky, P. M. , Coal Gas i f i ca t ion , Advances in Chemistry Series No. 131. Ed. by L. G. Massey, American Chemical Society, Washington, D.C., 1974, p 108.
Wen, C. Y . and Huebler, J., IhEC Proc. D e s . & Dev., ( 2 ) , 142 (Apri l , 1965).
Wen, C. Y. and Huebler, J., i b i d , p 147.
Wen, C. Y. , Mori, S. , Gray, 3. A., and Yavorsky. P. M., P rep r in t s of Fuel Chemistry Divis ion, ACS, 20 (41, 155 (1975).
Feldmann, H. F., Chemical Reaction Engineering Reviews, Advances i n Chemistry Se r i e s No. 148, Ed. by H. M. Hulber t , American Chemical Society, Washington, D.C., 1975, p 132.
Tomita, A., Mahajan, 0. P., and Walker, P. L.. Jr., P r e p r i n t s of Fue l Chemistry Division, ACS, 0 (3). 99 (1975).
Johnson, J. L . , P r e p r i n t s of Fue l Chemistry Divis ion, ACS, 2 (4) , 85 (1975).
I
t I
I
I 1
82
/Methanation I t 9 Hydrogasifier H I ,
Char
Ash
FIGURE.1. SCHEMATIC FLOWSHEET FOR DIRECT HYDROGASIFICATION OF COAL
Coal Feed
HZ (From Char)
FIGURE 2. SCHEMATIC OF TWO-STAGE HYDRO- GASIFIER FOR THE HYDRANE PROCESS (Ref. 17)
0 10 20 30 40 50 (
Time, minutes
FIGURE 3. TYPICAL THERMOBALANCE DATA FOR HYDROGASIFICATION OF CHAR
FIGURE 10. DEPENDENCE OF k ON CHAR PARTICLE SIZE FOR HYDROGASIFICATION AT 1000 C, 69 ATM,2100% H2
Hydrogasification Temperaturn. C 1000 950 900 850 800 750 700
8.2 Volume %
0 100
7.5 8.0 8.5 8.0 8.5 10.0
1 0 ~ 1 ~ . O K - ~
FIGURE 11. CORRELATION OF k2 WITH HYDROGASIFICATION CONDITIONS FOR CHARS DERIVED FROM ILLINOIS NO. 6 COAL. TOTAL PRESSURE = 69 ATM
a!
0) - B
5
5 X
c'
FIGURE 12 .
S 0.6a
e CI
E 0.55
v)
.- s 'E
8 0.5c
0.45
I . 2 0.40 8
0.35
40-
48% H2; 52% CHq
25
I I 1 1 I
700 750 800 850 900 950 1000
Temperature, C
DEPENDENCE OF bRT ON REACTION CONDITIONS. TOTAL PRESSURE = 69 ATM
H2 CH4 - 74 - 26 48 52
I I -.- ' '.
i I 1 I I , I I 5 10 15 20 60 100 140 180 220 260
Time, minuter FIGURE 13. COMBINED CARBON CONVERSION I N FIRST STAGE (DILUTE PRASE) AND SECOND
STAGE AS A FUNCTION OF TIME AT 69 ATM TOTAL PRESSURE FOR CHARS DERIVED FROM PITTSBURGH NO. 8 COAL
88
KINETICS OF POTASSIUM CATALYZED GASIFICATION
Char les J. Vadovic and James M. Eakman
Coal Research Laboratory Exxon Research and Engineer ing Company
P. 0. Box 4255 Baytown, Texas 77520
INTRODUCTION
The Exxon C a t a l y t i c Coal G a s i f i c a t i o n Process(?) i s based upon a new combination o f process ing s teps which avoid thermodynamic c o n s t r a i n t s i n - he ren t i n t h e p rev ious a r t . t h e manner i n which t h e r e a c t o r i s i n t e g r a t e d i n t o t h e o v e r a l l process a r e t h e keys t o t h i s concept. o f a k i n e t i c r e l a t i o n s h i p f o r c a t a l y t i c g a s i f i c a t i o n which can be used i n develop ing a model f o r t h e f l u i d bed r e a c t o r used i n t h i s process. Th is model i s needed t o c o r r e l a t e p i l o t u n i t convers ion da ta and as a des ign t o o l f o r commercial sca le u n i t s . Th i s paper r e p o r t s on t h e work which cu lminated i n t h e successful f o r m u l a t i o n o f t h e requ i red k i n e t i c expression.
t i o n ( 3 4 5) promote gas phase methanation equilibrium,(?,5J and m in im ize agglo&&ion o f cak ing c o a l s . ( l ) a l k a l i metal g a s i f i c a t i o n c a t a l y s t (K2CO3) w i t h a novel process ing sequence which maximizes t h e b e n e f i t s o f t h e c a t a l y s t . The process combines a r e l a - t i v e l y low g a s i f i e r temperature (13OOOF) and h i g h pressure (500 p s i g ) w i th t h e separa t i on o f syngas (CO + H2) f rom t h e methane product. t o t h e g a s i f i e r so t h a t t h e o n l y ne t products f rom g a s i f i c a t i o n a r e CH4, C02, and small q u a n t i t i e s o f H2S and NH3. r e a c t i o n can be represented as f o l l o w s :
The use of t h e c a t a l y s t i n the r e a c t i o n s tep and
The goal o f t h e work repo r ted here i s t he f o r m u l a t i o n
A l k a l i metal g a s i f i c a t i o n c a t a l y s t s increase t h e r a t e o f steam g a s i f i c a -
The c a t a l y t i c g a s i f i c a t i o n process uses an
The syngas i s r e c y c l e d
The r e s u l t i n g o v e r a l l g a s i f i c a t i o n
Coal + H20 + CH4 + C02
Since t h i s r e a c t i o n i s e s s e n t i a l l y thermoneutral, major heat i n p u t t o t h e gas i - f i e r a t h igh temperature i s no t requi red. Gallagher(?), second law c o n s t r a i n t s on thermal e f f i c i e n c y i nhe ren t i n o t h e r processes are avoided.
pregnated w i t h c a t a l y s t , d r i e d and f e d v i a a lockhopper system t o a f l u i d i z e d bed g a s i f i e r which operates a t about 130OoF and 500 ps ig. w i t h a m ix tu re o f steam and recyc led syngas. CH4, C02, CO, H2, and unconverted steam. gaseous products a re cooled and t h e unconverted steam i s condensed. u c t gas i s t r e a t e d i n a s e r i e s o f separa t i on steps i n c l u d i n g a c i d gas scrubbing t o remove CO2 and H2S, and cryogenic f r a c t i o n a t i o n t o separate methane f rom syngas. a t approx imate ly 15OoF above t h e g a s i f i c a t i o n temperature. no net heat r e q u i r e d f o r t h e g a s i f i c a t i o n reac t i ons , some small amount o f heat i n p u t i s requ i red t o heat up t h e feed coa l , t o vapor ize res idua l water, and t o p rov ide f o r g a s i f i e r heat losses.
Thus, as discussed by Nahas and
A s i m p l i f i e d f l o w p l a n f o r t h e process i s shown i n F igu re 1. Coal i s im-
The major g a s i f i e r e f f l u e n t s a r e The coa l i s g a s i f i e d
No t a r s o r o i l s are produced. The The d r y prod-
The syngas i s combined w i t h feed steam and recyc led t o t h e g a s i f i e r A l though t h e r e i s
Ash/char res idue f r o m t h e g a s i f i c a t i o n s tep i s sent t o a c a t a l y s t recovery
The recovered c a t a l y s t , a long wi th some makeup u n i t i n which a l a r g e f r a c t i o n o f t h e c a t a l y s t i s leached f rom t h e r e s i d u e u s i n g coun te rcu r ren t water washing. c a t a l y s t , i s re impregnated on t h e coa l t o complete t h e c a t a l y s t recovery loop.
EXPERIMENTAL
Design o f t h e g a s i f i e r f o r t h i s process r e q u i r e s a q u a n t i t a t i v e d e s c r i p t i o n o f t h e k i n e t i c s o f t h e c a t a l y t i c g a s i f i c a t i o n reac t i on . were conducted i n a f i x e d bed r e a c t o r t o prov ide t h e necessary da ta f o r t h e development o f t h e r a t e equat ion.
Bench sca le s tud ies
Apparatus
The h igh pressure apparatus used i n t h i s s tudy i s shown i n F i g u r e 2. main components o f t h e system a r e t h e f i x e d bed reac to r , water pump and steam generat ion equipment, pressure and temperature c o n t r o l systems, unreacted steam condenser, a gas chromatograph and a d r y gas f l o w measurement system. were inc luded f o r t h e o p t i o n a l use o f an i n e r t o r reac tan t gas (such as H2 + CO) as a feed supplementing steam.
A h igh pressure pump was used t o supply H20 a t a constant r a t e t o t h e steam generator which cons is ted o f 1 /4" s t a i n l e s s s t e e l t u b i n g c o i l e d around t h e f i x e d bed reac to r . i n a s p l i t tube furnace. The r e a c t o r temperature was measured and c o n t r o l l e d a t t h e center o f t h e bed o f char. The product gas stream, c o n s i s t i n g p r i m a r i l y o f H2, CO, CH4, C02 and unreacted H20, was f i l t e r e d and then depressur ized through t h e pressure c o n t r o l va lve. The unreacted H20 was condensed and t h e gas stream was f u r t h e r d r i e d by c a l c i u m s u l f a t e . chromatograph sampling system, which prov ided automat ic sampling a t 15-minute i n t e r v a l s . pu l se generator. measure o f t o t a l gas volume produced.
The
P r o v i s i o n s
Both t h e steam generator and t h e r e a c t o r were mounted v e r t i c a l l y
The d r y gas stream passed through a gas
The d r y gas f l o w was measured by a wet t e s t meter connected t o a The s i g n a l s f rom t h e pu lse generator were accumulated as a
The f i x e d bed r e a c t o r was cons t ruc ted f rom 1 - inch Schedule 80 s t a i n l e s s s t e e l p ipe and was approx imate ly 30 inches i n l eng th . t o a depth o f 15 i nches b y 1/8- inch m u l l i t e beads which supported t h e bed o f char.
The r e a c t o r was f i l l e d
Procedure
Samples were prepared by soaking 30 t o 100 mesh I l l i n o i s coa l No. 6 i n a s o l u t i o n c o n t a i n i n g t h e d e s i r e d weight o f c a t a l y s t , t y p i c a l l y between 10 and 20 gms K$O3/lOO gms o f coa l ( r e f e r r e d t o as 10 and 20% K2CO3). Normally, t h e weight r a t i o o f water t o coal was s l i g h t l y g r e a t e r than one. The samples were then d r i e d ove rn igh t i n a vacuum oven. A scanning e l e c t r o n microscope study showed a f a i r l y even d i s p e r s i o n o f potassium throughout t h e coal p a r t i c l e . impregnated coal samples were then d e v o l a t i l i z e d a t atmospheric pressure f o r 30 minutes i n a m u f f l e fu rnace under a n i t r o g e n atmosphere a t 1200°F. The samples were a l lowed t o coo l t o room temperature and then s to red i n b o t t l e s under n i t rogen.
The
90
I
I
I
4
I. I
I
I I m I
I
m 1 I I
I I
A r u n was made by l o a d i n g t h e r e a c t o r w i t h a 20 gram char sample. r e a c t o r was purged w i t h he l ium and t h e temperature was r a i s e d t o t h e des i red l e v e l . A t t h a t p o i n t t h e pressure i n t h e r e a c t o r was r a i s e d t o o p e r a t i n g c o n d i t i o n s by manual ly i n j e c t i n g water through t h e pump. When t h e run pres- sure was achieved, t h e pump was se t i n t h e automat ic mode. I f syngas was used, t h e supplementary gas va l ve was a l s o opened a t t h e s t a r t o f t h e run. Steam and syngas ( i f used) were then fed t o t h e reac to r . A t t h e end of a ' run, t h e feed was shut o f f and t h e u n i t depressured.
Ouring t h e run, gas analyses and cumulat ive d r y gas volumes were obtained. From t h i s da ta t h e carbon g a s i f i e d i s ca l cu la ted . Assuming t h a t t h e oxygen content o f t h e char i s smal l i n r e l a t i o n t o t h e oxygen content o f t he steam fed, t h e steam convers ion i s obta ined f rom t h e oxygen content o f t h e d r y product gases.
Runs were made i n t h e f i x e d bed r e a c t o r wi th I l l i n o i s coa l ca ta l yzed with 10% and 20% K2CO3 w i t h steam as t h e g a s i f y i n g medium. and 1300°F were used and pressures v a r i e d f rom 0 t o 500 ps ig . ranged from 3 t o 100 gm/hr. Wi th these cond i t i ons , steam convers ions f rom 10% t o 80% and t o t a l carbon conversions f rom 50% t o 100% were obtained. M a t e r i a l balances on hydrogen were used t o check t h e consis tency o f t h e data. The balance c losu res ranged f rom 100% t o 105% f o r t y p i c a l runs.
The
Temperatures o f 1200°F Steam f l o w s
Resul ts
Ouring t h e runs i t was observed t h a t t h e steam g a s i f i c a t i o n r a t e was in - dependent o f pressure. The g a s i f i c a t i o n r a t e was found t o i nc rease wi th an i nc reas ing r a t e o f steam f e d t o t h e reac to r . A d d i t i o n a l l y , a t h i g h steam f l o w rates, o r low steam conversions, t h e g a s i f i c a t i o n r a t e was d i r e c t l y p ropor t i ona l t o t h e c a t a l y s t loading. One exp lana t ion f o r these observat ions i s t h a t t h e k i n e t i c s a re c o n t r o l l e d by a s t rong product i n h i b i t i o n . Th is suggests t h a t a k i n e t i c express ion i n t h e c l a s s i c a l Langmuir-Hinshelwood form may be used t o f i t t h e data. It was f u r t h e r seen t h a t methane and carbon d i o x i d e were i n chemical e q u i l i b r i u m w i t h t h e o t h e r gas phase components f o r t h e cond i t i ons s tud ied, i.e., t h e methanation and s h i f t r e a c t i o n s a re a t equ i l i b r i um.
DATA INTERPRETATION
Fixed Bed Reactor Model
A mathematical model f o r t h e f i x e d bed r e a c t o r was developed based upon t h e observed behavior . P lug f l o w o f gas through t h e bed i s assumed. It i s a l s o assumed t h a t s t rong product i n h i b i t i o n r e s u l t s i n a h igh r a t e o f g a s i f i c a t i o n over a ve ry s h o r t d i s t a n c e o f t h e bed f o l l o w e d by a slower r a t e ove r t h e remain- i n g l e n g t h o f t h e bed where h ighe r p a r t i a l pressures o f products e x i s t . Th is assumption leads t o a s i m p l i f i e d p i c t u r e f o r t h e f i x e d bed r e a c t o r shown i n F igure 3. I n t h i s model t h e r e a c t i o n proceeds so as t o form a sharp "carbon bu rno f f f r o n t . " I f l i t t l e o r no carbon i s present , g a s i f i c a t i o n w i l l no t t ake place. Therefore, t h e potassium c a t a l y s t which i s l e f t behind t h i s "bu rno f f f r o n t " does no t c o n t r i b u t e t o t h e r e a c t i o n ra te .
91
The equat ion d e s c r i b i n g convers ion i n t h e p lug f l o w r e a c t o r i s
where 1 i s t h e r e a c t o r volume, N&~J i s t h e molar r a t e o f steam f e d t o t h e
reac to r , r G i s t h e mo la r r a t e o f t h e carbon-steam g a s i f i c a t i o n r e a c t i o n pe r u n i t volume and 5 i s t h e ex ten t o f r e a c t i o n de f i ned as moles carbon g a s i f i e d pe r mole steam fed. between t h e carbon remain ing i n t h e bed and t h e e f f e c t i v e f i x e d bed r e a c t o r v o l ume,
-
The sharp b u r n o f f f r o n t model p rov ides a r e l a t i o n s h i p
nc = Cc V (2 )
where nc i s t h e instantaneous moles o f carbon i n t h e bed, 1 i s t h e e f f e c t i v e reac to rvo lume, and Cc i s t he p r o p o r t i o n a l i t y cons tan t w i t h t h e dimension moles carbon pe r u n i r v o l u m e . a va lue o f approx imate ly 0.045 gmole/cc. Equat ion (1 ) prov ides
Based upon i n i t i a l bed c o n d i t i o n s Cc w i l l have S u b s t i t u t i o n o f E q u a t i o n ( 2 ) i n t o
T h i s model may now be used f o r t h e i d e n t i f i c a t i o n o f acceptable forms f o r t h e ra te , r G , and t o o b t a i n bes t f i t values f o r t h e parameters i n these expressions. -
A Langmuir-Hinshelwood t y p e express ion f o r heterogeneous c a t a l y t i c k i n e t i c s as appl ied t o t h e carbon-steam r e a c t i o n may be w r i t t e n i n t h e genera l i zed form.
where pHpO, pco, w, e t c . rep resen t t h e p a r t i a l pressures o f these components, k i s t h e k i n e t i c r a t e constant f o r t h e carbon-steam reac t i on , KG - -
-
92
i s t h e e q u i l i b r i u m constant f o r t h i s reac t i on , and t h e b ' s rep resen t t h e adsorp- t i o n constants, no more than f o u r o f which w i l l be a l lowed t o be nonzero i n any one model be ing tested.
Equation (4 ) when s u b s t i t u t e d i n t o Equat ion (3 ) g i ves
where t h e r e a c t i o n d r i v i n g f o r c e term i n t h e denominator o f each o f t h e i n t e g r a l s i s g iven by
For a g i ven conversion,the s h i f t and methanation e q u i l i b r i u m r e l a t i o n s h i p s a r e s u f f i c i e n t t o c a l c u l a t e t h e p a r t i a l pressures o f a l l components (He , CO, CH4, CO2, H20) i n t h e gas phase. mental values f o r x, t h e p a r t i a l pressures were accu ra te l y mapped ove r a range o f conversions. Tf i is needed t o be done o n l y once. These p a r t i a l pressures were then s u b s t i t u t e d as r e q u i r e d i n t o t h e expressions under t h e i n t e g r a l s shown i n Equat ion (5). t hen obta ined by a Simpson's r u l e numerical i n t e g r a t i o n o f t h e express ion under t h e i n t e g r a l s .
above were used t o c a l c u l a t e and t a b u l a t e conversion, x, moles carbon g a s i f i e d p e r mole steam f e d as a f u n c t i o n o f ho ld ing t ime, 2, moles instantaneous bed carbon per molar steam f l o w r a t e . bed potassium c a t a l y s t g a s i f i c a t i o n requ i res t h a t t h e data f o r 5 as a f u n c t i o n o f e c o l l e c t e d f o r d i f f e r e n t steam f l o w r a t e s must a l l mesh t o g e t h e r t o g i v e a s i n g l e curve f o r any f i x e d temperature, pressure, and c a t a l y s t l oad ing . A p l o t o f data c o l l e c t e d f o r steam g a s i f i c a t i o n over a range o f steam f l o w r a t e s a t 1300°F, 500 p s i g and 20% K2CO3 on I l l i n o i s coal i s prov ided i n F i g u r e 4. Fo r each experimental r u n t h e i n i t i a l da ta p o i n t s a re a t t h e r i g h t and move t o t h e l e f t as carbon i s depleted f rom t h e bed. The f l a t reg ion i n t h e data a t t h e upper r i g h t o f F igu re 4 represents the e q u i l i b r i u m l i m i t f o r t h e carbon steam react ion. This l i m i t corresponds t o a carbon a c t i v i t y o f about t w i c e t h a t o f 6-graphite. The r e g i o n a t t h e lower l e f t o f t he diagram shows t h e carbon conversions l i m i t e d by t h e r a t e o f reac t i on . The data p o i n t s a t t h e d i f f e r e n t steam r a t e s over lap i n t h e requ i red manner over t h r e e orders o f magnitude o f residence t ime. Thus, t h e experimental observat ions are cons is ten t w i t h t h e pos tu la ted model. o f t h e r e a c t i o n data.
Using a c l o s e l y spaced s e r i e s o f i nc re -
The va lues o f these i n t e g r a l s f o r any s p e c i f i e d convers ion a re
The data c o l l e c t e d i n t h e f i x e d bed steam g a s i f i c a t i o n experiments descr ibed
The "carbon b u r n o f f f r o n t " model f o r f i x e d
This r e a c t o r model was then used as t h e bas i s f o r t h e ana lys i s
93
Parameter Es t ima t ion
of Equation (5) were es t ima ted by reg ress ion analys is . used cons is ted o f t h e r e s u l t s o f t h e steam g a s i f i c a t i o n runs a t 500 p s i g desc r ibed above as w e l l as runs a t 0, 100 and 250 p s i g a t steam r a t e s o f 6, 12 and 24 gm HzO/hr. t h e same t h r e e steam r a t e s . second was a t 1300°F and 10% K2CO3. assess t h e e f f e c t o f temperature and c a t a l y s t l oad ing on g a s i f i c a t i o n rate.
constants i n Equat ion (5). These models cons is ted o f a l l combinations o f f rom one , to fou r terms i n v o l v i n g t h e p a r t i a l pressures o f H2, CO, and H20 and t h e cross products o f t h e p a r t i a l pressures o f H2 and CO, and H2 and H20. Those which gave n e g a t i v e c o e f f i c i e n t s on reg ress ion were d iscarded as be ing p h y s i c a l l y unreal . an i n f i n i t e r a t e i n t h e l i m i t o f zero steam conversion. The t h r e e models which remained a r e
The c o e f f i c i e n t s i n f r o n t o f t h e i n t e g r a l s i n a s e r i e s o f p a r t i c u l a r forms The reg ress ion data base
Two a d d i t i o n a l s e r i e s o f runs were conducted a t 500 p s i g and The f i r s t was a t 1200°F and 20% K2CO3 and t h e
The da ta from these runs were used t o
Numerous k i n e t i c models were formulated and t e s t e d b y reg ress ion f o r t h e
Four a d d i t i o n a l models were d iscarded because they gave
(7)
A l l are independent o f pressure. regress ion l i n e f o r t hese a re A: 0.0556, 6: 0.0519, and C: 0.0562. Since Model B has a sma l le r v a r i a n c e than A o r C, i t was chosen as t h e bas i s f o r f u r t h e r analys is . between these and p o s s i b l y o t h e r k i n e t i c expressions. The c o e f f i c i e n t s obtained by reg ress ion o f Model B are
The var iance o f the r e s i d u a l s around t h e
However, f u r t h e r s t u d i e s should be done t o b e t t e r d i s c r i m i n a t e
C 2 = 1.603 hr k
- = blCc 0.3371 hr /a tm k
- = b2Cc 0.0954 h r k
94
These c o e f f i c i e n t s were u s e d . i n Equat ion ( 5 ) t o compute t h e va lues o f e re - q u i r e d t o achieve t h e va r ious measured convers ion l e v e l s . These ca lcuTated va lues a re compared t o t h e actual h o l d i n g t imes i n F igu re 5,. s c a t t e r t o t h e data, i t i s seen t h a t . t h e model p rov ides a reasonable f i t ove r t h e broad range o f pressures (0-500 p s i g ) and f l o w r a t e s (3-100 gm/hr) cons idered.
Using t h e approximate va lue o f C c = 0.045 gmole/cc, t h e va lues f o r t h e
While t h e r e i s
parameters a t 1300°F and 20% K2CO3 load ingmay be expressed as
k = 0.0281 a bl = 0.210 atm-’
b2 = 0.0595
h r - c c
I t was found by comparing t h e 1200°F and 1300°F da ta t h a t t h e r a t e constant , k, has an a c t i v a t i o n energy o f 30 kcal/gmole i n t h e Arrhenius expression. more, i t s va lue a t t h e 10% KzCO3 l o a d i n g was approx imate ly h a l f t h a t a t t h e 20% K2CO3 l e v e l .
Fu r the r -
Hence, w i t h i n t h i s range k may be expressed as
k = koCK exp(- E/RT). (10)
where ko i s t h e frequency f a c t o r , CK i s t h e moles o f c a t a l y t i c a l l y a c t i v e potasslum pe r u n i t volume, i s th-e-activation energy, i s t h e u n i v e r s a l gas constant and T i s t h e abso lu te temperature. t h e va lue o f TK f o r t h e f i x e d bed o f char i s t y p i c a l l y
For 20% KzCO3 on I l l i n o i s coal
-
CK = 0.0021 gmole/cc
On t h i s bas i s t h e va lue o f t h e frequency f a c t o r may be computed as
7 ko = 6.80 X 10 gmole C/hr.gmole K
f o r
E = 30 kcal/gmole.
The r a t i o o f h o l d i n g t imes necessary t o a t t a i n a g i v e n convers ion l e v e l , - x, a t two d i f f e r e n t temperatures and c a t a l y s t l e v e l s i s g i ven by
95
T h i s assumes t h a t t h e temperature d i f f e r e n c e does not e q u i l i b r i u m calcu!,at ion f o r t h e p a r t i a l pres;ur$s. d e f i n i t i o n o f an e q u i v a l e n t res idence time, g , which can be used t o combine daia c o l l e c t e d a t d i f f e r e n t temperature2 and c a t a l y s t l e v e l s . q u a n t i t y 2 i s d e f i n e d as t h e h o l d i n g t i m e a t _I and CK* which w i l l g i v e t h e same convers ion as t h a t obta ined w i t h a h o l d i n g t ime 2 a t temperature' T and c a t a l y s t c o n c e n t r a t i o n CK. S p e c i f i c a l l y ,
s i g n i f i c a n t l y a f f e c t t h e Equation (11) a l l ows t h e
The
- -
e* = e - cK e x p [ - k ( + - k)] c;
This r e l a t i o n s h i p was r e a c t i o n da ta c o l l e c t e d a t t h e data base c o l l e c t e d a t
t e s t e d f o r i t s a b i l i t y t o c o r r e l a t e 500 p s i g f i x e d bed 10% K2C03-1300"F and 20% K2C03-12OO0F w i t h 20% K2C03-1300°F. The r e s u l t i s g i ven by t h e
d a t a po in ts shown i n F i g u r e 6 where conversion, x, i s p l o t t e d as a f u n c t i o n equ iva len t res idence t ime , g*, w i t h a l l data ad jus ted i f needed t o 1300°F and 20% K2CO3. It i s seen t h a t t h e da ta appear u n i f o r m l y c o r r e l a t e d by t h i s expression.
Genera l ized F i x e d Bed Model
The above k i n e t i c r e l a t i o n s h i p s apply t o a pure steam feed. I n o rde r t o a p p l y them t o t h e syn thes i s gas r e c y c l e case, t hey must be genera l i zed f o r mixed gas i npu t t o t h e f i x e d bed. This may be done by w r i t i n g t h e d i f f e r e n t i a l equations d e s c r i b i n g t h e molar f l o w o f each molecular species through t h e bed and numer ica l ly i n t e g r a t i n g these over t h e e f f e c t i v e volume. These equat ions a r e
(13) - = A (-3 rM + r s + r G ) d NH2
dz
- = A (-rM - r s + r G ) d NCO
dz
- = A ' S d NC02
dz
(14)
where N i i s t h e mo la r f low r a t e o f component I, r i s t h e d i s tance down t h e bed, A T s t h e c ross -sec t i ona l area o f t h e bed, and q. r s and r G a r e t h e - - -
96
r a t e s of t he methanation, s h i f t , and carbon-steam g a s i f i c a t i o n r e a c t i o n s re- s p e c t i v e l y expressed as moles p e r u n i t r e a c t o r volume pe r u n i t time.
r e a c t i o n s a re The r e a c t i o n r a t e express ions used f o r t h e s h i f t and methanat ion
r S = kS (PCO PHzO - PCOz.PHz/KS) (18)
(19) 3
r M = kM (PCO PH2 - PCH4 PH201K)
where k-j and k# a re t h e r e s p e c t i v e r a t e constants and KS and KM a r e t h e
r e s p e c t i v e e q u i l i b r i u m constants . b y ass ign ing a r b i t r a r i l y l a r g e r a t e constants. used f o r t he potassium ca ta l yzed carbon-steam r e a c t i o n i s ob ta ined by com- b i n i n g Equations (8) and (10)
- - - - These reac t i ons may be f o r c e d t o e q u i l i b r i u m
The r e a c t i o n r a t e exp ress ion
The o rd ina ry d i f f e r e n t i a l Equat ions (13)- (17) were numer i ca l l y i n t e g r a t e d b y a Runga-Kutta-Fehlberg procedure f o r a s e r i e s o f cases c o n s i d e r i n g pure steam f e d t o a f i x e d bed r e a c t o r a t 500 ps ig, 1300°F and CK = .0021 gmoles potassium pe r cc (corresponding t o 20% K2CO3 on I l l i n o i s coa l ) . was determined a t va r ious d is tances, z, down t h e bed f rom
Thrconvers ion , E,
NCO + NCH4 + NC02 x =
The res idence t i m e corresponding t o each convers ion was computed as
Cc A z
NH20
e = - 0
The i n t e g r a t i o n s performed i n t h i s manner f o r va r ious steam f l o w r a t e s overlapped t o g i v e t h e s i n g l e c o r r e l a t i o n l i n e shown i n F igu re 6. t o p rov ide a reasonable f i t t o t h e data.
Th is l i n e i s seen
Model V e r i f i c a t i o n Experiments
To t e s t t h e p r e d i c t i v e c a p a b i l i t y o f t h e k i n e t i c model w i th a mixed gas feed, two f i x e d bed g a s i f i c a t i o n runs were made w i t h steam p l u s syngas (H2 + CO)
97
a t 1300OF. second was made w i t h 15 l i t e r pe r hour syngas a t 100 ps ig . made w i t h 12 grams pe r hour steam feed. was 75 mole % H2 and 25 mole % CO. was computed as
One r u n was made w i t h 5 l i t e r per hour syngas a t 500 ps ig . The Both runs were
I n b o t h cases the,syngas composi t ion I n these experiments t h e conversion, 5,
0
NCO + NCH4 + NC02 - NCO x =
0
NH20
0
where NCO i s t h e mo la r r a t e o f carbon monoxide f e d t o t h e reac to r . reside= t i m e i s computed by Equat ion (22). A comparison between t h e p r e d i c t e d and experimental convers ions f o r these two experiments i s shown i n F i g u r e 7. Good agreement i s observed i n t h e 500 p s i g case. a r e e s s e n t i a l l y t h e same as observed above f o r pure steam feed. A t 100 p s i g w i t h h i g h e r syngas f l ow , t h e d a t a show a lower convers ion than a t 500 p s i g f o r t h e same residence t ime. I t i s a l s o seen t h a t t h e model underp red ic t s t h e a c t u a l conversion. Th is may be due, i n p a r t , t o t h e use o f parameters which a r e d e r i v e d from pure steam data.
The
The convers ions ob ta ined here
CONCLUSIONS
An emp i r i ca l Langmuir-Hinshelwood k i n e t i c model f o r t h e potassium ca ta l yzed g a s i f i c a t i o n o f I l l i n o i s #6 b i tuminous coal has been developed. Th is model p rov ides a good f i t t o f i x e d bed r e a c t o r da ta over pressures rang ing f rom atmospheric t o 500 p s i g and a 3 0 - f o l d range o f steam f l o w ra tes . It a l s o p r e d i c t s convers ions f o r t h e temperature range 120OoF t o 130OOF and c a t a l y s t l o a d i n g s f rom 0.1 t o 0.2 grams K2CO3 pe r gram o f coal . l e v e l s examined, t h e g a s i f i c a t i o n r a t e was p r o p o r t i o n a l t o t h e amount o f c a t a l y s t present . A d d i t i o n a l s t u d i e s need t o be performed over a broader range o f c a t a l y s t l oad ings t o determine t h e l i m i t s o f t h i s r e l a t i o n s h i p . It was a l s o shown t h a t these k i n e t i c s can be a p p l i e d t o p r e d i c t t rends i n convers ion f o r H20, H2 and CO mixed gas feeds.
c a p a b i l i t i e s i n t h e range o f i n t e r e s t . d i r e c t l y i n t h e development o f models f o r f l u i d bed g a s i f i c a t i o n reac to rs . Thus, the goal f o r t h i s s tudy has been achieved. Future work w i l l be d i r e c t e d toward fo rmu la t i ng a f l u i d bed r e a c t o r model.
F o r t h e c a t a l y s t
The k i n e t i c exp ress ion obta ined has been shown t o have adequate p r e d i c t i v e It i s i n a form which can be used
ACKNOWLEDGEMENT
This work was supported, i n p a r t , by Contract #(49-18)-2369, U.S. Department o f Energy.
I I 8
I I I
I
98
Nomenclature
A cross-sectional area of reactor
b
Cc
CK
E
k r a t e constant f o r carbon-steam reaction
k o frequency f ac to r i n Arrhenius expression f o r carbon-steam reaction r a t e constant
kM r a t e constant f o r methanation reaction
kS r a t e constant f o r s h i f t reaction
KG equilibrium constant f o r carbon-steam reaction, atm
K M equilibrium constant f o r methanation reaction, atmm2
KS equilibrium constant f o r s h i f t reaction
N i molar flow rate of component 1 NO molar flow r a t e of component 1 fed t o reactor
i
nc moles carbon ( t o t a l in reac tor )
pi par t ia l pressure of component L, atm
R universal gas constant
RG
rG
rM
rs V volume of fixed bed reactor
x
z e
adsorption constant in Langmuir-Hinshelwood r a t e expression
carbon concentration, moles C per u n i t reactor volume
potassium concentration, moles K per unit reactor volume
ac t iva t ion energy in Arrhenius expression f o r carbon-steam reaction r a t e constant
driving force f o r carbon-steam reaction, see Equation ( 6 )
molar r a t e of carbon-steam reaction per u n i t reactor volume
molar r a t e of methanation reaction per un i t reactor volume
molar r a t e of s h i f t reaction per un i t reactor volume
extent of reaction, moles carbon reacted per mole H20 fed
distance from s ta r t of fixed bed reactor
residence time in fixed bed, moles bed carbon-hr/mole H20 fed
99
References
1 . G. F . Crewe, V. Gat, and V. K. Dh i r , "Decaking o f B i tuminous Coals by A l k a l i n e So lu t i ons " , E, 54, 20-23 (1975).
2. W. R. Epperly, and H. M. Siegel, " C a t a l y t i c Coal G a s i f i c a t i o n f o r SNG Product ion" , i n "11th I n t e r s o c i e t y Energy Conversion Eng ineer ing Conference Proceedings, American Soc ie ty o f Mechanical Engineers, N.Y. (1976), pp. 249-253.
3 . W. P. Haynes, S. J. Gasior , and A. J. Forney, "Ca ta l ys i s $f Coal G a s i f i c a t i o n a t E levated Pressure," i n L. G. Massey ed., ca t i on " , Advances i n Chemistry Se r ies No. 131, Ame'r. Chem. SOC., Washington, D. C. (1974), pp 179-202.
Coal G a s i f i -
4. W..K. Lewis, E. R. G i l l i l a n d , , and H. H ipk in , "Carbon-Steam React ion a t Low Temperatures", Ind. Eng. Chem., 45, 1697-1703 (1953).
5. N. C. Nahas and J. E. Gallagher, Jr., " C a t a l y t i c G a s i f i c a t i o n Predevelopment Research", paper presented a t t h e 13 th I n t e r s o c i e t y Energy Conversion Engineer ing Conference" (August, 1978).
6. H. S. Tay lor , H. A. N e v i l l e , "Ca ta l ys i s in,,the I n t e r a c t i o n o f Carbon w i t h Steam and w i t h Carbon Diox ide, J. Am. Chem. SOC., 43, 2065-2071 (1921).
This paper was prepared as an account o f work sponsored, i n p a r t , by t h e U n i t e d S ta tes Government. n o r any o f t h e i r employees, nor any o f t h e i r con t rac to rs , subcontractors , o r t h e i r employees, makes any warranty, express o r impl ied, o r assumes any l e y a l l i a b i l i t y o r r e s p o n s i b i l i t y f o r t h e accuracy, completeness, o r usefu lness o f any in format ion, apparatus, product, o r process d isc losed, o r represents t h a t i t s use would n o t i n f r i n g e p r i v a t e l y owned r i g h t s .
N e i t h e r t h e U n i t e d S ta tes nor t h e U n i t e d S ta tes DOE,
100
I
a
I m
101
SUPPLEMENTARY
BUBBLER
LEGEND: T I =Temperature indicator TIC =Temperature Indicator - Controllei PRC = Pressure Recorder - Controller
I,
I I
GAS - CHROMATOGRAPHS
I’
1 w VENT
a WET TEST METER -
FIGURE 2 SCHEMATIC DIAGRAM OF BENCH SCALE I FIXED BED GASIFICATION UNIT
78B-6-4-8 I
102 I 1 1
N O 7
103
L c --I
8 . 8
8 e
e 8 e
4
* e %.
4 be 0
I 4 0
b
105
cu 0
106
0 d
0 4
0 j- 9:
0 1 8 4 0
107
Reaction Charac te r i s t ics During In-S i tu Gasification o f Western Subbituminous Coals
J . E. Young and J . Fischer
Chemical Engineering Division Argonne National Laboratory 9700 South Cass Avenue Argonne, IL 60439
INTRODUCTION
advantages which suggest i t s use both as a supplement t o and, in some cases a subs t i t u t e f o r conventional mining combined w i t h surface gas i f ica t ion . These include:
In-situ gas i f i ca t ion of coal o f f e r s a number of s ign i f i can t potential
- Utilization of coal reserves w h i c h cannot be economically recovered by conventional techniques
- Reduction of cap i t a l expenditures and operating costs - Easier and more economic control of pollution problems - Less stringent feed water qua l i t y requirements - Reduction of the health and safe ty problems associated w i t h conven-
tional coal processing techniques - Reduction of socioeconomic impact In underground gas i f i ca t ion , wells a r e d r i l l e d i n t o a coal seam fo r gas
in jec t ion and product recovery and are linked by means of any of several tech- niques including: t ional d r i l l i n g , and explosive f rac tur ing . The linking s t ep f a c i l i t a t e s move- ment o f product gas from the reaction zone to the recovery wells.
Maintenance of a high-permeability l ink between wells i s extremely d i f - f i c u l t with Eastern coking coals, because of their swelJ inga th igh tempera- tures. I n addition, t ranspor t of water and reac tan t gases t h r o u g h Eastern seams i s more d i f f i c u l t because of the lower permeability o f the coal i t s e l f in i t s natural s t a t e . As a r e s u l t , the g rea t e s t success has been with under- ground gas i f ica t ion of Western subbituminous coals and Texas l i gn i t e s .
Research Center w i t h Pit tsburgh seam coal near Pricetown, West Virginia, b u t no complete gas i f i ca t ion test has y e t been completed. t e s t s have been completed by the Laramie Energy Research Center a t Hanna, Wyoming, and by Lawrence Livermore Laboratory a t Hoe Creek, Wyoming. In ad- d i t i on , Texas U t i l i t i e s Service Company has conducted f i e l d t e s t s in Texas l i g n i t e deposits, u t i l i z i n g technology licensed from the Soviet Union.
I n underground coal gas i f ica t ion ( U C G ) , th ree more-or-less well-defined reaction zones can be iden t i f i ed . i s the drying and pyro lys i s zone, the pyrolysis reactions occur. driven forward i n t o the cooler regions of the seam, with a portion being crack- ed t o l i gh te r hydrocarbons. t o be carried with the product gas stream out of the coal seam. behind the pyrolysis zone i s the reducing zone or gas i f ica t ion zone. a rea , the primary reac t ions are:
Field studies a re cur ren t ly b e i n g car r ied out by the Morgantown Energy
Several gas i f ica t ion
The zone nearest the product recovery well in which water i s driven from the coal and
Tars produced i n t h i s zone a re continually
Cracking proceeds unt i l the t a r s a re l i g h t enough Immediately
In t h i s
108
1 ) C + H20 + H2 + CO
c + co2 2 2 co 2)
3)
4 )
C + 2H2 -+ CH4
CO + H20 H2 + C02
CO + 3H2 2 CH4 + H20 5)
The water necessary f o r r e a c t i o n 1) i s supp l i ed e i t h e r by i n j e c t i o n o f steam w i t h t h e a i r o r oxygen o r by na tu ra l if the coal seam i s a n a t u r a l a q u i f e r (as i s t h e case f o r many Western coa l seams). Behind t h e g a s i f i c a t i o n zone i s t h e combustion zone, which supp l i es t h e process heat . Heat i s t r a n s f e r r e d from t h e combustion zone t o t h e g a s i f i - c a t i o n zones p r i m a r i l y b y convect ion o f t h e product gases, r a t h e r than by con- d u c t i o n through t h e s o l i d char and coa l .
I n exper imenta l s t u d i e s a t Argonne, t h e k i n e t i c s o f t h e r e a c t i o n s occur- r i n g i n the g a s i f i c a t i o n zone a r e being measured. The data f rom these s t u d i e s a r e used i n mathematical models be ing developed a t o t h e r l a b o r a t o r i e s f o r each o f t he f i e l d p r o j e c t s . Th i s paper descr ibes t h e r e a c t i o n c h a r a c t e r i s t i c s o f coa ls f rom t h e Hanna No. 1 and Wyodak coal seams f o r r e a c t i o n s l), 4), and 5 ) . Data f o r r e a c t i o n s 2 ) and 3) a r e n o t y e t complete and a r e n o t d iscussed here.
EXPERIMENTAL
i n t r u s i o n o f water i n t o t h e r e a c t i o n zone
The k i n e t i c experiments were c a r r i e d o u t i n a d i f f e r e n t i a l packed-bed re - a c t o r system capable o f s i m u l a t i n g any o f t h e o p e r a t i n g c o n d i t i o n s expected i n underground g a s i f i c a t i o n . The p roduc t gas from t h e r e a c t o r i s analyzed f o r H , CO, CH , and CO b y gas chroma- tography. A l l ope ra t i ng temperatures, pressur&, and g?s f l ows Ere moni tored and recorded on punched paper tape by means o f a data l o g g i n g system. I n ad- d i t i o n , t h e da ta o u t p u t f rom the gas chromatograph i s recorded on punched tape, p e r m i t t i n g r a p i d computer process ing o f t he l a r g e amount o f da ta produced.
A schematic o f t h i s system i s shown i n F i g 1.
I n a t y p i c a l g a s i f i c a t i o n experiment, t h e coa l i s crushed t o -4 +12 mesh, and a 5 t o 20 g sample i s p laced i n t h e r e a c t o r . a t a hea t ing r a t e o f 3"C/min i n a f l o w o f 1.0 t 0 2 . 5 l / m i n 20% hydrogen i n n i - trogen. The f i n a l p y r o l y s i s temperature i s t h a t a t which the g a s i f i c a t i o n experiment i s t o be c a r r i e d out . When t h e f i n a l p y r o l y s i s temperature i s reached, the r e a c t o r i s f l ushed w i t h n i t r o g e n a t t h e f i n a l temperature f o r approx imate ly 30 min, and then steam and/or o t h e r reac tan ts a re in t roduced.
s ion, which a r e then i n t e g r a t e d over t ime t o c a l c u l a t e the e x t e n t of carbon conver ison. Rates and ex ten ts o f carbon convers ion a r e expressed on an ash- f r e e bas is . Fo l l ow ing each g a s i f i c a t i o n experiment t h e char res idue i n t h e r e a c t o r i s burned t o determine the f i n a l carbon balance f o r t h e experiment. Genera l ly , carbon balances a r e near 100%.
The coa l i s t hen p y r o l y z e d
System pressure du r ing p y r o l y s i s i s 790 kPa (100 p s i g ) .
The product gas composi t ion data a r e conver ted t o r a t e s o f carbon conver-
109
RESULTS AND DISCUSSION
1 . Steam-Char React ion
hvdroaen. carbon monoxide, carbon d iox ide , methane, and n i t rogen . -om underground g a s i f i c a t i o n c o n s i s t s p r i m a r i l y o f
Th is m'lxtu;e c o n s t i t u t e s a reducing atmosphere which sweeps through t h e coa l d u r i n g p y r o l y s i s . d u r i n g p y r o l y s i s p r i o r t o our study o f g a s i f i c a t i o n k i n e t i c s , t h e sweeping gas m ix tu re should c o n t a i n a l l o f these c o n s t i t u e n t s .
I n o rde r t o o b t a i n a t r u e s i m u l a t i o n o f these c o n d i t i o n s
However, t h e a d d i t i o n o f carbon monoxide t o the p y r o l y s i s sweeping gas would r e s u l t i n t h e d e p o s i t i o n o f carbon, which would be added t o t h e char i n the g a s i f i c a t i o n r e a c t o r . Th is a d d i t i o n a l carbon would be a product o f t h e reverse Boudouard r e a c t i o n , ca ta l yzed by t h e coal ash and by t h e metal components o f t h e r e a c t o r :
2co 2 c + co2
Deposited carbon i s n o t q u a n t i t a t i v e l y determinable and must be e l i m i - nated o r made n e g l i g i b l e i n o r d e r t o o b t a i n a carbon balance. Therefore, our p y r o l y s i s reac t i ons have been c a r r i e d o u t i n a reducing atmosphere c o n s i s t i n g o f o n l y hydrogen and n i t r o g e n . Our experiments i n d i c a t e t h a t f o r Wyodak coa l , p y r o l y s i s i n a reduc ing atmosphere (20% H2, balance Nz) r e s u l t s i n recovery o f approx imate ly t e n pe rcen t l e s s char f o l l o w i n g p y r o l y s i s than when pure n i t r o g e n i s used as t h e sweeping gas. However, t h e r e a c t i v i t y o f t h e char produced i n hydrogen and n i t r o g e n i s t he same as t h a t f o r char produced i n pure n i t r o g e n .
The r a t e o f r e a c t i o n o f steam w i t h chars prepared from Wyodak coa l has been measured i n t h e temperature range, 600-775"C, w i t h a p a r t i a l pressure o f steam o f 0.25-0.26 MPa (2.5-2.6 atm), and a t o t a l pressure o f approx imate ly 0.9 MPa (0 atm). These r a t e s a r e p l o t t e d as a f u n c t i o n o f r e c i p r o c a l temper- a t u r e (Arrhenius p l o t ) f o r Wyodak coa l i n F i g . 2. A t each temperature, t h e r e a c t i o n r a t e s f o l l o w i n g g a s i f i c a t i o n o f 10% o f t he carbon and a l s o f o l l o w i n g g a s i f i c a t i o n of 50% o f t h e carbon a r e shown. The r a t e a t 10% carbon convers ion corresponds t o t h e r a t e f o r f r e s h char ; t h e r a t e a t 50% convers ion corresponds t o t h a t f o r t h e more r e f r a c t o r y r e s i d u a l char .
The apparent a c t i v a t i o n energ ies (E,) c a l c u l a t e d from F ig . 2 a r e summarized i n Table 1. much g rea te r a t 10% convers ion than a t 50% conversion, which i s c o n s i s t e n t wi th t h e expec ta t i on t h a t m ic ropore d i f f u s i o n i s a l i m i t i n g f a c t o r f o r t h e steam-char r e a c t i o n under c o n d i t i o n s expected i n an underground g a s i f i e r . pe rcen t o f t h e carbon has been g a s i f i e d , t h e micropore s t r u c t u r e has opened some- what, r e s u l t i n g i n t h e h i g h e r va lues f o r Ea a t 50% conversion.
The decrease i n Ea as a r e s u l t o f i nc reas ing t h e temperatures i s
By t h e t ime 50
I It I I:
1' I: I IE
110
Table 1
Apparent Activation Energies fo r Steam-Char Reaction
Ea a t 10% Conversion Conversion
Ea a t 50%
Wyodak 60OOC 182 kJ/mol
775 "C 53 kJ/mol (43.6 kcal/mol)
(12.8 kcal/mol ) Hanna
600°C 143 kJ/mol
775°C 89 kJ/mol (34.1 kcal/mol)
(21.2 kcalmmol)
235 kJ/mol
109 kJ/mol (56.3 kcal /mol )
(26.1 kcal /mol )
156 kJ/mol
110 kJ/mol (37.2 kcal/mol)
(26.2 kcal /mol )
In F i g . 3, the temperature dependence of the rate of reaction o f steam with chars prepared from Hanna No. 1 coal i s shown. The steam par t ia l pressure was 0.25 MPa (2.5 atm). The temperature range was 600-775°C. The apparent ac t iva- t ion energies calculated from the curves f o r Hanna coal a r e a l so l i s t e d i n Table 1. The lower values of Ea a t higher temperatures f o r the Hanna coal a r e ind ica t ive of more severe micropore diffusion l imi ta t ions with the Hanna char than with the Wyodak coal.
The Wyodak char pyrolyzed under simulated UCG conditions has a nitrogen BET surface area o f approximately 1 d / g , and the surface area measured by carbon d i - oxide adsorption i s approximately 450 rn2/gm. For the Hanna char, the BET surface i s 0.2 d / g , and the CO2 surface area i s approximately 550 m2/g. These data in- d ica te tha t f o r both chars, the pore s t ruc tu re of the fresh char is l imited to extremely small micropores. The pore s t ruc tu re of the Hanna char , as indicated by CO2 surface areas, i s apparently even smaller on the averaqe than i s t h a t f o r the Wyodak char, an observation cons is ten t with var ia t ions encountered in Ea f o r the steam-char reaction of each of these two chars. The micropores a r e apparent- l y not accessible to the reactant steam, and must be opened appreciably t o a t t a i n maximum reaction r a t e s .
Wyodak chars prepared by pyrolysis a t 3"C/min in e i t h e r nitrogen or 20% H2 i n nitrogen were gasified a t 700°C with steam a t par t ia l pressures of 0.12-0.65 MPa (1.2-6.5 atm). steam par t ia l pressure in Fig. 4. A t lower pa r t i a l pressures of steam, the curve i s nearly l i nea r , w i t h a slope of approximately 0.85. a reaction order of 0.85 with respect t o steam. A t higher steam pa r t i a l pres- sures , the reaction order decreases as indicated by the f l a t t en ing of the curve in F i g . 4. Since underground gas i f ica t ion of coal would generally involve pa r - t i a l pressures of steam a t the lower end of t h i s range, the reaction order of 0.85 i s probably applicable f o r use i n the mathematical models proposed f o r this process.
Reaction r a t e f o r Wyodak char i s plotted as a function of
This corresponds t o
111
Fig. 5 shows t h e dependence of t h e r e a c t i o n r a t e on t h e p a r t i a l pressure o f steam f o r Hanna char . The r e a c t i o n r a t e i s p l o t t e d f o r convers ions o f 10, 30, and 50% o f carbon, i n t h e range o f 0.1-0.27 MPa (1.07-2.7 atm) steam. I n t h e case o f t h e Hanna char , a s e r i e s o f p a r e l l e l s t r a i g h t l i n e s can be f i t t e d through t h e p o i n t s f o r t h e t h r e e ex ten ts o f carbon convers ion. The s lope o f these s t r a i g h t l i n e s corresponds t o a r e a c t i o n o rde r o f 0.56 w i t h respec t t o steam. Th is va lue i s cons ide rab le lower than t h a t obta ined f o r t he Wyodak char--undoubtedly due t o d i f f u s i o n o f steam being l i m i t e d by t h e f i n e r pore s t r u c t u r e o f t h e Hanna char .
A l l g a s i f i c a t i o n runs desc r ibed up t o t h i s p o i n t were designed t o main- t a i n the p a r t i a l pressures o f product gases a t values as low as poss ib le . runs w i t h v e r y h i g h g a s i f i c a t i o n r a t e s ( e . g . , a t h i g h temperatures o r h i g h par- t i a l pressures o f steam)hydrogen l e v e l s were 2-4 mol %. However, i n the major- i t y o f t he runs, hydrogen con ten t o f t h e p roduc t was cons ide rab ly l e s s than 1 mol %. product hydrogen, a s e r i e s o f experiments was c a r r i e d o u t i n which hydrogen was added t o t h e r e a c t a n t steam. The range o f hydrogen p a r t i a l pressures i n - ves t i ga ted i n c l u d e s those expected t o be encountered i n t h e c u r r e n t low-pres- sure underground f i e l d t e s t s ( ; . e . , up t o approx imate ly 0.1 MPa (1 atm)).
I n F igs. 6 and 7 a r e shown t h e i n h i b i t i v e e f f e c t s o f hydrogen a t 600 and 700°C f o r Wyodak char . drogen r e s u l t s i n a r a p i d d e c l i n e i n r e a c t i o n r a t e as t h e char i s consumed. A t 700" (F ig . 7) , t h i s i n h i b i t i o n i s s u f f i c i e n t t o e l i m i n a t e t h e e f f e c t s o f d i f f u s i o n l i m i t a t i o n s d u r i n g t h e e a r l y stages o f t h e r e a c t i o n . A t y e t h i g h e r temperatures, t h e d i f f u s i o n l i m i t a t i o n s a r e severe enough t h a t they a re ap- pa ren t even i n t h e presence o f 0.75 atm hydrogen. A t a l l temperatures,the h ighe r t h e p a r t i a l p ressu re o f hydrogen, t h e e a r l i e r i n the r e a c t i o n t h a t t h e r a p i d decrease i n t h e r e a c t i o n r a t e occurs. b i t o r y e f f e c t a t h i g h e r temperatures and as t h e e x t e n t o f g a s i f i c a t i o n i n c r e a - ses. S i m i l a r e f f e c t s o f hydrogen have been observed w i t h t h e Hanna coa l .
2. Ca ta l ys i s by Coal Ash
t e n t f o r economical aboveground u t i l i z a t i o n . Th is ash would be expected t o have a c a t a l y t i c e f f e c t on g a s i f i c a t i o n r e a c t i o n s o c c u r r i n g underground. The ash i n Hanna coa l has been found t o c a t a l y z e t h e water gas s h i f t r e a c t i o n and t h e methanation r e a c t i o n under t h e c o n d i t i o n s expected i n UCG.
periments was c a r r i e d o u t i n which carbon monoxide and steam were reac ted a t va r ious temperatures ove r a bed of char prepared f rom Hanna coa l i n the f o l l o w - i n g manner. The char was prepared by hea t ing t o a temperature o f 600°C a t a hea t ing r a t e o f 3"C/min. T h i s p y r o l y s i s was c a r r i e d o u t i n a reducing gas mix- t u r e c o n s i s t i n g o f 20% H2 i n n i t rogen . p s i g ) . The temperature was l i m i t e d t o 600°C d u r i n g p y r o l y s i s i n o rde r t o min- i m i z e chemical changes t h a t m igh t occur i n t h e m ine ra l m a t t e r o f t he coa l . On t h e o the r hand, a t 600°C, most o f t he hydrocarbon decomposit ion would have oc- curred, y i e l d i n g a clean, r e l a t i v e l y hydrocarbon- f ree char t o expose t o t h e steam u t i l i z e d f o r t h e r e a c t i o n study.
I n
I n o r d e r t o i n v e s t i g a t e i n h i b i t i o n o f t h e steam-char r e a c t i o n by
A t 600°C (F ig . 6 ) , i n h i b i t i o n o f t h e r e a c t i o n by hy-
Hydrogen e x e r t s a g r e a t e r i n h i -
Many c o a l s which would be good candidates o f UCG have t o o h i g h an ash con-
To i n v e s t i g a t e r e a c t i o n 4), t h e wa te r gas s h i f t reac t i on , a s e r i e s o f ex-
The o v e r a l l pressure was0.76MPa (100
I,
II li 1E
r:
112
Fo l low ing p y r o l y s i s , t h e temperature was reduced t o t h e des i red va lue and 0.13 MPa (1.33 atm) steam was in t roduced t o the r e a c t o r a long w i t h 6 0 kPa(O.6 atm) carbon monoxide. The balance o f t he gas was n i t r o g e n , and the t o t a l system pres- s u r e was 0.76 MPa (7.6 atm). The con tac t t ime o f t h e gas m i x t u r e i n t h e cha r bed ranged from 1.1 s a t 500°C t o 1.6 s a t 250°C. Fo l l ow ing u t i l i z a t i o n o f t h e f r e s h char , 15% o f t h e carbon was s team-gasi f ied away a t 600°C and then t h e s h i f t r e - a c t i o n was s tud ied a t t h e lower temperatures. The purpose o f t h e g a s i f i c a t i o n s t e p was t o expose more o f t h e m ine ra l m a t t e r a t t h e surface o f t h e cha r p a r t i c l e s . A f t e r t he s h i f t r e a c t i o n r a t e s were measured f o r t h e char from which 15% o f t h e carbon had been removed, an a d d i t i o n a l 6% o f t h e cha r was s team-gas i f i ed and t h e s h i f t r a t e s were measured again.
r e a c t i o n over f r e s h char a r e app rec iab l y lower than f o r t h e p a r t i a l l y g a s i f i e d char , b u t t he re i s l i t t l e d i f f e r e n c e between t h e r a t e s obta ined a f t e r 15 and a f t e r 21% carbon removal. t i o n of temperature i s compared w i t h the thennodynamic e q u i l i b r i u m curve. an apprec iab le amount of t h e carbon has been g a s i f i e d from the char, t h e reac- t i o n approaches thermodynamic equi li b r i um i n t h e temperature range o f 500 t o 600°C. t a i n e d i n an e a r l i e r g a s i f i c a t i o n r u n i n which carbon monoxide was observed i n t h e product gas, p e r m i t t i n g c a l c u l a t i o n of an e q u i l i b r i u m value. f i rms t h a t t h e r e a c t i o n i s indeed a t e q u i l i b r i u m a t 650°C, f o r a c o n t a c t t ime on t h e o rde r o f one second.
e r g i s t i c e f f e c t w i th hydrogen f o r t h e p roduc t i on o f methane. o f 138 kPa (20 p s i g ) hydrogen and 0.33 MPa (3.3 atm) steam was passed over Hanna cha r and y i e l d e d a methane concen t ra t i on o f 300 p a r t s per m i l l i o n (by volume). React ion a t t h a t p a r t i a l pressure o f hydrogen a lone gave a methane c o n c e n t r a t i o n o f o n l y 150 ppm. d i t i o n s , the hydrogen c o n t r i b u t e d by t h e steam-carbon r e a c t i o n d i d n o t change t h e p a r t i a l pressure of hydrogen i n t h e r e a c t o r . MPa (5 atm) gave a f i v e - f o l d i nc rease i n t h e r a t e o f methane p roduc t i on .
A probable mechanism f o r t h i s phenomenon i s methanation o f t h e carbon mon- ox ide produced by t h e steam-carbon r e a c t i o n , w i t h t h e methanation ca ta l yzed by t h e minera l m a t t e r i n t h e c o a l . The methanation o f carbon monoxide b y hydrogen has been found t o occur when o n l y t h e ash from Hanna coal (formed by low-temper- a t u r e ashing) i s p laced i n t h e r e a c t o r i n t h e temperature range o f 400 t o 700°C. I n s u f f i c i e n t experiments have been c a r r i e d o u t t o determine convers ion r a t e s f o r t h i s r e a c t i o n q u a n t i t i t i v e l y .
3. Brack ish Water E f f e c t s
b rack i sh . cium p l u s magnesium, 1100 mg/L carbonates, 400 mg/L su l fa te , 40 mg/L c h l o r i d e , and a pH of 8.5. There have been numerous r e p o r t s i n t h e l i t e r a t u r e t h a t impreg- n a t i o n o f coal w i t h a l k a l i o r a l k a l i n e e a r t h c a t i o n s sometimes enhances t h e r a t e s o f g a s i f i c a t i o n r e a c t i o n s w i t h coa l . i n UCG may i n f a c t enhance t h e k i n e t i c s o f t h e steam-char reac t i on .
The r e s u l t s o f these s tud ies a r e shown i n F ig . 8. The r a t e s f o r t h e s h i f t
I n F ig . 8, t h e e x t e n t o f t h e s h i f t r e a c t i o n as a func- Once
The p o i n t p l o t t e d f o r Wyodak char a t 650°C was c a l c u l a t e d f rom da ta ob-
Th is p o i n t con-
A t expected UCG process ing c o n d i t i o n , steam has been found t o e x h i b i t a syn- A t 700°C, a m i x t u r e
Since t h i s experiment was c a r r i e d o u t under d i f f e r e n t i a l con-
I n t r o d u c t i o n o f steam a t 0.5
The water o c c u r r i n g i n the a q u i f e r s i n the Hanna, Wyoming, area i s q u i t e A t y p i c a l a n a l y s i s i s 600 mg/L sodium, 7 mg/L potassium, 22 mg/L c a l -
Hence t h e i n e v i t a h l e use o f b r a c k i s h wa te r
113
In a s e r i e s of experiments t o inves t iga te t h i s question, two aqueous solu- t ions were prepared t o simulate the brackish water cha rac t e r i s t i c of t he water found in the Hanna aqui fe rs . One solution containing approximately the natur- a l concentrations of contaminants was prepared using calcium chloride, sodium su l f a t e , potassium carbonate and sodium bicarbonate. The second so lu t ion con- tained about f i v e times the natural concentrations.
A sample of Hanna No. 1 coal was crushed and washed w i t h boil ing d i s t i l l e d water several times t o remove any soluble s a l t s already in the coal. A portion of t h i s washed coal was gas i f ied to obtain a base-line reaction r a t e . Ten grams of t h i s washed coal was oven-dried and then impregnated w i t h 1.0 ml of the simu- la ted brackish water so lu t ion . The coal completely absorbed t h i s so lu t ion ; no excess l iqu id drained o f f . Likewise, a sample of the washed coal was d r i ed , then impregnated w i t h the so lu t ion having a fivefold concentration of contaminants. Each of these impregnated coal samples was then pyrolyzed and gas i f ied .
Our standard gas i f i ca t ion reaction conditions were used, ;.e., 700"C, 0.25 MPa (2.5 atm) steam a f t e r pyrolysis had been car r ied out i n 20% H2/8O% N2 w i t h a hea t - ing r a t e of 3"C/min t o reaction temperature. marized i n F i g . 9. Impregnation of the washed coal w i t h the simulated brackish water appears t o enhance the r a t e of reaction of steam with the char by ten t o f i f t een percent. There was l i t t l e apparent difference between the e f f ec t s of t h e standard concentration and the five-fold concentration of contaminants. An enhancement of the reac t ion r a t e of th is small magnitude may not be s ign i f i can t because of the very small samples of coal gas i f ied i n each run. Normal variations i n the coal can give t h i s much variance i n a measured reaction r a t e . t h a t the single-fold and the f ive- fo ld concentrations show l i t t l e difference a l so suggests t h a t the observed enhancement may not be s ign i f icant .
The r e su l t s of these runs are sum-
The f a c t
Brackish water would be expected t o have minimal e f f ec t s on the reaction ra te f o r a coal having the cha rac t e r i s t i c s of Hanna No. 1 . The core sample of Hanna coal which we a r e studying contains 17% ash, on an as-received basis. t h a t the char remaining a f t e r pyrolysis contains 32% ash. The amount of inorganic material added t o a coal with t h i s h i g h an ash content--even by u s i n g simulated brackish water having f i v e times the normal concentration of contaminants--would be a ra ther small percentage of the to t a l inorganic matter i n the coa l . Neverthe- l e s s , the poss ib i l i t y exists t h a t brackish water may have an e f f e c t on the r a t e of reaction of steam w i t h chars t h a t have a lower ash content t h a n does Hanna.
CONCLUSIONS
This means
A t high temperatures (700-750°C), the Wyodak char i s 50-100% more reac t ive with steam than is Hanna char, although a t lower temperatures (600-650°C), the two have e s sen t i a l ly equal r e a c t i v i t i e s w i t h steam. The lower apparent activa- t i on energy observed f o r the Hanna char ind ica tes t h a t its average pore s i ze i s smaller than t h a t of t h e Wyodak char. The reaction order w i t h respect t o steam i s greater f o r the Wyodak char than f o r the Hanna chars--undoubtedly a l so be- cause of the d i f fe rences i n pore s t ruc ture .
b i t i on i s grea te r as a grea te r f rac t ion of the carbon is gas i f ied . Hydrogen severely inh ib i t s the reaction of steam with both chars. The inhi-
114
E I
Minera l ma t te r ca ta l yzes t h e water gas s h i f t reac t i on , and thermodynamic e q u i l i b r i u m i s reached a t approx imate ly 550°C. found t o ca ta l yze t h e methanation reac t i ons , b u t k i n e t i c data have n o t y e t been determined f o r these reac t i ons .
The a l k a l i and a l k a l i n e e a r t h ca t i ons present i n b r a c k i s h waters e x e r t a minimal c a t a l y t i c e f f e c t on t h e steam-char react ion--most l i k e l y because t h e h i g h ash content o f t h e coa l a l ready supp l i es s u f f i c i e n t c a t a l y s t f o r t h e r e - ac t i on .
The ash a lone a l s o has been
115
E 1
U .r
116
n s o s L O L O
o s 0 5
u v n
3oSLL- 1 1 1 1 I l ' l l ' l ' I ' 1 1 1 1 1 1 ' 1 ' 1 I I I
Fig. 8. Water Gas Sh i f t Reaction. 1 .O-1.5 s Contact Time
A 5 Fold Conc. 0 1 Fold Conc.
3.0 0.1 0.2 0.3 0.4 0.5 Fraction Carbon Converted
F i g . 9. Effect of Brackish Water on Steam/Char Gasification Rate. Hanna No. 1 Char, 700"C, 0.25 MPa (2.5 atm) Steam
120
Oxidative Pretreatment of I l l i n o i s No. 6 Coal: Material and Energy Balances
F. N. Gromicko, L. Saroff , S. Gasior and J. Strakey
U. S. Department of Energy Pi t tsburgh Energy Research Center
4800 Forbes Avenue Pi t tsburgh, PA 15213
INTRODUCTION
One of the d i f f i c u l t i e s encountered when gasifying caking coals is the tendency of t h e coal t o agglomerate. The SYNTHANE process, developed a t the Pi t tsburgh Energy Research Center, incorporates a mild oxidation pretreatment s t e p which destroys the agglomerating c h a r a c t e r i s t i c of the coal before entry i n t o the g a s i f i e r . The fluidized-bed OK entrained p r e t r e a t e r is connected d i r e c t l y to the g a s i f i e r and operates a t the same pressure. gases, and t a r vapors) a r e fed d i r e c t l y i n t o the g a s i f i e r . Consumption of carbon i n t h i s s t e p is not detr imental t o the process economics. were eliminated, addi t iona l oxygen would have t o be added t o the g a s i f i e r t o heat the coal t o the pretreatment temperature. Oxidative pretreatment is present ly being studied i n entrained-flow and fluidized-bed PDU reac tors . Batch f luidized- bed t e s t s have been s tudied by Forney, e t a l . (1) and continuous fluidized-bed experiments were described by Gasior, et al . (2). Coal pretreatment tests i n an entrained s t a t e have been car r ied out and reported by Saroff , et a l . (3).
Experiments have been designed t o determine the operating c h a r a c t e r i s t i c s of entrained- flow and fluidized-bed reac tors . organized and reported as material and energy balances. Operating parameters and process stream compositions a r e discussed f o r three sets of data: 40-atmosphere entrained-flow, 40-atmosphere fluidized-bed and 70-atmosphere fluidized-bed. Entrained- flow data has been based on a typ ica l run from a s e r i e s of 10 s imi la r experiments. Fluidized-bed data a r e a composite of four s imi la r experiments a t each operating pressure. Typical mater ia l balances a r e generated from t h i s data. These balances can be used as a design bas is f o r the pretreatment s teps i n a gas i f ica t ion plant . Similar balances have been prepared t o describe the pretreatment s t e p i n the IGT hydrogasification process (4) .
The pre t rea te r products (hot pretreated coal (char)
I f the oxidat ive pretreatment
Actual experimental data from each reac tor a r e
EQUIPMENT DESCRIPTION
Entrained ReactOK
The entrained pretreatment system, Figure 1, cons is t s pr imari ly of a coa l hopper, a process gas heater , a t ranspor t l i n e reactor , and a pretreated coal receiver . The reactor is equipped with f u l l instrumentation t o permit the measurement of gas flows, operating pressures, pressure d i f f e r e n t i a l s , and temperatures a t var ious points i n the process. Sample points a r e provided f o r the product gas and char. Coal is fed from the hopper by a ro ta t ing perforated d i s c feeder . passes the discharge l i n e a synchronized in jec t ion of gas forces the coa l i n t o a take-off pipe. Coal flow r a t e s a r e determined by hopper weight losses which a r e monitored on a tension load c e l l .
The entrained reac tor is a 1/4-inch, 304 s t a i n l e s s s t e e l pipe shaped a s an inverted U, 76 f e e t i n length, with auxi l ia ry heaters along its e n t i r e length. The hea ters a r e used t o minimize heat losses . Temperature measurements a r e made with chromel- alumel sheathed thermocouples. System pressure is monitored on ca l ibra ted bourdon tube gauges.
A s each perforat ion
1 2 1
The product gas e x i t s through a p a r t i c l e disengagement zone. a r e f i l t e r e d from the gas which i s then passed through a heat exchanger t o remove moisture and any other condensables. The pretreated coa l is col lec ted in a vesse l equipped with a screw ext rac tor t o permit sampling under pressure. A product gas sample point and an e x i t gas meter complete the uni t .
Fluidized-bed Reactor
The fluidized-bed pretreater is shown i n Figure 2. In many respects t h i s system is similar t o the entrained uni t . The coal feed mechanism is i d e n t i c a l . Process ni t rogen is heated p r i o r t o carrying the coal i n t o the p r e t r e a t e r vesse l . The pretreatment vesse l is a 1" schedule 80, 304 s t a i n l e s s s t e e l pipe approximately 10 f e e t in length. E l e c t r i c hea te rs a r e provided t o insure ad iaba t ic operation. Temperature is monitored by four thermocouples. of the pretreatment v e s s e l and f a l l s i n t o the receiver . Fine dust p a r t i c l e s a r e removed by a f i l t e r . Water and t a r s are condensed from the gas stream which is then sampled. The uni t is equipped with instrumentation t o permit accurate observation and cont ro l o f a l l i n l e t and o u t l e t process streams.
Residual dust p a r t i c l e s
Pretreated coa l e x i t s from the top
EXPERIMENTAL. PROCEDURE
Entrained Reactor
Experiments were conducted so le ly with I l l i n o i s 16 coal ground t o minus 20 mesh, with approximately 30% through 200 mesh. Complete proximate-ultimate, ash, and p a r t i c l e s i z e analyses were carr ied out f o r each feed. A typ ica l ana lys i s is shown i n Table 1. Coal w a s weighed and charged t o t h e coa l hopper p r i o r t o the run, and any residual coa l i n the hopper a t the end of the run w a s weighed t o accurately determine t h e average c o a l feed ra te .
A l l of t h e entrained p r e t r e a t e r t e s t s were run at 40 atmospheres pressure. coa l hopper was pressurized independently of the remaining p a r t of the uni t . sea l ing the e n t i r e u n i t , the back pressure regulator was set a t the desired operat ing pressure and t h e u n i t was pressurized.
The t ransport gas, ni t rogen, w a s heated t o 450" C and adjusted t o t h e proper flow r a t e . reac t ion length. The speed of the ro ta t ing feeder d i s c was adjusted t o give the desired coal feed rate. a t a predetermined flow rate, w a s introduced t o the system. a s evidenced by constant temperatures, were reached, per iodic gas and pre t rea ted coal samples were taken. The gas samples were analyzed f o r 0 , CO, CO CH and higher molecular weight hydrocarbons. were taken a t the end of t h e run and completely analyzed.
The After
The t ransport l i n e heaters were s e t t o minimize heat losses along the e n t i r e
Short ly a f t e r es tab l i sh ing a consis tent coal r a t e , oxygen, When s t a b l e conditions,
Representative pretreazed coal f b .c. 9 samples
Fluidized-bed Reactor
The fluidized-bed u n i t w a s operated a t both 40 and 70 atmospheres t o t a l pressure. The back-pressure regula tor was s e t and pressurizat ion proceeded s imi la r t o the entrained process. desired flow rate. mixture tha t t ranspor t s the coa l t o the reac t ion vesse l . maintained on t h e vesse l heaters . Coal feed w a s i n i t i a t e d and a fluidized-bed was developed in the 10-foot-long vessel .
The e x i t gas w a s continuously monitored f o r oxygen content. analyzed for carbon oxides, CH
Nitrogen w a s heated between 360 and 380' C and adjusted t o the Oxygen w a s then added down stream of the heater t o form the gas
Adiabatic s e t t i n g s were
Spot samples were and higher molecular weight hydrocarbons. Pretreated 4
1 2 2
coal dropped from the top of the fluidized-bed and was col lected i n the receiver . Representative samples of t h i s coal were analyzed a t the conclusion of the run. Water and t a r w e r e co l lec ted , sampled, and analyzed.
I n a l l t e s t s , n i t rogen w a s used a s the t ranspor t medium. For a commercial-scale p lan t , steam would be used t o t ransport the coal , s ince i t can be e a s i l y removed by condensation, and therefore does not d i l u t e the product. Furthermore, i n a commercial f a c i l i t y , lower f l u i d i z a t i o n v e l o c i t i e s would be employed.
DISCUSSION OF RESULTS
Mater ia l Balances
Actual mass balances f o r each u n i t a r e presented i n Figures 3, 4 and 5 . In order t o f a c i l i t a t e comparisons between the t e s t s , elemental balances were based on 100 pounds of raw coal. Tables 2, 3 and 4 show the input and output a s elemental balances. These elemental balances w e r e scaled upward t o a 100 lb . bas i s from the operating parameters given i n Figures 3, 4 and 5 . The feed coa l w a s subdivided i n t o three components: f r e e moisture, water of hydration and the remaining coal . Free moisture w a s determined using ASTM analys is procedures. held by the c lay mater ia l s i n the coal, w a s estimated t o be 8 weight percent of the ash taken on a moisture-free bas i s , a s discussed by Given (5). Hydrogen and oxygen shown i n Tables 2, 3 and 4 were appropriately adjusted to account f o r t h e changes i n the ul t imate ana lys i s caused by the water of hydration assumption. Due t o the high operat ing temperatures of these processes, a l l of the water of hydration was broken f r e e from the clay materials i n the char. does not appear i n the output sec t ion of the elemental balances. Corrections f o r t h e water of hydration w i l l be important i n ca lcu la t ing e x i t temperature from t h e enthalpy balance., appear t o be formed during the reac t ion s tep , thus a higher e x i t temperature would be predicted.
Exi t stream compositions were examined f o r each test. The entrained reac tor had v i r t u a l l y no t a r present at the process e x i t . Typical t a r analyses were used f o r the 40-and 70-atmosphere fluidized-bed tests. Tar production general ly ranged from 1 to 3% of the feed coal , with an average of 1.4% f o r the 40-atmosphere t e s t s . In the 70-atmosphere tests, t a r production ranged from 1 t o 5% with an average of 3.2%.
Table 5 shows a c t u a l e x i t gas concentrations f o r t h e three processes. Oxygen breakthrough occurs i n the entrained pre t rea te r , probably due to the shor t coal residence time which requi res a higher i n i t i a l p a r t i a l pressure of oxygen i n the feed. The fluidized-bed reac t ion produces a la rger var ie ty of gaseous products such as methane and other hydrocarbons. These gas analyses w e r e incorporated i n t o the mater ia l balances.
Closure on t h e o v e r a l l mass balances, calculated on a ni t rogen gas-free bas i s , ranged from 93.6% i n the 40-atmosphere fluidized-bed run t o 99.9% i n the 70- atmosphere fluidized-bed experiment. Carbon and hydrogen closures are general ly good, with the oxygen being f u r t h e s t from closure. probably caused by the ana lys i s technique for the coal and char. Oxygen content i s determined by difference, thereby incorporating a l l of the ana lys i s e r r o r s i n t o the oxygen t e r m . Volborth, e t . a l . , ( 6 ) descr ibe a method f o r d i r e c t determination of oxygen which may lead t o b e t t e r oxygen closure. composites of data from severa l s imilar tests.
The water of hydration,
Therefore, water of hydration
I f the water of hydration w a s ignored, addi t iona l water would
Poor oxygen closures were
These ac tua l balances were
123
m e n presenting a process flow shee t of any reac tor system, it is necessary t o have input and output mass flow r a t e s t h a t a r e t o t a l l y balanced. This has been achieved by making minor adjustments i n the typ ica l balances presented t o form design-basis mater ia l balances. The char is one of the most d i f f i c u l t streams t o measure accurately. There a r e a number of loca t ions i n the process, such as the disengagement zone, where char can become trapped and therefore omitted from the complete balance. In addi t ion, t ru ly representa t ive samples of the char may not always be obtained. Thus elemental balances were brought t o complete c losure by adjust ing the ul t imate analyses of the char stream. t h e range of r e s u l t s general ly seen f o r the process.
The completed design-basis mass balances a r e shown i n Figures 6, 7 and 8, and the design-basis elemental balances a r e given i n Tables 6, 7 and 8. have been developed using a l a r g e number of pretreatment runs and can be viewed as a good approximation of t h e mater ia l tha t would be fed t o a g a s i f i e r a f t e r the coal pretreatment s t e p has been accomplished.
This led to new ul t imate analyses which were within
These balances
Energy Balances
Energy balances w e r e completed f o r both fluidized-bed t e s t s and the entrained reactor t e s t using the mater ia l balances based on a c t u a l operat ing data . The calculat ions w e r e completed by employing Hess' Law. All the reac tan t enthalpies were calculated at base temperature, 25' C. Process gas i n l e t temperatures were general ly around 450" C f o r the entrained reac tor and between 360" C and 380" C for the fluidized-bed reactor . The raw coal w a s always fed a t 25" C, so no i n i t i a l enthalpy term f o r t h i s coa l e n t e r s i n t o the balance.
A simple group of reac t ions was used t o descr ibe the o v e r a l l reac t ion s tep at 25O C. changes resul ted from the formation of carbon dioxide and water. Contributions from t h e other components were s m a l l , mainly due t o t h e low concentrations. t o t a l enthalpy ava i lab le can be used t o pred ic t the process e x i t temperature.
Determination of e x i t temperature involves heat ing a l l of the process gases present i n the out le t s t r e a m and heat ing of the char. The l a t e n t heat of vaporizat ion of water from 25' C t o the exit temperature was a l s o included. comparison of calculated o u t l e t temperatures and the measured e x i t temperatures. The fluidized-bed tests w e r e car r ied out at almost t o t a l l y ad iaba t ic condi t ions as was planned. Comparing the calculated temperature with the e x i t temperature f o r t h e entrained p r e t r e a t e r ind ica tes tha t an ad iaba t ic system was not a t ta ined . Due t o c e r t a i n mater ia l l i m i t a t i o n s i n the experimental equipment, the char receiver cannot be operated at reac t ion temperatures. Therefore the insu la t ion on the last 25 f e e t o f the t ranspor t l i n e was removed to prevent excessive temperatures i n the char receiver . f o r the non-adiabatic operat ing conditions and lowered e x i t temperature.
Supplemental Analyses
Several other parameters were b r i e f l y examined t o more completely charac te r ize the two pretreatment processes. A measure of the success of the pretreatment process is its a b i l i t y t o destroy the agglomeration tendency of caking coals . swel l ing index, PSI, is o f t e n the parameter used to d is t inguish a raw caking coal from a t reated non-agglomerating char. t reated coals t h a t were s tudied . The 70 atmosphere reac tor w a s the most successful producer o f a non-caking, gSI-0, coal . The remaining two tests did not pretreat t h e coa l completely.
T a b l e 8 shows t h e reac t ions tha t were considered. The l a r g e s t enthalpy
The
Table 10 shows a
I n doing t h i s , an appreciable amount of heat is l o s t , accounting
The f r e e
Table 11 gives FSI's f o r the raw and
Fluidized-bed t e s t s a t 40 atmospheres pressure have reduced
1 2 4
the FSI of raw coal t o less than the value given i n Table 11. temperature of approximately 420" C is required f o r t h i s reduction. presented here w a s operated a t only 400° C , thus accounting f o r the higher f ree- swelling index. However, the material balance f o r a 420" C fluid-bed p r e t r e a t e r does not change appreciably from a 400" C reactor .
The carbon consumption during the pretreatment react ion is a l s o noteworthy of examination. the r a t i o of carbon i n the e x i t t a r and gas streams t o the carbon in t h e feed coal . For a l l of the 40-atmosphere tests, regardless of reac tor type, t h e carbon consumption ranged from 1.9 t o 3%. reac tor , a carbon consumption of 10.4% w a s observed. atm. test consumed 6.2% of the feed carbon, while the product gases accounted f o r the remaining 4.2% of the conversion. probably due to the v a r i a t i o n i n coal residence times.
Table 1 2 provides the proximate analyses of the coal before and a f t e r t h e pretreatment react ion takes place. I n each instance, the v o l a t i l e matter is decreased in the process. This can lead t o some of the tar formation, and is probably a fac tor i n reducing the agglomeration tendency.
The su l fur forms i n the coa l before and a f t e r pretreatment i n the entrained reactor a r e shown i n Table 13. t o any great extent.
A higher operat ing The test
In t h i s study, the percentage carbon consumption is determined as
However, i n the 70 atmosphere fluidized-bed T a r production i n the 70-
Differences i n carbon consumption a r e
The process does not a f f e c t the overa l l su l fur i n the coal
CONCLUSION AND SUMMARY
The oxidative pretreatment of I l l i n o i s 116 coal has been studied i n two types of reactors : a short residence t i m e entrained-flow uni t and a longer res idence time fluidized-bed uni t . The entrained reac tor was operated a t 40 atmospheres pressure and the fluidized-bed reactor w a s tes ted a t both 40 and 70 atmospheres pressure. Mater ia l balances were constructed using the raw da ta gathered i n both processes. The 70- atmosphere fluidized-bed and the entrained reactor experiments had closures of 95% or be t te r , while a closure of 94% was calculated i n the 40-atmosphere fluidized-bed t e s t . Individual elemental balances var ied, carbon and hydrogen recovery were excel lent and oxygen recovery generally was the poorest. material balances that can be used f o r design calculat ions were generated from the data . bed reactor was operated a t almost t o t a l ad iaba t ic conditions.. Some heat l o s s was seen i n the entrained reac tor and linked t o the cooling of the process stream at the end of the reactor to pro tec t the char receiver .
Both pretreatment schemes were successful i n destroying a la rge port ion of the coal ' s agglomerating tendencies, as indicated by the f r e e swelling index of t h e t reated coal samples. Tar formation i n the entrained reactor w a s found t o be negl igible . In t h e fluidized-bed reac tor , 1 t o 5% of the feed coal was converted t o t a r compounds. an accurate descr ipt ion of input feed compositions to the g a s i f i e r which would be encountered i n gasifying caking coals.
Typical
Energy balances based on these mater ia l balances indicated tha t the f luidized-
The work completed and described should prove usefu l in providing
125
Table 1. - Typical Illinois 116 Coal Analysis
Proximate-Ultimate
Coal (as received), w t . %
Moisture 6.2
Volat i le Matter 39.3
Fixed Carbon 43.5
Ash 11.0
H C
N
S
0
Ash
Ash Analysis, %
S i l i c a
A1203
Fe203 T i 0 2
CaO
MgO N a Z O
K2° -2
s03
47.03
18.07
18.46
1.04
7.29
1.03
0.86
1.83
4.38
5.3
64.3
1.2
3.4
14.8
11.0
126
P a r t i c l e Size
Sieve Size
20
50
100
140
200
325
PAN
u t . % Retained on Sieve
0
9.2
30.9
14.9
18.3
25.0
1 . 7
Table 2. - Actual Entrained Reactor Elemental Balance, w t .
Input
H C N s o Ash Tota l
Coal 4.26 62.78 1.12 3.63 7.65 12.56 92.0 Moisture i n coa l 0.78 6.22 7.0
Oxygen feed 11.18 11.18
Total 5.15 62.78 1.12 3.63 25.94 12.56 111.18
Water of hydration 0.11 0.89 1.0
Output
Moisture i n pc 0.41 3.29 3.7 Pre t rea te r coal, pc 3.64 60.54 1 .0 3.74 8.66 13.57 91.15
Condensate 0.87 6.96 7.83 Product gas 1.19 2.93 4.12
Total 4.92 61.73 1.0 3.74 21.84 13.57 106.8
Recovery, % 95.5 98.3 89.3 103.0 84.2 108.0 96.1
Table 3. - Actual 40-Atmosphere Fluidized-Bed Elemental Balance, w t .
Input H
Coal 4.5 Moisture i n coa l 0.69 Water of hydration 0.1 Oxygen feed
Total 5.29
Output
Pretreated coal, pc 3.73 Moisture i n pc 0.07 Condensate 1.12 Product gas 0.09 Tar 0.11
Tota l 5.12
Recovery, X 96.8
C N
64.25 1.22
64.25 1.22
56.41 1.0
1.96 1.04
59.41 1.0
92.5 82.0
127
S 0 Ash
3.47 8.4 11.07 5.51 0.79 8.64
3.47 23.34 11.07
2.99 7.47 11.37 0.6 8.92
0.24 4.43 0.06 0.09
3.29 21.51 11.37
94.8 92.2 102.7
Total
92.91 6.2 0.89 8.64
108.64
82.97 0.67
10.04 6.72 1.30
101.7
93.6
Table 4. - Actual 70-Atmosphere Fluidized-Bed Elemental Balance, w t .
Input H C N S 0 Ash Total
Coal 4.24 63.48 1.11 3.51 7.68 11.46 91.48 Moisture i n c o a l 0.84 6.76 7.6 Water of hydration 0.1 0.82 0.92 Oxygen feed 7.2 7.2
Total 5.18 63.48 1.11 3.51 22.46 11.46 107.2
output
Pretreated coal , pc 2.95 54.98 1.07 2.95 7.54 12.45 81.94 Moisture i n pc 0.16 1.26 1.42 Condensate 1.1 8.8 9.9 Product gas 0.22 2.64 0.85 5.23 8.94 Tar 0.41 3.92 0.24 0.33 4.9
Tota l 4.84 61.54 1.07 4.04 23.16 12.45 107.1
Recovery, W 93.4 96.9 96.4 115.1 103.1 108.6 99.9
t r a c e
co2
CH4
co
‘ZH4
‘ZH6
C3H6
C3H8
HZ 0.2
O2
H2S 0.2
N2
0.18 0.1
Balance Balance
- Trace defined as eO.1 volume W.
128
0.3
Balance
Table 5. - E x i t Gas Compositions on a Volume Percentage Basis
40-atm. 4 0-a t m . 70-atm. entrained f luidized-bed f luidized-bed
1.16 3.18 1.7
0.62 0.6 0.3
0.4 0.3 .
t r a c e
0.1
trace
t r a c e
t r a c e
Table 6. - Entrained Reactor Design-Basis Elemental Balance, w t .
Input n C N S 0 Ash Total
Coal 4.5 64.25 1.22 3.47 8.4 11.07 92.91 Moisture i n coa l 0.69 5.51 6.2 Water of hydration 0 . 1 0.79 0.89 Oxygen feed 11.18 11.18
Total 5.29 64.25 1.22 3.47 25.88 11.07 111.18
output
Pretreated coa l , pc 3.95 63.01 1.22 3.47 12.17 11.07 94.89 Moisture i n pc 0.43 3.42 3.85 Condensate 0.91 7.24 8.15 Product gas 1.24 3.05 4.29
Coal 4.5 64.25 1.22 3.47 8.4 11.07 92.91 Moisture i n coa l 0.69 5.51 6.2 Water of hydration 0.1 0.79 0.89 Oxygen feed 8.64 8.64
Total 5.29 64.25 1.22 3.47 23.34 11.07 108.64
output
Pretreated coa l , pc 3.89 61.25 1.22 3.17 9.26 11.07 89.86 Moisture i n pc 0.08 0.64 0.72 Condensate 1.12 8.92 10.04 Product gas 0.09 1.96 0.24 4.43 6.72 Tar 0.11 1.04 0.06 0.09 1.3
Total 5.29 64.25 1.22 3.47 23.34 11.07 108.64
129
Table 8. - 70-Atmosphere Fluidized-Bed Des+gn-Basis Elemental Balance, w t .
Input
H C N S 0 Ash Total
Coal 4.5 64.25 1.22 3.47 8.4 11.07 92.91 Moisture i n coa l 0.69 5.51 6.2 Water of hydration 0.10 0.79 0.92 Oxygen feed 7.20 7.2
Tota l 5.29 64.25 1.22 3.47 21.9 11.07 107.2
Output
Pretreated coal, pc 3.4 57.69 1.22 2.38 6.28 11.07 82.04 Moisture i n p c 0.16 1.26 1.42 Condensate 1.1 8.8 9.9 Product gas 0.22 2.64 0.85 5.23 8.94 Tar 0.41 3.92 0.24 0.33 4.9
Tota l 5.29 64.25 1.22 3.47 21.9 11.07 107.2
Table 9. - Formation Reactions Used i n Determining Heat of Reaction
c t o2 + co2 AHO f298 = -94,052 i:tm mole
C t 1 / 2 0 2 -+ CO AHo = -26,416 "
C t 2H2 + CH4 " = -17,889 "
2C t 3H2 + C2H6 " = -20,236 "
S t H2 -+ H S " -4,815
1/202 + H2 + H 0 " -68,317 11
298
,, 2
2 (W.)
Table 10. - Predicted Ex i t Stream Temperature Determined Through Energy Balances
Predicted e x i t Observed e x i t temperature temperature
40-atm. entrained 401' C 353" c
40-atm. f l u i d i z e d 419" C 401' C
70-atm. f l u i d i z e d 427" C 419" C
130
1 i
I
P I
I C Table 11. - Free Swelling Index Before and After Pretreatment
40-atm. entrained
40-atm. f luidized
70-atm. f luidized
Raw Coal Pretreated Coal
4.0 0.5
4.0 1.0
4.0 0
Table 12. - Comparison of Proximate Analyses of Pretreated Coals
Feed Entrained Fluidized Fluidized coa l 40-atm. 70-a t m .
Moisture 6.2 2.4 Vola t i le matter 39.3 33.7 Fixed carbon 43.5 49.0 Ash 11.0 14.9
0.8 35.9 50.4 13.6
1.7 26.2 57.2 14.9
I Table 13 - Change i n Sulfur Dis t r ibu t ion During Entrained Pretreatment*
Sul fa te P y r i t i c Organic
- Raw Treated
0.43 0.35 1.05 1.3 2.37 2.32
S a l u e s a r e percentage of coa l sample on a moisture-free b a s i s
a I
I
I
131
References
1. Forney, A. J., R. F. Kenny, S. J. Gasior and J. H. Field. Bureau of Mines, Report of Invest igat ion, 16797. 1966.
2. Gasior, S. J., A. J. Forney, W. P. Haynes and R. F. Kenny, AIChE Symposium Series , No. 156, Vol. 72, pp. 117-124, 1977.
3. Saroff, L . , F. N. Gromicko, G. E. Johnson, J. P. Strakey, and W. P? Haynes., Coal Processing Technology, Vol. 3, CEP Technical Manual, 1977.
4. Pipel ine Gas From Coal-Hydrogenation (IGT Hydrogasification Process) , Quarterly Report #3, FE-2434-12, May 1977,
5. Given, P. H. and R. F. Yarzab, Problems and Solut ions i n t h e Use of Coal Analyses, Technical Report #l, FE-0390-1, November 1975.
6. Volbroth, A., Miller, G. E., Garner, C. K. and P. A. Jerabek, Fuel, 2, p. 49, 1978.
132
I
I
I $1 I
1 IB
I
I
I I
1 I
.I
I
I I
I
Scale
0 f. C T I
02
P pressure taps T IhermOCOYCleS
Dlsengaqemenl zone -
- - - G a s
m e t e r -
Gor rompling
Pretreoled cool rompling
U Pretreated
mol recelwef
Figure-1 Schemollc sketch o f enlrotned prelrealer PDU
NZ pressurizotion
Cool Feed
Pretreated coal receiver
Nitrogen Oxygen
Figure 2 -Schemotlc sketch of fluldired -bed cool pretrealer PDU.
133 4-28-78 L-16026
Transport gas Ttoi 158.8 Ibs N,
11.18 Ibs 0,
nsate r.u5 Ibs
- I
I Tar -0
I P r e j z t e d
94.04 Ibs
Run parameters
Coal rate *19.6 Ibs/hr Superficiol gas velocity = 12.4 ft/sec Average operating temperoiure = 377% Maximum operaling temperature = 485%
Figure 3 - Entrained reactor overall mass bolance based on actual operating data
40-atmosphere fluidized -bed
100 Ibs
Transport gas reactor 102.4 Ibs N,
8.64 Ibs 0,
Condensate 10.04 Ibs
Tar 1.3 Ibs
83.64 Ibs
Run parameters Coal rate =23.2 Ibs/hr Superficial gas velocity * I .08 ft/sec Average operating temperature = 401%
Figure 4 - 40-atmosphere fluldlzed-bed reactor overall mass balonce based on actual operating conditions.
100 Ibs 70-atmosphere fluidized -bed
Transport gas reactor separator 240 ibs Ne 7 2 Ibs O2
Condensote 9.9 Ibs
Tar 4.9 ibs
83.36 Ibs Run parameters
Coal rate =10.5 ibslhr Superficial gas velocity =0.68 ft/sec Average operating temperoiure = 419%
Figure 5 - 70-atmosphere fluidized-bed reactor overall mass balance based on actual operating conditions.
114 4-28-78 L-16027
Exit 90s 7 163.09 Ibs
react Tronspori gos 158.8 ibs N,
11.18 Ibs O2
100 Ibs Condenser Condensote
Coal
Entrained 1 1-k 8.15 Ibs seporotor or
I - Tor -0
1 ~ P r e z i e d
98.74 Ibs
Run parameters Cool rote.196 Ibs lh r Superficiol gos velocity * 12.4 fi lsec Average operoting iemperoture = 377% Maximum operoiing temperature - 485'C
CARBONIZATION REACTIONS I N THE GRAND FORKS FIXED-BED SLAGGING GASIFIER
2/ Harold H. Schobert,L/ Bruce C. Johnson, l and M. Mer le Fegley- Grand Forks Energy Research Center, US DOE
Box 8213, U n i v e r s i t y S t a t i o n Grand Forks, ND 58202
A coal g a s i f i c a t i o n p i l o t p l a n t using a f ixed-bed s lagg ing g a s i f i e r i s being operated a t t he Grand Forks Energy Research Center o f t h e U.S . Department o f Energy. The g a s i f i e r has a nominal maximum coal feed r a t e o f 1 ton/hour and operates a t pressures t o 400 ps ig . Western l i g n i t e and subbituminous coals; p l a n t mod i f i ca t i ons a re underway t o extend opera t ing c a p a b i l i t y t o Eastern caking coals.
GFERC was a p a r t o f t h e U.S . Bureau o f Mines. through 1965, t o determine o p e r a b i l i t y and maximum capac i ty . cons t ruc t i on o f t he g a s i f i e r and t e s t r e s u l t s obta ined du r ing the 1958-65 pe r iod have been repor ted (1). Operat ion o f t he p i l o t p l a n t was resumed i n 1976, and these l a t e r r e s u l t s have been repo r ted by Ellman and co-workers (2 ) .
A c ross-sec t iona l v iew o f t h e g a s i f i e r i s shown i n F igu re 1. The reac to r chamber i s about 16-1/2 inches i n diameter and has a maximum f u e l bed depth of approximately 15 f e e t . g r a v i t y from the coa l l o c k i n t o the g a s i f i e r sha f t . As t h e coa l descends, d ry ing and d e v o l a t i l i z a t i o n i s accomplished by t h e countercurrent f l o w o f ho t gases from the g a s i f i c a t i o n reac t i ons i n t h e lower sec t i on o f t h e g a s i f i e r . Gas i f i ca t i on occurs a t temperatures o f 2800-3100" F and i s sustained by an oxygen-steam mix- t u r e i n j e c t e d through f o u r tuyeres a t the bottom o f t h e f u e l bed. Dur ing t h e g a s i f i c a t i o n r e a c t i o n t h e coa l i s completely consumed, l e a v i n g on ly t h e molten ash. The molten ash ( s lag ) d ra ins cont inuously through a tapho le i n t o a water quench bath.
p rev ious pub l i ca t i on (3) has shown t h a t a s lagg ing f ixed-bed g a s i f i e r cou ld be thought t o cons is t o f f o u r r e a c t i o n zones a t steady s t a t e operat ion, as shown i n F igure 2. l o c a t i o n s and r e l a t i v e l eng ths o f t h e i nd i ca ted zones w i l l va ry and ove r lap depending on the opera t i ng cond i t i ons and t h e c h a r a c t e r i s t i c s o f t he coal be ing g a s i f i e d .
I n the d ry ing zone t h e incoming coal i s heated by t h e ascending gases t o the temperature a t which t h e mois ture i n the coal i s vaporized. A f t e r be ing dr ied , t he coal descends through the d e v o l a t i l i z a t i o n zone where the t a r s and o i l s a r e vapor ized and some product gas i s formed.
Coal + Heat = Char + O i l s + Tars + H2 + CO + C02 + Gaseous Hydrocarbons + H20
ind i ca tes the changes t a k i n g p lace i n t h i s zone. The d e v o l a t i l i z e d coal (char ) then en ters a zone i n which l i t t l e carbon i s consumed bu t some gas reac t i ons take place; t h i s has been termed (3 ) t h e quasiquiescent zone. coal en ters t h e gas i f icat ion/combust ion zone.
l/ Act ing Supervisor, A n a l y t i c a l Services. F/ - Chemical Engineer.
Current g a s i f i c a t i o n s tud ies have focused on
The slagging g a s i f i c a t i o n p i l o t p l a n t was i n s t a l l e d du r ing 1958-59, when The o r i g i n a l program was conducted
D e t a i l s o f t h e
The t e s t coal (nomina l l y s ized 3/4 x 1 /4 i nch ) f lows by
As the coal descends through the g a s i f i e r , var ious reac t i ons occur. A
This f i g u r e i s an i d e a l i z e d example, s ince i n ac tua l p r a c t i c e t h e
S im i la r conceptual schemes have been g iven f6r o the r g a s i f i e r s (4,5).
The r e a c t i o n
F i n a l l y , t h e
136
One o f t h e major components o f t h e c u r r e n t GFERC g a s i f i c a t i o n p i l o t p l a n t program i s the sampling, ana lys is , and cha rac te r i za t i on o f e f f l u e n t s produced du r ing the g a s i f i c a t i o n process. extens ive d e t a i l i n a recen t p u b l i c a t i o n by Paulson and co-workers (6), which descr ibes sampling and a n a l y t i c a l methods, and sumnarizes r e s u l t s on e f f l u e n t composition. One aspect o f t h i s study i s t h e development o f mathematical and conceptual r e l a t i o n s h i p s between the e f f l u e n t c h a r a c t e r i s t i c s and t h e g a s i f i e r opera t ing cond i t ions and coa l type.
of organics i n t h e d e v o l a t i l i z a t i o n zone can be shown t o be very s i m i l a r t o a high-pressure, low-temperature ca rbon iza t i on process. The s i m i l a r i t y i s impor tan t s ince i t i s then poss ib le t o draw on t h e extens ive l i t e r a t u r e o f coa l carboniza- t i o n t o help i n t e r p r e t and understand t h e f a c t o r s governing t h e p roduc t i on o f t a r and v o l a t i l e s i n t h e GFERC g a s i f i e r .
The product gas from t h e GFERC g a s i f i e r con ta ins small q u a n t i t i e s o f C2-4 hydrocarbons; these gases t y p i c a l l y being l e s s than 1 p c t (by volume) of t h e t o t a l . Ana ly t i ca l methods and product ion i n fo rma t ion have been discussed pre- v i o u s l y by Olson and Schobert (7 ) . process i s considered t o be due t o thermal cleavage o f t he pe r iphe ra l a l i p h a t i c and a1 i c y c l i c p o r t i o n s o f t h e coal "molecule." The r e l a t i v e p ropor t i ons o f t h e C2-4 hydrocarbons i n t h e GFERC product gas i s compared i n Table 1 t o gas from carbonizat ion. The da ta f rom t h e t h r e e sources has been normal ized t o a bas is o f C2Hg = 1. The GFERC data represent average values from two 200 p s i p i l o t p l a n t t e s t s us ing Baukol-Noonan l i g n i t e . t he r e l a t i v e q u a n t i t i e s o f t h e gases produced.
The GFERC e f f l u e n t program has been t r e a t e d i n
From a cons ide ra t i on o f t h e gas and coa l t a r cha rac te r i s t i cs , t h e product ion
Formation o f these gases du r ing a ca rbon iza t i on
Except f o r ethylene, good agreements e x i s t f o r
Source Gas component GFERC Reference (8) Reference ( 9 )
Tota l a1 kene product ion decreases w i t h inc reas ing pressure, as suggested (9) f o r h igh pressure ca rbon iza t i on processes. 200, and 400 p s i w i t h Ind ian Head l i g n i t e show alkenes ( the sum o f ethylene, propylene, and bu ty lene) decreasing from 0.26 0.01 p c t a t 125 p s i t o 0.23 5 0.02 p c t a t 200 p s i and then t o 0.16 TO.03 p c t a t 400 p s i .
c l a s s i f y i n g coa l t a r s . r e l a t i o n s h i p
Data f rom p i l o t p l a n t t e s t s a t 125,
The aromat izat ion index has been proposed (10) as a convenient method f o r The aromat izat ion index, N, i s ca l cu la ted f rom t h e
N = Cw/3 Hw
cw and Hy a re t h e weight percent o f carbon and hydrogen i n the t a r . a re obtained bo th f rom an end-of-run composite sample and from s i d e stream samplers descr ibed i n previous p u b l i c a t i o n s (2,6). Analyses were done us ing t h e c l a s s i c combustion t r a i n method o r a Coleman model 33 carbon-hydrogen ana lyzer . Data f rom 17 p i l o t p l a n t t e s t s were used t o c a l c u l a t e average values o f N f o r 12 se ts o f opera t ing cond i t ions .
Tar samples
137
Pressure Oxygen r a t e 02/Steam Coal Rank p s i sc fh r a t i o N
Nine o f t h e 12 values a re between 3.13-3.27 and a t e n t h i s 2.97. reasonably w e l l w i t h a va lue of 3.05 suggested by Ju rk iew icz e t a1 (11) f o r low temperature carbon iza t ion t a r from European brown coa ls .
Inc reas ing pressure has been shown (9) t o decrease the concentrat ion o f phenol and increase t h e concen t ra t i on o f h igh molecular weight aromat ics i n car - bon iza t i on ta r . For two p i l o t p l a n t t e s t s a t 200 p s i t he average phenol con ten t o f t h e t a r was 18.4 pct ; f o r two o the r t e s t s i n which on ly the pressure was changed -- t o 400 p s i -- t h e phenol content averaged 13.0 pc t . The l i g n i t e g a s i f i e d i n these t e s t s was I n d i a n Head.
The e f f e c t o f pressure o n t h e fo rmat ion o f h igher molecular weight compounds i n t h e t a r was evaluated f o r f i v e compounds: f luorene, phenanthrene, pyrene, chrysene, and benzopyrene. o f pressure on phenol concentrat ion was a l s o used f o r t h i s comDarison. a r e summarized as fo l l ows :
Th is agrees
Coal t a r composi t ion i s determined a t GFERC by mass spectrometry.
The same p i l o t p l a n t da ta used t o determine t h e e f f e c t Resu l ts
Tar component G a s i f i c a t i o n pressure, p c t 200 p s i 400 p s i
F1 uorene.. ........ 3.4 4.0 Phenanthrene.. .... 3.0 4.6 Pyrene ............ 2.0 2.8 C hry sene. ......... 2.1 2.1 Benzopyrene ....... 2.4 2.2
The q u a n t i t i e s o f t h r e e o f t h e f i v e compounds agree w e l l w i t h t h e h i g h pressure carbonizat ion model (9), i n t h a t t h e amount o f these compounds increased w i t h i nc reas ing pressure.
Inc reas ing res idence t i m e i n t h e reac to r should decrease t h e y i e l d o f t a r (9). Two mechanisms a r e a v a i l a b l e f o r changing residence t ime i n t h e GFERC gasi A t constant pressure, an inc rease i n the oxygen-steam feed r a t e w i l l decrease residence time; a t i d e n t i c a l oxygen-steam ra tes , i nc reas ing operat ing pressure w i l l increase residence t ime. Prev ious ly publ ished GFERC data (6) show t h a t a t 400 ps i , t a r p roduc t ion a t a 6,000 sc fh oxygen r a t e i s 71.9 l b / t o n maf l i g n i t e . Tar p roduc t ion drops t o 55.5 l b / t o n maf l i s n i t e a t an oxygen feed r a t e o f 4,000 scfh. A t an oxygen r a t e o f 4,000 scfh, t a r product ion, >;creases 92.4 l b / t o n ma l i g n i t e i n 100 p s i t e s t s t o 70.1 a t 200 ps i and t o 55.5 a t 400 ps i . were f rom tes ts us ing I n d i a n Head l i g n i t e a t a 1.0 oxygen/steam mole r a t i o .
These r e s u l t s
138
I
E I
i
i e r .
VanKrevelen and Schuyer (12) prov ide a d e t a i l e d k i n e t i c t reatment o f carboni - za t i on processes. Production o f char ( o r d e v o l a t i l i z e d l i g n i t e i n the quasi- quiescent zone before gas i f icat ion/combust ion zone) can be determined f o r t he s lagging g a s i f i e r by sampling t h e bed a f t e r shutdown. have been discussed p rev ious l y (3). Using data f r o m a 200 p s i run, a t 4000 sc fh oxygen r a t e and 1.0 oxygen/steam mole r a t i o w i t h I n d i a n Head l i g n i t e , t he f i r s t - order r a t e constant f o r char product ion was ca l cu la ted t o be 0.014 min-1. The amount o f v o l a t i l e ma te r ia l produced was determined by summing t h e gaseous hydro- carbon, t a r , and aqueous organic ma te r ia l . The f i r s t - o r d e r r a t e constant ca lcu- l a t e d f o r v o l a t i l e product ion f o r the same run i s 0.011 min-1. o f the two r a t e constants suggests t h a t t he char and v o l a t i l e s a re indeed being produced i n a r e a c t i o n f o l l o w i n g VanKrevelen's k i n e t i c model o f a ca rbon iza t i on process.
The agreement o f GFERC p i l o t p l a n t data on gas, t a r , char product ion w i t h carbonizat ion models shows t h a t i t i s poss ib le t o regard the d e v o l a t i l i z a t i o n zone i n the g a s i f i e r as a reg ion o f t y p i c a l coal carbonizat ion reac t i ons . As research continues a t GFERC f u r t h e r understanding o f d e v o l a t i l i z a t i o n i n t h e g a s i f i e r can be der ived f r o m carbonizat ion models.
Char sampling and analys is
The good agreement
1.
2.
3.
4.
5.
6.
7.
8.
REFERENCES
Gronhovd, G.H., A.E. Harak, M.M. Fegley, and D.E. Severson. Slagging Fixed- Bed G a s i f i c a t i o n o f Nor th Dakota L i g n i t e a t Pressures t o 400 ps ig . BuMines R I 7408 (1970).
Ellman, R.C., M.M. Fegley, B.C. Johnson, L.E. Paulson, and H.H. Schobert. Slagging Fixed-Bed G a s i f i c a t i o n . Presented a t 4 t h I n t e r n a t i o n a l Conference on Coal Gas i f i ca t i on , L iquefact ion, and Conversion t o E l e c t r i c i t y , P i t tsburgh, August 1977.
Johnson, B.C., H.H. Schobert, and M.M. Fegley. The Grand Forks Slagging G a s i f i e r : Gas-Solid Reactions i n the Real World. Presented a t National Meeting, American I n s t i t u t e o f Chemical Engineers, New York, 1977.
Grant, A.J. App l i ca t i ons o f t h e Woodall-Duckham Two Stage Coal Gas i f i ca t i on . Presented a t 3rd I n t e r n a t i o n a l Conference on Coal Conversion, P i t t sbu rgh , August 1976.
Agroskin, A.A. Chemistry and Technology o f Coal. I s r a e l Program f o r S c i e n t i f i c Trans lat ions, Jerusalem, 1977.
Paulson, L.E., H.H. Schobert, and R.C. Ellman. Sampling, Analys is , and Character izat ion of E f f l u e n t s from the Grand Forks Energy Research Center Slagging Fixed-Bed Gasi f ier . Presented a t 175th Nat ional Meeting, American Chemical Society, Anahiem, March 1978.
Olson, J.K., and H.H. Schobert. G a s i f i c a t i o n o f Some Nor th Dakota L i g n i t e s . North Dakota Academy o f Science, Grand Forks, A p r i l 1978.
Heilpern, S., and A. Kijewska. Modern Concepts o f the Chemical S t ruc tu re of Coal. (1 963).
U.S.
Product ion o f C1-C4 Hydrocarbons i n the Presented a t 70th Annual Meeting,
I n Selected A r t i c l e s on Chemistry and S t ruc tu re o f Coal. OTS 61-11350
139
9. Altschuler, J . , and H . Shafir . Pecu l i a r i t i e s of Low-Temperature Carbonization o f Solid Fuel Under Pressure. In Chemical Processing of Fuels. Academy of Sciences of the USSR. Moscow, 1957.
10. Jurkiewicz, J . , T. Niewiadomski, and S. Rosinski. A Tentative Class i f ica t ion o f Coke-Oven Tars, Based on New Theoretical Principles. In Selected Ar t ic les
- on Coal Tars. OTS 61-11344 (1963).
11. Jurkiewicz, J . , T. Niewiadomski, and S . Rosinski. New Basis of Coal-Tar
12. VanKrevelen, D.W., and J . Schuyer. Coal Science. Elsevier P u b l i s h i n g Co.,
Clasification. ib id .
New York, 1957.
140
N
U
DEVELOPMENT OF AN ADVANCED FLUIDIZED BED COAL GASIFICATION PROCESS
R. E. Andermann, G. B. Haldipur
Westinghouse E l e c t r i c Corporation Advanced Coal Conversion Department
Box 158 Madison, Pennsylvania 15663
In t roduct ion
Westinghouse E l e c t r i c Corporation, under cont rac t w i t h t h e U.S. Department of Energy, is developing a c o a l g a s i f i c a t i o n process . The process u t i l i z e s a var i - e t y of caking or non-caking coa ls t o produce a c l e a n combustible gas , w a s designed t o supply a c l e a n , low-Btu gas for e l e c t r i c power generat ion through a gas and steam turb ine combined-cycle p l a n t ; however, t h e process can be used t o pro- duce a low-Btu o r medium-Btu gas f o r e i t h e r i n d u s t r i a l f u e l gas o r s y n t h e s i s gas . The Westinghouse coal g a s i f i c a t i o n process can a l s o be used f o r the cogenerat ion of steam, gas , and power.
t o r s (see Figure 1 ) . The f i r s t r e a c t o r , t h e d e v o l a t i l i z e r , is used t o d e v o l a t i l i z e and decake coa ls a s requi red . Coal i s f e d from lockhoppers t o t h i s r e a c t o r through a d r a f t tube i n t o a f l u i d i z e d bed which opera tes a t 1690 @a (230 p s i g ) and 87OoC (1600OF). Devola t i l i zed char c i r c u l a t e s around the d r a f t tube and d i l u t e s t h e in- coming coal , thus prevent ing t h e agglu t ina t ion of c o a l p a r t i c l e s a s they p a s s through t h e p l a s t i c s t a g e during hea t ing . The two product s t reams from the d e v o l a t i l i z e r a r e a combustible gas and char.
The second r e a c t o r , t h e g a s i f i e r , is used t o g a s i f y a wide range of feed m a t e r i a l s which inc lude c o a l s a s w e l l as coal-der ived chars . I n t h e g a s i f i e r , the feed m a t e r i a l s r e a c t with steam and air. t h e h e a t for t h e e n t i r e process and a l s o causes the ash present i n t h e char t o ag- glomerate a t about 1095OC (2000'F). These heavier , l a r g e r a s h p a r t i c l e s d e f l u i d i z e and a r e withdrawn from the bed. The steam-carbon g a s i f i c a t i o n r e a c t i o n is used t o consume the r e m i n d e r of t h e carbon n o t combusted by a i r . moderates the r e a c t o r temperature and provides t h e combustible gas which is i n t r o - duced i n t o t h e d e v o l a t i l i z e r a s t h e f l u i d i z i n g medium.
Since August 1972, a three-phased e f f o r t has been i n progress a t Westinghouse: bench s c a l e and a n a l y t i c a l work; p i l o t s c a l e development on a 545 kg/hr (1200 l b / h r ) Process Development Uni t (PDU); and scale-up s t u d i e s f o r a commercial s c a l e p lan t . This paper considers only t h e work r e l a t e d t o t h e PDU.
s ioning of u t i l i t i e s and process systems was completed by January 1975. gas genera tors were commissioned in e a r l y 1975. i n t h e i r redesign, which w a s followed by t h e i r s u c c e s s f u l commissioning i n September 1975. The tests, which were completed i n August 1976, demonstrated t h e f e a s i b i l i t y of the d r a f t tube concept f o r this port ion of t h e process .
Test ing of t h e g a s i f i e r reac tor s t a r t e d in November 1976 and ended i n December 1977. During t h i s s e r i e s of t e s t s , successfu l opera t ion of t h e g a s i f i e r was demonstrated wi th a wide v a r i e t y of feedstocks which included chars produced e a r l y i n t h e d e v o l a t i l i z e r test s e r i e s . achieved during the g a s i f i e r tests. Also, t h e concept of agglomerating t h e ash i n t h e feed mater ia l and t h e subsequent separa t ion of t h e agglomerated ash from t h e f l u i d i z e d char bed was demonstrated. This paper will d i s c u s s the conceptual design of t h e g a s i f i e r and opera t ing r e s u l t s from some of t h e tests.
The process
The Westinghouse c o a l g a s i f i c a t i o n system inc ludes two f l u i d i z e d bed reac-
The carbon-air combustion r e a c t i o n provides
The g a s i f i c a t i o n r e a c t i o n
Mechanical completion of t h e PDU was achieved i n September 1974. Precommis- The synthesis
Shakedown of the genera tors resu l ted
Test ing of the d e v o l a t i l i z e r r e a c t o r began i n October 1975.
The r e s u l t s of t h e s e tests a r e repor ted elsewhere(1-6).
Control led t e s t s of 100 t o 150 hours were r e a d i l y
I
I
I I
142
Westinghouse G a s i f i e r Descr ip t ion
The g a s i f i e r inc ludes two d i s t i n c t s e c t i o n s ( see Figure 1). During gas- i f i e r operat ion, t h e upper sec t ion contains a f l u i d i z e d bed of coal-derived char p a r t i c l e s . In t h i s f l u i d i z e d bed, the combustion and g a s i f i c a t i o n r e a c t i o n s con- sume the carbon i n t h e char p a r t i c l e s . The agglomeration of the a s h remaining i n t h e p a r t i c l e s a l s o occurs w i t h i n the upper sec t ion . char and ash takes p lace i n t h e lower s e c t i o n of t h e g a s i f i e r which i s c a l l e d the ash annulus.
i n t o a combustion/agglomeration region and a g a s i f i c a t i o n region. agglomeration reg ion i s loca ted j u s t above t h e a i r tube. (char o r coal) which is pneumatically conveyed to the g a s i f i e r i s i n j e c t e d d i r e c t l y i n t o t h i s region. In t h i s region, char combusts w i t h air , producing t h e h e a t neces- s a r y t o : steam g a s i f i c a t i o n reac t ion . reducing atmosphere reg ion of f l u i d i z e d bed where the carbon-steam g a s i f i c a t i o n r e a c t i o n occurs.
The gas flow r a t e s i n t o t h e upper s e c t i o n of t h e reac tor c o n t r o l the f l u i d dynamics i n t h i s sec t ion . Ci rcu la t ion of s o l i d s w i t h i n t h e f l u i d i z e d bed is a func- t i o n of the a i r tube volumetr ic f low which can be cont ro l led by a d j u s t i n g e i t h e r a i r mass flow and/or a i r preheat temperature. The o ther cont ro l on s o l i d s c i r c u l a t i o n i n t h e upper s e c t i o n is a t t h e t r a n s i t i o n between t h e ash annulus and t h e l a r g e r diameter f l u i d i z e d bed s e c t i o n of t h e g a s i f i e r . Gas flow ( e i t h e r steam o r recyc le gas) is i n j e c t e d i n t o a g r i d a t t h i s t r a n s i t i o n t o insure movement of m a t e r i a l i n t h i s region.
pera ture of the f l u i d i z e d bed. A i r , steam, and t o a l e s s e r e x t e n t , cold recyc le product gas , a r e used t o c o n t r o l temperature. F lu id ized bed temperatures can be e a s i l y cont ro l led anywhere from 76OoC (1400'F) t o 1095OC (2000OF).
of char and ash p a r t i c l e s occur. a s h annulus. A s t h e char and ash a r e separa ted , the l a r g e r and heavier ash p a r t i c l e s d e f l u i d i z e . The def lu id ized ash p a r t i c l e s make up a moving f ixed bed reg ion which is withdrawn from t h e bottom of t h e a s h annulus . The molar gas f low r a t e through t h e a s h annulus con- t r o l s t h e char/ash separa t ion . Separat ion of char and ash occurs a t r e l a t i v e l y l o w v e l o c i t i e s , t y p i c a l l y less than 0.75 m / s (2 .5 f t / s ) . The main advantage of t h e ash annulus i s t h a t i t divorces t h e char /ash separa t ion zone from t h e well-mixed f l u i d bed.
T e s t Resul t s f o r t h e Westinghouse G a s i f i e r
m a t e r i a l s which included both chars and coa ls . The chars processed were from the fol lowing sources: 1 ) coke breeze from m e t a l l u r g i c a l coke product ion; 2) FMC char from the COED p l a n t i n Pr ince ton , New Jersey; and 3) char produced i n t h e e a r l i e r tests of t h e Westinghouse d e v o l a t i l i z e r . I n a d d i t i o n t o t h e char processed, t h r e e types of coals were processed i n t h e g a s i f i e r f o r s h o r t time per iods . The coa ls included a non-caking, a mildly caking, and a h ighly caking coal .
were der ived from var ious coals . eva lua t ion and o p e r a b i l i t y t e s t s was coke breeze. a P i t t sburgh seam coal . The FMC chars processed i n t h e g a s i f i e r were der ived from two coal sources: a Kentucky coa l and a Utah coa l . F i n a l l y , t h e d e v o l a t i l i z e r chars were der ived from t h r e e c o a l sources: seam; and 3) an Upper Freepor t seam. Typical feed proper t ies of t h e chars a r e given i n Table I.
The phys ica l separa t ion of t h e
The upper f l u i d i z e d bed s e c t i o n of t h e g a s i f i e r i s conceptual ly subdivided The combustion/
The s o l i d feed m a t e r i a l
1) promote agglomeration of ash r i c h p a r t i c l e s , and 2) d r i v e t h e carbon- The g a s i f i c a t i o n reg ion of t h e f l u i d i z e d bed is t h e
Gas flow r a t e s t o t h e upper s e c t i o n of t h e g a s i f i e r a l s o c o n t r o l t h e tem-
The lower s e c t i o n of the g a s i f i e r , o r ash annulus , i s where t h e separa t ion Both a s lugging bed and a f ixed bed e x i s t i n t h e
The s lugging reg ion conta ins a mixture of char and ash p a r t i c l e s .
In 1977, t h e Westinghouse g a s i f i e r was operated on a wide v a r i e t y of feed
Most of t h e t e s t s run i n 1977 were conducted using char m a t e r i a l s which The predominate feedstock used i n t h e e a r l y des ign
The o r i g i n of the coke breeze i s
1 ) an Indiana //7 seam; 2) a P i t t s b u r g h
143
In addi t ion t o t h e chars processed, t h r e e coa ls were fed d i r e c t l y without pretreatment t o t h e g a s i f i e r . The c o a l s inc lude a Wyoming sub-bituminous C c o a l , a mildly caking bituminous coa l (Indiana #7), and a highly caking bituminous c o a l (Pi t tsburgh seam).
The two d i f f e r e n t conf igura t ions used f o r char or c o a l feed a r e shown i n Figure 2 . Typical operat ing condi t ions , feed r a t e s , and product gas and s o l i d s compositions f o r t h e var ious runs a r e given i n Table 11. achieved on char materials. The important concept of agglomerating t h e a s h i n the feed m a t e r i a l and t h e subsequent separa t ion of t h e agglomerated ash p a r t i c l e s from t h e char bed was s u c c e s s f u l l y demonstrated i n t h e g a s i f i e r t e s t s .
Typical p a r t i c l e s i z e d i s t r i b u t i o n s f o r feed m a t e r i a l , a s h agglomerates, and f i n e s which are c a r r i e d over i n t h e g a s i f i e r off-gas t o t h e cyclone separa tor a r e shown i n Figure 3. It can be seen t h a t s i g n i f i c a n t p a r t i c l e growth occurs due t o ash agglomeration. Table I1 a l s o shows t h a t the bulk dens i ty of t h e a s h product is g r e a t e r than the feed o r the f l u i d i z e d bed char . Both the i n c r e a s e i n p a r t i c l e s i z e and dens i ty a l lows t h e agglomerated ash t o be separa ted from char material. A s f o r t h e f i n e s c a r r i e d over from t h e r e a c t o r , comparing t h e i r s i z e d i s t r i b u t i o n wi th t h a t of t h e feed m a t e r i a l has shown t h a t most f i n e s a r e simply en t ra ined feed m a t e r i a l . combustion zone.
s i z e , shape, and phys ica l appearance depends both on g a s i f i e r temperature and ash holdup o r res idence t i m e i n t h e r e a c t o r . Figure 5 shows t h e e f f e c t of g a s i f i e r ' temperature on t h e a s h agglomerates. Agglomerates produced a t higher reac tor tem- pera tures tend to be denser and more spher ica l . The e f f e c t of ash residence time i s shown i n Figure 6. By f o r c i n g t h e a s h p a r t i c l e s t o remain i n t h e r e a c t o r and pass repea ted ly through t h e h igh temperature zone, t h e ash p a r t i c l e s coa lesce and grow i n s i z e .
Typica l p r o p e r t i e s of t h e coa ls processed a r e given i n Table I.
successfu l o p e r a t i o n of t h e g a s i f i e r was achieved on both chars and c o a l s .
Run times i n excess of 6 days were
The f i n e s a r e recyc led t o e x t i n c t i o n by r e i n j e c t i o n d i r e c t l y i n t o t h e
During t h e g a s i f i e r tests, it was shown t h a t t h e agglomerated a s h par<i ,c le
In a d d i t i o n t o s tudying a s h agglomeration, t h e carbon-steam g a s i f i c a t i o n r e a c t i o n k i n e t i c s w e r e analyzed for t h e PDU g a s i f i e r . Based on more d e t a i l e d carbon-steam r e a c t i o n k i n e t i c s s t u d i e s being conducted on a bench s c a l e u n i t a t t h e Westinghouse Research Laborator ies , the fol lowing equat ion was used t o analyze t h e PDU data :
rc = C exp (-E/RT) (PHZ0)n 1)
where rc is t h e mass r a t e of carbon consumed per mass of carbon i n the bed (min)-1,
C i s a n e m p i r i c a l l y determined constant ,
E i s t h e a c t i v a t i o n energy (218,200 j / g mole or 93,800 Btu / lb mole)(7) ,
P H ~ O i s t h e i n l e t s t ream p a r t i a l p ressure , p s i a .
A p l o t of s p e c i f i c r e a c t i o n r a t e (rc exp(E/RT)) a s a funct ion of steam p a r t i a l pres- sure f o r var ious PDU t e s t p o i n t s is given i n F igure 4 . breeze gave a steam p a r t i a l p ressure exponent, n, of 0.72. wi th values of 0.66(7) and 0.63(8) repor ted elsewhere.
is much l e s s than o ther c h a r s o r coa ls processed i n t h e g a s i f i e r . low r e a c t i v i t y i s probably a r e s u l t of t h e severe processing which occurs during coking. Coke is produced at temperatures of 1035-1095°C (1900-2000eF) and has a res idence time a t these temperatures of between 16-30 hours. used during the g a s i f i e r tests were t y p i c a l l y produced a t temperatures between 705- 870°c (1300-1600°F) w i t h a res idence time a t these temperatures of between 1 t o 2 hours.
The regressed d a t a f o r coke This compares favorably
I t i s worth not ing i n Figure 4 t h a t t h e r e l a t i v e r e a c t i v i t y of coke breeze This apparent ly
The o ther char m a t e r i a l s
144
In conclusion, t h e g a s i f i e r test s e r i e s has been very successfu l . A wide
Control led opera t ion of t h e g a s i f i e r has been v a r i e t y of feed material which inc ludes c o a l and coal-derived chars have been pro- cessed i n t h e Westinghouse g a s i f i e r . achieved f o r continuous runs i n excess of 6 days. I n s i g h t s i n t o ash agglomeration and subsequent separa t ion from t h e char bed has been gained and l a b o r a t o r y s c a l e experiments have proved h e l p f u l in analyzing t h e g a s i f i c a t i o n k i n e t i c s f o r t h e PDU g a s i f i e r . Acknowledgments
program and a l l t h e engineers and s t a f f who cont r ibu ted t o t h e work performed a t t h e Westinghouse Coal G a s i f i c a t i o n s i t e a t Waltz M i l l .
References
The au thors thank t h e U.S. Department of Energy f o r i ts support of t h i s
"Advanced Coal G a s i f i c a t i o n System f o r E l e c t r i c Power Generation"; Westinghouse E l e c t r i c Corporation, Contract r e p o r t t o ERDAIDOE: a ) Inter im Report No. 4, FE-1514-53 b) Inter im Report No. 5, FE-1514-57 c) Quarter ly Report (1Q-FY 1977), FE-1514-61
L. A. Salvador , .E. J. Vidt , and J. D. Holmgren; "The Westinghouse F lu id ized Bed Combined Cycle Process: a t ions"; Environmental Aspects of Fuel Conversion Technology I1 Symposium; December 16, 1975.
R. Shah, P. J. M a r g a r i t i s , L. K. Rath, P. Cherish, and L. A. Salvador;
Proceedings, Eleventh Inter-Society Energy Conversion Engineering Conference; September 1976.
L. K. Rath, P. J. Margar i t i s , R. Shah, P. Cherish, and L. A. Salvador;
on Energy and the Environment; October 6, 1976.
P. J. Margar i t i s , S . S . K i m , P. Cherish, and L. A. Salvador; "Operation of the Westinghouse F lu id ized Bed Devola t i l i zer with a Var ie ty of Coal Feedstocks"; 173rd Nat ional Meeting of the American Chemical Soc ie ty , Div is ion of Fuel Chemistry; March 1977.
L. A. Salvador, J. D. Holmgren, L. K. Rath, and P. J. Margar i t i s ; "Development of the Westinghouse Coal G a s i f i c a t i o n Process - A S t a t u s Report"; 1 2 t h Inter- Society Energy Conversion Engineering Conference; August 28 - September 2, 1977.
S ta tus of Technology and Environmental Consider-
"Operation of the Westinghouse Coal G a s i f i c a t i o n Process Development Unit";
"Operation of t h e Westinghouse Coal G a s i f i c a t i o n PDU"; 4th Nat ional Conference
"Advanced Coal Gas i f ica t ion System f o r E l e c t r i c Power Generation"; Westinghouse E l e c t r i c Corporation, Contract r e p o r t t o ERDAIDOE: a ) Quarter ly Report (3Q-FY 1977). FE-1514-69.
L. Segl in , L. D. Friedman, and M. E. Sacks; "The COGAS Process f o r t h e Gasif ica- t i o n of Coal"; 168th Nat ional Meeting of t h e American Chemical Soc ie ty , Division of Fuel Chemistry, l9, No. 4; September 1974.
145
Pln.b"rph Coke 0r-m
1-8 -ah1
83 5 1
11
800 200
e10 38
0 0
R.1.U". R..CU"lt#' 1 .o A d d Insoluble Iron. Z 01 T O W 34
Figure 6. The Effect of Increased Holdup in the Reactor on Ash Agglomerates
TP-012-3 Air Tube 36” Below Grid Coke Breeze Feed
W-012-2 Air Tube At Orid Elevation Coke Breeze Feed
I I
m, II
I’
I
I
148
8
PEAT HYDROGASIFICATION. S.A. Weil, M. Onischak, D.V. Punwani. Institute of Gas Technology, 3424 S. State St., Chicago, IL 60616, and M. J. Kopstein, U.S. Depart- ment of Energy, Washington, D.C. 20545.
The hydrogasification of a Reed Sedge peat from Minnesota was studied in a 200 foot by 1/16 inch laboratory-scale reactor and in a 160 foot by 0.8 inch PDU
reactor, at pressures up to 1000 psi and temperatures up to 1500°F. In these cocurrent dilute-phase reactors, the hydrogasification of peat yields up to 40% of the carbon as light hydrocarbon gases within 10 seconds. These hydrocarbons appear to be found in several ways. A kinetic description of the process accounting for the light hydrocarbon gases, the carbon oxides, and the liquid products is presented.
149
PRODUCTION OF SNG BY FREE-FALL DILUTE-PHASE HYDROGASIFICATION OF COAL
Harold F. Chambers. Jr. and Paul M. Yavorsky
U. S . Department o f Energy P i t t s b u r g h Energy Research Center
4800 Forbes Avenue P i t t s b u r g h , PA 15213
INTRODUCTION
Hydrogas i f ica t ion o f coa l has been under i n v e s t i g a t i o n a t PERC s i n c e t h e mid- 1950's . steel, tubular r e a c t o r e l e c t r i c a l l y heated t o 800° C a t 6000 p s i and c o n t a i n i n g a n &gram sample of 30 x 60 mesh c o a l (L).
I n i t i a l experiments were conducted wi th a 70-inch by 5/16-inch s t a i n l e s s
Experiments at PERC i n t h e e a r l y 1960's were conducted u s i n g downward en t ra ined f low, h e l i c a l tube r e a c t o r s 60 f e e t by 1/8- inch and 20 f e e t by 5/16-inch. e n t r a i n e d a t a rate of 60 gm/hr i n a 2 f t l s e c hydrogen stream. due t o p a r t i c l e agglomerat ion were encountered i n t h e 500' t o 550" C zone of t h e h e l i c a l tube (2, 2).
Coal was P lugging problems
These experiments l e d t o development of t h e v e r t i c a l f r e e - f a l l , d i lu te -phase (FDP) r e a c t o r w i t h l a r g e diameter so t h a t c o a l p a r t i c l e s were d ispersed t o reduce c o n t a c t while i n t h e p l a s t i c temperature range. d i lu te -phase by mixing w i t h concurren t ly fed h o t hydrogen c o n t r o l l e d agglomerat ion and el iminated t h e need f o r o x i d a t i v e c o a l pre t rea tment . The FDP r e a c t o r w a s i n i t i a l l y t e s t e d as t h e f i r s t s t a g e of t h e two-stage HYDRANE process (4, 2). periments in t h e HYDRANE series used p r i m a r i l y hvAb c o a l s wi th hydrogedmethane mixtures i n t h e FDP r e a c t o r . However, a l i m i t e d number of experiments were con- ducted which demonstrated t h a t t h e FDP r e a c t o r a l o n e could adequately conver t lower rank coa ls and l i g n i t e i n pure hydrogen.
Very r a p i d p a r t i c l e h e a t i n g i n t h e
Ex-
(5) The bas ic o b j e c t i v e of any g a s i f i c a t i o n process t o produce SNG is t h e conversion
of c o a l , t y p i c a l l y CH0.7 t o methane, CH4. H y d r o g a s i f i c a t i o n , u s e s t h e approach of d i r e c t r e a c t i o n of coa l w i t h hydrogen,
Coal + Hp + CHI, + Char 1)
as opposed t o formation o f s y n t h e s i s gas fol lowed by methanat ion,
Coal + Hp0 -+ CO + Hp + Char 2)
CO + 3Hp + CH4 + H p 0 3)
I n t h e d i lu te -phase h y d r o g a s i f i c a t i o n process , c o a l which h a s been washed. pu lver ized and d r i e d is f e d d i r e c t l y t o t h e r e a c t o r wi thout a requirement of ox ida t ive pre t rea tment . Pre t rea tment . t o des t roy t h e c o a l ' s agglomerat ing proper ty , may con- sume 9 pc t of t h e v o l a t i l e matter and 13 p c t of t h e weight (z). of h y d r o g a s i f i c a t i o n is i n t h e minimum use of t h e methanat ion r e a c t i o n shown i n Equat ion 3. in t h e g a s i f i e r because t h e temperature must be l i m i t e d t o 450" C f o r p r o t e c t i o n of C a t a l y s t s . I n t h e DPH p r o c e s s , t y p i c a l l y 65-75 p c t o f t o t a l methane product may be produced d i r e c t l y in t h e FDP r e a c t o r .
A f u r t h e r advantage
This r e a c t i o n is h i g h l y exothermic. b u t t h e h e a t cannot b e used d i r e c t l y
A block diagram of t h e DPH process is shown in Figure 1. R a w pulver ized c o a l and heated hydrogen were fed to t h e r e a c t o r and c h a r and product gas were recovered as products . Char from t h e r e a c t o r may be used e i t h e r i n hydrogen genera t ion or as a f u e l f o r power and steam generat ion.
150
I
I,
I, 1
I
I
m,
EXPERIMENTAL FACILITY
A schematic of the laboratory experimental facility is shown in Figure 2. Coal pulverized to 80 pct minus 200 mesh (U. S. standard sieve series) was initially loaded into a ground-level, low-pressure charging hopper and transferred in the dense phase by nitrogen to the first high-pressure lock hopper. Pressure was equalized between lock hoppers and coal transferred between them by gravity flow. Each lock hopper was 10-inch diameter schedule 120 carbon steel with a stainless steel liner and held approximately a 100 lb coal capacity.
Coal was fed from the second lock hopper by a rotary vane feeder through a water-cooled nozzle, a 0.3-inch tube, to the reactor at rates from 9 to 47 lb/hr. The reactor consisted of an electrically heated 304 stainless steel pipe, 3.26-inch internal diameter and enclosed in a 10-inch carbon steel pressure vessel. Reactor lengths of 5 and 9 feet were used. helical coil of tubing located in the annulus between the hot reactor wall and pressure vessel. the coal. Char and product gas were separated in a disengaging zone below the reactor.
Hydrogen gas was heated by passing through a
It was injected at the reactor head concurrently downward with
Product gas samples were automatically analyzed by an on-line gas chromatograph at 15 minute intervals. on a PDP-11 computer.
All experimental data, including gas analyses, were stored
Char was collected at the base of the facility in two air-cooled, stainless Use of steel receivers which were alternately filled and emptied during a test.
dual feed lock hoppers and char recievers allowed continuous operation.
EXPERIMENTAL PROGRAM AND RESULTS
In the present single-stage FDP reactor it was anticipated that only the more reactive lower rank coals would have adequate carbon conversion for SNG production. Therefore, only Illinois 116 hvCb coal and North Dakota lignite have been tested for the DPH process. sibility and operability of the FDP reactor for SNG production through both long and short duration parametric experiments. Data were obtained on yield and dis- tribution of hydrogenation products to determine optimum test conditions and provide a thorough design data base for scale-up to a larger process development unit. Parameters in the test program were coal type, reactor length, hydrogen/coal ratio and reactor throughput.
Objectives of the experimental program were to demonstrate fea-
Results of several experiments are summarized in Table 1 and typical analyses of coal and lignite are presented in Table 2. with the reactor wall at 900" C. No thermocouples were located internally below the coal injection point to eliminate any potential blockage. experiments was over 99 pct hydrogen. Both coal and lignite were pulverized and screened to 80 pct minus 200 mesh (all minus 100 mesh). Average particle size for lignite and coal was 73.4 and 82.6 um respectively, determined by screen analysis. Conversion was calculated on the basis of ultimate analysis and actual feed and recovery weights of coal and char, with no forcing to 100 pct carbon or ash balance.
Experiments 11124 and 1128 were typical of those conducted with Illinois 116 coal using the five-foot heated reactor. Test times were limited by the single coal hopper that was used prior to installation of the dual lock hopper feed system. These experiments represent a 50 pct variation in coal feed rate, with two hydrogen/ coal ratios tested at each feed rate. In both experiments carbon conversion and methane yield varied directly with the hydrogen/coal ratio. Char particles from these experiments showed an average diameter of 588 um by screen analysis, with size independent of test conditions. Neither experiment produced a carbon conversion necessary f o r balanced plant operation, indicating the necessity for a longer
All tests were conducted at 1000 psig,
Feed gas in all
151
r e s i d e n c e t i m e in t h e r e a c t o r .
Major f a c i l i t y m o d i f i c a t i o n s fo l lowing tests wi th I l l i n o i s 116 c o a l (dual l o c k hoppers) permi t ted extended cont inuous o p e r a t i o n . wi th a nine-foot r e a c t o r having heated l e n g h t s of one t o n i n e f e e t in two-foot i n t e r v a l s . Tes t ing then resumed us ing Nor th Dakota l i g n i t e .
The f ive- foot r e a c t o r w a s replaced
High mois ture and oxygen c o n t e n t s o f t h e l i g n i t e l e d t o product ion of more water and carbon oxides than w i t h hvCb coa l . The h igher CO conten t in t h e product gas stream reduced t o t a l methane t o t y p i c a l l y 75 p c t wi th l igni te as compared t o 90 p c t wi th bituminous coa l .
I n experiment 11134, t h e f i r s t f ive- foot s e c t i o n of t h e r e a c t o r was opera ted a t 900" C while t h e lower four-foot s e c t i o n was only hea ted t o 300" C. This was t o minimize the p o s s i b i l i t y of mois ture condensat ion and c h a r packing by permi t t ing water t o be removed through t h e product gas system. Following t h i s procedure t h e experiment w a s conducted f o r a p e r i o d of 45 hours a t an average l i g n i t e feed rate of 12.5 l b / h r . No r e a c t o r problems were encountered; however t h e test was terminated by feeder s toppage due to f i n e p a r t i c u l a t e s packing around t h e s h a f t , caus ing i t t o s e i z e . Balanced p l a n t o p e r a t i o n was achieved w i t h 44 p c t carbon conversion, b u t product gas hydrogen-to-carbon monoxide r a t i o was h igher than d e s i r e d f o r f i n a l methanation.
The complete r e a c t o r was opera ted a t 900' C in experiment #135 in o r d e r t o a c h i e v e high carbon conversion at low hydrogen/coal r a t i o s . r a t i o s were t e s t e d , r e s u l t i n g in carbon conversion of 44 and 50 p c t wi th low hydrogen/ carbon monoxide r a t i o s i n product gas . compared t o r a t i o s in excess of 7.0 i n prev ious experiments. These v a l u e s a r e con- s i s t e n t wi th requirements f o r f i n a l c leanup methanation w i t h no r e s i d u a l hydrogen separa t ion . Product gases from 135A and 135B had c a l c u l a t e d h e a t i n g v a l u e s of 939 and 1008 Btu/scf , assuming CO methanat ion.
Two hydrogen/coal
R a t i o s of 3.36 and 2.8 were obta ined a s
Experiment 1136 was conducted f o r 22.6 hours a t condi t ions n e a r l y d u p l i c a t i n g t e s t 1l135B t o v e r i f y results a t t h e s e condi t ions . F igure 3 is t y p i c a l of methane and hydrogen composition of t h e product gas f o r t h e d u r a t i o n of t h i s test.
Experiment 11137 was conducted t o determine t h e e f f e c t of throughput on FDP reactor performance. Coal feed r a t e was v a r i e d from 15.9 t o 47.0 l b / h r corresponding t o a throughput range of 276 t o 816 l b l f t l h r . t o maintain n e a r l y c o n s t a n t hydrogen/coal r a t i o . throughput , i n d i c a t i n g a requirement f o r incresed r e a c t o r length a t h igh throughput condi t ions . However, under a l l tes t c o n d i t i o n s , s teady s ta te r e a c t o r o p e r a t i o n w a s e a s i l y maintained and carbon conversion t o methane remained n e a r l y 62.5 p c t . No oil formation was d e t e c t e d i n e i t h e r char r e c e i v e r s o r l i q u i d s t r a p s a t any opera t ing condi t ions .
Feed gas rates were v a r i e d propor t iona l ly Conversion v a r i e d i n v e r s e l y wi th
In experiment 11139 d a t a was obta ined on t h e e f f e c t of hydrogen/coal v a r i a t i o n upon carbon conversion and gas composition at a nominal 25 l b / h r l i g n i t e feed r a t e . A 68 p c t change i n hydrogen/coal r a t i o was t e s t e d , r e s u l t i n g wi th a 23 p c t i n c r e a s e in methane y i e l d per pound of coa l . All o t h e r changes were r e l a t i v e l y small .
CONCLUSIONS
Dilute-phase h y d r o g a s i f i c a t i o n has been demonstrated in s u c c e s s f u l , cont inuous, Carbon conversion necessary f o r balanced p l a n t opera t ion long d u r a t i o n experiments .
wi th l i g n i t e has been demonstrated a t hydrogen/coal r a t i o s producing a high-Btu SNG wi th no r e s i d u a l hydrogen s e p a r a t i o n requirement . phase products h a s been demonstrated wi th no benzene and only trace oil formation. Paramet r ic t e s t i n g has e s t a b l i s h e d e f f e c t s of throughput upon carbon conversion and product d i s t r i b u t i o n .
High carbon s e l e c t i v i t y t o gas
Steady o p e r a t i o n was achieved a t a throughput of over
152
- .
I
E
800 lb/ft2hr. test operation.
Reproducibility of test results has been demonstrated by duplicated
REFERENCES
1.
2.
3.
4.
5.
6.
7.
Hiteshue, R. W., Anderson. R. B., and Schlesinger, M. D., "Hydrogenating Coal at 800' C", Ind. and Eng. Chem., 49, pp. 2008-10. Dec. 1957.
Hiteshue, R. W., Friedman, S., and Madden, R., "Hydrogenation of Coal to Gaseous Hydrocarbons", U. S. BuMines R. I. 6027, 1962.
Hiteshue, R. W., Friedman, S., and Madden, R . , "Hydrogasification of Bituminous Coals, Anthracite and Char", U. S. BuMines R. I. 6125, 1962.
Feldman, H. F., and Yavorsky, P. M., "The Hydrane Process", 5th AGA/OCR Synthetic Pipeline Gas Symposium, Chicago, Illinois, October, 1973.
Gray, J. A., and Yavorsky, P. M., "The Hydrane Process", Clean Fuels from Coal I1 Symposium, IGT, Chicago, Illinois, June, 1975.
Feldman, H. F., Mima, J. A., and Yavorsky. P. M., "Pressurized Hydrogasification of Raw Coal in a Dilute-Phase Reactor", Advances in Chemistry Series, No. 131, Coal Gasification, ACS, 1974.
Wen, C. Y. et. al., "Optimization of Coal Gasification Processes", NTIC IPB 235 787. 1972.
153
d rl cl
? 010 u . u d n 0 0 N n
rl 0 ~ U W l O O d r l m o N d rl cl
.-I rl H
m v , m "p1
4 0 . w c m m o o o u .Nd O O r l h r l r l m o rl
9
rl rl H
m m m'd". 9 u c ~ n o o m o N d O O r l W d.i m o N 4 4 U
a d
4 Z ? 9 u"uv,oolno N r l O O r l \ o r l r l m o N H rl
m n . . . . . . . h . . . n . . . , Y : m - z
rD
0 rl
9 h rl
.n m rl
0
N rl ?
4 t-l rl
m m h
rl m
o\
m N rl
? m rl
? \D rl
r. -! N 4
m n
U rl
0 0
OD
In r.
m
9 Y I ?'9@!? m o u - 0 u r n rl
mu, m m m m . . u o 'rc'dd * m m
n u u ~ m N . . . . . I . N W O l D d 0 mVI
h
w rl
. > . . . . . . . . . . . . . .
".?? o m m n W -
o m - u m h u m n . . .
NYl4
u m m u w m . . .
W m h
N h m . . .
m r . m
ST-! \eon m w u
"i"? I-Nr- N h 0
U
: : : t :
154
VI rl u m N rD rlurlrl . . . . . r ~ w o m u ~ m m r -
4)
2 P ‘2 m v ) m r l u N m m m m c r . m o o o m OD rl u m U \ D o c o ~ u r l d m o u
o” . . . . I . . . . . . . m M O O N V I rl u m rl m m m
4 u y I d
rl rl
o m c o m u o m
m o u m . . . .
rluu PlurlQJ
m o u . . . .
m
rl “ m ln 0
0 rl
0 4 00 m m a u y I d u. ? 9 ? ? I ? ” < ? ??”: r - c o m o o u o N u m o o u o - o m m w r l oorlv, rl rl m m rl u m m rlrl m o N
d rl
W
u 0 “ P-
rl
0 rl
U a “ U r.
rl m a m N m m u N 0 0 m m \ o m - w c ~ m o o r - a rl rl \ o \ ~ o m w o ornu) m M 00-4 rl rl YIN mr.u r l d m o co
o m . . . . . . . . . . . . U U ? I d
d 4
O D D D O N Y I N O
m . . . . u o m U “ m
\D o m n o 8 2 5
2 2 2 I m m U N m m m o . . . . .
m 0 u
m a m N r- In m r l r l N m m m P - m r -
r . c ~ r n o o l ~ u m N m r l o r l r . 0 m r l m m M r l O O N V I rl u m rl m m m r l d m o u
hvCb from Orient 13 mine, Freeman Coal Co., Waltonville, IL. Lignite from Beulah seam, North Dakota.
I,
E
156
n
N W
K W J
D V a. 3 s
157
8 u) 0 c n
t Coal charge
Shut - of f valves
High pressure ,cool lock hoppers
Rotary vane feeder Y/- coal N2 Preheated
Low pressure
Char -gas disengaging zone
Shut - off valve
Depres I I 1 I Char receivers and repressurization
3 -m Elutriated 4 char removal
Figure 2- Dilute- phpse hydrogasifier
3-15-77 L-15059
158
L c al
al
al
E n
- s 0 >
z W 0 0 n D > I
c c al
0)
al
E a
5 - 0
W z I I- W z
a
100
80
60
40
20
0
Start I I 1 I 0 End
of test
0
0 0
- 0 0
0 Hydrogen = 46.7% avg - n* 0,o Jo u uov - - 00 0000
00000 /- 00 000 O O
A LMaethane = 34.5% avg.
A Data points
Figure 3 - Product gas composition vs time experiment # I 3 6 lignite feed , FDP reactor T=900°C P=lOOO psig L= 911
15 9
E f f e c t s of Reac t ion Conditions on Gasification of Coal-Residual Oil S l u r r y
Hiroshi Miyadera, Mizuho Hira to , Shuntaro Koyama, Kenichi Gomi
Hitachi R e s e r a c h Labora tory , Hitachi Ltd. , Ibaraki-ken, J a p a n
Introduction
In the face of energy crisis and environmental pollution, t h e technology for coal
Petroleum, however , wil l hold gasification is being developed as a p a r t of "Sunshine Pro jec t" promoted by the Ministry of Internat ional T r a d e and Industry (MITI). by far the l a r g e s t s h a r e in J a p a n ' s pr imary energy supply f o r the next decades . While the utilization of heavy oil such as vacuum r e s i d u e is limited f r o m a point of view of the air pollution because of difficult desulfur izat ion.
Process1 ' in which c o a l and r e s i d u a l oil are simultaneously gasif ied to c l e a n fue l gas. This r e p o r t br ief ly d e s c r i b e s the p r o c e s s and experimental r e s u l t s .
P r o c e s s Descr ipt ion
Therefore , in 1974 we have s t a r t e d the development of "Hybrid Gas i f ica t ion
A flow diagram of Hybrid Gasif icat ion P r o c e s s is shown i n F i g u r e 1. P u l v e r i z e d coa l is mixed and s t i r r e d with r e s i d u a l oil to form a s l u r r y , which is pumped to the pressur ized fluidized bed gasifier with atomizing s team. The slurry is conver ted into gas and char by thermal c racking reac t ions in the upper zone of the f luidized bed. The c h a r produced is f u r t h e r gasif ied with s team and oxygen.
tar, dus t and steam. dioxide and hydrogen sulf ide from the gas. shifted and methanated.
(1) Almost all g r a d e s of c o a l and res idua l oil c a n b e simultaneously conver ted to c lean fuel gas.
(2) Raw mater ia ls are t ranspor ted and fed to the p r e s s u r i z e d gasifier without difficulty by means of s l u r r y .
(3) The gasifier c o n s i s t s of a single fluidized bed and the gasif icat ion r e a c t i o n s proceed in two s t a g e s - s l u r r y thermal c r a c k i n g a n d c h a r p a r t i a l oxidation. This simple s t r u c t u r e of the gas i f ie r achieves e a s y cont ro l and high thermal efficiency.
The gas leaving the gasifier is scrubbed in o i l and then i n w a t e r quench to remove A conventional gas c lean up system is u s e d to a b s o r b c a r b o n
If SNG is requi red , the product gas is
The advantages of the p r o c e s s are
Experimental
I n o r d e r to invest igate the gasification c h a r a c t e r i s t i c s and to improve the p r o c e s s , experiments were conducted in the p r e s s u r i z e d gasif icat ion a p p a r a t u s shown in F i g u r e 2. 8 0 m m in the lower zone. the gas i f ie r are control led by t h e surrounding e l e c t r i c hea te rs .
hopper is charged and Fluidized with steam and oxygen. s l u r r y with atomizing s team is fed to the middle p a r t of the f luidized bed. height above the s l u r r y feeding point is 700mm. product gas are removed i n cyc lones , s c r u b b e r and quencher, the gas p r e s s u r e is reduced and its composition and its flow rate are measured.
h e a t e r s , the gas ye i lds of t h e s e experiments are somewhat different f rom the o n e s produced in the purely in te rna l ly f i r e d gasifier. c h a r a c t e r i s t i c s of thermal c r a c k i n g and p a r t i a l oxidation separa te ly . produced in the thermal c r a c k i n g zone is cons idered as follows.
The gas i f ie r h a s the inner diameter of 120mm i n t h e upper zone and T h e height of each zone is 2000mm. The t e m p e r a t u r e s in
At the beginning of e a c h experiment, pulver ized and s ieved coa l in the c o a l Then the 2OO0C pre-heated
The bed A f t e r dus t , tar and s team i n the
Since a p a r t of the gas is produced by the heat supplied f rom t h e e x t e r n a l
Therefore , w e have examined the T h e gas
160
G S = G T - C C 1) where GS : gas production r a t e i n the s l u r r y thermal c rack ing zone,
C c : g a s production r a t e in the c h a r pa r t i a l oxidation zone, CT : total gas production r a t e in the gas i f i e r when s l u r r y the rma l c r a c k i n g
and c h a r pa r t i a l oxidation occur simultaneously. G c c a n be measured when s l u r r y feeding is stopped and only t h e c h a r partial oxidation react ion t akes place.
chosen fo r this study because i t is the most pract icable for gasif icat ion u s e in domestic coals.
Table I. Raw mater ia ls
Feeding mater ia ls are shown in Table I. Taiheiyo coal, mined in Hokkaido, was
Taiheiyo coal Gach S a r a n Vacuum Res idue
Proximate analysis (wt5) Boi l ing point (OC) 7 5 5 0 Moisture 5.3 Asphal tene (wt$) 10.4 Ash 14.4 Conradson ca rbon (wt%) 21 -8
V 318 Ni 112
Fixed carbon Volati le matter 42.5
C 76.6 C 85.0 H 6.5 H 10.8
.37.7 Metal content (pprn) Ultimate analysis (wt%,daf) Ultimate ana lys i s (wt5)
N 1 .o 0 15.3 S 0.6
N 0 S
0.1
3.5 -
Heating value (kcal/kg) 6580 Heat ing value (kcal/kg) 10090
(Note) Feed s l u r r y ; Coal/Residual oil : 30/70 (wt. ra t io) Coal s i z e : 40-140 mesh (0.105-0.42 mm)
Initially cha rged coal s i ze : 25-40 mesh (0.42-0.71 mrn)
Gasif ier temperatures w e r e control led by oxygen feed r a t e and t h e su r round ing e l ec t r i c hea te r s between 800 and 95OoC i n the lower pa r t i a l oxidation zone and bet- ween 700 and 800°C in the upper thermal c rack ing zone. Reaction p r e s s u r e s w e r e va r i ed from 5 to 20 atm.
Resu l t s and Discussion
(1) Charac t e r i s t i c s of S l u r r y Thermal Cracking Reaction.
s l u r r y thermal cracking. ca rbon monoxide and c a r b o n dioxide. temperature (Ts) and p r e s s u r e , while yield of by-product tar d e c r e a s e s as p r e s s u r e rises.
F i g u r e 3 shows the effects of temperature and p r e s s u r e on the product yield of The main components produced are hydrogen, methane,
T h e yields of t hese gases i n c r e a s e with
In th i s zone, following r eac t ions t ake place.
Overa l l hea t of r eac t ion AH, can b e estimated by the next equation.
where the f i r s t t e rm on the r igh t s i d e r e f e r s to the summation of h e a t s of combustion f o r the r eac t an t s and the second t e rm f o r the products .
The ove ra l l hea t of r eac t ion estimated by t h e measu red -hea t s of combustion for 161
s l u r r y , t a r and c h a r are shown in the upper columns of F igu re 3 . fugure, p r e s s u r e s .
a s thermal c rack ing and steam reforming are dominant a t higher t empera tu res and exothermic hydrogasification t akes place a t higher p r e s s u r e s .
(2)
hydrogen, carbon monoxide and ca rbon dioxide. supposedly as follows.
A s shown i n the I& i nc reases with increasing temperatures and d e c r e a s e s with inc reas ing
The cha rac t e r i s t i c s s ta ted above definitely show that endothermic r eac t ions such
Charac te r i s t i c s of C h a r Partial Oxidation Reaction. The main components in the g a s produced in the par t ia l oxidation zone are
Therefore , the main r eac t ions are
C ( c h a r ) + 0 2 = C 0 2 6 )
C ( c h a r ) + C 0 2 = 2CO 7)
CO + N20 = C 0 2 + H2 9) C ( c h a r ) + H 2 0 = C O + H 2 8 )
T h e approach of t hese r eac t ions toward equilibrium is indicated in F i g u r e 4. Kp and Kp’ are the equilibrium constant and the observed par t ia l p r e s s u r e r a t i o respect ively. It is apparent from F i g u r e 4 that t h e ca rbon - ca rbon dioxide r eac t ion and the carbon- s t e a m react ion a r e far from equilibrium for all of the r u n conditions tes ted, while the obse rved r a t io s fo r the shift r eac t ion apgroach the equilibrium constant at p r e s s u r e s above 10 atm. i n the r a n g e of 800 to 950 C . (3) H e a t and Material Balance i n Gasif ier .
gas i f i e r without ex te rna l heating w a s investigated. assumptions are made.
B a s e d on the r e s u l t s desc r ibed above, t he heat and mater ia l balance in the A s shown in F i g u r e 5, following
(i) Qs, the heat r e q u i r e d in the s l u r r y thermal c rack ing zone, is rep resen ted by Equation A , where AH is the heat required to w a r m the r eac t an t s from the inlet temperature to the r eac t ion temperature Ts.
(i i) I n the c h a r pa r t i a l oxidation zone, Reaction 6 - 9 take p l ace , React ion 9 being in equilibrium. fluidizing c h a r and gas, and th i s heat is re l eased i n the thermal c rack ing zone. Therefore , in the s teady s t a t e , hea t balance in the gasif ier c a n b e r ep resen ted by Equation B , where QRC and Q G ~ rep resen t the quantit ies of hea t t r ans fe r r ed by cha r and gas , respect ively.
( i i i) In the steady s t a t e , t h e amount of cha r produced in the thermal c rack ing zone is equal to the amount of c h a r gasif ied in the par t ia l oxidation zone. The conclusions from this investigation a r e summarized in F i g u r e 6. It is indi-
cated i n Figure 6-a that the thermal efficiency, i.e., the r a t i o of the heating value of product gas to that of r a w mater ia ls , h a s the maximum value a t about 75OoC. This is because the hea t r equ i r ed in the thermal cracking zone is so l a r g e a t higher tempera- t u re s that the amount of carbon dioxide inc reases . When p r e s s u r e s i n c r e a s e a t constant temperature , as shown i n F igu re 6-b, both the product g a s heating value and the thermal eff ic iency i n c r e a s e and oxygen feed r a t e dec reases . hydrogasification r eac t ions play a more important r o l e a t higher p r e s s u r e s .
The typical heat and mater ia l balance is shown in F igu re 7. the r a w gas is 4070 kcal/Nm3(460 Btu/scf), and 5970 kcal/Nm3(670 Btu/scf) a f t e r removal of carbon dioxide and hydrogen sulfide on the bas i s of d r y gas. efficiency is about 75%.
can be either recycled to the gasif ier or utilized as f u e l o i l , b inder , r a w mater ia ls f o r chemical industr ies and so on.
In addition to the study mentioned above, recent ly a low p r e s s u r e (max. 3 a t m ) internal ly f i red gas i f i e r with a 300mm diameter has been operated t o so lve the possible mechanical and operat ional problems.
Overa l l heat of react ion in this zone raises the temperature of
This is because
The heating value of
The thermal
The t a r The by-product t a r yield is r a t h e r high (13-15 wt%) i n this p r o c e s s .
162
II’ I:
E e
I
On the bas is of these researches , a 12 t/D pilot plant is being designed, and it w i l l be constructed in 1980.
A c kflowledgement
This work w a s sponsored by the Agency of Industrial Sc ience and Technology of MITI and is presented with their permission.
163
Slurry F e e d System
Steam
I Purification I I I
I
Slurry Thermal
Cracking
Char
Partial
Oxidation
Pressurized fluidized bed gasifier
Figure 1 . Coal-Residual Oi l Hybrid Gasification P r o c e s s
Coal Residual Oil
Cyclone Scrubber Quencher
A s h Receiver
Figure 2 . Pressur ized fluidized bed gasification apparatus
164
, (a) P : 5 atm -
I
0.4 1 c 0 . 3 -
0.2 -
0.1 -
,o -
--w- 700 750 800 0- i o 20
Temperature TS (OC) Pressure (atrn)
Figure 3 . Effects of temperature and pressure on s l u r r y thermal cracking
4 - a 0.1 \
Y
0.01
Reaction 7
0 10 20
Pressure (atm)
Figure 4 . Comparison of observed partial pressure ratio of partial oxidation gas with equilibrium constant
165
I
Steam (300 "C) -J& oxy@n(250C)
F i g u r e 5. Reac t ion model in Hybr id Gas i f ie r
I I c + co2- 2 c o Partial
Oxidation I C + H20- CO + H2
TCOC I 1 co + ~ ~ 0 s C 0 2 + H2
x c:
0 .?I 80
W g 70
E $ 60 s:
50
..-I b c
;-
a,
3 5000 k
(a) P : 5 a t m
S t e a m F e e d R a t e : 1.6 kg/kg s l u r r y
(b) TS : 750 "c
t I
I I I
u 700 750 800 0 10 20
Tempera tu re TS (OC) P r e s s u r e (atm)
F igu re 6. Effects of tempera ture a n d p r e s s u r e on Hybr id Gas i f ica t ion P r o c e s s
166
W 0
d
m 3
.$ W 4
2
5
2: 5" a
N .-.
2
167
v) v) W
E a C
.r( 1
.Y
u LI .r(
: 5 h P h 2 C
W
.-
." 2 d ld P 4
.r(
W c
E 5
d
W
4
X
I-
5 .r(
G4
Reactor Performance During Rapid-Rate Hydrogasification of Subbituminous Coal
Michael Epstein, Tan-Ping Chen, and Mohamed A. Ghaly
Bechtel National, Inc. 50 Beale Street
San Francisco, CA 94105
INTRODUCTION
In rapid-rate coal hydropyrolysis, pulverized coal particles are contacted with hot, high-pressure hydrogen for a short period of time. Typical conditions include tem- peratures of 1,000OF'to 2,00OoF, hydrogen partial pressures of 500 to 3,000 psi, and
' particle residence times of 0.05 to 5 seconds. Reaction products are primarily . methane, with smaller amounts of ethane, benzene and its derivatives, light oils, and carbon-oxides. coal particles at rates in excess of 50,00OOF/sec to reaction temperature.
Rapid-rate coal hydropyrolysis involves a number of complex chemical and transport phenomena which are not well understood. These phenomena include devolatilization of the solid coal, hydrogenation of reactive volatile matter, hydrogenation of char, diffusion of volatile matter from the coal particles, and intrusion of hydrogen to stabilize the reactive volatiles or react with the active char.l Excellent reviews of the subject have been presented by Anthony and Howard' and by Pyrcioch et al.3
For the past several years, a number of studies have been conducted on the rapid- rate hydropyrolysis of various rank coals. These studies have included laboratory- scale experiments at CUNY;4 bench-scale experiments at Pittsburgh Energy Research Center (PERC) ,5 Cities Service,6 and Brookhaven National Lab~ratory;~ and small pilot-scale experiments at Rocketdyne.8 production of both gas and liquid products (hydropyrolysis or hydrogenation); others have emphasized the production of only gas (hydrogasification).
Bechtel Corporation has conducted a program for the DOE (Contract EF-77-A-01-2565) to investigate the operability potential and scaleup feasibility of the Cities Ser- vice, Rocketdyne, PERC, and Brookhaven coal hydrogasification processes, relating to DOE plans for a hydrogasification process development unit (PDU).. As part of the program objective, Bechtel has (1) collected bituminous, subbituminous, and lignite coal hydrogasification data from Rocketdyne, Cities Service, PERC, and Brookhaven, (2) performed a reactor model study for each of the processes, and ( 3 ) developed a conceptual full-scale hydrogasification reactor design for converting subbituminous coal to SNG. As part of the reactor model study, semiempirical correlations for pre- dicting overall carbon conversion and carbon conversion to gaseous products have been fitted to the data. publication. 9
This paper presents (1) results of the reactor model study for the hydrogasification of subbituminous coal in the Rocketdyne and Cities Service reactor systems and (2) the design basis for a full-scale subbituminous coal hydrogasifier.
ROCKETDYNE AND CITIES SERVICE SUBBITUMINOUS COAL DATA
Bechtel has collected data from 12 Rocketdyne and 4 2 Cities Service hydrogasification tests using Montana Rosebud subbituminous coal feed. The data have been entered into a computerized data base for ease of evaluation and tabulation. of all of the data contained in the data base will be presented in a future publica- tion.' under Contract EX-77-C-01-2518.
Agglomeration of caking coals is avoided by rapidly heating the
Some of these studies have emphasized the
Results of the Bechtel program will be presented in a future
A computer listing
The Rocketdyne and Cities Service test programs were sponsored by the DOE
The Rocketdyne tests were conducted i n an entrained-downflow t u b u l a r r e a c t o r system designed to feed c o a l a t up t o 1/4- ton/hr wi th c o a l f l u x e s t o 20,000 l b / h r / f t 2 . Coal p a r t i c l e s and hot (1,500°F t o 3,000°F) hydrogen gas are mixed i n s i d e a high- e f f i c i e n c y i n j e c t o r e lement , which produces c o a l heatup r a t e s i n excess of 200,000°F/ sec . The hydrogen g a s is heated f i r s t i n a f i r e d h e a t exchanger, then by p a r t i a l combustion through oxygen a d d i t i o n i n a preburner . t h e r e a c t o r system has been given by Oberg, e t a1.8
The Rocketdyne tests w e r e conducted a t r e a c t o r o u t l e t gas temperatures of 1,420°F t o 1,900°F, p a r t i c l e (or gas)* res idence t imes of 530 t o 1,730 m i l l i s e c o n d s , r e a c t o r p r e s s u r e s of 1,000 t o 1,500 p s i g , and hydrogen-to-coal r a t i o s of 0.33 t o 0 .71 l b / l b . The m a s s median c o a l p a r t i c l e s i z e was approximately 45 microns. v e r s i o n f o r t h e tests ranged from 28 t o 47 percent ; carbon s e l e c t i v i t y t o gas ranged from 5 0 , t o 100 percent ; and carbon s e l e c t i v i t y t o methane ranged from 25 t o 87 per- c e n t . The maximum carbon conversion of 47 percent , carbon s e l e c t i v i t y t o gas of 100 percent , and carbon s e l e c t i v i t y t o methane of 87 percent were obta ined a t a r e a c t o r temperature of 1,760°F, a p a r t i c l e res idence t i m e of 1,420 m i l l i s e c o n d s , and a hydro- gen p a r t i a l p r e s s u r e of 1,390 p s i g .
A more d e t a i l e d d e s c r i p t i o n o f
O v e r a l l carbon con-
The Cities Serv ice bench-scale system incorpora tes an entrained-downflow t u b u l a r r e a c t o r system t h a t is designed t o feed c o a l a t up t o 5 l b / h r wi th c o a l f l u x e s t o 15,000 l b / h r / f t 2 . c o a x i a l i n j e c t o r nozzle t o produce c o a l hea t ing r a t e s i n excess of 100,OOO°F/sec. The mixture tl-en passes through t h e r e a c t o r tube , which is e l e c t r i c a l l y heated through the w a l l s t o main ta in a d i a b a t i c opera t ion . An i n j e c t e d s t ream of cryogen- i c a l l y cooled hydrogen a t t h e r e a c t o r o u t l e t quenches t h e r e a c t i o n . The t e s t s employed a number of h e l i c a l and v e r t i c a l r e a c t o r tubes designed t o accommodate t h e d e s i r e d res idence times and feed flow rates. A more d e t a i l e d d e s c r i p t i o n of t h e reac t o r system has been given by Greene.6
Preheated hydrogen and c o a l are mixed i n s i d e a h igh-ve loc i ty
The C i t i e s Serv ice subbituminous tests were conducted a t r e a c t o r o u t l e t gas tempera- t u r e s of 1,500°F t o 1,750°F, p a r t i c l e (or gas) r e s i d e n c e t imes of 303 t o 3,510 m i l l i - seconds, r e a c t o r p r e s s u r e s of 500 t o 1,600 p s i g , and hydrogen-to-coal r a t i o s of 0.74 t o 1.4 l b / l b . O v e r a l l carbon conversion ranged from 26 t o 55 p e r c e n t ; carbon s e l e c t i v i t y t o gas ranged from 59 t o 84 percent ; and carbon s e l e c t i v i t y t o methane ranged from 18 t o 59 p e r c e n t . The maximum carbon conversion of 55 percent w a s obtained at a g a s tempera- t u r e o f 1,610°F, a res idence time of 3,160 m i l l i s e c o n d s , and a p r e s s u r e of 1,600 psig.
Greenel' has presented a series of p l o t s f o r t h e Ci t ies Serv ice subbituminous d a t a . These p l o t s revealed t h a t a t l a r g e r r e s i d e n c e times carbon conversion i n c r e a s e s with increas ing p r e s s u r e , and a t smaller r e s i d e n c e times carbon conversion decreases with increas ing pressure . The p l o t s a l s o showed t h a t temperature and p r e s s u r e i n t e r a c t e d i n t h e same manner a s r e s i d e n c e time and pressure . Greene has p o s t u l a t e d t h a t t h i s r e v e r s a l e f f e c t of p r e s s u r e wi th r e s i d e n c e time sugges ts a two-step mechanism f o r carbon conversion: pyro lys i s -cont ro l led d e v o l a t i l i z a t i o n a t s h o r t r e s i d e n c e t i m e , and pressure-cont ro l led hydrogenat ion of char a t longer res idence t i m e .
PROPOSED REACTOR MODEL
Rapid hydropyrolysis of c o a l is a n extremely complex process , which involves a num- ber of r e v e r s i b l e heterogeneous and homogeneous r e a c t i o n s . 293 v e r s i o n k i n e t i c s dur ing r a p i d d e v o l a t i l i z a t i o n and subsequent hydrogenat ion are n o t w e l l understood, and a major i ty of t h e models developed t o c o r r e l a t e carbon conver- s i o n d a t a have been more o r less empir ica l . The p r i n c i p a l c o r r e l a t i v e t o o l i n most
The mass median c o a l p a r t i c l e s i z e was approximately 4 5 microns.
Coal ( o r carbon) con-
* For a major i ty of t h e Rocketdyne and C i t i e s S e r v i c e entrained-downflow r e a c t o r t e s t s , p a r t i c l e and gas r e s i d e n c e t i m e s a r e n e a r l v i d e n t i c a l .
169
s t u d i e s has been a s imple f i r s t - o r d e r k i n e t i c model f o r t h e i r r e v e r s i b l e r e a c t i o n C + 2H2 -+ CH4. t h e r e a c t i o n ra te c o n s t a n t , g i v e s :
An i n t e g r a t i o n of t h i s s imple model, assuming t h e Arrhenius form f o r
X = 1 - exp [-ko e x p ( - E / R T ) p ~ 2 t ~ ] (1)
where,
X ko = forward r e a c t i o n rate frequency f a c t o r E = , a c t i v a t i o n energy R = gas c o n s t a n t T = r e a c t i o n tempera ture P H ~ = hydrogen p a r t i a l p r e s s u r e t R
= weight f r a c t i o n o v e r a l l carbon conversion
= p a r t i c l e ( o r gas) res idence time
The above model, however, has n o t s a t i s f a c t o r i l y c o r r e l a t e d d a t a from d i f f e r e n t sources , where p r e s s u r e , r e s i d e n c e t ime, hydrogen-to-coal r a t i o , c o a l p a r t i c l e s i z e , o r c o a l type have d i f f e r e d markedly.2
Bechte l has proposed t h e fo l lowing model f o r c o r r e l a t i n g o v e r a l l carbon conversion t o t h e opera t ing v a r i a b l e s :
x = x* - exp(-y)] (2)
with
a2 + = a 1 (tR) exp(a3 P H ~ ) exp(a4 Pl12/tR) exp(a5 p)
exp(a6 H/C) exp(-a7/TG) exp(-ag P , ~ / T ~ ) (x*)~' (3)
where,
X* = weight f r a c t i o n o v e r a l l carbon conversion a t equi l ibr ium,
JI = f i t t e d f u n c t i o n of independent (opera t ing) v a r i a b l e s
P = t o t a l p r e s s u r e H / C = hydrogen-to-coal r a t i o TG
i . e . , a t i n f i n i t e r e s i d e n c e t i m e
. ai, a2, ... ag = f i t t e d c o e f f i c i e n t s
= maximum r e a c t o r gas temperature
The c o e f f i c i e n t s , a 1 through a g , have been f i t t e d t o t h e d a t a using a computerized mul t ip le - regress ion s t a t i s t i c a l a n a l y s i s . have been included i n t h e model t o account f o r t h e r e v e r s a l e f f e c t of p r e s s u r e wi th res idence t i m e and tempera ture repor ted by Greene. lo not included i n t h e model, s i n c e p a r t i c l e s i z e was not v a r i e d dur ing t h e t e s t i n g .
The proposed model, which c o n s i s t s of an equi l ibr ium component, X*, and a k i n e t i c component, [l-exp(-$)] , s a t i s f i e s a number of boundary c o n s t r a i n t s . For example, as res idence t i m e o r temperature approaches zero , conversion approaches z e r o , and a s res idence time approaches i n f i n i t y , conversion approaches t h e e q u i l i b r i u m conversion l i m i t , X*.
The form of Equat ions 2 and 3 has been inf luenced by t h e similar form of an i n t e g r a - t e d , f i r s t - o r d e r k i n e t i c model f o r t h e r e v e r s i b l e homogeneous r e a c t i o n A 2 B, where One mole of r e a c t a n t produces one mole of product . The a n a l y t i c a l express ion f o r con-' vers ion of A t o B f o r t h i s r e a c t i o n , assuming t h e Arrhenius form f o r t h e forward r a t e c o n s t a n t , is:
The i n t e r a c t i o n terms, PH2/tR and P ~ ~ ! T ~ ,
Mean c o a l p a r t i c l e diameter was
170
where,
XA = weight f r a c t i o n carbon conversion of s p e c i e s A X i = weight f r a c t i o n carbon conversion of s p e c i e s A a t equi l ibr ium k l = forward r e a c t i o n ra te cons tan t k2 = r e v e r s e r e a c t i o n rate cons tan t K = equi l ibr ium cons tan t
The proposed model has a l s o been used t o c o r r e l a t e t h e a v a i l a b l e d a t a f o r carbon con- v e r s i o n t o gas and methane, as fo l lows:
XG, XM = weight f r a c t i o n carbon convers ion t o gas and t o methane,
X& X$ = weight f r a c t i o n carbon conversion t o gas and t o methane a t
JIM = f i t t e d f u n c t i o n s of independent v a r i a b l e s (assumed t o have
r e s p e c t i v e l y
equi l ibr ium, r e s p e c t i v e l y
s a m e form a s $ i n Equation 3 ) .
PREDICTION OF EQUILIBRIUM CARBON CONVERSION
Owing t o the complexity of c o a l hydropyrolys is , a thermodynamic equi l ibr ium computer model, PEPll (Propel lan t Evaluat ion Program), has been used t o p r e d i c t t h e thermo- dynamic e q u i l i b r i a f o r t h e test d a t a . PEP c o n s i d e r s a r e a c t i o n system of carbon (8-graphi te ) , hydrogen, oxygen, and hydrocarbon gases w i t h i n a temperature and p r e s - s u r e range normally encountered i n c o a l hydropyrolys is .
A t a given temperature , p r e s s u r e , qnd r e l a t i v e weights of i n i t i a l r e a c t a n t s , PEP pre- d i c t s the concent ra t ion of s p e c i e s t h a t appear i n s i g n i f i c a n t amounts a t equi l ibr ium. For t h e opera t ing range used i n t h e h y d r o g a s i f i c a t i o n r e a c t o r systems, t h e r e s u l t s from PEP i n d i c a t e t h a t methane is t h e major hydrocarbon product p r e s e n t a t e q u i l i b - rium. Higher hydrocarbon products , such as e thane , e t h y l e n e , o r benzene, a r e present on ly i n t r a c e amounts. PEP a l s o p r e d i c t s t h a t s i g n i f i c a n t q u a n t i t i e s of CO and CO2 can be present i n t h e gas phase a t equi l ibr ium. Note t h a t f o r t h e s e condi t ions t h e e u i l ib r ium o v e r a l l carbon conversion, X*, and t h e e q u i l i b r i u m conversion t o gas , XG, a r e equal .
I n Figure 1, p red ic ted equi l ibr ium conversions f o r t h e subbituminous c o a l a r e shown a s a func t ion of r e a c t i o n temperature and hydrogen-to-coal r a t i o , a t a r e a c t o r p r e s - s u r e of 1,500 ps ig . a l l r e a c t i o n i s exothermic) and wi th increas ing hydrogen-to-coal r a t i o . S ince t h e r e are fewer product g a s moles than r e a c t a n t gas moles dur ing hydropyrolys is , X* ( o r xe) w i l l i n c r e a s e with i n c r e a s i n g pressure . equi l ibr ium conversion t o methane f o r t h e subbituminous c o a l are shown i n F igure 2 a s a func t ion of temperature and hydrogen-to-coal r a t i o a t 1,500 p s i g .
4
A s expected, X* i n c r e a s e s w i t h decreas ing temperature ( t h e over-
S i m i l a r l y , p r e d i c t e d v a l u e s f o r
171
0.2 ' I ' I ' 1 I I I 1 1 1 1 I
REACIION TTUPIRATURE. OF
Figure 1. Predicced FracCion Carbon Conversion B C Equilibrium for Svbbicvminaus Coal
\ Figure 2. Predicced Fraction Carbon Conversion r o Methane
at Equilibrium for Subbituminous Coal
172
PEP p r e d i c t s an equi l ibr ium o v e r a l l f r a c t i o n carbon conversion and conversion t o gas of u n i t y f o r a l l of t h e Rocketdyne and Ci t ies Serv ice subbituminous tests; i . e . , a t i n f i n i t e res idence t i m e , a l l of t h e carbon i n t h e c o a l would be converted t o methane and carbon-oxides. This i s due p r i m a r i l y t o t h e high l e v e l s of hydrogen-to-coal r a t i o , which var ied from about 0.33 t o 1 .4 l b / l b ( s e e F igure 1 ) . PEP a l s o p r e d i c t s t h a t t h e equi l ibr ium f r a c t i o n of carbon converted t o methane is n e a r l y u n i t y f o r a major i ty of t h e Rocketdyne and Cities Serv ice subbituminous t e s t s ( s e e F i u r e 2 ) . For t h e s e condi t ions , Equat ions 2 , 3, 6 , and 7 s i m p l i f y , wi th X* = X$ = XM = 1. subbituminous d a t a , t h e r e f o r e , were generated w i t h i n a regime t h a t is completely con- t r o l l e d by t h e k i n e t i c s of carbon conversion t o products .
As mentioned previous ly , PEP assumes t h a t t h e carbon p r e s e n t is 8-graphi te . Other s tud ies12 ,13 have i n d i c a t e d t h a t t h e carbon present a t equi l ibr ium may be amorphous carbon, which has a h igher r e a c t i v i t y than &graphi te . Therefore , t h e p r e d i c t i o n s of X" and Xi shown i n F i g u r e s 1 and 2 should be considered as approximate, and p o s s i b l y on t h e low s i d e .
FITTED CORRELATIONS
A s t a t i s t i c a l a n a l y s i s of t h e f i t t e d Rocketdyne and Cities Serv ice subbituminous c o a l d a t a showed t h a t o v e r a l l carbon conversion and carbon conversion t o g a s and methane were s i g n i f i c a n t f u n c t i o n s of gas temperature , p a r t i c l e (or gas) res idence time, and hydrogen p a r t i a l p ressure . Carbon conversion was not s i g n i f i c a n t l y a f f e c t e d by r e a c t o r s i z e o r hydrogen-to-coal r a t i o w i t h i n t h e reg ion i n v e s t i g a t e d .
As mentioned previous ly , t h e equi l ibr ium computer model p r e d i c t s t h a t X*, $, and X$ have va lues 'o f u n i t y f o r a l l of t h e subbituminous tests. equi l ibr ium conversion on t h e k i n e t i c components of Equation 2 , 6 , o r 7 could not be obtained from t h e d a t a ; i . e . , t h e va lue f o r t h e f i t t e d c o e f f i c i e n t a9 i n Equa- t i o n 3 could not be determined. S i m i l a r l y , i t w a s n o t p o s s i b l e t o v e r i f y t h e pre- d i c t e d e f f e c t ( i l l u s t r a t e d i n F igures 1 and 2) of hydrogen-to-coal r a t i o on the equi l ibr ium conversions. Addi t iona l d a t a a r e requi red a t reduced hydrogen-to-coal r a t i o (0 .1 t o 0 .3 l b / l b ) t o determine these e f f e c t s .
I t was a l s o not p o s s i b l e t o de te rmine s e p a r a t e l y t h e e f f e c t s of bo th hydrogen par- t i a l p ressure , P H ~ , and r e a c t o r pressure , P, on carbon conversion f o r t h e subbi tu- minous t e s t s . i . e . , P H ~ and P are confounded. For convenience, t h e p r e s s u r e v a r i a b l e i s r e f e r r e d t o as pressure o r hydrogen p a r t i a l p r e s s u r e i n t h i s r e p o r t . It should be noted t h a t t h e s e p a r a t e e f f e c t s of P H ~ and P could b e determined by adding an i n e r t g a s (e .g . , helium) and/or methane t o t h e r e a c t o r r e c y c l e ( feed) gas .
Overa l l Carbon Conversion
The c o r r e l a t i o n f i t t e d t o t h e Rocketdyne and Ci t ies Serv ice subbituminous c o a l car- bon conversion d a t a is:
8 The
Therefore , t h e e f f e c t of
This i s because P H ~ w a s n e a r l y equal t o P f o r a m a j o r i t y of t h e t e s t s ;
-
x = 1 - exp [-2.53 exp(-0.175 PHg/tR) exp(0.000393 PH2)
(8) 1 exp (-3,820/TG)
where pH2 is i n p s i g , t R is i n m i l l i s e c o n d s , and TG is i n OR.
As Equation 8 i n d i c a t e s , X i n c r e a s e s wi th increas ing c o a l p a r t i c l e r e s i d e n c e t i m e and g a s temperature. A t h igh p a r t i c l e res idence t imes , X i n c r e a s e s wi th increas ing hydrogen p a r t i a l p r e s s u r e ; a t low p a r t i c l e res idence times, X d e c r e a s e s wi th increas- ing hydrogen p a r t i a l p ressure . I n a d d i t i o n , the e f f e c t of r e s i d e n c e time on carbon conversion i n c r e a s e s a s p r e s s u r e i n c r e a s e s . The f a c t t h a t o v e r a l l carbon conversion
173
i n c r e a s e s with res idence t i m e sugges ts t h a t conversion of carbon t o products occurs throughout t h e l e n g t h of t h e r e a c t o r .
Equat ion 8 has a s tandard e r r o r of e s t i m a t e of 3 .3 percent i n t h e p r e d i c t e d percent carbon conversion. The measured and predic ted carbon convers ions are shown i n F igure 3. T h e s t a t i s t i c s and Figure 3 i n d i c a t e t h a t w i t h i n t h e experimental e r r o r , t h e C i t i e s Serv ice bench-scale r e a c t o r and t h e Rocketdyne 1 /4- ton/hr r e a c t o r achieve s i m i l a r carbon conversions under comparable opera t ing condi t ions .
A s can be seen i n Figure 3 , . t h e p r e d i c t i o n s of carbon conversion f o r t h e Rocketdyne r e a c t o r a r e , on t h e average , s l i g h t l y h igher than t h e measured v a l u e s , whereas t h e p r e d i c t i o n s for the C i t i e s S e r v i c e r e a c t o r are, on t h e average, s l i g h t l y lower than t h e measured va lues . With t h e d a t a c u r r e n t l y on hand, i t i s n o t p o s s i b l e t o d e t e r - mine whether or not t h i s d i screpancy can be accounted f o r by (1) d i f f e r e n c e s in t h e r e a c t o r s i z e s , (2) d i f f e r e n c e s i n t h e r e a c t o r o p e r a t i n g c o n d i t i o n s (e .g . , t h e Rocket- dyne feed gas c o n t a i n s water vapor) , (3) d i f f e r e n c e s i n t h e accuracy of t h e va lues f o r maximum g a s tempera ture , or (4) d i f f e r e n c e s i n t h e average l e v e l s of t h e hydrogen- to-coa l r a t i o employed i n t h e r e a c t o r systems.
In Figure 4 , p r e d i c t e d o v e r a l l carbon conversion from Equat ion 8 is p l o t t e d as a func- t i o n of maximum gas temperature f o r s e l e c t e d l e v e l s of res idence time and hydrogen p a r t i a l p ressure .
___ Carbon Conversion and S e l e c t i v i t y t o Gas
The c o r r e l a t i o n f i t t e d t o t h e d a t a f o r carbon conversion t o gas is:
where P H ~ i s i n p s i g , tR i s i n m i l l i s e c o n d s , and TG is i n OR.
A s can be seen from Equat ion 9 , XG i n c r e a s e s wi th i n c r e a s i n g r e s i d e n c e t i m e and g a s temperature. A t h igh r e s i d e n c e t i m e and/or a t high temperature , XG i n c r e a s e s wi th i n c r e a s i n g hydrogen p a r t i a l p r e s s u r e ; a t low r e s i d e n c e t i m e and/or a t low tempera- t u r e , XG decreases w i t h i n c r e a s i n g hydrogen p a r t i a l p ressure . I n a d d i t i o n , t h e e f f e c t s of r e s i d e n c e t i m e and gas temperature on conversion i n c r e a s e as hydrogen p a r t i a l p r e s s u r e i n c r e a s e s .
Equat ion 9 h a s a s tandard e r r o r of e s t i m a t e of 3.0 percent i n t h e p r e d i c t e d percent carbon conversion t o gas. F igure 5. The s t a t i s t i c s and Figure 5 i n d i c a t e t h a t t h e C i t i e s S e r v i c e bench-scale r e a c t o r and t h e Rocketdyne 1/4- ton/hr r e a c t o r achieve s i m i l a r carbon conversions t o gaseous products under comparable o p e r a t i o n condi t ions w i t h i n t h e reg ion i n v e s t i g a t e d .
In Figure 6 , p red ic ted v a l u e s f o r carbon s e l e c t i v i t y t o g a s , aG, obta ined from Equa- t i o n s 8 and 9 ( i . e . , bc = XG/X) a r e shown as a func t ion of gas temperature , f o r s e l e c t e d va lues of hydrogen p a r t i a l p ressure a t a r e s i d e n c e time of 1 ,000 m i l l i - seconds. tuminous c o a l d a t a . 1,900°F and 1,500 p s i g .
Carbon Conversion and S e l e c t i v i t y t o Methane
The c o r r e l a t i o n f i t t e d to t h e d a t a f o r carbon conversion t o methane i s :
The measured and predic ted conversions are shown i n
S e l e c t i v i t y t o g a s is very i n s e n s i t i v e t o r e s i d e n c e t i m e f o r t h e subbi- Note t h a t a s e l e c t i v i t y t o g a s of 100 percent i s predic ted a t
174
50
; .o
P d m 5 u
4
i
0
7 0 m 90 a m UEAWRED PERCENT CARBON CONVlRIlON
Figure 3. Comparison of Measured and Predicted Overall Carbon Conversion for Subbituminous Coal
/
Figure 5 Comparison of Measured and Prediefea Carbon Conversion EO Gar for Subbituminous Coal
Figure 4 . Predicted Overall Carbon Conversion for Subbifuminous Coal
Figure 6. Predicted Carbon Seleciivity TO ~a~ for Subbieuminovs Coal
175
% = 1 - exp -0.125 exp(-0.286 PH2/tR) exp(0.00735 PH2) [ - exp(-13.9 P H ~ / T ~ ) ] (10)
where pH2 i s i n p s i g , t R is i n m i l l i s e c o n d s , and TG is i n OR.
A s can be seen from Equat ion 10, XM i n c r e a s e s wi th i n c r e a s i n g p a r t i c l e res idence t i m e and r e a c t i o n temperature . A t h igh res idence t i m e and/or a t high temperature , X, i n c r e a s e s w i t h i n c r e a s i n g hydrogen p a r t i a l p ressure ; a t low r e s i d e n c e time and/or a t low temperature , XM d e c r e a s e s wi th i n c r e a s i n g hydrogen p a r t i a l p r e s s u r e . t i o n , t h e e f f e c t s of r e s i d e n c e t i m e and gas temperature on conversion i n c r e a s e a s hydrogen p a r t i a l p r e s s u r e i n c r e a s e s .
Equat ion 10 has a s tandard e r r o r of e s t i m a t e of 2.6 p e r c e n t i n t h e pred ic ted percent conversion. The measured and predic ted conversions are shown i n F igure 7 . The s t a - t i s t ics and Figure 7 i n d i c a t e t h a t t h e Ci t ies Serv ice bench-scale r e a c t o r and t h e Rocketdyne 1/4- ton/hr r e a c t o r achieve s i m i l a r carbon convers ions t o methane under comparable opera t ing c o n d i t i o n s w i t h i n t h e reg ion i n v e s t i g a t e d .
In F i g u r e 8, predic ted v a l u e s f o r carbon s e l e c t i v i t y t o methane, @M, obta ined from Equat ions 8 and 10 ( i . e . , @M = XM/X) are shown a s a f u n c t i o n of g a s temperature f o r d i f f e r e n t l e v e l s of r e s i d e n c e t i m e and hydrogen p a r t i a l p ressure . The f a c t t h a t car - bon s e l e c t i v i t y t o methane i n c r e a s e s w i t h i n c r e a s i n g r e s i d e n c e t i m e sugges ts t h a t t h e i n i t i a l higher hydrocarbon products of d e v o l a t i l i z a t i o n and, perhaps, products of d i r e c t char hydrogenat ion are cracked down t o methane as gas r e s i d e n c e time increases .
I n addi-
Comparison Between P r e d i c t e d Values f o r Carbon Conversion and Carbon S e l e c t i v i t y t o Products
I n F i g u r e s 9 and 10, p r e d i c t e d carbon conversion t o products and p r e d i c t e d carbon s e l e c t i v i t y t o products a r e shown, r e s p e c t i v e l y , as f u n c t i o n s of gas temperature f o r a p a r t i c l e res idence t ime of 1,000 mi l l i seconds , a hydrogen p a r t i a l p r e s s u r e of 1,500 p s i g , and a hydrogen-to-coal r a t i o of 0.7 l b / l b . I t should be noted t h a t above about 1,700°F, the pred ic ted v a l u e f o r XG drops below u n i t y a t t h e s e l e c t e d opera t ing v a r i - a b l e levels ( s e e F igure 2 ) . Above 1,700°F, t h e r e f o r e , t h e va lues f o r XM shown i n F igures 9 and 10 were o b t a i n e d from Equation 7 us ing t h e c a l c u l a t e d k i n e t i c component from Equation 10 and t h e p r e d i c t e d equi l ibr ium component from Figure 2.
DESIGN BASIS FOR CONCEPTUAL FULL-SCALE HYDROGASIFICATION REACTOR
This s e c t i o n p r e s e n t s t h e conceptua l d e s i g n b a s i s f o r t h e h y d r o g a s i f i c a t i o n s t a g e of a proposed f u l l - s c a l e r e a c t o r f a c i l i t y f o r conver t ing subbituminous c o a l t o SNG. A s c u r r e n t l y envis ioned , t h e r e a c t o r f a c i l i t y w i l l c o n s i s t of a h y d r o g a s i f i c a t i o n s t a g e t o produce methane-rich product gas from t h e c o a l , and a hydrogen product ion s t a g e t o produce hydrogen-rich product g a s from unreacted char and coa l .
The conceptual f u l l - s c a l e h y d r o g a s i f i c a t i o n s t a g e w i l l have a c o n f i g u r a t i o n s i m i l a r t o t h e Rocketdyne and C i t i e s Serv ice r e a c t o r assembl ies , which i n c o r p o r a t e en t ra ined- f low t u b u l a r r e a c t o r chambers. The opera t ing l e v e l s f o r temperature , p r e s s u r e , and r e s i d e n c e t i m e have been based on p r e d i c t i o n s from t h e semiempir ical c o r r e l a t i o n s , which have been f i t t e d t o t h e Rocketdyne and C i t i e s S e r v i c e subbituminous coa l d a t a . The s e l e c t e d and c a l c u l a t e d opera t ing parameters are:
Overa l l carbon convers ion 50 percent Carbon s e l e c t i v i t y t o gas 100 percent Reactor p r e s s u r e 1,500 p s i g Maximum r e a c t o r gas temperature 1,8750F P a r t i c l e (or gas) r e s i d e n c e t i m e 1,100 mi l l i seconds Carbon s e l e c t i v i t y t o methane 86 percent
176
MEASURED PERCENT CARBON rnNYERSlON TO METWANE
Figure 7. Camparison of Measured and Predicted Carbon Conversion To Methane far Subbituminous Coal
Y I X l Y Y U 0.s T r Y P I R A T U R I . *r
F i g u r e 9. Predicted Carbon Conversion co P r o d u c c ~ for Subbituminous Coal
0 1 ' " ' 3 ' I I I u a ILm ,110) 2mD l m l
H I X l U U U G * S T I U I E R I T " R I . ~ P
figure 10. Predicted Carbon Selectivity LO G B ~ Producta for Subbicvminous Coal
177
Greene14 has shown t h a t t h e c o s t of SNG produced from t h e r e a c t o r f a c i l i t y decreases as carbon conversion i n t h e h y d r o g a s i f i c a t i o n s t a g e i n c r e a s e s p a s t t h e char balance p o i n t . (At t h e char b a l a n c e p o i n t , t h e q u a n t i t y of unreacted char from t h e hydrogasi- f i c a t i o n s tage is j u s t s u f f i c i e n t t o produce t h e requi red process hydrogen i n t h e hydrogen product ion s t a g e s . ) An o v e r a l l carbon conversion of 50 percent was s e l e c t e d as t h e reac tor design b a s i s , s i n c e t h a t v a l u e i s c l o s e t o the maximum conversion obtained t o d a t e i n t h e C i t i e s Serv ice and Rocketdyne subbituminous c o a l t e s t i n g , and is above the char ba lance p o i n t .
A carbon s e l e c t i v i t y t o g a s of 100 percent was s e l e c t e d a s t h e r e a c t o r des ign b a s i s by t h e DOE. A r e a c t o r d e s i g n p r e s s u r e of 1 ,500 p s i g w a s chosen because a t pressures less than 1,500 p s i g , t h e pred ic ted maximum r e a c t i o n temperature requi red f o r 100 per- cen t carbon s e l e c t i v i t y t o gas is g r e a t e r than 1,9000F ( s e e F igure 6 and Equat ions 8 and 9) . t h e range of the C i t i e s S e r v i c e s and Rocketdyne subbituminous c o a l t e s t i n g .
The s e l e c t e d hydrogen-to-coal r a t i o of 0.4 l b / l b i s w i t h i n t h e lower range i n v e s t i - gated by Rocketdyne. t h e condi t ion of 100 p e r c e n t carbon s e l e c t i v i t y t o gas a t a p r e s s u r e of 1 ,500 ps ig . For t h e c a l c u l a t i o n , t h e p r e d i c t e d v a l u e f o r o v e r a l l conversion (Equat ion 8) was equated t o t h e pred ic ted v a l u e f o r conversion t o gas (Equation 9 ) . Note t h a t se lec- t i v i t y t o gas i s i n s e n s i t i v e t o res idence time ( s e e F igure 6 ) .
A p a r t i c l e (or gas) r e s i d e n c e t i m e , tR, of 1 ,100 mi l l i seconds was computed, us ing Equa- t i o n 8, f o r t h e c o n d i t i o n of 50 percent o v e r a l l carbon conversion, a t a p r e s s u r e of 1,500 p s i g and a tempera ture of 1,875'F.
The v a l u e of carbon s e l e c t i v i t y t o methane of 86 percent was obta ined by d i v i d i n g t h e p r e d i c t e d value f o r conversion t o methane, XM, by t h e p r e d i c t e d v a l u e f o r o v e r a l l con- v e r s i o n , X , a t a g a s tempera ture of 1,8750F, a r e s i d e n c e t i m e of 1,100 mi l l i seconds , and a p r e s s u r e of 1,500 p s i g . The predic ted v a l u e of X was obta ined from Equation 8 and t h e pred ic ted va lue o f XM from Equation 7 . w a s obtained from Equat ion 10 and t h e equi l ibr ium component, XA, i s from Figure 2. I t should be noted t h a t f o r t h i s r e l a t i v e l y low hydrogen-to-coal r a t i o and r e l a t i v e l y high temperature , X i is approximately 0.86.
Bechte l has f i t t e d carbon conversion t o CO and CO2 t o t h e Rocketdyne and C i t i e s Ser- v i c e d a t a . 9 f o r carbon s e l e c t i v i t y to CO and CO were 13 and 0 p e r c e n t , r e s p e c t i v e l y .
CONCLUSIONS
The developed subbituminous c o a l c o r r e l a t i o n s show t h a t t h e C i t i e s S e r v i c e bench-scale r e a c t o r and t h e Rocketdyne 1/4- ton/hr r e a c t o r achieve s i m i l a r va lues of o v e r a l l carbon conversion and carbon s e l e c t i v i t y t o gaseous products under comparable opera t ing con- d i t i o n s . Therefore , t h e r e s u l t s of t e s t i n g a t Rocketdyne and C i t i e s Serv ice should be s c a l a b l e t o a PDU o r commercial-size r e a c t o r , w i t h i n t h e r e g i o n i n v e s t i g a t e d .
Temperatures g r e a t e r t h a n 1,9000F a r e considered excess ive and a r e o u t s i d e
A maximum g a s temperature , TG, of 1,8750F was c a l c u l a t e d f o r
The k i n e t i c component of Equation 7
A t t h e s p e c i f i e d l e v e l s of t h e opera t ing v a r i a b l e s , t h e pred ic ted va lues
2
-The f i t t e d c o r r e l a t i o n s i n d i c a t e t h a t o v e r a l l carbon conversion i n c r e a s e s wi th increas- i n g c o a l p a r t i c l e r e s i d e n c e t i m e and g a s temperature . t i m e s , conversion i n c r e a s e s wi th i n c r e a s i n g hydrogen p a r t i a l p r e s s u r e ; a t low p a r t i c l e r e s i d e n c e times, convers ion decreases w i t h i n c r e a s i n g hydrogen p a r t i a l p ressure . This i n c r e a s e i n o v e r a l l carbon conversion wi th r e s i d e n c e t ime sugges ts t h a t conversion of carbon t o products occurs throughout t h e l e n g t h of t h e r e a c t o r . The r e v e r s a l e f f e c t s of p r e s s u r e on carbon convers ion sugges ts a two-step mechanism f o r hydrogas i f ica t ion : pyro lys i s -cont ro l led d e v o l a t i l i z a t i o n a t s h o r t r e s i d e n c e t i m e , and pressure-cont ro l led hydrogenation of char a t l o n g e r res idence time.
A t h igh p a r t i c l e r e s i d e n c e
178
The f i t t e d c o r r e l a t i o n s a l s o i n d i c a t e t h a t carbon s e l e c t i v i t y t o methane i n c r e a s e s with increas ing temperature and p a r t i c l e r e s i d e n c e t i m e . t o methane wi th i n c r e a s i n g res idence t i m e sugges ts t h a t t h e i n i t i a l h i g h e r hydrocar- bon products of d e v o l a t i l i z a t i o n and, perhaps, t h e products of d i r e c t c h a r hydrogen- a t i o n are cracked down t o methane as r e s i d e n c e t i m e i n c r e a s e s .
The Rocketdyne and C i t i e s Serv ice subbituminous d a t a were generated w i t h i n a regime t h a t i s c o n t r o l l e d by t h e k i n e t i c s of carbon conversion t o products . This i s due pr imar i ly t o t h e r e l a t i v e l y l a r g e hydrogen-to-coal r a t i o s (0 .3 t o 1 .4 l b / l b ) used i n the t e s t i n g . For t h e s e hydrogen-to-coal r a t i o s , t h e p r e d i c t e d carbon conversion a t equi l ibr ium i s 100 percent f o r a l l t e s t s ; i . e . , a t i n f i n i t e r e s i d e n c e t i m e , a l l of t h e carbon i n t h e c o a l would be converted t o methane and carbon-oxides.
REFERENCES
1. Russel , W. B. , S a v i l l e , D . A . , and Greene, M. I. "The Cities S e r v i c e Model f o r
The i n c r e a s e i n s e l e c t i v i t y
Shor t Residence Time Hydropyrolysis of Coal," presented a t t h e AIChE 70th Annual Meeting, New York C i t y (November 1977).
AIChE J . , Vol. 2 2 , No. 4 , p. 625 (1976).
Research B u l l e t i n No. 39, Vol. 1, I n s t . Gas Tech., Chicago, I l l . (December 1972).
Vol. 55, p. 109 (Apr i l 1976).
of Raw Coal i n a Dilute-Phase Reactor," ACS Adv. Chem. S e r . No. 131, p. 108 (1974).
T i m e (CS-SRT) Process ," presented a t t h e ACS 174th Nat ional Meeting, Chicago (September 1977).
7. F a l l o n , P. , and Ste inberg , M. "Flash Hydropyrolysis of Coal ," presented a t t h e ACS 173rd Nat ional Meeting, New Orleans (March 1977).
8. Oberg, C. L . , Fa lk , A. Y . , Hood, G . A . , and Gray, J. A. "Coal Liquefac t ion Under High-Mass Flux and Short-Residence Time Condit ions," I b i d .
9. Bechte l Corporat ion, "An Analysis of Coal Hydrogas i f ica t ion Processes ," F i n a l Report , DOE Contract EF-77-A-01-2565 ( t o be publ i shed) .
10. Combs, L . P. and Greene, M.,I. "Hydrogasif ier Development f o r t h e Hydrane Process ," Monthly Progress Report, January 1978, DOE Contract EX-77-C-01-2518 (February 1978).
11. Cru ise , D. R. "Notes on t h e Rapid Computation of Chemical E q u i l i b r i a , " Propuls ion Development Department, U.S. Naval Ordnance T e s t S t a t i o n , China Lake, C a l i f o r n i a (1964).
1 2 . Moseley, F. and Pa terson , D . "The Rapid High-Temperature Hydrogenation of Coal Chars - P a r t 2 : Hydrogen Pressures Up t o 1000 Atmospheres," J . I n s t . Fue l , Vol. 38, No. 296, p . 378 (September 1965).
13. Stephens, D. R. and Miller, D . C . "Thermodynamic Equi l ibr ium f o r Wyoming Coal: N e w Calcu la t ions ," Lawrence Livermore Laboratory, UCID-17044 (February 24, 1976).
14. Combs, L. P. and Greene, M. I . "Hydrogasif ier Development f o r t h e Hydrane Process ," Monthly Progress Report , March 1978, DOE Cont rac t EX-77-C-01-2518 (Apr i l 1978).
2. Anthony, D . B. and Howard, J . B. "Coal D e v o l a t i l i z a t i o n and Hydrogas i f ica t ion ,"
3. Pyrcioch, E. J . , e t a l . "Product ion of P i p e l i n e Gas by Hydrogas i f ica t ion of Coal,"
4. G r a f f , R . A. , Dobner, S . , and Squi res , A. M . "Flash Hydrogenation of Coal," Fuel ,
5. Feldman, H. F., Mima, J. A . , and Yavorsky, P. M. "Pressurized Hydrogas i f ica t ion
6. Greene, M. I. "Engineering Development of t h e C i t i e s Serv ice , Shor t Residence
ACKNOWLEDGMENT
The work presented i n t h i s paper w a s sponsored by t h e DOE, Washington, D . C . , under Cont rac t No. EF-77-A-01-2565. The au thors wish t o express a p p r e c i a t i o n f o r t e c h n i c a l support provided by L. Jablansky (DOE Technica l P r o j e c t O f f i c e r ) , M. I . Greene ( C i t i e s S e r v i c e ) , J. A. Gray (PERC), and J. Friedman and L. P. Combs (Rocketdyne).