44
FOSSIL FUELS I FOSSIL FUELS I PETROLEUM PETROLEUM
| Date post: | 16-Dec-2015 |
| Category: |
Documents |
| Upload: | carissa-bligh |
| View: | 214 times |
| Download: | 1 times |
FOSSIL FUELS IFOSSIL FUELS I
PETROLEUMPETROLEUM

Approximately 84% of the energy Approximately 84% of the energy used in the US comes from fossil fuelsused in the US comes from fossil fuelsOil and Natural Gas (Petroleum)Oil and Natural Gas (Petroleum)CoalCoalOil Shale and Tar SandOil Shale and Tar Sand
Nonrenewable Resource (Fuel)Nonrenewable Resource (Fuel)

Formation ProcessFormation Process
Formation takes 10’s to 100’s of Formation takes 10’s to 100’s of million years.million years.
1.1. Dead plants and Animals accumulate Dead plants and Animals accumulate on ancient sea floor.on ancient sea floor.
2.2. Sandstone layer forms over source Sandstone layer forms over source bed.bed.
3.3. High Pressure and Temperature High Pressure and Temperature results in a loss of Oxygen in the results in a loss of Oxygen in the compoundscompounds

4.4. Results in various hydrocarbons Results in various hydrocarbons (organic compounds with mostly (organic compounds with mostly Hydrogen and Carbon in them…Hydrogen and Carbon in them…more later). These can be solid more later). These can be solid liquid or gas.liquid or gas.
5.5. Liquid and gas migrate through Liquid and gas migrate through porous rock layer (sand stone) until porous rock layer (sand stone) until they get caught in a trap or escape.they get caught in a trap or escape.

Types of Oil TrapsTypes of Oil Traps
Fold Salt DomeFold Salt Dome

FaultsFaults

La Brea Tar PitsLa Brea Tar Pits

Typical DepositTypical Deposit
A few miles acrossA few miles across Approximately 1 mile down Approximately 1 mile down
(sometimes more.(sometimes more.
VERY HARD TO FINDVERY HARD TO FIND

Tools for Searching for Tools for Searching for DepositsDeposits
Gravitational/Magnetic AnomaliesGravitational/Magnetic AnomaliesEasy to do over a wide area, but is a Easy to do over a wide area, but is a very coarse measurement. Good to pick very coarse measurement. Good to pick out regions for further studyout regions for further study
Geological SurveyGeological SurveyLook at the rocks and minerals in the Look at the rocks and minerals in the region. Certain types are indicative of region. Certain types are indicative of hydrocarbon deposits.hydrocarbon deposits.

Seismic SurveySeismic Survey Gives a detailed picture of the subsurfaceGives a detailed picture of the subsurface Very expensiveVery expensive Used over limited but promising areas.Used over limited but promising areas.

Example Seismic ImageExample Seismic Image

Petroleum Geologists at Petroleum Geologists at WorkWork

Eventually you must drill a wildcat Eventually you must drill a wildcat well. (1well. (1stst well in a region.) well in a region.)
Even with all of the research, only 1 Even with all of the research, only 1 out of 9 wildcat wells results in a out of 9 wildcat wells results in a commercially viable well.commercially viable well.
Historically, it takes about 11 years for Historically, it takes about 11 years for a new discovery to begin producing.a new discovery to begin producing.
Oil Drilling Video

Which of the following is not Which of the following is not a typical oil trapa typical oil trap
1.1. FaultFault
2.2. FoldFold
3.3. FractureFracture
4.4. Salt DomeSalt Dome

US Oil & Gas LocationsUS Oil & Gas Locations

ProductionProduction
Primary Recovery Primary Recovery gets 15% of oilgets 15% of oil
Secondary Secondary Recovery (pumping Recovery (pumping water down the water down the well) gets another well) gets another 20%.20%.
65% is still down 65% is still down there.there.

Enhanced ProductionEnhanced Production
Much more expensiveMuch more expensive Works by reducing surface tension and Works by reducing surface tension and
viscosity of the oilviscosity of the oil

Enhanced Production Enhanced Production MethodsMethods
Pump in pressurized Carbon Dioxide Pump in pressurized Carbon Dioxide to reduce viscosityto reduce viscosity
Pump in steam to reduce viscosityPump in steam to reduce viscosity Add detergent to reduce surface Add detergent to reduce surface
tension with surrounding rock (then tension with surrounding rock (then flood with water.flood with water.

What is in OilWhat is in OilHydrocarbons,
These are the Alkanes
CnH2n+2
The proportion of hydrocarbons in the petroleum mixture is highly variable between different oil fields and ranges from as much as 97% by weight in the lighter oils to as little as 50% in the heavier oils and bitumens.

Generally we must treat oil Generally we must treat oil from the groundfrom the ground
Fractional: Distillation: The vapors of different Fractional: Distillation: The vapors of different hydrocarbons condense at different temperatures .hydrocarbons condense at different temperatures .

Oil RefineryOil RefineryRefining Video

Problem: Generally have too many Problem: Generally have too many heavy compounds and not enough heavy compounds and not enough light ones.light ones.
Solution: Break apart long Solution: Break apart long hydrocarbons into shorter pieces.hydrocarbons into shorter pieces.
Two techniques:Two techniques:1.1. Cracking: uses high pressure and Cracking: uses high pressure and
temperaturetemperature2.2. Catalytic conversion: pass petroleum Catalytic conversion: pass petroleum
over an Al-Si mixture:over an Al-Si mixture:

Product Percent of Total
Lubricants 0.9 %
Other Refined Products 1.5 %
Asphalt and Road Oil 1.9 %
Liquefied Refinery Gas 2.8 %
Residual Fuel Oil 3.3 %
Marketable Coke 5.0 %
Still Gas 5.4 %
Jet Fuel 12.6 %
Distillate Fuel Oil 15.3 %
Finished Motor Gasoline 51.4 %One barrel contains 42 gallons of crude oil. The total volume of products made from crude oil based origins is 48.43 gallons on average - 6.43 gallons greater than the original 42 gallons of crude oil. This represents a "processing gain" due to the additional other petroleum products such as alkylates are added to the refining process to create the final products. Additionally, California gasoline contains approximately 5.7 percent by volume of ethanol, a non-petroleum-based additive that brings the total processing gain to 7.59 gallons (or 49.59 total gallons).

You can also form long hydrocarbon chains You can also form long hydrocarbon chains by combining light onesby combining light ones
Important for forming material such as Important for forming material such as nylon, rayon and plastics.nylon, rayon and plastics.

Fun Fact to know and tell…Fun Fact to know and tell…
The refining of oil The refining of oil is a very energy is a very energy intensive process. intensive process. Approximately Approximately 7.5% of the total 7.5% of the total US energy US energy consumption goes consumption goes into running oil into running oil refineries.refineries.

Gasoline Octane RatingGasoline Octane Rating
Normal Gas is composed of Normal Gas is composed of hydrocarbons with 5-10 Carbon atomshydrocarbons with 5-10 Carbon atoms
Each one burns differentlyEach one burns differently Octane: COctane: C88HH1818 is a standard for is a standard for
comparison, it burns very smoothly.comparison, it burns very smoothly. Heptane: CHeptane: C77HH1616 burns explosively, burns explosively,
causes inefficiency and engine “knock”causes inefficiency and engine “knock”

Octane rating Octane rating Pure Octane: Pure Octane: 100100 Pure Heptane: Pure Heptane: 0 0 90% Oct, 10% Hep90% Oct, 10% Hep 90 90
Using additives we may also produce a Using additives we may also produce a fuel with the same level of “engine fuel with the same level of “engine knock” as a given Octane-Heptane knock” as a given Octane-Heptane mix. This is given the same octane mix. This is given the same octane rating (tetraethyl lead was the old rating (tetraethyl lead was the old additive… it is now illegal.)additive… it is now illegal.)

Burning of GasBurning of Gas IdealIdeal 2C2C88HH1818 + 25O + 25O22 16 CO 16 CO2 2 + 18H+ 18H22O + energyO + energy Gas + Air Gas + Air Carbon Dioxide + Water + Carbon Dioxide + Water +
energyenergy The COThe CO2 2 by burning fossil fuels is generally by burning fossil fuels is generally
believed to be causing significant believed to be causing significant changers to the earth’s climate.changers to the earth’s climate.

More realistic More realistic
2C2C88HH1818 + 25O + 25O22 14 CO 14 CO2 2 + 2CO + O+ 2CO + O22 + + 18H2O + energy.18H2O + energy.
In addition, since there is Nitrogen in In addition, since there is Nitrogen in the air we get nitrous oxides (big the air we get nitrous oxides (big part of smog) NOxpart of smog) NOx
NN22 +2O +2O22 2NO 2NO22
NN22 +O +O22 2NO 2NO

WORLD & US OIL RESERVES WORLD & US OIL RESERVES 20032003
WORLD 1213 billion barrelsWORLD 1213 billion barrels US 23 billion barrels (1.9%)US 23 billion barrels (1.9%) Lifetime of US supply based on Rate Lifetime of US supply based on Rate
equation at 2003 production rate: equation at 2003 production rate: 10yrs10yrs

Proven Reserves Proven Reserves (Oct 2009)(Oct 2009)RankRank CountryCountry Proven Reserves in Proven Reserves in
Billion BarrelsBillion Barrels
11 Saudi ArabiaSaudi Arabia 266.7 (19.78%)266.7 (19.78%)
22 CanadaCanada** (tar sand) (tar sand) 178.1 (13.21%)178.1 (13.21%)
33 IranIran 136.2 (10.10%) 136.2 (10.10%)
44 IraqIraq 115.0 (8.53%)115.0 (8.53%)
55 KuwaitKuwait 104.0 (7.71%)104.0 (7.71%)
66 VenezuelaVenezuela 99.4 (7.37%)99.4 (7.37%)
77 United Arab EmiratesUnited Arab Emirates 97.8 (7.25%)97.8 (7.25%)
88 RussiaRussia 60.0 (4.45%)60.0 (4.45%)
99 LibyaLibya 43.7 (3.24%)43.7 (3.24%)
1010 NigeriaNigeria 36.2 (3.24%)36.2 (3.24%)
The US is number 12 with21.3 bbl (1.58%)


US Oil Produced and FoundUS Oil Produced and Found

Net Difference Between Net Difference Between Annual World Oil Reserves Annual World Oil Reserves
Additions and Annual Additions and Annual Consumption.Consumption.

Hubbert AnalysisHubbert Analysis
In 1956 Hubbert In 1956 Hubbert predicted US oil predicted US oil production would production would peak in late 60’ or peak in late 60’ or early 70’s.early 70’s.
It peaked in 1970.It peaked in 1970.
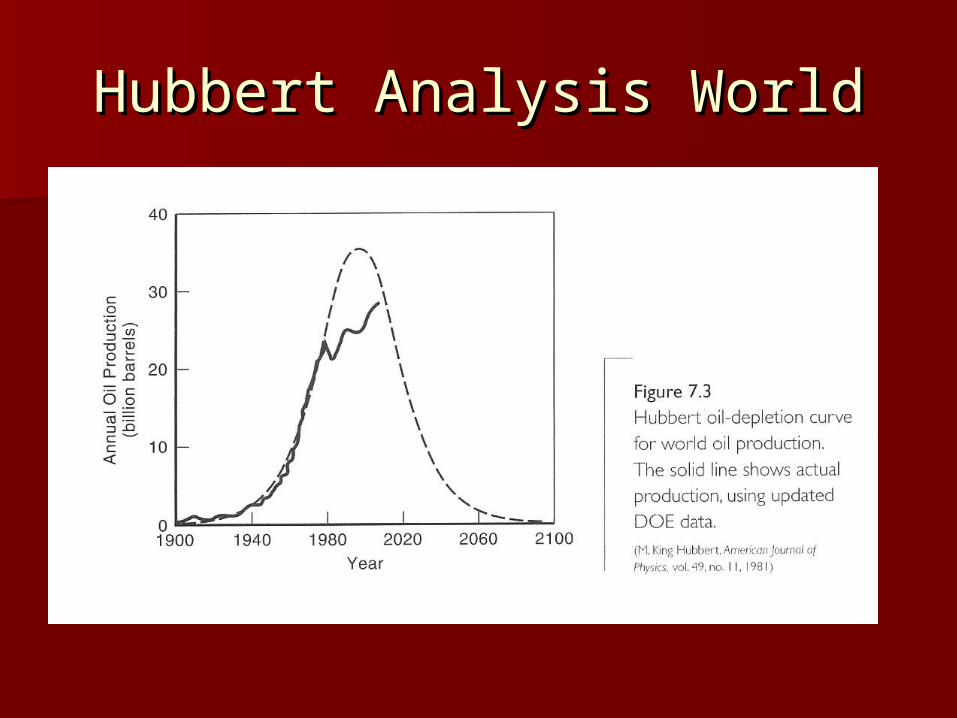
Hubbert Analysis WorldHubbert Analysis World


Projected Date of World Peak Production
Source of Projection Background
2006-2007 Bakhitari, A.M.S. Iranian Oil Executive
2007-2009 Simmons, M.R. Investment Banker
After 2007 Skrebowski, C. Petroleum journal Editor
Before 2009 Deffeyes, K.S. Oil company geologist
Before 2010 Goodstein, D. Vice Provost, Cal Tech
Around 2010 Campbell, C.J. Oil company geologist
After 2010 World Energy Council World Non-Government
Org.
2010-2020 LaHerrere, J. Oil company geologist
2016 EIA nominal case DOE analysis/information.
After 2020 CERA Energy consultants
2025 or later Shell Major oil company
No visible peak Lynch, M.C. Energy economist


What about ANWRWhat about ANWR

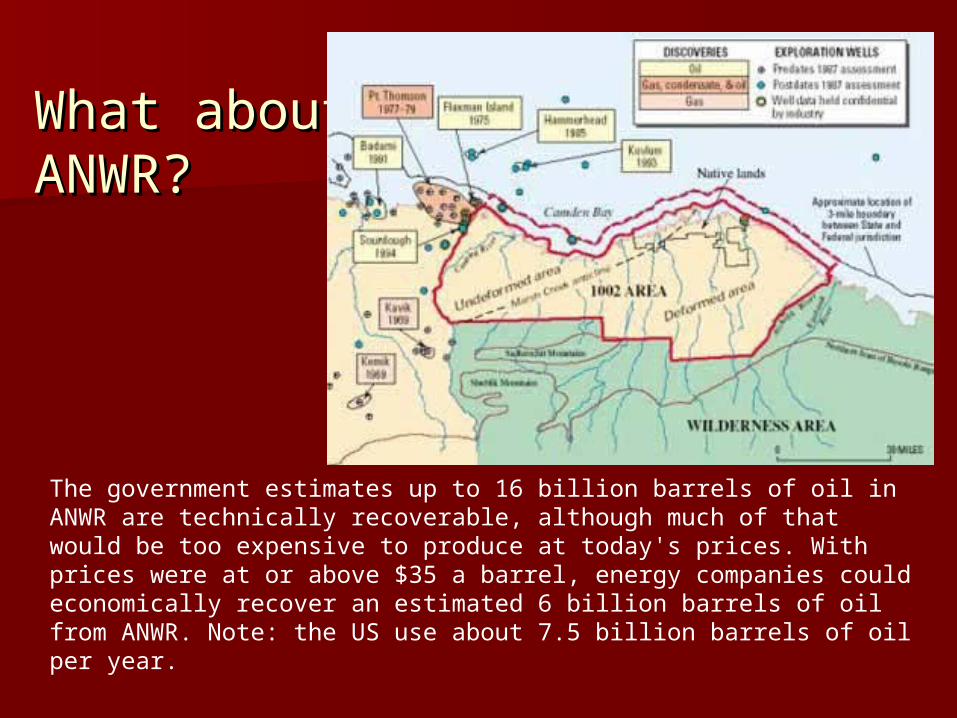
What about ANWR?What about ANWR?
The Alaska National Interest Lands Conservation Act (1980) established the Arctic National Wildlife Refuge (ANWR). In section 1002 of that act, Congress deferred a decision regarding future management of the 1.5-million-acre coastal plain in recognition of the area’s potentially enormous oil and gas resources and its importance as wildlife habitat. A report on the resources, including petroleum, of the 1002 area was submitted to Congress in 1987 by the Department of the Interior (DOI). Since completion of that report, numerous wells have been drilled and oil fields discovered near ANWR, new geologic and geophysical data have become available, seismic processing and interpretation capabilities have improved, and the economics of North Slope oil development have changed significantly.
What about What about ANWR?ANWR?
The government estimates up to 16 billion barrels of oil in ANWR are technically recoverable, although much of that would be too expensive to produce at today's prices. With prices were at or above $35 a barrel, energy companies could economically recover an estimated 6 billion barrels of oil from ANWR. Note: the US use about 7.5 billion barrels of oil per year.

Should ANWR be opened up Should ANWR be opened up to oil drillingto oil drilling
1 2
50%50%1.1. YesYes
2.2. NoNo


