Fostering Good Governance through Trade Agreements An evidence-based review for the workshop ‘EU anticorruption chapters in EU free trade and investment agreements’ Brussels, January 24, 2018 Prof. Dr. Alina Mungiu-Pippidi European Research Centre for Anticorruption and State-building (ERCAS) www.againstcorruption.eu , www.integrity-index.org Berlin, Hertie School of Governance Bucharest, Romanian Academic Society [email protected]
Transcript
Fostering Good Governance through
Trade Agreements
An evidence-based review for the workshop ‘EU anticorruption chapters in EU free trade and
investment agreements’
Brussels, January 24, 2018
Prof. Dr. Alina Mungiu-PippidiEuropean Research Centre for Anticorruption and State-building (ERCAS)
www.againstcorruption.eu , www.integrity-index.orgBerlin, Hertie School of Governance
I. What is the connection between trade and corruption?
II. What is the practice in regard to free trade agreements and anticorruption provisions ?
III. How have the current international and European policies on transparency and anticorruption performed so far and what synergies could enhance the impact between trade and anticorruption?
IV. What are the options for EU, seeing that it is also the world’s largest development donor?
I. What is the connection between trade and corruption?
How does government favoritism look like ? Markets ruled by connections with bribes used to open access
• Companies lose/win surprisingly when government changes
• Hungary and UK
4
Source: againstcorruption.eu
(M. Fazekas)
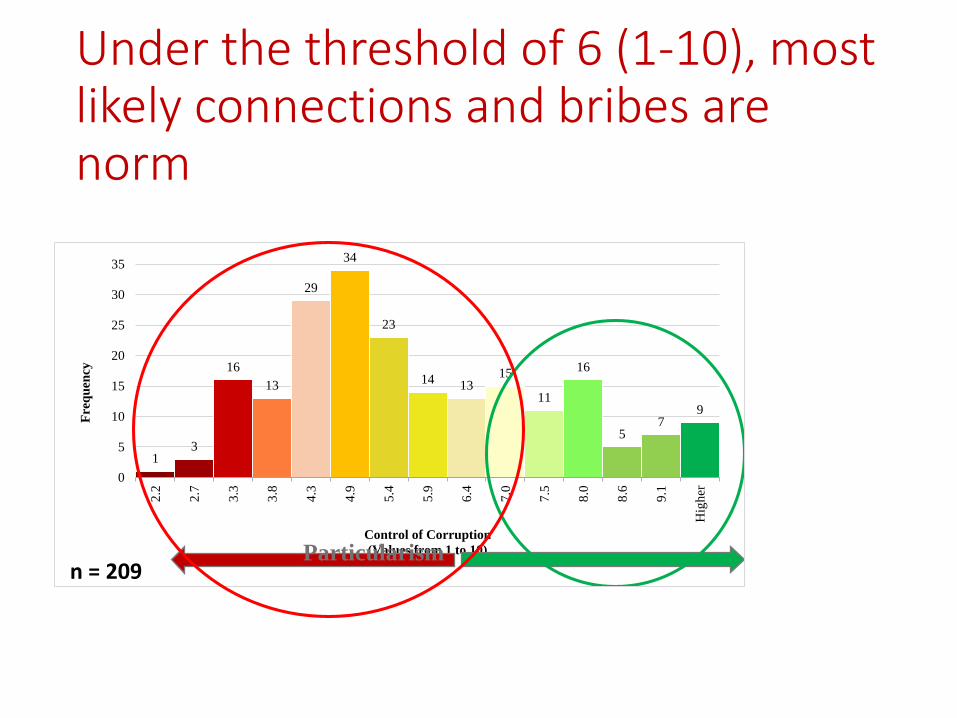
Control of corruption is the capacity of a society to prevent ruling elites from channelling social allocation on the basis of particular interests, rather than market (price) or citizenship (equal treatment)
Where is it safe to trade? www.integrity-index.org
Under the threshold of 6 (1-10), most likely connections and bribes are norm
13
16
13
29
34
23
1413
15
11
16
57
9
0
5
10
15
20
25
30
35
2.2
2.7
3.3
3.8
4.3
4.9
5.4
5.9
6.4
7.0
7.5
8.0
8.6
9.1
Hig
her
Fre
qu
ency
Control of Corruption
(Values from 1 to 10)
n = 209Particularism
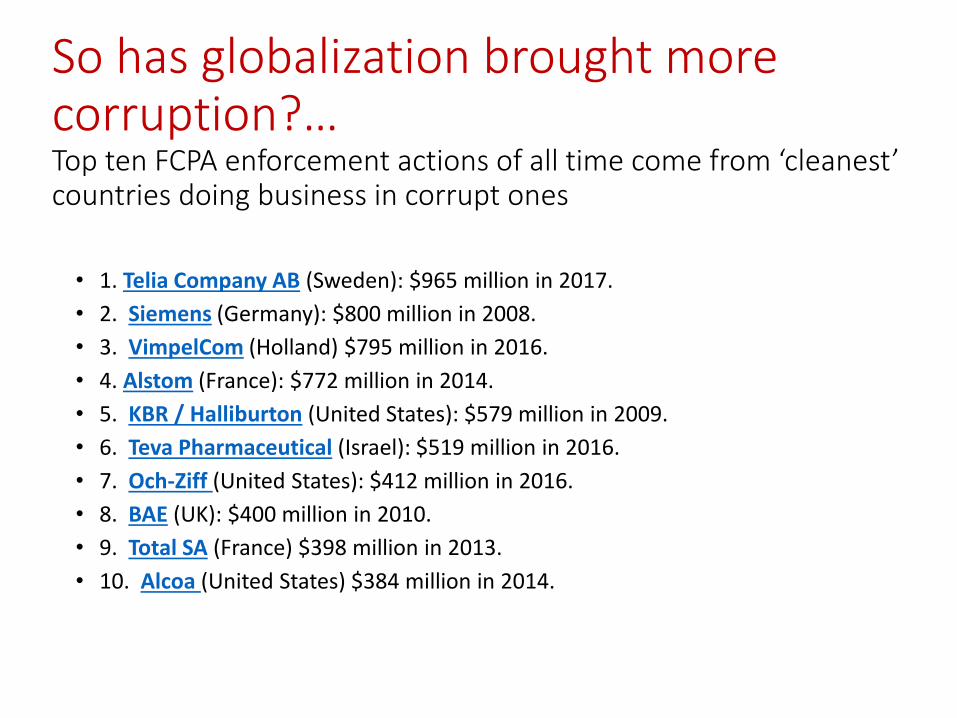
So has globalization brought more corruption?…Top ten FCPA enforcement actions of all time come from ‘cleanest’ countries doing business in corrupt ones
• 1. Telia Company AB (Sweden): $965 million in 2017.
• 2. Siemens (Germany): $800 million in 2008.
• 3. VimpelCom (Holland) $795 million in 2016.
• 4. Alstom (France): $772 million in 2014.
• 5. KBR / Halliburton (United States): $579 million in 2009.
• 6. Teva Pharmaceutical (Israel): $519 million in 2016.
• 7. Och-Ziff (United States): $412 million in 2016.
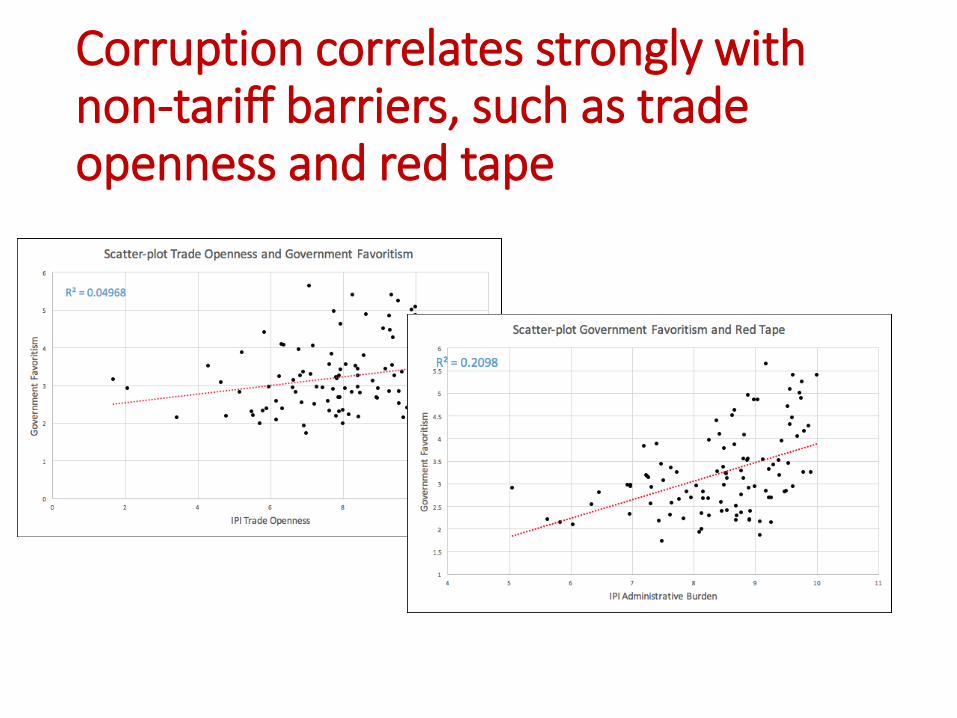
➢ KOF globalization index negatively correlated with corruption in time series ➢ Corruption correlated strongly and positively with tariff and non-tariff barriers,
such as trade openness, red tape, customs burden (in the figure)
Corruption correlates strongly with non-tariff barriers, such as trade openness and red tape
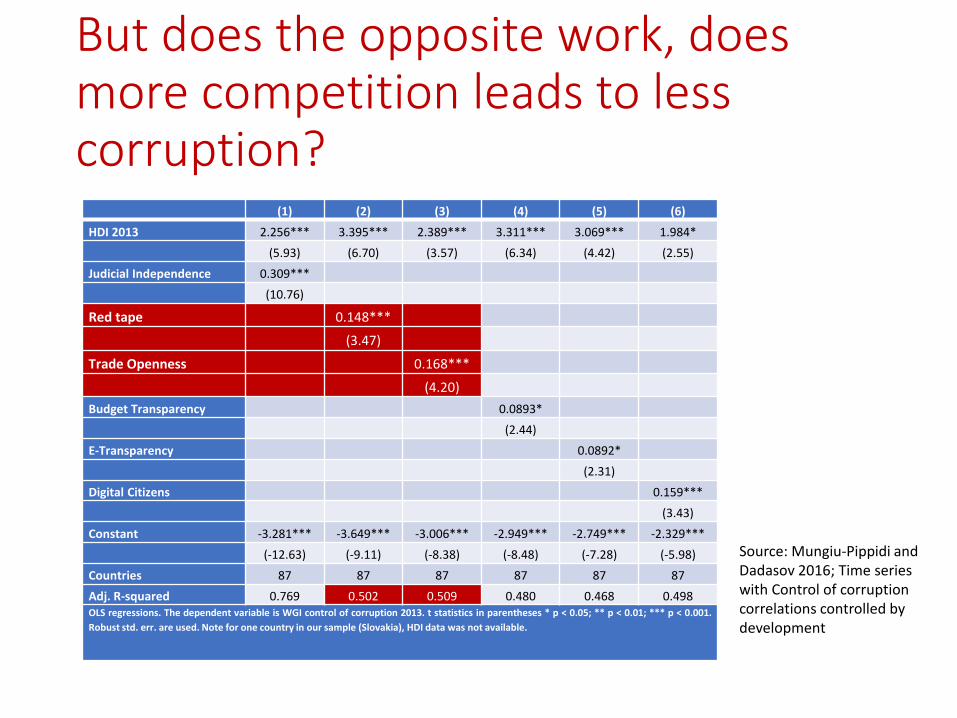
But does the opposite work, does more competition leads to less corruption?
Source: Mungiu-Pippidi and Dadasov 2016; Time series with Control of corruption correlations controlled by development
Adj. R-squared 0.769 0.502 0.509 0.480 0.468 0.498 OLS regressions. The dependent variable is WGI control of corruption 2013. t statistics in parentheses * p < 0.05; ** p < 0.01; *** p < 0.001.
Robust std. err. are used. Note for one country in our sample (Slovakia), HDI data was not available.
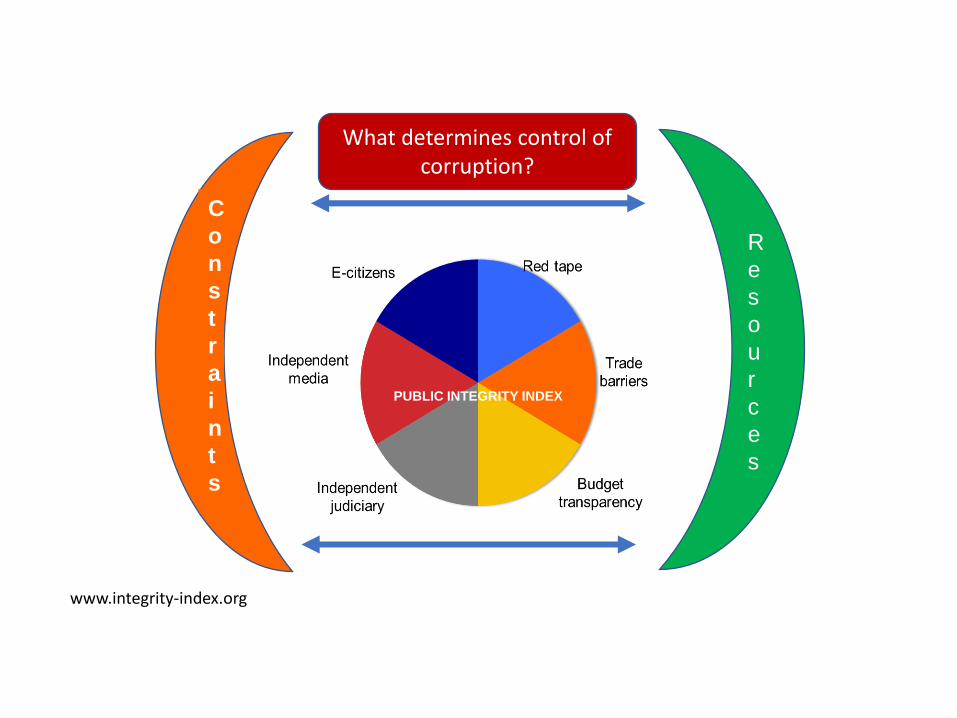
PUBLIC INTEGRITY INDEX
R
e
s
o
u
r
c
e
s
C
o
n
s
t
r
a
i
n
t
s
What determines control of corruption?
www.integrity-index.org
Transparency helps trade inflows, and indirectly corruptionPositive empirical relationship between transparency
obligations and the level of trade- each provision in an RTAs is estimated to increase by bilateral trade exceeding 1%
As expected, countries with more democratic institutions and those with higher levels of governance are more likely to include comprehensive coverage of transparency commitments, such as a full-fledged transparency chapter in the RTA.
Gains from improving transparency in APEC are substantial relative to other reform options: at least $148 billion or 7.5% of baseline 2004 trade in APEC.
Sources: Lejárraga, I. and B. Shepherd (2013), “Quantitative Evidence on Transparency in Regional Trade Agreements”, OECD; Helble, M., Shepherd, B., & Wilson, J. S. (2007). Transparency & Trade Facilitation in the Asia Pacific: Estimating the Gains from Reform. Department of Foreign Affairs and Trade, http://developing-trade.com/wp-content/uploads/2014/11/DTC-Article-Chapter-2007-2.pdf
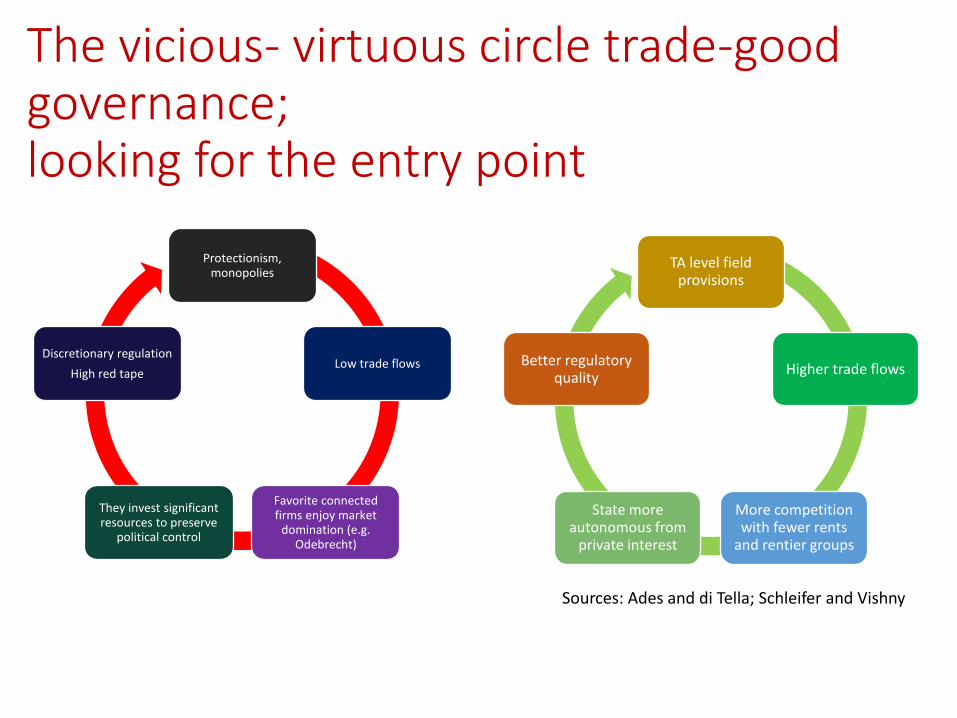
The vicious- virtuous circle trade-good governance; looking for the entry point
Protectionism, monopolies
Low trade flows
Favorite connected firms enjoy market
domination (e.g. Odebrecht)
They invest significant resources to preserve
political control
Discretionary regulation
High red tape
TA level field provisions
Higher trade flows
More competition with fewer rents
and rentier groups
State more autonomous from
private interest
Better regulatory quality
Sources: Ades and di Tella; Schleifer and Vishny
II. What is the practice in regard to free trade agreements and anticorruption provisions ?
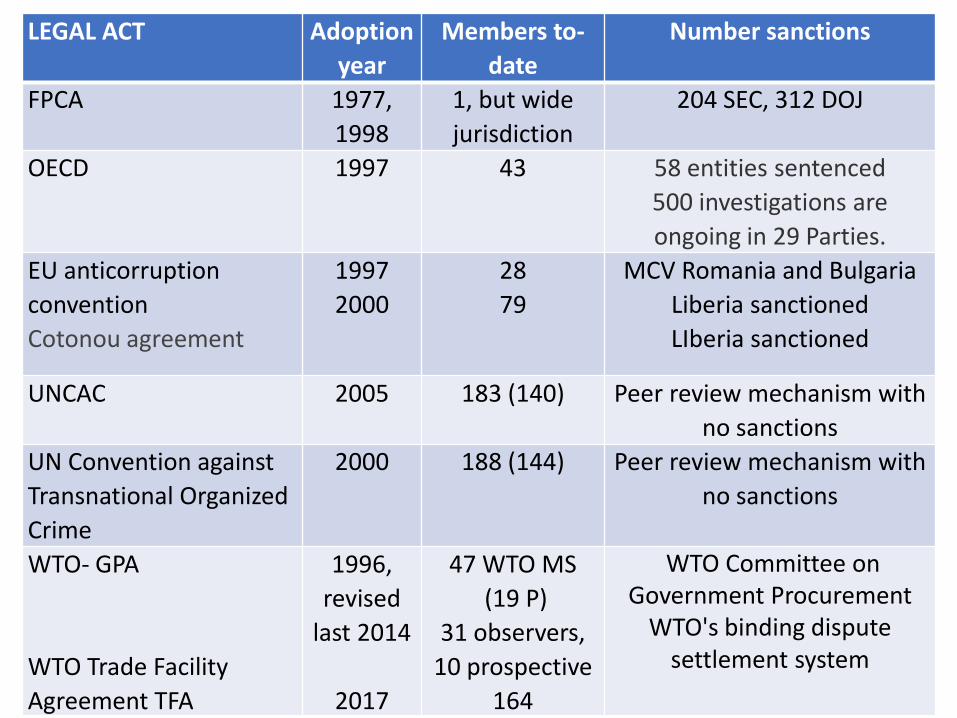
LEGAL ACT Adoption
year
Members to-
date
Number sanctions
FPCA 1977,
1998
1, but wide
jurisdiction
204 SEC, 312 DOJ
OECD 1997 43 58 entities sentenced
500 investigations are
ongoing in 29 Parties.
EU anticorruption
convention
Cotonou agreement
1997
2000
28
79
MCV Romania and Bulgaria
Liberia sanctioned
LIberia sanctioned
UNCAC 2005 183 (140) Peer review mechanism with
no sanctions
UN Convention against
Transnational Organized
Crime
2000 188 (144) Peer review mechanism with
no sanctions
WTO- GPA
WTO Trade Facility
Agreement TFA
1996,
revised
last 2014
2017
47 WTO MS
(19 P)
31 observers,
10 prospective
164
WTO Committee on Government Procurement
WTO's binding dispute settlement system
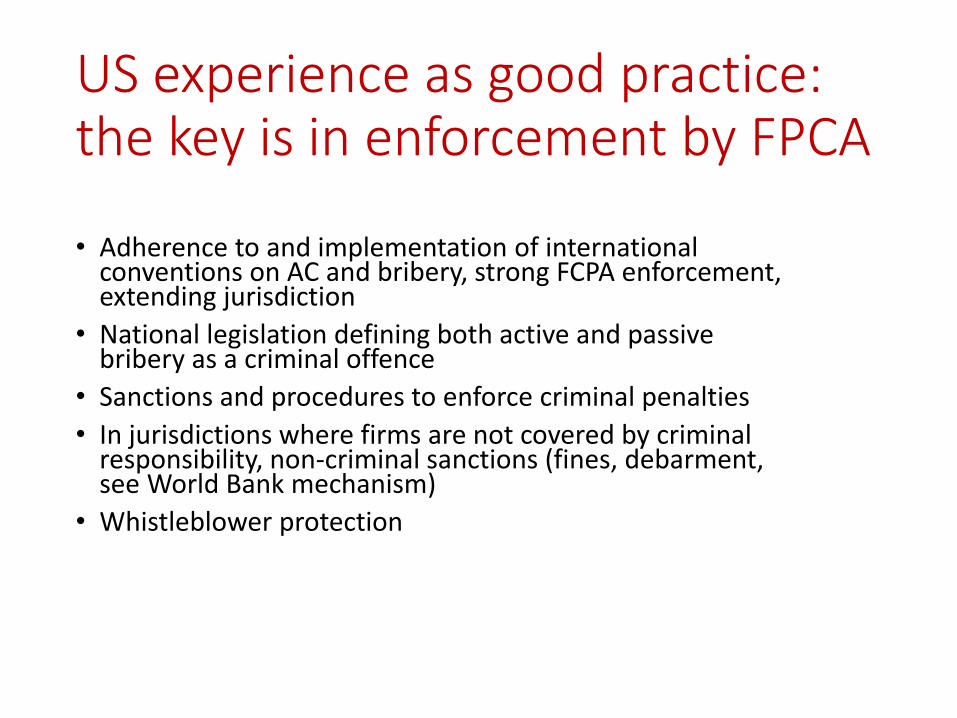
US experience as good practice: the key is in enforcement by FPCA
• Adherence to and implementation of international conventions on AC and bribery, strong FCPA enforcement, extending jurisdiction
• National legislation defining both active and passive bribery as a criminal offence
• Sanctions and procedures to enforce criminal penalties
• In jurisdictions where firms are not covered by criminal responsibility, non-criminal sanctions (fines, debarment, see World Bank mechanism)
• Whistleblower protection
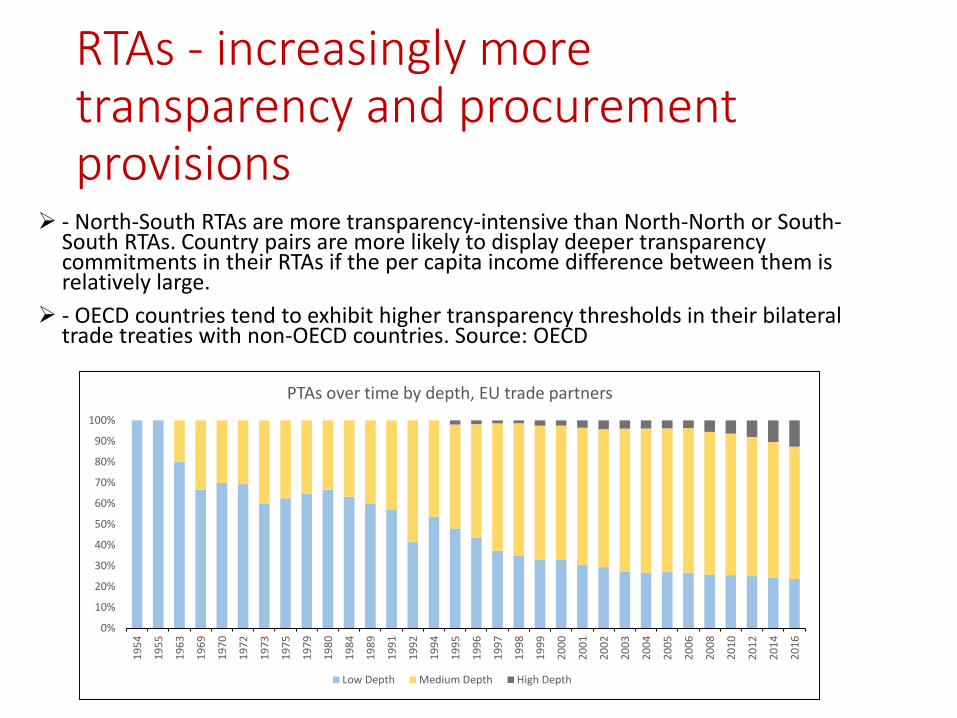
RTAs - increasingly more transparency and procurement provisions
➢ - North-South RTAs are more transparency-intensive than North-North or South-South RTAs. Country pairs are more likely to display deeper transparency commitments in their RTAs if the per capita income difference between them is relatively large.
➢ - OECD countries tend to exhibit higher transparency thresholds in their bilateral trade treaties with non-OECD countries. Source: OECD
0%
10%
20%
30%
40%
50%
60%
70%
80%
90%
100%
19
54
19
55
19
63
19
69
19
70
19
72
19
73
19
75
19
79
19
80
19
84
19
89
19
91
19
92
19
94
19
95
19
96
19
97
19
98
19
99
20
00
20
01
20
02
20
03
20
04
20
05
20
06
20
08
20
10
20
12
20
14
20
16
PTAs over time by depth, EU trade partners
Low Depth Medium Depth High Depth
III. How have the current international and European policies on transparency and anticorruption performed so far and how can we help one another?
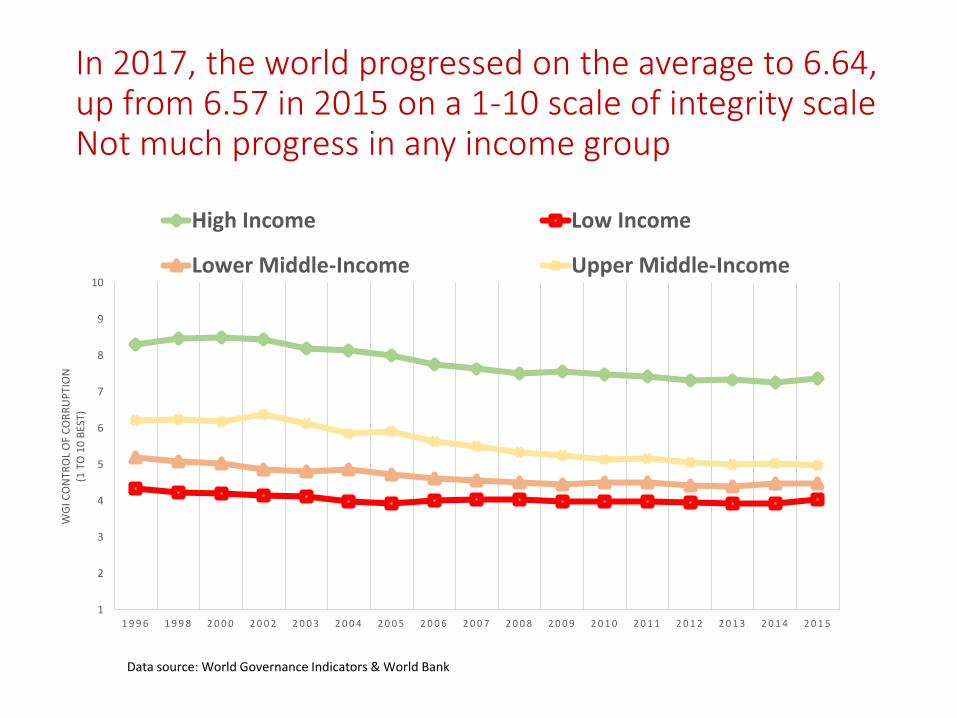
In 2017, the world progressed on the average to 6.64, up from 6.57 in 2015 on a 1-10 scale of integrity scaleNot much progress in any income group
Material resources (aid without good governance conditions, bribing across borders, tec)
The international factors adds constraints, but also resources to corruption
A smart strategy would cut both
OPTIONS
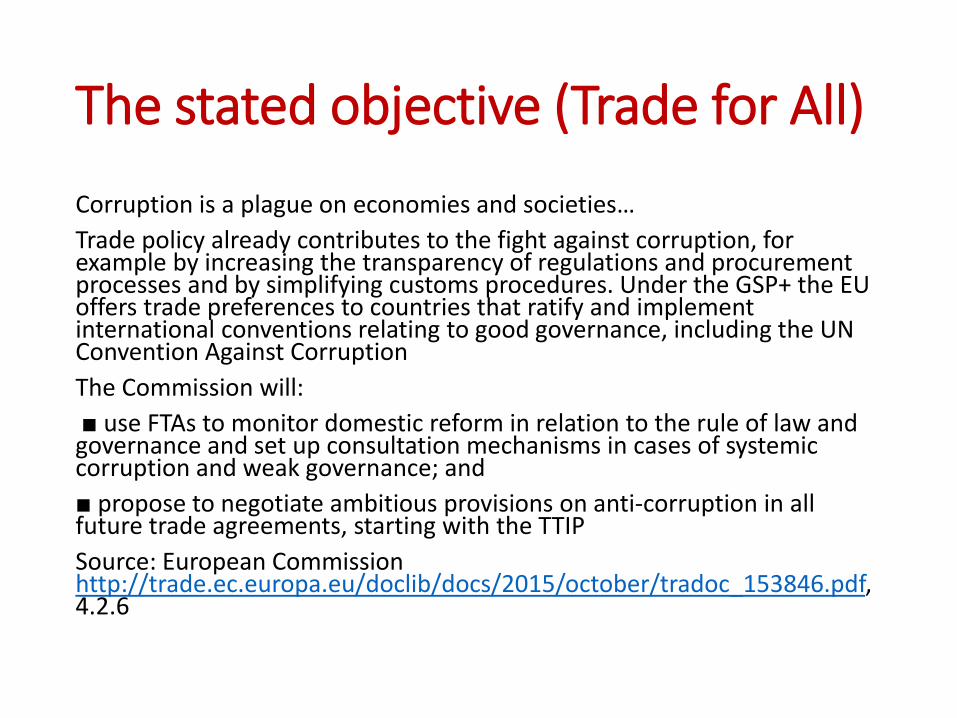
The stated objective (Trade for All)
Corruption is a plague on economies and societies…
Trade policy already contributes to the fight against corruption, for example by increasing the transparency of regulations and procurement processes and by simplifying customs procedures. Under the GSP+ the EU offers trade preferences to countries that ratify and implement international conventions relating to good governance, including the UN Convention Against Corruption
The Commission will:
■ use FTAs to monitor domestic reform in relation to the rule of law and governance and set up consultation mechanisms in cases of systemic corruption and weak governance; and
■ propose to negotiate ambitious provisions on anti-corruption in all future trade agreements, starting with the TTIP
Source: European Commission http://trade.ec.europa.eu/doclib/docs/2015/october/tradoc_153846.pdf, 4.2.6
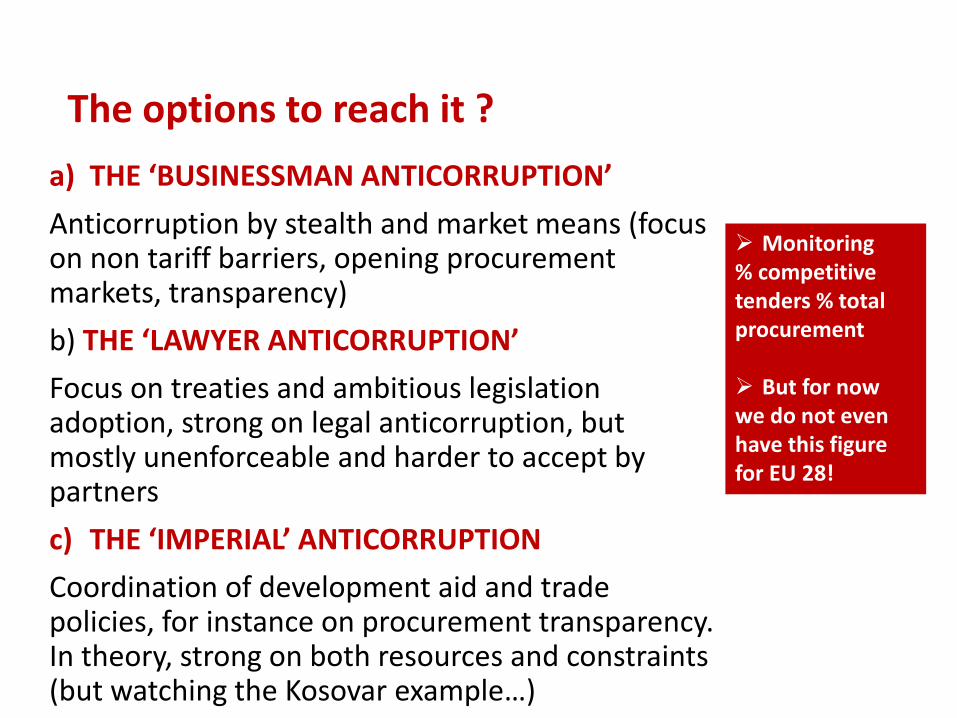
Anticorruption by stealth and market means (focus on non tariff barriers, opening procurement markets, transparency)
b) THE ‘LAWYER ANTICORRUPTION’
Focus on treaties and ambitious legislation adoption, strong on legal anticorruption, but mostly unenforceable and harder to accept by partners
c) THE ‘IMPERIAL’ ANTICORRUPTION
Coordination of development aid and trade policies, for instance on procurement transparency. In theory, strong on both resources and constraints (but watching the Kosovar example…)
➢ Monitoring% competitive tenders % total procurement
➢ But for now we do not even have this figure for EU 28!