N A S A T E C H N I CA L N O T E (^^^^^| NASA TN D-4958 0 Q^^- 5 "T >-^^ g 0-1 ^S | <t LOAN COPY: RETURN TO AFWL fWLIL-2) K1RTLAND AFB, N MEX FOULING CHARACTERISTICS OF ASTM JET A FUEL WHEN HEATED TO 700 F IN A SIMULATED HEAT EXCHANGER TUBE by James J. Watt, Albert Evans, Jr., and Robert R. Hibbard Lewis Research Center ^ TT^ "v’^ Cleveland, Ohio ^ ’.’<! ’’ ^ &- NATIONAL AERONAUTICS AND SPACE ADMINISTRATION WASHINGTON, D. C. DECEMBER 1968 ,;- ’^ < NASA TECHNICAL NOTE NASA TN D-4958 I <C v-, <C :z LOAN COPY: RETURN TO AFWl (WUL-2) KIRTLAND AFB. N MEX FOULING CHARACTERISTICS OF ASTM JET A FUEL WHEN HEATED TO 700 0 F IN A SIMULATED HEAT EXCHANGER TUBE by James J. Watt, Albert Evans, Jr., and Robert R. Hibbard Lewis Research Center Cleveland, Ohio ." .. N AT ION A l A E RON AUT I (S AND SPA CE ADM I N 1ST RAT ION • WAS H I N G TON I D. C. • DEC E M B E R 19 68,/" , , ... https://ntrs.nasa.gov/search.jsp?R=19690003500 2020-06-03T18:51:23+00:00Z
Transcript
N ASA T ECH N I CA L N OT E (^^^^^| NASA TN D-4958
0 Q^^- 5"T >-^^ g
0-1 ^S |<t
LOAN COPY: RETURN TOAFWL fWLIL-2)
K1RTLAND AFB, N MEX
FOULING CHARACTERISTICS OFASTM JET A FUEL WHEN HEATEDTO 700 F IN A SIMULATEDHEAT EXCHANGER TUBE
by James J. Watt, Albert Evans, Jr., and Robert R. Hibbard
Lewis Research Center ^ TT^"v’^
Cleveland, Ohio^’.’<!
’’ &̂-
NATIONAL AERONAUTICS AND SPACE ADMINISTRATION WASHINGTON, D. C. DECEMBER 1968 ,;-
’^
<
NASA TECHNICAL NOTE NASA TN D-4958
~. I
<C v-, <C :z
LOAN COPY: RETURN TO AFWl (WUL-2)
KIRTLAND AFB. N MEX
FOULING CHARACTERISTICS OF ASTM JET A FUEL WHEN HEATED TO 7000 F IN A SIMULATED HEAT EXCHANGER TUBE
by James J. Watt, Albert Evans, Jr., and Robert R. Hibbard
Lewis Research Center
Cleveland, Ohio
--~'!""'" ",,¥-.~.~' ." ..
N AT ION A l A E RON AUT I (S AND SPA CE ADM I N 1ST RAT ION • WAS H I N G TON I D. C. • DEC E M B E R 19 68,/"
FOULING CHARACTERISTICS OF ASTM JET A FUEL WHEN HEATED TO
7000 F IN A SIMULATED HEAT EXC HANGER TUBE
By James J. Watt, Albert Evans, Jr., and Robert R. Hibbard
Lewis Research Center Cleveland, Ohio
NATIONAL AERONAUTICS AND SPACE ADMINISTRATION
For sale by the Clearinghouse for Federal Scientific and Technical Information Springfield, Virginia 22151 - CFSTI price $3.00
ABSTRACT
Supersonic aircraft might profitably utilize the greater heat sink that would be madeavailable if fuels could be heated to higher temperatures than is current practice.
Therefore, three ASTM Jet A fuels were heated to 700 F (644 K) under simulated heat
exchanger conditions. Tests were made with air-saturated and deoxygenated fuels atpressures ranging from 2. 5 to 615 psia (1. 72x10 to 424xl04 N/m2 abs) for periods of
20 hours, and the amounts of tube surface fouling were determined. Very small amountsof solids collected on the surface in all cases; the accumulated solids represented from
0.05 to 2. 5 ppm of the fuel. The deposits decreased markedly when the dissolved
oxygen was removed from the fuel and, in general, decreased with increasing pressure.
ii
ABSTRACT
Supersonic aircraft might profitably utilize the greater heat sink that would be made available if fuels could be heated to higher temperatures than is current practice.
Therefore, three ASTM Jet A fuels were heated to 7000 F (644 K) under simulated heat
exchanger conditions. Tests were made with air-saturated and deoxygenated fuels at
pressures ranging from 2.5 to 615 psia (1. 72X104 to 424x104 N/m2 abs) for periods of
20 hours, and the amounts of tube surface fouling were determined. Very small amounts
of solids collected on the surface in all cases; the accumulated solids represented from
0.05 to 2.5 ppm of the fuel. The deposits decreased markedly when the dissolved
oxygen was removed from the fuel and, in general, decreased with increasing pressure.
ii
FOULING CHARACTERISTICS OF ASTM JET A FUEL WHEN HEATED TO
700 F IN A SIMULATED HEAT EXCHANGER TUBE
by James J. Watt, Albert Evans, Jr. and Robert R. Hibbard
Lewis Research Center
SUMMARY
Operating economies may be realized in supersonic aircraft if the heat sink of the
fuel can be utilized to cool the engines and the airframe. Tests were performed to deter-
mine if there were combinations of conditions whereby ASTM Jet A fuel could be heated
to 700 F (644 K) without heat exchanger performance loss due to fuel deposits. In these
tests an air-to-fuel heat exchanger was simulated by a 5/32-inch- (0. 397-cm-) diameter
Nichrome V tube 54 inches (1. 37 m) long, heated electrically (9000 Btu/(hr)(ft2) or0
2840 W/m ). Flow rate, pressure, and fuel outlet temperature were held constant for
20 hours or until 60 pounds (27. 3 kg) of fuel had passed through the tube.
The oxygen content of the fuel was established at either 0. 3 or 45 parts per million
(minimum and air-saturated conditions). Test pressures ranged from 2. 5 to 615 psia
(1. 72X104 to 424X104 N/m2 abs). The three batches of fuel used were all within ASTM
specification limits for Jet A fuel but were further classified as "good", "poor", and
"poorest" from a thermal stability standpoint.
Deposit accumulation was determined by cutting the tube into 1- or 2-inch (2. 54- or
5. 08-cm) lengths and analyzing the carbon in each length by a combustion technique.
Deposits tended to form local accumulations or peaks rather than uniform coatings. The
poorer two fuels formed deposits at two local areas when oxygen saturated. With mini-
mum oxygen, the peak associated with a lower wall temperature disappeared. Total
deposit accumulation was always significantly lower for tests with minimum oxygen.4 9
Increasing fuel pressure from atmospheric to 315 psia (217x10 N/m abs) caused
total and local deposit accumulations to decrease and peaks to occur at higher temper-4 2atures. No improvement was indicated above 315 psia (217x10 N/m abs).
The deposit measuring technique presented herein should prove of value in future
fuel fouling research. It also suggests a method for cleaning fuel heat exchangers.
FOULING CHARACTERISTICS OF ASTM JET A FUEL WHEN HEATED TO
7000 F IN A SIMULATED HEAT EXCHANGER TUBE
by James J. Watt, Albert Evans, Jr., and Robert R. Hibbard
Lewis Research Center
SUMMARY
Operating economies may be realized in supersonic aircraft if the heat sink of the
fuel can be utilized to cool the engines and the airframe. Tests were performed to deter
mine if there were combinations of conditions whereby ASTM Jet A fuel could be heated
to 7000 F (644 K) without heat exchanger performance loss due to fuel deposits. In these
tests an air-to-fuel heat exchanger was simulated by a 5/32-inch- (0. 397-cm-) diameter
Nichrome V tube 54 inches (1. 37 m) long, heated electrically (9000 Btu/(hr)(ft~) or
2840 W/m2). Flow rate, pressure, and fuel outlet temperature were held constant for
20 hours or until 60 pounds (27.3 kg) of fuel had passed through the tube.
The oxygen content of the fuel was established at either 0.3 or 45 parts per million
(minimum and air-saturated conditions). Test pressures ranged from 2.5 to 615 psia
(1. 72X104 to 424X104 N/m2 abs). The three batches of fuel used were all within ASTM
specification limits for Jet A fuel but were further classified as "good", "poor", and
"poorest" from a thermal stability standpoint.
Deposit accumulation was determined by cutting the tube into 1- or 2-inch (2.54- or
5. 08-cm) lengths and analyzing the carbon in each length by a combustion technique.
Deposits tended to form local accumulations or peaks rather than uniform coatings. The
poorer two fuels formed deposits at two local areas when oxygen saturated. With minimum oxygen, the peak associated with a lower wall temperature disappeared. Total deposit accumulation was always significantly lower for tests with minimum oxygen.
Increasing fuel pressure from atmospheriC to 315 psia (217X104 N/m2 abs) caused
total and local deposit accumulations to decrease and peaks to occur at higher temper
atures. No improvement was indicated above 315 psia (217X104 N/m2 abs).
The deposit measuring technique presented herein should prove of value in future
fuel fouling research. It also suggests a method for cleaning fuel heat exchangers.
1111 11111 11111 111 III -,
INTRODUCTION
Almost all engine cycles require some cooling. A convenient sink for this heat
is the fuel. When kerosene-type fuels are heated, small amounts of solids mayform. These solids can foul heat exchanger surfaces, clog filters and fuel injectors,
and cause controls to stick. The thermal instability problems associated with these
fuels are probably due to the presence of very small amounts of nonhydrocarbon
impurities in the fuel. Pure hydrocarbons are not degraded at fuel temperatures in
current aircraft.
Fuels for commercial and military subsonic operations are stable to at least 300 F(422 K). The commercial fuels (Jet A, Jet A-l, and Jet B) must pass a 300 F (422 K)preheater outlet test (ASTM specification D-1655-63T), and the military fuels JP-4 and
JP-5 must pass the same test per Military Specification J-5624F. The fuels are aerated
(air-saturated) before the thermal stability tests are performed.
The Coordinating Research Council, under Federal Aviation Agency contract, studied
the fuel thermal stability problems of a Mach 3. 0 supersonic transport (SST) (refs. 1
and 2). Partly as a result of these studies the heat load to the fuel was reduced. The
flight speed was reduced to Mach 2. 7 and the maximum temperature of the jet fuel kept
below 350 F (450 K) to assure satisfactory operation of the aircraft.
Fuels are exposed to higher temperatures in advanced military aircraft. The Air
Force has specified JP-6 for this use, and it must pass a preheater outlet temperaturetest of at least 425 F (491 K) without excessive fouling (Military Specification J-25656B).This fuel is refined to reduce impurities, and as a consequence it is more expensive than
the commercial grades. Fuel cost is an important consideration in commercial aircraft
especially in a supersonic transport where fuel costs are now expected to be about one-
half of total operating costs.
Increasing the heat sink capacity of commercial fuel would provide additional waysto increase engine efficiency and reduce specific fuel consumption. More efficient
engine- cycles can use greater cooling, especially when the turbine inlet temperatureexceeds material limits, thereby requiring cooling of hot end components, such as the
turbine, using compressor bleed air. For supersonic or subsonic aircraft with high
compressor pressure ratios, the compressor bleed air becomes so hot that air require-
ments for cooling may become excessive. Additional fuel heat sink capacity to reduce
cooling air temperature and flow requirements would be beneficial.
Several approaches have been considered to increase the heat sink capacity of the
fuel. These schemes have ranged from precooling kerosene-type fuels to the use of
cryogenic fuels, such as liauid hydrogen or liquified natural gas (ref. 3). Although these
schemes have merit, there are strong logistic and economic arguments for further
2
II I 111111111111111111111111111111 ••• 111111111111111111111111111111111111111111111
INTRODUCTION
Almost all engine cycles require some cooling. A convenient sink for this heat
is the fuel. When kerosene-type fuels are heated, small amounts of solids may
form. These solids can foul heat exchanger surfaces, clog filters and fuel injectors, and cause controls to stick. The thermal instability problems associated with these
fuels are probably due to the presence of very small amounts of nonhydrocarbon impurities in the fuel. Pure hydrocarbons are not degraded at fuel temperatures in
current aircraft.
Fuels for commerci~l and military subsonic operations are stable to at least 3000 F (422 K). The commercial fuels (Jet A, Jet A-1, and Jet B) must pass a 3000 F (422 K)
preheater outlet test (ASTM specification D-1655-63T), and the military fuels JP-4 and
JP-5 must pass the same test per Military Specification J-5624F. The fuels are aerated (air-saturated) before the thermal stability tests are performed.
The Coordinating Research Council, under Federal Aviation Agency contract, studied
the fuel thermal stability problems of a Mach 3.0 supersonic transport (SST) (refs. 1
and 2). Partly as a result of these studies the heat load to the fuel was reduced. The
flight speed was reduced to Mach 2.7 and the maximum temperature of the jet fuel kept
below 3500 F (450 K) to assure satisfactory operation of the aircraft.
Fuels are exposed to higher temperatures in advanced military aircraft. The Air
Force has specified JP-6 for this use, and it must pass a preheater outlet temperature
test of at least 4250 F (491 K) without excessive fouling (Military SpeCification J-25656B).
This fuel is refined to reduce impurities, and as a consequence it is more expensive than
the commercial grades. Fuel cost is an important consideration in commercial aircraft
especially in a supersonic transport where fuel costs are now expected to be about one
half of total operating costs.
Increasing the heat sink capacity of commercial fuel would provide additional ways
to increase engine efficiency and reduce speCific fuel c0l,lsumption. More efficient
engin~ cycles can use greater cooling, especially when the turbine inlet temperature
exceeds material limits, thereby requiring cooling of hot end components, such as the
turbine, using compressor bleed air. For supersonic or subsonic aircraft with high compressor pressure ratios, the compressor bleed air becomes so hot that air require
ments for cooling may become excessive. Additional fuel heat sink capaCity to reduce
cooling air temperature and flow requirements would be beneficial. Several approaches have been considered to increase the heat sink capacity of the
fuel. These schemes have ranged from precooling kerosene-type fuels to the use of
cryogenic fuels, such as liauid hydrogen or liquified natural gas (ref. 3). Although these
schemes have merit, there are strong logistic and economic arguments for further
utilization of the heat sink capacity of commercial fuel if means of avoiding the thermal
stability problems can be found.
The currently available heat sink capacity for Jet A fuel is about 120 Btu per pound
(280X103 J/kg) when the fuel is heated from 75 to 300 F (297 to 422 K). If the fuel were
heated to 700 F (644 K), the heat absorbed would increase to 400 to 475 Btu per poundQ 0
(930x10 to 1110x10 J/kg) depending on the amount of vaporization. The amount of vapor-
ization is dependent on the fuel system pressure. However, the fact remains that from
three to four times more heat sink capacity is available at 700 F (644 K) than at 300 F
(422 K).During studies and literature surveys it was determined that there was potential for
increasing the useful heat sink capacity of commercial fuel. There were several indica-
tions in the literature that deoxygenated fuel had a reduced tendency for fouling (e. g.
refs. 4 and 5). Methods of minimizing oxygen content while handling large quantities of
fuel were demonstrated during the B-70 program (ref. 6). The potential for reaching
significantly higher temperatures with kerosene fuels, at least for short periods of time,
has been indicated in references 7 and 8. There was also a strong interest at Lewis as
to whether pressure has an effect on fuel fouling.
The influence of two variables, oxygen content and fuel pressure level, were investi-
gated in the experiments conducted at the Lewis Research Center and reported herein.
A series of tests was performed using resistance-heated Nichrome V tubes to simulate
fuel passages of an aircraft heat exchanger. The fuels were heated from 70 to 700 F
(294 to 644 K). The wall- to fuel-temperature difference ranged from 100 to 300 F
(56 to 168 K). Tests were run on three batches of fuel which meet ASTM Jet A specifi-
cations. Pressures during the various tests ranged from 2. 5 to 615 psia (1. 72x10 to4 2424x10 N/m abs). The flow was laminar near the entrance with Reynolds number near
100. The exit Reynolds number ranged to 25 000 depending upon the fluid pressure.
Fuels were tested in both the air-saturated and the deoxygenated state. After testing, the
deposits along the length of the tubes were determined by a combustion technique. The
effects of these deposits on heat exchanger performance and overhaul times are discussed.
APPARATUS AND PROCEDURE
Fuels
Inspection information on the three batches of fuel tested is listed in table I. Two
drums of the fuel designated as LeRC 67-1 were obtained directly from a pipeline to the
Cleveland Hopkins Airport. This fuel had high thermal stability, as shown in table I.
Four drums of the fuel designated as LeRC 67-2 were taken at one time from a 25 000-
gallon (94. 6-m tank at Lewis. As the tank is periodically refilled but seldom emptied,
3
utilization of the heat sink capacity of commercial fuel if means of avoiding the thermal
stability problems can be found.
The currently available heat sink capacity for Jet A fuel is about 120 Btu per pound
(280X103 J/kg) when the fuel is heated from 750 to 3000 F (297 to 422 K). If the fuel were
heated to 7000 F (644 K), the heat absorbed would increase to 400 to 475 Btu per pound
(930X103 to 1110X103 J/kg) depending on the amount of vaporization. The amount of vapor
ization i.s dependent on the fuel system pressure. However, the fact remains that from
three to four times more heat sink capacity is available at 7000 F (644 K) than at 3000 F
(422 K).
During studies and literature surveys it was determined that there was potential for
increasing the useful heat sink capacity of commercial fuel. There were several indica
tions in the literature that deoxygenated fuel had a reduced tendency for fouling (e. g. ,
refs. 4 and 5). Methods of minimizing oxygen conte.nt while handling large quantities of
fuel were demonstrated during the B-70 program (ref. 6). The potential for reaching
significantly higher temperatures with kerosene fuels, at least for short periods of time,
has been indicated in references 7 and 8. There was also a strong interest at Lewis as
to whether pressure has an effect on fuel fouling.
The influence of two variables, oxygen content and fuel pressure level, were investi
gated in the experiments conducted at the Lewis Research Center and reported herein.
A series of tests was performed using resistance-heated Nichrome V tubes to simulate
fuel passages of an aircraft heat exchanger. The fuels were heated from 700 to 7000 F
(294 to 644 K). The wall- to fuel-temperature difference ranged from 1000 to 3000 F
(56 to 168 K). Tests were run on three batches of fuel which meet ASTM Jet A specifi
cations. Pressures during the various tests ranged from 2.5 to 615 psia (1. 72x104 to
424x104 N/m2 abs). The flow was laminar near the entrance with Reynolds number near
100. The exit Reynolds number ranged to 25 000 depending upon the fluid pressure.
Fuels were tested in both the air-saturated and the deoxygenated state. Mter testing, the
deposits along the length of the tubes were determined by a combustion technique. The
effects of these deposits on heat exchanger performance and overhaul times are discussed.
APPARATUS AND PROCEDURE
Fuels
Inspection information on the three batches of fuel tested is listed in table 1. Two
drums of the fuel designated as LeRC 67-1 were obtained directly from a pipeline to the
Cleveland Hopkins Airport. This fuel had high thermal stability, as shown in table 1.
Four drums of the fuel designated as LeRC 67-2 were taken at one time from a 25 000-
gallon (94. 6_m 3) tank at Lewis. As the tank is periodically refilled but seldom emptied,
this batch might be considered to be typical of a mixture of many shipments. The batch
designated as RAF 178-64 was obtained from the Coordinating Research Council fuel banle It was selected because its thermal stability rating was near the minimum; that is, this fuel represents as poor a fuel as could be expected within specification limits.
Dissolved Oxygen
The fuels were either air-saturated by bubbling air through them at 1 atmosphere
for 30 minutes immediately prior to the test or were deoxygenated by a similar treatment
with nitrogen. The oxygen content of the air-saturated fuels was about 45 ppm, while
the oxygen content of the nitrogen-purged fuels was less than 0.3 ppm. The pressurizing
gases used to displace the air-saturated fuels were mixtures of oxygen and nitrogen
prepared to give a O. 21-atmosphere oxygen partial pressure (equivalent to air at 1-
4
atmosphere pressure) in the supply tank ullage. Nitrogen was the driver gas for deoxy-genated fuel tests. A Beckman Model 77700 u oxygen analyser was installed after the
sixth test and showed that there were no measurable changes in the dissolved oxygencontent with changes in system pressure or during the tests.
Test Conditions
Seventeen tests were run at 3. 0 pounds per hour (1. 37 kg/hr) for approximately20 hours or until the total flow was 60 pounds (27. 3 kg). One test at 2. 5 psia (1. 72X104
0
N/m abs) was made at 2.0 pounds per hour (0. 91 kg/hr) for 30 hours. Three batches
of fuel, five pressure levels, and two oxygen contents were run. However, not all pos-sible combinations of these variables were investigated. The runs and test conditions arelisted in table n. The fuel was heated to 700 F (644 K) during each test. The averageheat flux was around 9000 Btu per hour per square foot (2840 W/m2).
Flow System
Fuels were fed through resistance-heated tubes using a gas-pressurized feed tank and
and a back-pressurized receiver, as shown in figure 1. Fuel was discharged from the
pressurized supply tank through a dip tube and passed through a 0. 5-micrometer filter,a flowmeter, a pneumatically operated shutoff valve, and a manually operated throttle
valve before reaching the plenum at the entrance to the heated tube. The inlet plenum
contained an electrically insulated flange. A direct-current voltage was applied at the
inlet of the Nichrome V tube with the exit end grounded. The exit plenum had a settling
chamber for particles not adhering to the surface of the heated passage. A sintered
metal filter collected all particles escaping the exit plenum. The 700 F (644 K) fuel
leaving the filter was condensed and cooled to 60 F (289 K) before it entered the wastefuel tank.
Nichrome V tubing was used in all tests. Two fuels, LeRC 67-1 and LeRC 67-2,were tested in 5/32-inch- (0. 396-cm-) diameter tubing with a 0. 020-inch (0. 0508-cm)wall. Due to a depletion of tubing stock, a third fuel (RAF 178-64) was run in 3/16- by
0. 020-inch (0. 476- by 0. 0508-cm) tubing. Tube lengths were 54 inches (1. 37 m) in all
cases except for the one run made at 2. 5 psia (1. 72x10 N/m abs) where a 60-inch
(1. 524-m) length was used. In this one test, the flow rate was decreased because of exit
Mach number limitations. This reduced the Reynolds number and heat-transfer coeffi-
cients, and therefore required a longer tube.
An over-temperature controller on the tube wall was set to shut off the power if the
wall temperature exceeded a preset value 200 F (111 K) higher than that at the start of
5
atmosphere pressure) in the supply tank ullage. Nitrogen was the driver gas for deoxy
genated fuel tests. A Beckman Model 77700 u oxygen analyser was installed after the
sixth test and showed that there were no measurable changes in the dissolved oxygen
content with changes in system pressure or during the tests.
Test Conditions
Seventeen tests were run at 3.0 pounds per hour (1. 37 kg/hr) for approximately
20 hours or until the total flow was 60 pounds (27.3 kg). One test at 2.5 pSia (1. 72X104
N/m2 abs) was made at 2.0 pounds per hour (0.91 kg/hr) for 30 hours. Three batches
of fuel, five pressure levels, and two oxygen contents were run. However, not all pos
sible combinations of these variables were investigated. The runs and test conditions are
listed in table II. The fuel was heated to 7000 F (644 K) during each test. The average
heat flux was around 9000 Btu per hour per square foot (2840 W /m2).
Flow System
Fuels were fed through resistance-heated tubes using a gas-pressurized feed tank and
and a back-pressurized receiver, as shown in figure 1. Fuel was discharged from the
pressurized supply tank through a dip tube and passed through a O. 5-micrometer filter,
a flowmeter, a pneumatically operated shutoff valve, and a manually operated throttle
valve before reaching the plenum at the entrance to the heated tube. The inlet plenum
contained an electrically insulated flange. A direct-current voltage was applied at the
inlet of the Nichrome V tube with the exit end grounded. The exit plenum had a settling
chamber for particles not adhering to the surface of the heated passage. A sintered
metal filter collected all particles escaping the exit plenum. The 7000 F (644 K) fuel
leaving the filter was condensed and cooled to 600 F (289 K) before it entered the waste
fuel tank. Nichrome V tubing was used in all tests. Two fuels, LeRC 67-1 and LeRC 67-2,
were tested in 5/32-inch- (0. 396-cm-) diameter tubing with a O. 020-inch (0. 0508-cm)
wall. Due to a depletion of tubing stock, a third fuel (RAF 178-64) was run in 3/16- by
O. 020-inch (0.476- by O. 0508-cm) tubing. Tube lengths were 54 inches (1. 37 m) in all cases except for the one run made at 2.5 psia (1. 72X104 N/m2 abs) where a 60-inch
(1. 524-m) length was used. In this one test, the flow rate was decreased because of exit
Mach number limitations. This reduced the Reynolds number and heat-transfer coeffi
cients, and therefore required a longer tube.
An over-temperature controller on the tube wall was set to shut off the power if the
wall temperature exceeded a preset value 2000 F (111 K) higher than -that at the start of
5
iiiiiiiiiiiriiiiiiiiiiiiiiiiin
TABLE n. TEST CONDITIONS
[Common conditions: fuel outlet temperature, 700 F (644 K);
minimum oxygen content, less than 0. 3 ppm; maximum oxy-
gen content, 45 ppm; normal test time of 20 hr at flow
rate of 3. 0 pounds per hour (9.12 kg/hr). Flow rate was
reduced and time increased for run 4 because of exit Mach
[Common conditions: fuel outlet temperature, 7000 F (644 K);
minimum oxygen content, less than 0.3 ppm; maximum oxy
gen content, ""45 ppm; normal test time of 20 hr at flow
rate of ,,"3.0 pounds per hour (9.12 kg/hr). Flow rate was
reduced and time increased for run 4 because of exit Mach
number limitations.]
Fuel J-LeRC 67-1 1
2
3
4
5
6 ---
RAF 178-64 7
8
9
10
11
12
LeRC 67-2 13
14
15
16
17
18 ~~~
- ~-
Pressure J Oxygen
psia
f--
165 165
20
2.5
315
315 ----,-
315
165
165
315
615
615 ~ ~
615
315
165
165
315
615
-~
N/m2 ab s content
--_.
113.5XI0 4 Maximum
113.5
13.75
1. 72
217
217 f---
217xl04
113.5
113.5
217
424
424 --
424XI04
217
113.5
113.5
217
424 ---
Minimum
Minimum
Minimum
Minimum
Maximum
Minimum
Minimum
Maximum
Maximum
Minimum
Maximum
Minimum
Maximum
Maximum
Minimum
Minimum
Maximum
aAll tubes had O. 020-in. (0. 51-em) wall.
Tube Sizeaj outside
diameter,
in. - -----
5/32
j 3/16
j 5/32
j
the run. A time-delay circuit permitted flow to continue for 45 seconds after the power
was shut off to cool the tube. A pneumatically operated valve stopp~d the flow. Also,
for safety reasons, the heated tube and its inlet and exit plenums were enclosed in a
metal box with a clear plastic cover. The box was lined with electrically insulating
material and purged with nitrogen.
Instru mentation
Most flow rates were measured with a variable-area flowmeter calibrated before
and after each run. Accuracy was estimated to be ±2 percent. An orifice was used for
tests at 615 psia (424X104 N/m2 abs).
6
Fuel temperatures were measured with iron-constantan (1C) thermocouples in the
supply tank, in the oxygen content sensor well, and at the inlet and exit plenums. Fromfive to eight 1C thermocouples were also equally spaced along the length of the heatedtube. The thermocouple beads were electrically insulated from the tube wall with mica
flakes. The insulated thermocouple leads were each wrapped around the tube four times
to reduce lead conduction losses. A 150 F (340 K) reference junction oven was utilized,and millivolt values were read from a digital voltmeter.
Fuel pressures at the supply tank, inlet and exit plenums, and waste tank were mea-sured with inexpensive Bourdon-tube-type gages. These gages were calibrated againsta Heise gage by pressurizing the system statically to various levels. Statham differential
pressure transducers were used to measure test-section and exit-filter pressure drop.A Barton differential pressure gage paralleled the test section transducer. Transducer
signals were read on a digital voltmeter. Fuel pressures were established by nitrogen
pressurization of the waste fuel tank. The supply tank pressure was set slightly higherthan that of the waste tank, and flow rate was controlled by a combination of throttling and
pressure difference.
Data
Measurements were taken at 15- or 30-minute intervals, and critical parameterswere plotted as a function of time. The parameters considered were exit fuel temper-
Tube wall temperatures were plotted as a function of length at various times during
each run. The variation in wall temperature with time was then studied for evidence of
a deterioration in heat-transfer coefficient because of deposits.
The tubes were cut into lengths and analyzed for carbon accumulation by a combus-
tion technique. This procedure is described in the appendix. The total carbon weight
measured for each length was then converted into various units including local averagecarbon deposit per unit surface area. A total integrated carbon accumulation for each
test was calculated by assuming a linear variation between measurements. This com-
bustion method provided a very sensitive quantitative measure of the accumulation of
carbon, the predominant element in the fuel deposits.
7
Fuel temperatures were measured with iron-constantan (IC) thermocouples in the
supply tank, in the oxygen content sensor well, and at the inlet and exit plenums. From
five to eight IC thermocouples were also equally spaced along the length of the heated
tube. The thermocouple beads were electrically insulated from the tube wall with mica
flakes. The insulated thermocouple leads were each wrapped around the tube four times
to reduce lead conduction losses. A 1500 F (340 K) reference junction oven was utilized,
and millivolt values were read from a digital voltmeter.
Fuel pressures at the supply tank, inlet and exit plenums, and waste tank were mea
sured with inexpensive Bourdon-tube-type gages. These gages were calibrated against
a Heise gage by pressurizing the system statically to various levels. Statham differential
pressure transducers were used to measure test-section and exit-filter pressure drop.
A Barton differential pressure gage paralleled the test section transducer. Transducer
Signals were read on a digital voltmeter. Fuel pressures were established by nitrogen
pressurization of the waste fuel tank. The supply tank pressure was set slightly higher than that of the waste tank, and flow rate was controlled by a combination of throttling and
pressure difference.
Data
Measurements were taken at 15- or 30-minute intervals, and critical parameters
were plotted as a function of time. The parameters considered were exit fuel temper
Tube wall temperatures were plotted as a function of length at various times during
each run. The variation in wall temperature with time was then studied for evidence of
a deterioration in heat-transfer coefficient because of deposits.
The tubes were cut into lengths and analyzed for carbon accumulation by a combus
tion technique. This procedure is described in the appendix. The total carbon weight
measured for each length was then converted into various units including local average
carbon deposit per unit surface area. A total integrated carbon accumulation for each
test was calculated by assuming a linear variation between measurements. This com
bustion method provided a very sensitive quantitative measure of the accumulation of
carbon, the predominant element in the fuel deposits.
7
RESULTS
Effect of Oxygen Content and Pressure on Local Deposit
The principal quantitative measurements made were the amount of carbon (a measureof deposits) and its distribution along the length of the heated tubes. Carbon was directlymeasured as a function of position along the tube; these deposits varied with pressure,oxygen content, and fuel. The same amount of fuel (60 Ib or 27.2 kg) was used in all testsso the results could be directly compared.
The most thermally stable fuel investigated was LeRC 67-1. This fuel was run
deoxygenated at 2. 5, 20, 165, and 315 psia (1. 72xl04, 13. 75X104, 113. 5xl04, and
217X104 N/m2 abs) and air-saturated at 165 and 315 psia (113. 5xl04 and 217xl04 N/m2abs). The distribution of carbon along the tubes run with this fuel is shown in figure 2(a)where carbon deposits per unit area are plotted against tube length. In all six runs therewas a clearly defined maximum of the adhering deposits in one portion of the tube. These
maximums were not on the hottest surface (tube outlet) but formed at varying distances
upstream of the tube outlet.
The degrading effect of dissolved oxygen is very clearly shown at both 165 and 315
psia (113. 5xl04 and 217xl04 N/m abs) where the air-saturated fuel (solid lines in
fig. 2(a)) laid down from 3 to 10 times more deposits in the region of maximum buildup
than did the deoxygenated fuel (dashed lines).With deoxygenated fuel, increasing the pressure from 2. 5 to 20 psia (1. 72x10 to
13. 75x10 N/m abs) resulted in increased deposits. However, further increases in
pressure to 165 and 315 psia (113. 5xl04 and 217xl04 N/m2 abs) very greatly reduced the4 2amounts of deposits to a level well below that obtained at 2. 5 psia (1. 72x10 N/m abs).
An opposite effect of pressure was noted with the air-saturated fuels. About twice the
peak deposits were observed at 315 psia (217xl04 N/m2 abs) than at 165 psia (113. 5xl04N/m2 abs).
The results from tests on the somewhat less stable fuel LeRC 67-2 are shown in
figure 2(b) for runs at 165, 315, and 615 psia (113. 5xl04, 217xl04, and 424X104 N/m2abs), respectively. This fuel was not run at 2. 5 and 20 psia (1. 72xl04 and 13. 75xl04
0
N/m abs) since there is little practical interest in systems running at such pressures,and particularly since no advantage was noted for low pressures with LeRC 67-1.
Instead, runs were made at 615 psia (424X10 N/m abs) which more nearly corresponds
with current practice; it is also a pressure that is greater than the critical pressure of
the fuel (315 psia or 217xl0 N/m abs). It can be seen that the general level of deposits
was higher with LeRC 67-2 than with LeRC 67-1 for all tests made under the same con-
ditions4 9
Again the degrading effect of oxygen is clearly evident. At 315 psia (217xl0 N/m
8
RESULTS
Effect of Oxygen Content and P ressu re on local Depos it
The principal quantitative measurements made were the amount of carbon (a measure
of deposits) and its distribution along the length of the heated tubes. Carbon was directly measured as a function of position along the tube; these deposits varied with pressure, oxygen content, and fuel. The same amount of fuel (60 lb or 27.2 kg) was used in all tests
so the results could be directly compared.
The most thermally stable fuel investigated was LeRC 67-1. This fuel was run
deoxygenated at 2.5, 20, 165, and 315 psia (1. 72X104 , 13. 75X104 , 113.5X10⁴ , and
217X104 N/m2 abs) and air-saturated at 165 and 315 pSia (113. 5X10⁴ and 217X104 N/m2
abs). The distribution of carbon along the tubes run with this fuel is shown in figure 2(a)
where carbon deposits per unit area are plotted against tube length. In all six runs there
was a clearly defined maximum of the adhering deposits in one portion of the tube. These
maximums were not on the hottest surface (tube outlet) but formed at varying distances
upstream of the tube outlet. The degrading effect of dissolved oxygen is very clearly shown at both 165 and 315
psia (113. 5X10⁴ and 217X104 N/m2 abs) where the air-saturated fuel (solid lines in fig. 2(a» laid down from 3 to 10 times more deposits in the region of maximum buildup
than did the deoxygenated fuel (dashed lines).
With deoxygenated fuel, increaSing the pressure from 2.5 to 20 psia (1. 72X104 to
13. 75X104 N/m abs) resulted in increased deposits. However, further increases in
pressure to 165 and 315 psia (113. 5X10⁴ and 217X104 N/m2 abs) very greatly reduced the
amounts of deposits to a level well below that obtained at 2.5 psia (1. 72x104 N/m2 abs).
An opposite effect of pressure was noted with the air-saturated fuels. About twice the
peak deposits were observed at 315 psia (217X104 N/m2 abs) than at 165 psia (113. 5x10⁴
N/m2 abs). The results from tests on the somewhat less stable fuel LeRC 67-2 are shown in
figure 2(b) for runs at 165, 315, and 615 psia (113. 5X10⁴ , 217X104 , and 424X104 N/m2
abs), respectively. This fuel was not run at 2.5 and 20 psia (1. 72X104 and 13. 75X104
N/m2 abs) since there is little practical interest in systems running at such pressures,
and particularly since no advantage was noted for low pressures with LeRC 67-1.
Instead, runs were made at 615 psia (424X104 N/m2 abs) which more nearly corresponds
with current practice; it is also a pressure that is greater than the critical pressure of
the fuel (::::::315 psia or 217X104 N/m2 abs). It can be seen that the general level of deposits
was higher with LeRC 67-2 than with LeRC 67-1 for all tests made under the same con
ditions. Again the degrading effect of oxygen is clearly evident. At 315 psia (217X104 N/m2
8
abs) the deposit peaks were about 10 times higher with the air-saturated fuel. The effect
of pressure was less marked with deoxygenated fuel. With air-saturated fuel, the maxi-
mum deposits were much greater at the intermediate pressure of 315 psia (217x10N/m2 abs).
The results obtained with LeRC 67-2 differed from LeRC 67-1 in that the air-
saturated runs at 165 and 315 psia (113. 5x10 and 217x10 N/m abs) gave two maximums
instead of one in the plots of deposits as a function of tube length. One was at about
28 inches (0. 71 m) from the inlet and the second near the tube outlet. However, only one
peak was observed at 615 psia (424x10 N/m abs).Data for the third fuel, RAF 178-64, are plotted in figure 2(c). This fuel was run
both air-saturated and deoxygenated at 165, 315, and 615 psia (113. 5xl0’1, 217xl04, and
424X104 N/m2 abs).The degrading effect of oxygen is again clearly shown, and there are two maximums
for the air-saturated fuel at all pressures*. The first maximum disappeared in all cases
when the fuel was deoxygenated. The second maximum near the tube outlet was sub-
stantially the same for both the air-saturated and deoxygenated conditions.
This fuel was clearly poorer in the deoxygenated state than the other two in that
more deposits were formed. This was especially true at 165 psia (113. 5x10 N/m abs).In the air-saturated state the maximum deposits were less than those obtained with LeRC
67-2 fuel and little different from LeRC 67-1 levels. The deposit level decreased with
increasing pressure with both deoxygenated and air-saturated fuel.
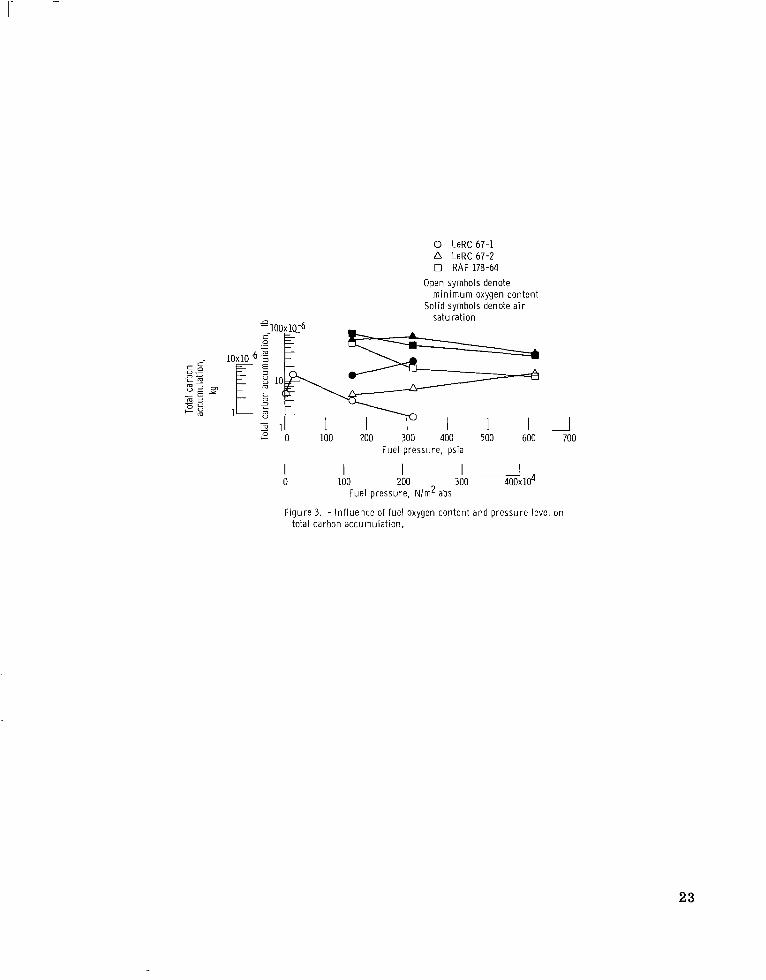
Effect of Oxygen Concentration and Pressure on Total Deposits
The data presented in figure 2 were integrated along the lengths of the tubes to
obtain the total deposits shown in figure 3. These totals are plotted as a function of
pressure for the three fuels and two oxygen contents investigated.
There were eight pairs of runs where the oxygen content was the only variable, and
in all cases, the air-saturated fuel resulted in greater total deposits than the corre-
sponding deoxygenated run. Oxygen increased the amounts of deposits from about three-
fold to over tenfold.
The effect of varying pressure on total deposits is less distinct. When deoxygenated,fuels LeRC 67-1 and RAF 178-64 gave decreasing deposits with increasing pressure,
but LeRC 67-2 showed the opposite trend. When air-saturated, LeRC 67-2 showed first
increasing and then decreasing deposits, and RAF 178-64 gave continuously decreasing
deposits with increasing pressure.
Fuel LeRC 67-1 was clearly the best of the three fuels at conditions where all three
were tested (165 and 315 psia or 113. 5X10⁴ and 217xl04 N/m2 abs). Only LeRC 67-1
9
IIIIII
abs) the deposit peaks were about 10 times higher with the air-saturated fuel. The effect
of pressure was less marked with deoxygenated fuel. With air-saturated fuel, the maxi
mum deposits were much greater at the intermediate pressure of 315 psia (217X104
N/m2 abs).
The results obtained with LeRC 67-2 differed from LeRC 67-1 in that the air
saturated runs at 165 and 315 psia (113. 5X10⁴ and 217X104 N/m2 abs) gave two maximums
instead of one in the plots of deposits as a function of tube length. One was at about
28 inches (0.71 m) from the inlet and the second near the tube outlet. However, only one
peak was observed at 615 psia (424X104 N/m2 abs).
Data for the third fuel, RAF 178-64, are plotted in figure 2(c). This fuel was run
both air-saturated and deoxygenated at 165, 315, and 615 psia (113. 5x10'±, 217X104 , and
424X104 N/m2 abs).
The degrading effect of oxygen is again clearly shown, and there are two maximums
for the air-saturated fuel at all pressures'. The first maximum disappeared in all cases
when the fuel was deoxygenated. The second maximum near the tube outlet was sub
stantially the same for both the air-saturated and deoxygenated conditions.
This fuel was clearly poorer in the deoxygenated state than the other two in that
more deposits were formed. This was especially true at 165 psia (113. 5x10⁴ N/m2 abs).
In the air-saturated state the maximum deposits were less than those obtained with LeRC
67-2 fuel and little different from LeRC 67-1 levels. The deposit level decreased with
increasing pressure with both deoxygenated and air-saturated fuel.
Effect of Oxygen Concentration and Pressu re on Total Deposits
The data presented in figure 2 were integrated along the lengths of the tubes to
obtain the total deposits shown in figure 3. These totals are plotted as a function of
pressure for the three fuels and two oxygen contents investigated. There were eight pairs of runs where the oxygen content was the only variable, and
in all cases, the air-saturated fuel resulted in greater total deposits than the corre
sponding deoxygenated run. Oxygen increased the amounts of deposits from about three
fold to over tenfold. The effect of varying pressure on total deposits is less distinct. When deoxygenated,
fuels LeRC 67-1 and RAF 178-64 gave decreasing deposits with increasing pressure,
but LeRC 67-2 showed the opposite trend. When air-saturated, LeRC 67-2 showed first
increasing and then decreasing deposits, and RAF 178-64 gave continuously decreasing
deposits with increasing pressure.
Fuel LeRC 67-1 was clearly the best of the three fuels at conditions where all three
were tested (165 and 315 psia or 113. 5X10⁴ and 217X104 N/m2 abs). Only LeRC 67-1
9
was run at 2. 5 and 20 psia (1. 72xl04 and 13. 75x104 N/m2 abs) and only this same fuelwas not run at 615 psia (424X104 N/m2 abs).
Deposits and Tube Wall Temperatures
Fluid temperatures were measured only at the tube inlet and outlet where they were70 and 700 F (294 and 644 K) in all runs. Tube wall temperatures were determined atfive to eight stations to allow estimates of the wall temperatures at the places wherecarbon deposits were measured. Plots on semilog paper of carbon deposits as a functionof tube wall temperature are given in figures 4(a) to (c) for fuels LeRC 67-1, LeRC 67-2,and RAF 178-64, respectively. These figures can be used to determine the approximatemetal temperature at which deposits first become significant and the temperature corre-sponding to deposit peaks.
The selection of an incipient deposit formation level (prior to a rapid deposit increase)must be somewhat arbitrary. On the basis that the combustion techniques for determiningthe deposits (carbon) were sensitive to about 0. 02X10" pound of carbon per square inch
(1. 43x10" g/cm of surface area, a value 10 times larger (0.2xl0~6 Ib/in. 2 or 14. 3xl0~6g/cm ) was selected as the incipient deposit level for the wall temperatures listed in thefollowing table:
-------i--------
Fuel Pressure Deoxygenated Air-saturated
Wall temperature for
psia N/m abs incipient deposits
F K F K
LeRC 67-1 2. 5 1.72xl04 365 460
20 13.75 495 530
165 113. 5 605 595 385 470
315 217 705 650 460 510
LeRC 67-2 165 113.5X10⁴ 590 585 330 440
315 217 595 590 410 485
615 424 570 575 380 465
RAF 178-64 165 113.5X10⁴ 615 600 320 435
315 217 625 605 330 440
615 424 670 630 310 430
10
I II 11111111111111111111111111 ••••• 11111111111111111111111
was run at 2.5 and 20 psia (1. 72x104 and 13. 75X104 N/m2 abs) and only this same fuel was not run at 615 psia (424X104 N/m2 abs).
Deposits and Tube Wall Temperatu res
Fluid temperatures were measured only at the tube inlet and outlet where they were
700 and 7000 F (294 and 644 K) in all runs. Tube wall temperatures were determined at
five to eight stations to allow estimates of the wall temperatures at the places where
carbon deposits were measured. Plots on semilog paper of carbon deposits as a function
of tube wall temperature are given in figures 4{a) to (c) for fuels LeRC 67-1, LeRC 67-2,
and RAF 178-64, respectively. These figures can be used to determine the approximate metal temperature at which deposits first become significant and the temperature corre
sponding to deposit peaks.
The selection of an incipient deposit formation level (prior to a rapid deposit increase)
must be somewhat arbitrary. On the basis that the combustion techniques for determining
the deposits (carbon) were sensitive to about O. 02X10- 6 pound of carbon per square inch (1. 43X10- 6 g/cm2) of surface area, a value 10 times larger (0. 2X10- 6 lb/in. 2 or 14. 3x10⁻⁶
g/cm2) was selected as the incipient deposit level for the wall temperatures listed in the
following table:
Fuel Pressure Deoxygenated I Air- saturated I Wall temperature for
This table clearly shows the adverse effect of the presence of dissolved oxygen.The metal temperatures for incipient deposit formation are from 185 to 360 F (103 to200 K) lower when the fuels were saturated with air as compared with the corresponding
runs with deoxygenated fuel.
Increasing the pressure increased the wall temperature for incipient deposits with
fuel LeRC 67-1. This appears to be true for both the deoxygenated and air-saturated
fuel. Pressure had a less consistent effect on the other two fuels. Fuel LeRC 67-1 was
clearly better than the other two in that it had a higher wall temperature.The wall temperatures for the first peak in carbon deposit taken from figure 4 are
listed in the following table:4
Fuel Pressure Deoxygenated Air-saturated
Wall temperature for
psia N/m abs incipient deposits
F K F K
LeRC 67-1 2.5 1.72xl04 470 520
20 13.75 535 555
165 113.5 680 635 640 610
315 217 740 670 575 575
LeRC 67-2 165 113.5X10⁴ 615 600 550 560
315 217 700 645 530 550
615 424 710 650 550 560
RAF 178-64 165 113.5xl04 710 650 520 545
315 217 740 670 480 525
615 424 830 720 450 510
Again, the adverse effect of dissolved oxygen is clear. When the fuel was deoxy-
^’ genated, increasing the pressure always increased the wall temperature at which the
peak deposit was formed. The effect of pressure was less pronounced when the fuels
were saturated with air. It may be noted from figure 2 that when there were two signifi-cant maximurns associated with the air-saturated tests, the second peak occurred atnearly the same location as the single peak with deoxygenated fuel.
Comparison with Coker Tests
Standard coker tests were run on RAF 178-64 and modified coker tests were run on
LeRC 67-1 at progressively higher temperatures until the fuels failed the visual rating
11
This table clearly shows the adverse effect of the presence of dissolved oxygen.
The metal temperatures for incipient deposit formation are from 1850 to 3600 F (103 to
200 K) lower when the fuels were saturated with air as compared with the corresponding· runs with deoxygenated fuel.
IncreaSing the pressure increased the wall temperature for incipient deposits with
fuel LeRC 67-1. This appears to be true for both the deoxygenated and air-saturated
fuel. Pressure had a less consistent effect on the other two fuels. Fuel LeRC 67-1 was
clearly better than the other two in that it had a higher wall temperature.
, The wall temperatures for the first peak in carbon deposit taken from figure 4 are listed in the following table:
Again, the adverse effect of dissolved oxygen is clear. When the fuel was deoxy-, genated, increasing the pressure always increased the wall temperature at which the
peak deposit was formed. The effect of pressure was less pronounced when the fuels
were saturated with air. It may be noted from figure 2 that when there were two significant maximums associated with the air-saturated tests, the second peak occurred at nearly the same location as the single peak with deoxygenated fuel.
Comparison with Coker Tests
Standard coker tests were run on RAF 178-64 and modified coker tests were run on
LeRC 67-1 at progressively higher temperatures until the fuels failed the visual rating
11
for deposits on the preheaters. The coker tests were performed on air-saturated fuelS)
at 165 psia (113. 5x10 N/m abs). The preheater fuel outlet temperatures at which failure
occurred, based on code 3 visual rating (table I), were 300 F (422 K) for RAF 178-64 in
the standard coker and 450 F (505 K) for LeRC 67-1 in the modified coker. These are
fuel-out temperatures but the corresponding maximum preheater surface temperaturescan be taken from curves given in reference 9. These surface temperatures are 420 F(489 K) for RAF 178-64 and 520 F (544 K) for LeRC 67-1. These values can be compared
with the temperatures of 320 F (433 K) for RAF 178-64 and 385 F (468 K) for LeRC
67-1 listed previously as the temperatures for incipient deposit formation with air- y,
saturated fuels run at 165 psia (113. 5xl04 N/m2 abs).Clearly, the surface temperatures listed herein as those for incipient deposit forma-
tion are considerably lower than those found in the fuel coker tests. Three factors maybe responsible. First, more fuel was used per unit surface area in the present work.
c, oSecond, the criterion of 0. 2x10" pound of carbon per square inch (14. 3x10" g/cm )used herein may represent a thinner deposit than a code 3 visual rating. And finally, the
Nichrome V tubing may have a mild catalytic effect as compared with the aluminum
tubing used in the standard test.
Other Observations
Some data other than the amounts of carbon along the tubes were obtained during
these tests. These include the effects of deposits on tube wall temperatures and pres-
sure drops and some observations on the solids entrained in the flow stream.
The variation in wall temperature with time was generally greatest in the same
general areas where the peak deposits were later measured. Since from five to eight
thermocouples were equally spaced along the length, these thermocouple positions did
not necessarily correspond to the locations where maximum deposits were determined.
In runs where a thermocouple was located close to the peak deposits, a definite increase
in wall temperature or decrease in heat-transfer coefficient was evident. However, the j
data were not adequate for a quantitative estimate of the decreases in heat-transfer coef-
ficient.
No significant change in pressure drop was measured except for run 14 where it
increased about 10 percent during the test. This run also had the highest local carbon
deposits (19. 9X10"6 Ib/in.2 or 14.0X10"6 g/cm2). H this deposit is assumed to have a
specific gravity of 1. 0 and to be two-thirds carbon, the deposit thickness would be
0. 00083 inch (0.00211 cm). This is slightly less than a 1 percent reduction in area for a
0. 116-inch- (0.295-cm-) inside-diameter tube and would not account for a 10 percent
increase in pressure drop. However, the deposit may be porous and have a specific
12
II II II I 11111111111111111111111111111111111111111111111111
for deposits on the preheaters. The coker tests were performed on air-saturated fuel at 165 psia (113. 5X10⁴ N/m2 abs). The preheater fuel outlet temperatures at which failure
occurred, based on code 3 visual rating (table I), were 3000 F (422 K) for RAF 178-64 in
the standard coker and 4500 F (505 K) for LeRC 67-1 in the modified coker. These are
fuel-out temperatures but the corresponding maximum preheater surface temperatures
can be taken from curves given in reference 9. These surface temperatures are 4200 F
(489 K) for RAF 178-64 and 5200 F (544 K) for LeRC 67-1. These values can be compared
with the temperatures of 3200 F (433 K) for RAF 178-64 and 3850 F (468 K) for LeRC
67 -1 listed previously as the temperatures for incipient deposit formation with air
saturated fuels run at 165 psia (113. 5x10⁴ N/m2 abs).
Clearly, the surface temperatures listed herein as those for incipient deposit forma
tion are considerably lower than those found in the fuel coker tests. Three factors may
be responsible. First, more fuel was used per unit surface area in the present work. Second, the criterion of O. 2x10- 6 pound of carbon per square inch (14. 3X10- 6 g/cm2)
used herein may represent a thinner deposit than a code 3 visual rating. And finally, the Nichrome V tubing may have a mild catalytic effect as compared with the aluminum
tubing used in the standard test.
Other Observations
Some data other than the amounts of carbon along the tubes were obtained during
these tests. These include the effects of deposits on tube wall temperatures and pressure drops and some observations on the solids entrained in the flow stream.
The variation in wall temperature with time was generally greatest in the same
general areas where the peak deposits were later measured. Since from five to eight
thermocouples were equally spaced along the length, these thermocouple positions did
not necessarily correspond to the locations where maximum deposits were determined.
In runs where a thermocouple was located close to the peak deposits, a definite increase
in wall temperature or decrease in heat-transfer coefficient was evident. However, the
data were not adequate for a quantitative estimate of the decreases in heat-transfer coef
ficient. No Significant change in pressure drop was measured except for run 14 where it
increased about 10 percent during the test. This run also had the highest local carbon
deposits (19. 9xlO- 6 lb/in. 2 or 14.0xlO-6 g/cm2). If this deposit is assumed to have a
specifiC gravity of 1. 0 and to be two-thirds carbon, the deposit thickness would be
0.00083 inch (O. 00211 cm). This is slightly less than a 1 percent reduction in area for a
0.116-inch- (0.295-cm-) inside-diameter tube and would not account for a 10 percent
increase in pressure drop. However, the deposit may be porous and have a specifiC
12
gravity much less than 1. Also, the 19. QxlO’^pound-per-square-inch (14:.0xl0~6-g/cm2)amount is an integrated value over a 2-inch (5. 1-cm) length of tube, and deposits mighthave been thicker locally.
All the deposits were too thin to change the appearance when sighting down the tube.However, the walls of the exit plenum and its two thermocouples were blackened in everytest. These deposits were thin and not easily wiped off. They shorted the bare beadthermocouples during some tests, but only one test had to be interrupted when boththermocouples became erratic. The sintered metal filters used in the first five tests areshown in figure 5. The filters were blackened, but the coating was not thick enough tochange their surface texture. No attempt was made to rate these deposits.
The fuel drained from the waste fuel tank was found to be yellowed and have a strongodor. No change in specific gravity was noted.
DISCUSSION
The carbon deposition data presented in figures 2 to 4 along with other observationsa.re only semiquantitative in that no runs were repeated. Therefore, the repeatabilityand accuracy of all this work is not proven. Nevertheless, there are definite trendsregarding the effects of temperature, pressure, and dissolved oxygen on the depositionof solids in heated tubes.
Even though the data are not rigorously quantitative, there are conclusions that canbe drawn regarding the mechanisms of solid deposition and the possibility of heatingfuels to 700 F (644 K) in aircraft fuel systems. The following is a discussion of theseaspects.
Mechanism
Two types of deposit-forming reactions are indicated. The RESULTS section andrelated figures show that deposits were formed at lower temperatures and much closerto the tube inlet when the fuels contain dissolved oxygen. Often there are two maximums
in the plots of deposit weight against tube length (or temperature), one at relatively lowertemperatures and the other near the hotter tube outlet. The first maximum disappearedwhen the dissolved oxygen was removed while the second was generally only slightlyinfluenced by oxygen content.
In summary, there appear to be two deposit-forming processes. The one occurringfirst in the tube or at a lower tube wall temperature requires the presence of oxygen andis therefore considered to be primarily an oxidation process, although there is a thermal
13
III
• \
IIII
gravity much less than 1. Also, the 19. 9xlO- 6 -pound-per-square-inch (14. OXlO-6 _g/ cm2)
amount is an integrated value over a 2-inch (5.1-cm) length of tube, and deposits might have been thicker locally.
All the deposits were too thin to change the appearance when sighting down the tube.
However, the walls of the exit plenum and its two thermocouples were blackened in every
test. These deposits were thin and not easily wiped off. They shorted the bare bead
thermocouples during some tests, but only one test had to be interrupted when both
thermocouples became erratic. The sintered metal filters used in the first five tests are
shown in figure 5. The filters were blackened, but the coating was not thick enough to
change their surface texture. No attempt was made to rate these deposits.
The fuel drained from the waste fuel tank was found to be yellowed and have a strong
odor. No change in specific gravity was noted.
DISCUSSION
The carbon depOSition data presented in figures 2 to 4 along with other observations
ire only semiquantitative in that no runs were repeated. Therefore, the repeatability
and accuracy of all this work is not proven. Nevertheless, there are definite trends
regarding the effects of temperature, pressure, and dissolved oxygen on the deposition
of solids in heated tubes.
Even though the data are not rigorously quantitative, there are conclusions that can
be drawn regarding the mechanisms of solid deposition and the possibility of heating
fuels to 7000 F (644 K) in aircraft fuel systems. The following is a discussion of these
aspects.
Mechanism
Two types of deposit-forming reactions are indicated. The RESULTS section and
related figures show that depOSits were formed at lower temperatures and much closer
to the tube inlet when the fuels contain dissolved oxygen. Often there are two maximums
in the plots of deposit weight against tube length (or temperature), one at relatively lower
temperatures and the other near the hotter tube outlet. The first maximum disappeared
when the dissolved oxygen was removed while the second was generally only slightly
influenced by oxygen content.
In summary, there appear to be two deposit-forming processes. The one occurring
first in the tube or at a lower tube wall temperature requires the presence of oxygen and
is therefore considered to be primarily an oxidation process, although there is a thermal
13
requirement for reaction of impurities with oxygen. This process is considered to be
analogous to that occurring in standard coker tests wherein the fuel is aerated before
testing. The second peak appears at generally the same location and wall temperature
for a given pressure with or without oxygen and is therefore considered to be primarily a
thermal process.
Composition and Amounts of Deposits
The deposits formed from thermally unstable fuels are believed to be derived largely
from traces of nonhydrocarbon impurities in the fuels. These are sulfur-, oxygen-, and
nitrogen-containing organic compounds. These impurities, along with the more reactive
hydrocarbons and dissolved oxygen, condense and polymerize to form high-molecular-
weight materials that are insoluble in fuel. Some of these deposits are on the tube wall,and some are suspended in the fuel and may foul downstream fuel-system components.
Although the precise chemical composition is not known, attempts to analyze the
deposits and a knowledge of the materials involved permit a deduction of the approximate
composition. The insolubility of the material to all organic solvents indicates that it is
not a hydrocarbon polymer, such as polyethylene or polystyrene. The influence on
thermal stability of dissolved oxygen and nonhydrocarbon fuel impurities suggests that the
deposit contains carbon, hydrogen, oxygen, and nitrogen. Sulfur may also be present.
Industrial polymers that contain these elements and which also have similar resistance to
organic solvents are, as examples, the alkyd and epoxy resins and nylon. Typical mem-
bers of these three classes of polymers have carbon contents of 63, 76, and 63 percent,
respectively, and specific gravities ranging from 1. 0 to 1. 3. For purposes of discussion
herein, the deposits were assumed to be 67 percent carbon and to have a specific gravity
of 1. 0. However, there have been unpublished indications that the deposit consistency
could have a porous "popcorn" character and have a lower specific gravity. Thermal
conductivity values in the neighborhood of 0. 07 Btu per hour per square foot per F per
foot (0. 121 J/(m)(sec)(K)) are recommended in reference 10 based on similar logic.
The amounts of deposits formed were very small in all tests. Integration of the
plots shown in figure 2 gave the totals shown in figure 3. The values of accumulated
carbon deposits in figure 3 range from 2xl0~6 to lOOxlO"6 pounds (908x10" to
45 400x10" g) of carbon. Since 60 pounds (27. 3 kg) of fuel were used during each test
and the carbon fraction of the deposit was chosen as 0. 67, the deposits range from 0. 05
to 2. 5 ppm of the fuel.
14
requirement for reaction of impurities with oxygen. This process is considered to be
analogous to that occurring in standard coker tests wherein the fuel is aerated before
testing. The second peak appears at generally the same location and wall temperature
for a given pressure with or without oxygen and is therefore considered to be primarily a
thermal process.
Composition and Amounts of Deposits
The deposits formed from thermally unstable fuels are believed to be derived largely from traces of nonhydrocarbon impurities in the fuels. These are sulfur-, oXygen-, and
nitrogen-containing organic compounds. These impurities, along with the more reactive
hydrocarbons and dissolved oxygen, condense and polymerize to form high-molecular
weight materials that are insoluble in fuel. Some of these deposits are on the tube wall,
and some are suspended in the fuel and may foul downstream fuel-system components.
Although the precise chemical composition is not known, attempts to analyze the deposits and a knowledge of the materials involved permit a deduction of the approximate composition. The insolubility of the material to all organic solvents indicates that it is
not a hydrocarbon polymer, such as polyethylene or polystyrene. The influence on
thermal stability of dissolved oxygen and nonhydrocarbon fuel impurities suggests that the
deposit contains carbon, hydrogen, oxygen, and nitrogen. Sulfur may also be present.
Industrial polymers that contain these elements and which also have similar resistance to
organic solvents are, as examples, the alkyd and epoxy resins and nylon. Typical mem
bers of these three classes of polymers have carbon contents of 63, 76, and 63 percent,
respectively, and specific gravities ranging from 1. 0 to 1. 3. For purposes of discussion
herein, the deposits were assumed to be 67 percent carbon and to have a specific gravity
of 1. O. However, there have been unpublished indications that the deposit consistency
could have a porous "popcorn" character and have a lower specific gravity. Thermal conductivity values in the neighborhood of 0.07 Btu per hour per square foot per OF per
foot (0.121 J/(m)(sec)(K)) are recommended in reference 10 based on similar logic.
The amounts of deposits formed were very small in all tests. Integration of the
plots shown in figure 2 gave the totals shown in figure 3. The values of accumulated carbon deposits in figure 3 range from 2X10- 6 to 100XlO-6 pounds (908X10- 6 to
45 400XlO- 6 g) of carbon. Since 60 pounds (27.3 kg) of fuel were used during each test
and the carbon fraction of the deposit was chosen as 0.67, the deposits range from 0.05
to 2. 5 ppm of the fuel.
14
)
Effects of Deposits on Engine Performance
The possibility of heating fuels to 700 F (644 K) can be considered from various
standpoints, that is, weight of deposit accumulation in aircraft heat exchangers, potential
flow blockage problems, and degradation of heat-transfer rate. The discussion that fol-
lows is quantitatively only as valid as the assumptions made relative to deposit carbon
content, specific gravity, and thermal conductivity. In addition, it is assumed that the
deposits increase linearly with accumulated flow or time; for example, that there would
be 10 times more deposits with 600 pounds (273 kg) of fuel than there were in these tests
with 60 pounds (27. 3 kg) of fuel.
An SST uses about 200 000 pounds of fuel (90 800 kg) during a typical flight. The
potential weight accumulation is obtained by multiplying this fuel weight by the fraction
of deposit formed from the fuel. This fraction ranged from 0. 05 to 2. 5 ppm, indicating
a potential deposit weight accumulation per flight of from 0. 01 to 0. 5 pound (4. 54 to
228 g) in engine fuel heat exchangers.
The carbon distribution curves presented herein indicate that local deposit formation
may present a more significant problem than total weight accumulation. Considering the
tube blockage problem, the estimated times to block the flow area of a 0. 116-inch-
(0.295-cm-) diameter passage by 50 percent are tabulated below. The two carbon growth
rates represent the smallest and largest local peak values obtained during these tests.
Source of local Carbon growth rate Time for 50 percent
growth rate 9 blockage,Ib/in.^ g/cm"
^per 20 hr per 20 hr
Maximum (air- 19.9X10"6 14.0X10"6 400
saturated
tests)
Minimum (min. 5 .36 16 000
oxygen tests)
These figures provide an indication of the time involved if it is assumed that the
deposits have a specific gravity of 1. 0 and contain 67 percent carbon. A mean surface
area was assumed in the calculation. These estimates assume a linear growth rate from
the 20-hour run time and imply that the maximum rates of deposition will remain at one
tube location. In practice there will be time-varying flow rates, wall temperatures, and
heat-transfer coefficients that will tend to spread the deposit over a considerable length.
15
Effects of Deposits on Engine Performance
The possibility of heating fuels to 7000 F (644 K) can be considered from various
standpoints, that is, weight of deposit accumulation in aircraft heat exchangers, potential
flow blockage problems, and degradation of heat-transfer rate. The discussion that fol
lows is quantitatively only as valid as the assumptions made relative to deposit carbon
content, specific gravity, and thermal conductivity. In addition, it is assumed that the
deposits increase linearly with accumulated flow or time; for example, that there would
be 10 times more deposits with 600 pounds (273 kg) of fuel than there were in these tests with 60 pounds (27. 3 kg) of fuel.
An SST uses about 200 000 pounds of fuel (90 800 kg) during a typical flight. The
potential weight accumulation is obtained by multiplying this fuel weight by the fraction
of deposit formed from the fuel. This fraction ranged from 0.05 to 2.5 ppm, indicating
a potential deposit weight accumulation per flight of from 0.01 to 0.5 pound (4.54 to
228 g) in engine fuel heat exchangers.
The carbon distribution curves presented herein indicate that local deposit formation
may present a more significant problem than total weight accumulation. Considering the
tube blockage problem, the estimated times to block the flow area of a 0.116-inch-
(0. 295-cm-) diameter passage by 50 percent are tabulated below. The two carbon growth
rates represent the smallest and largest local peak values obtained during these tegts.
Source of local I Carbon growth rate Time for 50 percent growth rate
Ib/in. 2 g/cm2 blockage,
hr per 20 hr per 20 hr
-
Maximum (air- 19.9xlO- 6 14.0xlO-6 400 saturated
tests)
Minimum (min. .5 .36 16000 oxygen tests)
These figures provide an indication of the time involved if it is assumed that the
deposits have a specifiC gravity of 1. 0 and contain 67 percent carbon. A mean surface
area was assumed in the calculation. These estimates assume a linear growth rate from
the 20-hour run time and imply that the maximum rates of depOSition will remain at one
tube location. In practice there will be time-varying flow rates, wall temperatures, and
heat-transfer coefficients that will tend to spread the deposit over a considerable length.
15
The degradation of heat exchanger performance due to scale formation (deposits) is
thoroughly treated in the literature. The deposit forms an insulating blanket which can
become the dominant factor controlling heat flux. In a fuel-to-air heat exchanger this
insulating blanket can seriously alter the heat balance considered in design, that is, theair would be cooled less and the fuel heated less. Obviously, if this occurs the heat sink
capacity of the cooling air for turbine cooling would decrease with time and either the
engine would have to be progressively derated or failure could be expected.As the deposits only affect the fuel side of a fuel-to-air heat exchanger, the influence
of deposits on fuel-side design heat flux or, as the temperatures can be assumed to be
constant, at various design heat-transfer coefficients can be discussed. During the testsreported herein, a typical heat-transfer coefficient h was 58 Btu per hour per squarefoot per F (32. 9 W/(m )(K)) between the surface and the fuel. The following relationprovides a heat-transfer coefficient from wall to fluid u with a conduction term for scaleor deposit effects:
1 1 -,-u h K
where
x deposit thickness
K thermal conductivity of deposit
Figure 6(a) illustrates the decrease with time of the local heat-transfer coefficient
from a design value due to each of three possible deposit growth rates. A K value of0. 07 Btu per hour per square foot per F per foot (0. 121 J/(m)(sec)(K)) is assumed. The
design or clean-tube value of u is 58 Btu per hour per square foot per F (32. 9
WAm^CK)). The three carbon deposit rates (for 20 hours) plotted are 0.2xl0~6,fi fi 9
4. 3x10" and 1420x10" g/cm ). These values correspond to the previously discussed
incipient deposit formation rate and the maximum rates found with deoxygenated and with
air-saturated fuels in tests above 300 psia (207x10 N/m abs). The decay curve for
air-saturated fuel indicates that the heat-transfer coefficient decays to 50 percent of
design value in 350 hours. The decay curve for deoxygenated fuel indicates that 1600
hours are required to diminish the design u by 50 percent. The decay curve associatedfi -fi 9
with the 0.2x10" -pound-per-square-inch (14. 3X10 -g/cm ) carbon deposit rate shows
only a 15 percent reduction in 6000 hours. Deposit growth rate could be limited to the
inception growth rate with a sacrifice in heat sink capacity by utilizing deoxygenated fuel
and limiting the wall temperature to around 570 F (573 K).Figure 6(b) is included to illustrate that if a heat exchanger is designed for a higher
heat flux (higher heat-transfer coefficient assuming the same wall- to fluid-temperature
16
The degradation of heat exchanger performance due to scale formation (deposits) is
thoroughly treated in the literature. The deposit forms an insulating blanket which can
become the dominant factor controlling heat flux. In a fuel-to-air heat exchanger this
insulating blanket can seriously alter the heat balance considered in design, that is, the
air would be cooled less and the fuel heated less. Obviously, if this occurs the heat sink
capacity of the cooling air for turbine cooling would decrease with time and either the
engine would have to be progressively derated or failure could be expected.
As the deposits only affect the fuel side of a fuel-to-air heat exchanger, the influence
of deposits on fuel-side design heat flux or, as the temperatures can be assumed to be
constant, at various design heat-transfer coefficients can be discussed. During the tests
reported herein, a typical heat-transfer coefficient h was 58 Btu per hour per square foot per OF (32.9 W/(m2)(K» between the surface and the fuel. The following relation
provides a heat-transfer coefficient from wall to fluid u with a conduction term for scale or deposit effects:
1 1 X -=-+-U h K
where
x deposit thickness
K thermal conductivity of deposit
Figure 6(a) illustrates the decrease with time of the local heat-transfer coefficient
from a design value due to each of three possible deposit growth rates. A K value of
0.07 Btu per hour per square foot per OF per foot (0.121 J/(m)(sec)(K» is assumed. The
design or clean-tube value of u is 58 Btu per hour per square foot per OF (32.9
W /(m2)(K». The three carbon deposit rates (for 20 hours) plotted are O. 2x10- 6 , -6 -6 / 2) 4.3x10 ,and 1420x10 g cm . These values correspond to the previously discussed
incipient deposit formation rate and the maximum rates found with deoxygenated and with
air-saturated fuels in tests above 300 psia (207X104 N/m2 abs). The decay curve for
air-saturated fuel indicates that the heat-transfer coefficient decays to 50 percent of
design value in 350 hours. The decay curve for deoxygenated fuel indicates that 1600
hours are required to diminish the design u by 50 percent. The decay curve associated with the O. 2X10- 6 -pound-per-square-inch (14. 3X10- 6 -g/ cm 2) carbon deposit rate shows
only a 15 percent reduction in 6000 hours. Deposit growth rate could be limited to the
inception growth rate with a sacrifice in heat sink capacity by utilizing deoxygenated fuel
and limiting the wall temperature to around 5700 F (573 K).
Figure 6(b) is included to illustrate that if a heat exchanger is designed for a higher heat flux (higher heat-transfer coefficient assuming the same wall- to fluid-temperature
16
difference), the deposit growth rate has a more significant effect on heat exchanger per-
formance. In this figure the design heat-transfer coefficient is increased by a factor of
ten from figure 6(a), and the same deposit growth rates are assumed to be valid. As maybe noted, the time for decay to 50 percent of design u is reduced to 160 hours for
deoxygenated fuel and 3400 hours at the inception deposit rate.Figure 6 tends to verify previous pessimism concerning the further utilization of the
heat sink of existing commercial fuels if the fuel is air-saturated. The figure also indi-
cates the potential for significant gains if deoxygenated fuel is used and heating occurs
when the fuel is at a desirable pressure. This figure also illustrates the desirability of
designing for low liquid-side heat flux to reduce the influence of the deposits. Unfortun-
ately, this leads to undesirably large heat exchangers. Reduction in local heat-transfer
coefficient due to deposit formation is a more significant or limiting problem than either
weight accumulation or blockage.
Although this effort was not intended as a fuels test, the fuels do represent a signifi-
cant range within the ASTM Jet A specifications. If specifications were tightened and
handling procedures were improved to the point that the LeRC 67-1 fuel was the poorestto design for from a stability standpoint, fuel-to-air heat exchanger time between over-
hauls in excess of 3000 hours could be readily expected.
Another approach suggested by this work would be to design the heat exchanger so
that segments of the fuel side would be shut off, and air introduced periodically. With
approximately 1200 F (923 K) compressor bleed air on both the liquid side and the air
side, a combustion process would remove the accumulated deposits in much the same
way as described in the appendix. Perhaps a more immediately practical consideration
would be to have the heat exchanger removed during overhaul and cleaned in an oven with
airflow on the fuel side.
CONCLUDING REMARKS
Only small amounts of deposits were collected on heat exchanger surfaces when
Jet A fuels were heated to 700 F (644 K) at a nominal heat flux of 9000 Btu per hour per9
square foot (2830 W/m ). The accumulated deposits ranged from 0. 05 to 2. 5 parts per
million of the fuel so heated. The deposits were always reduced by removing dissolved
oxygen from the fuel prior to heating.
The influence of fuel pressure, while not entirely consistent from fuel to fuel, was
to diminish both total and local deposits with increasing pressure. Increasing fuel pres-
sure also shifted peak deposit locations downstream to points corresponding to higher
wall temperatures.Times between overhauls for an SST would be uneconomically short due to deposits
17
difference), the deposit growth rate has a more significant effect on heat exchanger per
formance. In this figure the design heat-transfer coefficient is increased by a factor of
ten from figure 6(a), and the same deposit growth rates are assumed to be valid. As may
be noted, the time for decay to 50 percent of design u is reduced to 160 hours for
deoxygenated fuel and 3400 hours at the inception deposit rate.
Figure 6 tends to verify previous pessimism concerning the further utilization of the
heat sink of existing commercial fuels if the fuel is air-satu.rated. The figure also indi
cates the potential for significant gains if deoxygenated fuel is used and heating occurs
when the fuel is at a desirable pressure. This figure also illustrates the desirability of
designing for low liquid-side heat flux to reduce the influence of the deposits. Unfortun
ately, this leads to undesirably large heat exchangers. Reduction in local heat-transfer
coefficient due to deposit formation is a more significant or limiting problem than either
weight accumulation or blockage.
Although this effort was not intended as a fuels test, the fuels do represent a signifi
cant range within the ASTM Jet A specifications. If specifications were tightened and
handling procedures were improved to the point that the LeRC 67-1 fuel was the poorest
to design for from a stability standpoint, fuel-to-air heat exchanger time between over
hauls in excess of 3000 hours could be readily expected.
Another approach suggested by this work would be to design the heat exchanger so
that segments of the fuel side would be shut off, and air introduced periodically. With
approximately 12000 F (923 K) compressor bleed air on both the liquid side and the air
side, a combustion process would remove the accumulated deposits in much the same
way as described in the appendix. Perhaps a more immediately practical consideration
would be to have the heat exchanger removed during overhaul and cleaned in an oven with
airflow on the fuel side.
CONCLUDING REMARKS
Only small amounts of deposits were collected on heat exchanger surfaces when
Jet A fuels were heated to 7000 F (644 K) at a nominal heat flux of 9000 Btu per hour per
square foot (2830 W/m2). The accumulated deposits ranged from 0.05 to 2.5 parts per
million of the fuel so heated. The deposits were always reduced by removing dissolved
oxygen from the fuel prior to heating. The influence of fuel pressure, while not entirely consistent from fuel to fuel, was
to diminish both total and local deposits with increasing pressure. Increasing fuel pres
sure also shifted peak deposit locations downstream to points corresponding to higher
wall temperatures. Times between overhauls for an SST would be uneconomically short due to deposits
17
if air-saturated fuels were heated to 700 F (644 K) under the heat-transfer conditions
of these experiments. However, the rates of deposition with fuels containing minimum
oxygen were not so high as to deny the possibility of heating fuels to 700 F (644 K) in
advanced aircraft engines. It is, therefore, possible that adequate times between over-
hauls can be achieved if high-quality fuels meeting the Jet A specification are deoxygen-
ated and used in conservatively designed heat exchangers. The possibility of heating
fuels to 700 F (644 K) prior to burning provides considerably greater heat sink capacity
for cooling of engine components than is currently available.
It is postulated that there are two mechanisms involved in heat exchanger fouling
when fuels are strongly heated. One is an oxidative degradation that takes place in the
liquid phase and is probably identical with the thermal instability process that has received
much attention in recent years. The other is a higher-temperature process that is much
less influenced by dissolved oxygen. Two peaks in deposit formation representing the
two mechanisms occurred frequently during tests with air-saturated fuel. The first peak
corresponding to a lower wall temperature disappeared when the fuel was tested with
minimum oxygen.
Finally, a combustion technique has been shown to be capable of quantitatively mea-
suring the carbon weight distribution in the passages. The technique is quick, easy, and
accurate. The carbon measurements are not directly applicable to design as neither the
exact percentage of carbon in the fuel deposits nor the deposit specific gravities are
known. Nevertheless, the data do show the trends that result from changes in operating
variables. The combustion technique may prove valuable in fuel evaluation and provide
a method for cleaning fuel-to-air heat exchangers fouled by fuel deposits.
Lewis Research Center,National Aeronautics and Space Administration,
Cleveland, Ohio, September 23, 1968,126-15-01-38-22.
18
if air-saturated fuels were heated to 7000 F (644 K) under the heat-transfer conditions
of these experiments. However, the rates of deposition with fuels containing minimum
oxygen were not so high as to deny the possibility of heating fuels to 7000 F (644 K) in
advanced aircraft engines. It is, therefore, possible that adequate times between over
hauls can be achieved if high-quality fuels meeting the Jet A specification are deoxygen
ated and used in conservatively designed heat exchangers. The possibility of heating
fuels to 7000 F (644 K) prior to burning provides considerably greater heat sink capacity
for cooling of engine components than is currently available.
It is postulated that there are two mechanisms involved in heat exchanger fouling
when fuels are strongly heated. One is an oxidative degradation that takes place in the
liquid phase and is probably identical with the thermal instability process that has received
much attention in recent years. The other is a higher-temperature process that is much
less influenced by dissolved oxygen. Two peaks in deposit formation representing the
two mechanisms occurred frequently during tests with air-saturated fuel. The first peak
corresponding to a lower wall temperature disappeared when the fuel was tested with
minim urn oxygen.
Finally, a combustion technique has been shown to be capable of quantitatively mea
suring the carbon weight distribution in the passages. The technique is quick, easy, and
accurate. The carbon measurements are not directly applicable to design as neither the
exact percentage of carbon in the fuel deposits nor the deposit specific gravities are
known. Nevertheless, the data do show the trends that result from changes in operating
variables. The combustion technique may prove valuable in fuel evaluation and provide
a method for cleaning fuel-to-air heat exchangers fouled by fuel deposits.
Lewis Research Center,
18
National Aeronautics and Space Administration,
Cleveland, Ohio, September 23, 1968,
126-15-01-38-22.
APPENDIX DETERMINATION OF CARBONACEOUS DEPOSITS
Sample tubes from the fuel deposit experiments were first rinsed by passing a
volatile solvent, such as hexane, through the tube to remove any remaining fuel and then
dried with air. The outside of each tube was cleaned with abrasive paper or steel wool
to remove any organic matter that might have been left on the tube. Several 2-inch
(5. 08-cm) sections, spaced approximately 10 inches (25.4 cm) apart, were then cut from
each tube. Additional 2-inch (5. 08-cm) sections were cut later, as required, both before
and after the section showing the largest amount of deposit, in order to more accurately
define the deposit distribution. In this way, six to ten sections were taken from each tube.
Each test section was carefully cleaned with lintless tissue and ether to remove finger-
prints, etc. and thereafter was handled with clean tweezers.
The apparatus used to determine residual carbonaceous deposits was an adaptation
of a Leco Low Carbon Analyzer (Laboratory Equipment Corp. St. Joseph, Mich.). The
complete instrument is shown in figure 7(a), and a schematic diagram showing the way it
was used to evaluate these samples is shown in figure 7(b). The complete instrument
consists of (1) a gas-purifying train, (2) an induction furnace, (3) traps to remove dust
and sulfur, (4) a copper oxide furnace to convert carbon monoxide to carbon dioxide,
(5) a drying tube filled with magnesium perchlorate, and (6) the analyzer unit. The only
modification was to substitute an electric tube furnace for the induction furnace. The
furnace tube was made of a high-temperature borosilicate glass 36 inches (91. 5 cm) long
and 1 inch (2. 54 cm) in outside diameter. A sample section was placed in an alundum
boat to which was attached a metal rod about 10 inches (25. 4 cm) long with a piece of
magnetic stainless steel attached to the opposite end. This assembly was held in the
unheated part of the furnace tube during purge, then pushed into the furnace section by
means of a handheld magnet outside the tube. The deposit was burned off in an oxygen
flow of 250 milliliters per minute at a furnace temperature of 520 to 530 C. Eight
minutes was sufficient time to completely burn the carbon in the deposits. In the
analyzer, carbon dioxide is absorbed in a collector containing about 1 gram of molecular
sieve 13X which is at room temperature during the collection part of the cycle. At this
point, a timer actuates a solenoid-controlled six-port valve which diverts the oxygen
flow to vent and sends helium through the collector. Oxygen is purged from the collector
within 10 to 15 seconds. The collector is then heated to 350 C within 20 seconds. At
this temperature, carbon dioxide is released by the molecular sieve and carried by the
helium through a chromatographic column (a 1/4-inch- (0.03-cm-) o.d. copper tube,
1 ft (30.4 cm) long, packed with silica gel) to a thermal conductivity detector. Output
of the detector is amplified and fed to a synchronous motor which drives a clock inte-
grator. Calibration of integrator counts against micrograms of carbon was made by in-
jecting precise amounts of pure carbon dioxide from a gas-tight syringe. The detector
has a sensitivity of 0. 1 microgram and a range of up to 1000 micrograms of carbon.
19
APPENDIX - DETERMINATION OF CARBONACEOUS DEPOSITS
Sample tubes from the fuel deposit experiments were first rinsed by passing a
volatile solvent, such as hexane, through the tube to remove any remaining fuel and then
dried with air. The outside of each tube was cleaned with abrasive paper or steel wool to remove any organic matter that might have been left on the tube. Severa12-inch
(5. 08-cm) sections, spaced approximately 10 inches (25.4 cm) apart, were then cut from each tube. Additional 2-inch (5. 08-cm) sections were cut later, as required, both before
and after the section showing the largest amount of deposit, in order to more accurately
define the deposit distribution. In this way, six to ten sections were taken from each tube. Each test section was carefully cleaned with lintless tissue and ether to remove finger
prints, etc., and thereafter was handled with clean tweezers.
The apparatus used to determine residual carbonaceous deposits was an adaptation
of a Leco Low Carbon Analyzer (Laboratory Equipment Corp., st. Joseph, Mich.). The
complete instrument is shown in figure 7(a), and a schematic diagram showing the way it
was used to evaluate these samples is shown in figure 7(b). The complete instrument
consists of (1) a gas-purifying train, (2) an induction furnace, (3) traps to remove dust
and sulfur, (4) a copper oxide furnace to convert carbon monoxide to carbon dioxide,
(5) a drying tube filled with magnesium perchlorate, and (6) the analyzer unit. The only modification was to substitute an electriC tube furnace for the induction furnace. The
furnace tube was made of a high-temperature borosilicate glass 36 inches (91. 5 cm) long
and 1 inch (2.54 cm) in outside diameter. A sample section was placed in an alundum
boat to which was attached a metal rod about 10 inches (25.4 cm) long with a piece of magnetic stainless steel attached to the opposite end. This assembly was held in the
unheated part of the furnace tube during purge, then pushed into the furnace section by
means of a handheld magnet outside the tube. The deposit was burned off in an oxygen flow of 250 milliliters per minute at a furnace temperature of 5200 to 5300 C. Eight
minutes was sufficient time to completely burn the carbon in the deposits. In the
analyzer, carbon dioxide is absorbed in a collector containing about 1 gram of molecular sieve 13X which is at room temperature during the collection part of the cycle. At this
point, a timer actuates a solenoid-controlled six-port valve which diverts the oxygen flow to vent and sends helium through the collector. Oxygen is purged from the collector
within 10 to 15 seconds. The collector is then heated to 3500 C within 20 seconds. At
this temperature, carbon dioxide is released by the molecular sieve and carried by the helium through a chromatographic column (a 1/4-inch- (0.03-cm-) o.d. copper tube,
1 ft (30.4 cm) long, packed with silica gel) to a thermal conductivity detector. Output of the detector is amplified and fed to a synchronous motor which drives a clock inte
grator. Calibration of integrator counts against micrograms of carbon was made by in
jecting precise amounts of pure carbon dioxide from a gas-tight syringe. The detector
has a sensitivity of 0.1 microgram and a range of up to 1000 micrograms of carbon.
19
REFERENCES
1. Anon. An Investigation of the Performance of Jet Engine Fuels for Supersonic
Transport Aircraft. Rep. CRC-LD-153, Coordinating Research Council, Inc.(AFAPL-TR-65-35, DDC No. AD-476744L), July 1965.
2. Osterhout, D. P. Jr. Fuels for the Supersonic Transport-A Progress Report.Paper No. 863D, SAE, Apr. 1964.
3. Hibbard, Robert R. Evaluation of Liquified Hydrocarbon Gases as Turbojet Fuels.
NACA RM E56I21, 1956.
4. McLean, C. D. and Goodrich, J. E. Thermal Stability of Gas Turbine Fuels.
Summary Report, California Research Corp. Apr. 30, 1955. (Contract AF18(600)-152.)
5. McKeown, Anderson B. and Hibbard, Robert R. Effect of Dissolved Oxygen on the
Filterability of Jet Fuels for Temperatures Between 300 F and 400 F. NACA
RM E55I28, 1955.
6. Roper, R. M. XB-70 Ground Servicing and Safety Precautions. Paper No. 660275,SAE, Apr. 1966.
7. Nixon, A. C. Ackerman, G. H. Hawthorn, R. D. Henderson, H. T. and Ritchie,
A. W. Vaporizing and Endothermic Fuels for Advanced Engine Application. Rep.
S-14007, Shell Development Co. Aug. 1966. (Available from DDC as AD-801028.)
8. Dutton, Richard A. An Experimental Investigation of the Suitability of JP-4 fuel
for the Regenerative Cooling of a Hypersonic Ramjet Engine. Rep. S-154,Marquardt Corp. 1960.
9. Anon. Final Report on Thermal Characteristics of ASTM, Modified, and Research
Fuel Cokers. Rep. 65-742, Eppi Precision Products, Inc. 1965.
10. Goodman, Harold; Bradley, Royce P. and Sickles, Theodore G. High Temperature
Hydrocarbon Fuels Research in an Advanced Aircraft Fuel System Simulator on
Fuel AFFB-8-67. Rep. NA-67-635, North American Aviation, Inc. (AFAPL-TR-67-116, DDC No. AD-820688), Sept. 1967.
20
REFERENCES
1. Anon.: An Investigation of the Performance of Jet Engine Fuels for Supersonic
Transport Aircraft. Rep. CRC-LD-153, Coordinating Research Council, Inc.
(AFAPL-TR-65-35, DDC No. AD-476744L), July 1965.
2. Osterhout, D. P., Jr.: Fuels for the Supersonic Transport-A Progress Report.
Paper No. 863D, SAE, Apr. 1964.
3. Hibbard, Robert R.: Evaluation of Liquified Hydrocarbon Gases as Turbojet Fuels.
NACA RM E56I21, 1956.
4. McLean, C. D.; and Goodrich, J. E.: Thermal Stability of Gas Turbine Fuels.
Summary Report, California Research Corp., Apr. 30, 1955. (Contract AF18
(600}-152. )
5. McKeown, Anderson B. ; and Hibbard, Robert R.: Effect of Dissolved Oxygen on the
Filterability of Jet Fuels for Temperatures Between 3000 F and 4000 F. NACA
RM E55I28, 1955.
6. Roper, R. M.; XB-70 Ground Servicing and Safety Precautions. Paper No. 660275,
SAE, Apr. 1966.
7. Nixon, A. C.; Ackerman, G. H.; Hawthorn, R. D.; Henderson, H. T.; and Ritchie,
A. W.: Vaporizing and Endothermic Fuels for Advanced Engine Application. Rep.
. S-14007, Shell Development Co., Aug. 1966. (Available from DDC as AD-801028.)
8. Dutton, Richard A.: An Experimental Investigation of the Suitability of JP-4 fuel
for the Regenerative Cooling of a HypersoniC Ramjet Engine. Rep. S-154,
Marquardt Corp., 1960.
9. Anon.: Final Report on Thermal Characteristics of ASTM, Modified, and Research
If Undeliverable (Section 158rus MA& hK. p^i Manual) Do Not Return
"The aeronautical and space activities of the United States shall beconducted so as to contribute to the expansion of human knowl-edge of phenomena in the atmosphere and space. The Administrationshall provide for the widest practicable and appropriate disseminationof information concerning its activities and the results thereof."
--NATIONAL AERONAUTICS AND SPACE ACT OF 1958
NASA SCIENTIFIC AND TECHNICAL PUBLICATIONS
TECHNICAL REPORTS: Scientific and TECHNICAL TRANSLATIONS: Informationtechnical information considered important, published in a foreign language consideredcomplete, and a lasting contribution to existing to merit NASA distribution in English.knowledge.
SPECIAL PUBLICATIONS: InformationTECHNICAL NOTES: Information less broad derived from or of value to NASA activities.in scope but nevertheless of importance as a Publications include conference proceedings,contribution to existing knowledge, monographs, data compilations, handbooks,
sourcebooks, and special bibliographies.TECHNICAL MEMORANDUMS:Information receiving limited distribution TECHNOLOGY UTILIZATIONbecause of preliminary data, security classifica- PUBLICATIONS: Information on technologytion, or other reasons, used by NASA that may be of particular
interest in commercial and other non-aerospaceCONTRACTOR REPORTS: Scientific and applications. Publications include Tech Briefs,technical information generated under a NASA Technology Utilization Reports and Notes,contract or grant and considered an important ^ Technology Surveys.contribution to existing knowledge.
Details on the availability of these publications may be obtained from:
SCIENTIFIC AND TECHNICAL INFORMATION DIVISION
NATIONAL AERONAUTICS AND SPACE ADMINISTRATIONWashinston, D.C. 20546
NATIONAL AERONAUTICS AND SPACE ADMINISTRATION
WASHINGTON, D. C. 20546
OFFICIAL BUSINEtiS
, I ,1
! ,I
FIRST CLASS MAIL
. ,i 'i; (', ; i .
POSTAGE AND FEES PAID NATIONAL AERONAUTICS AND
SPACE ADMINISTRATION
POSTMASTER: If Undeliverable (Section 158 Postal Manual) Do Not Return
1fT he aeronautical and space activities of the United States shall be condllcted so as to contribllte ... to the expansi01z of human knowledge of phenomena in the atmosphere and space. The Administrati01z shall provide for the widest practicable alzd appropriate dissemination of information concerning its acti1Jities and the results thereof."
-NATIONAL AERONAUTICS AND SPACE ACT OF 1958
NASA SCIENTIFIC AND TECHNICAL PUBLICATIONS
TECHNICAL REPORTS: Scientific and technical information considered important, complete, and a lasting contribution to existing knowledge ..
TECHNICAL NOTES: Information less broad in scope but nevertheless of importance as a contribution to existing knowledge.
TECHNICAL MEMORANDUMS: Information receiving limited distribution because of preliminary data, security classification, or other reasons.
CONTRACTOR REPORTS: Scientific and technical information generated under a NASA contract or grant and considered an important contribution to existing knowledge.
TECHNICAL TRANSLATIONS: Information published in a foreign language considered to merit NASA distribution in English.
SPECIAL PUBLICATIONS: Information derived from or of value to NASA activities. Publications include conference proceedings, monographs, data compilations, handbooks, source books, and special bibliographies.
TECHNOLOGY UTILIZATION PUBLICATIONS: Information on technology used by NASA that may be of particular interest in commercial and other non-aerospace applications. Publications include Tech Briefs, Technology Utilization Reports and Notes, and Technology Surveys.
Details on the availability of these publications may be obtained from:
SCIENTIFIC AND TECHNICAL INFORMATION DIVISION
NATIONAL AERONAUTICS AND SPACE ADMINISTRATION Washington, D.C. 20546