Fouling mechanisms of dairy streams during membrane distillation Angela Hausmann a,b , Peter Sanciolo a , Todor Vasiljevic b , Mike Weeks c , Karin Schroën d , Stephen Gray a , Mikel Duke a,n a Institute for Sustainability and Innovation, College of Engineering and Science, Victoria University, P.O. Box 14428, Melbourne, Victoria 8001, Australia b Advanced Food Systems Research Unit, College of Health and Biomedicine, Victoria University, P.O. Box 14428, Melbourne, Victoria 8001, Australia c Dairy Innovation Australia Ltd., Werribee, Victoria 3030, Australia d Food Process Engineering Group, Department of Agrotechnology and Food Sciences, Wageningen University, PO Box 8129, 6700 EV, Wageningen, The Netherlands article info Article history: Received 21 December 2012 Received in revised form 14 February 2013 Accepted 20 March 2013 Available online 6 April 2013 Keywords: Membrane distillation Dairy processing Membrane fouling Infrared microscopy Reflectometry abstract This study reports on fouling mechanisms of skim milk and whey during membrane distillation (MD) using polytetrafluoroethylene (PTFE) membranes. Structural and elemental changes along the fouling layer from the anchor point at the membrane to the top surface of the fouling layer have been investigated using synchrotron IR micro-spectroscopy and electron microscopy with associated energy dispersive X-ray spectroscopy (EDS). Initial adhesion of single components on a membrane representing a PTFE surface was observed in-situ utilizing reflectometry. Whey components were found to penetrate into the membrane matrix while skim milk fouling remained on top of the membrane. Whey proteins had weaker attractive interaction with the membrane and adhesion depended more on the presence of phosphorus near the membrane surface and throughout to establish the fouling layer. This work has given detailed insight into the fouling mechanisms of MD membranes in major dairy streams, essential for maintaining membrane distillation as operational for acceptable times, therewith allowing further development of this emerging technology. & 2013 Elsevier B.V. All rights reserved. 1. Introduction Membrane distillation (MD) is a thermally driven membrane process and relies on a highly hydrophobic porous membrane to maintain a liquid–vapour interface. Common membrane materials for MD are polypropylene (PP), polyvinylidene fluoride (PVDF) and PTFE [1,2]. The highest performing membrane material for MD is PTFE due to its high hydrophobicity, chemical inertness and open porous structure [3]. Fouling in the MD process is different to that observed in pressure driven processes such as RO. The low operating pressure used in MD may potentially lead to a less compact, more easily removed, fouling layer. Also, since only volatile compounds pass through the membrane pores, the poten- tial for in-pore fouling is minimized in MD applications. Studies of MD processes have, however, revealed that penetration of foulants into the membrane can occur in some instances [4]. There is a need for a better understanding of how dairy components interact with MD membranes and accumulate at the membrane surface. This understanding may allow better control of performance of membrane distillation via better mitigation of fouling. The high hydrophobicity of MD membranes can result in the establishment of hydrophobic interactions between the mem- brane and any solutes that have hydrophobic components, such as proteins and fats. While hydrophilic coatings may be a possible avenue to reduce the fouling that results from these hydrophobic interactions [5–7], simple uncoated membranes have advantages in terms of lower cost and can be easier to manage over time as there is no requirement to maintain a specialised surface coating. There are numerous studies on fouling phenomena occurring with dairy components [8–13], however little can be found on the actual mechanisms behind the fouling. Most studies focus on membrane performance, not investigating kinetics behind fouling phenomena observed. In cases where fouling layer compositions have been studied, analyses focus on the average composition of the surface deposits or visualizing the top surface deposits, but not on the underlying deposit layers. For those studies that did investigate cross-sections of fouling layers [10,14], no elemental or structural analysis has been conducted leading to an incomplete understanding of the deposition kinetics of dairy foulants. In particular, dairy fouling studies on hydrophobic membranes as used for MD are almost non-existent. This work not only describes fouling phenomena observed during MD but also identifies the underlying chemistry consider- ing the kinetics of the fouling layer buildup, with a focus on Contents lists available at SciVerse ScienceDirect journal homepage: www.elsevier.com/locate/memsci Journal of Membrane Science 0376-7388/$ - see front matter & 2013 Elsevier B.V. All rights reserved. http://dx.doi.org/10.1016/j.memsci.2013.03.043 n Corresponding author. Tel.: +61 3 9919 7682. E-mail address: [email protected] (M. Duke). Journal of Membrane Science 441 (2013) 102–111
Transcript
Journal of Membrane Science 441 (2013) 102–111
Contents lists available at SciVerse ScienceDirect
Journal of Membrane Science
0376-73http://d
n CorrE-m
journal homepage: www.elsevier.com/locate/memsci
Fouling mechanisms of dairy streams during membrane distillation
Angela Hausmann a,b, Peter Sanciolo a, Todor Vasiljevic b, Mike Weeks c, Karin Schroën d,Stephen Gray a, Mikel Duke a,n
a Institute for Sustainability and Innovation, College of Engineering and Science, Victoria University, P.O. Box 14428, Melbourne, Victoria 8001, Australiab Advanced Food Systems Research Unit, College of Health and Biomedicine, Victoria University, P.O. Box 14428, Melbourne, Victoria 8001, Australiac Dairy Innovation Australia Ltd., Werribee, Victoria 3030, Australiad Food Process Engineering Group, Department of Agrotechnology and Food Sciences, Wageningen University, PO Box 8129, 6700 EV, Wageningen, TheNetherlands
a r t i c l e i n f o
Article history:Received 21 December 2012Received in revised form14 February 2013Accepted 20 March 2013Available online 6 April 2013
This study reports on fouling mechanisms of skim milk and whey during membrane distillation (MD)using polytetrafluoroethylene (PTFE) membranes. Structural and elemental changes along the foulinglayer from the anchor point at the membrane to the top surface of the fouling layer have beeninvestigated using synchrotron IR micro-spectroscopy and electron microscopy with associated energydispersive X-ray spectroscopy (EDS). Initial adhesion of single components on a membrane representinga PTFE surface was observed in-situ utilizing reflectometry. Whey components were found to penetrateinto the membrane matrix while skim milk fouling remained on top of the membrane. Whey proteinshad weaker attractive interaction with the membrane and adhesion depended more on the presence ofphosphorus near the membrane surface and throughout to establish the fouling layer. This work hasgiven detailed insight into the fouling mechanisms of MD membranes in major dairy streams, essentialfor maintaining membrane distillation as operational for acceptable times, therewith allowing furtherdevelopment of this emerging technology.
& 2013 Elsevier B.V. All rights reserved.
1. Introduction
Membrane distillation (MD) is a thermally driven membraneprocess and relies on a highly hydrophobic porous membrane tomaintain a liquid–vapour interface. Common membrane materialsfor MD are polypropylene (PP), polyvinylidene fluoride (PVDF) andPTFE [1,2]. The highest performing membrane material for MD isPTFE due to its high hydrophobicity, chemical inertness and openporous structure [3]. Fouling in the MD process is different to thatobserved in pressure driven processes such as RO. The lowoperating pressure used in MD may potentially lead to a lesscompact, more easily removed, fouling layer. Also, since onlyvolatile compounds pass through the membrane pores, the poten-tial for in-pore fouling is minimized in MD applications. Studies ofMD processes have, however, revealed that penetration of foulantsinto the membrane can occur in some instances [4]. There is aneed for a better understanding of how dairy components interactwith MD membranes and accumulate at the membrane surface.This understanding may allow better control of performance ofmembrane distillation via better mitigation of fouling.
ll rights reserved.
The high hydrophobicity of MD membranes can result in theestablishment of hydrophobic interactions between the mem-brane and any solutes that have hydrophobic components, suchas proteins and fats. While hydrophilic coatings may be a possibleavenue to reduce the fouling that results from these hydrophobicinteractions [5–7], simple uncoated membranes have advantagesin terms of lower cost and can be easier to manage over time asthere is no requirement to maintain a specialised surface coating.
There are numerous studies on fouling phenomena occurringwith dairy components [8–13], however little can be found on theactual mechanisms behind the fouling. Most studies focus onmembrane performance, not investigating kinetics behind foulingphenomena observed. In cases where fouling layer compositionshave been studied, analyses focus on the average composition ofthe surface deposits or visualizing the top surface deposits, but noton the underlying deposit layers. For those studies that didinvestigate cross-sections of fouling layers [10,14], no elementalor structural analysis has been conducted leading to an incompleteunderstanding of the deposition kinetics of dairy foulants. Inparticular, dairy fouling studies on hydrophobic membranes asused for MD are almost non-existent.
This work not only describes fouling phenomena observedduring MD but also identifies the underlying chemistry consider-ing the kinetics of the fouling layer buildup, with a focus on
A. Hausmann et al. / Journal of Membrane Science 441 (2013) 102–111 103
the initial adhesion reactions and fouling compositional profiles.Such exploration and understanding of fouling mechanisms iscritical to successfully introduce MD systems to dairy operations,and in particular for the development of effective cleaning andantifouling strategies.
Table 1Compositions of powders used in this study, supplier information (all in %).
2.1. Direct contact membrane distillation (DCMD) system
The equipment used to test DCMD with dairy solutions isshown in Fig. 1. PTFE flat-sheet membranes (Ningbo Chanqi,China) of 0.5 μm nominal pore size and about 20 μm thickness,with a woven (scrim) polypropylene support were used in alaboratory scale Osmonics SEPA CF module (GE Osmonics,Minneapolis, MN, USA) housing providing an effective membranearea of 0.014 m2. A peristaltic pump with two heads provided asteady flow on both, feed and permeate, sides. On the permeate side,cold stripping water was circulated to provide the temperaturedifference and to allow vapour condensation on the cold side. Allfour inlet and outlet temperatures were measured as well as bothinlet pressures. Flux was measured by continuously and automati-cally recording permeate weight gain in the closed circuit.
A new membrane was used for each experiment and perfor-mance was benchmarked under standardized conditions: 54 1Cfeed in, 5 1C permeate in, flow of 0.047 m s−1 (200 mL/min) onboth sides of the membrane. The feed temperature was limited to54 1C in order to avoid effects of protein denaturation as wheyproteins start to unfold at temperatures higher than 60 1C [15]. Arelatively low flow rate was chosen to ensure the feed pressurenever exceeded 10 kPa to exclude any effect from an increasingpressure. Moderate increases in pressure have been shown tocompress PTFE MD membranes [16] that led to reduced flux, but itwas not expected to be significant in these experiments becausethe pressure was never observed to go beyond 10 kPa. Deionised
Fig. 1. Laboratory scale DCMD set-up for
water was used for benchmarking and flux recorded after a 1 hstabilization phase. Operating conditions for experiments werekept consistent with benchmarking parameters.
As hydrophobic membrane distillation membranes are verysensitive to fat [17,18], the dairy systems tested in this paper werevery low in fat: o0.1 % for skim milk and whey. Reconstitutedpowder dispersions were prepared from commercial samplesobtained from a local supplier and composition shown in Table 1.These preparations were tested at 20% total solids dispersed indeionised water. To prevent microbial growth, 0.2 g L−1 of sodiumazide (Sigma-Aldrich, St Louis, USA) was added to the feed solution.Every test was carried out for an extended period of time (∼20 h)which is a targeted runtime in the dairy industry where dailycleaning is necessary due to microbial growth.
2.2. Wet-chemistry analyses of fouling layers
To analyse the composition of fouling layers after experiments,the membranes were cut into 14 cm2 strips and soaked in 2 ml ofdeionised water overnight at 50 1C. The membrane surface wasthen scraped with a surgical blade to remove all matter remainingon the membrane into the original soaking water. The resultingsolution was left at 50 1C again until all particulates were dis-solved. After this removal procedure there was no visible foulingleft on the membrane and no visible particles in the soaking water.The concentration of foulant compounds per cm2 of membranewas calculated from the concentration in the soaking waterdetermined by the analytical methods described below.
operation at constant concentration.
A. Hausmann et al. / Journal of Membrane Science 441 (2013) 102–111104
2.2.1. Lactose HPLCLactose in the fouling layer samples was detected by a HPLC
system (Shimadzu, Kyoto, Japan) as reported elsewhere [19].For this, 900 μl samples were filtered through 0.45 μm syringefilter into HPLC sample bottles. An Agilent Zorbax Carbohydratecolumn and a light-scattering detector were used. The flow ratewas set to 1.4 ml per minute, the mobile phase consisted of 75%acetonitrile and 25% HPLC grade water. Standards of 0.05, 0.1, 0.2,0.5, 1 and 2% lactose were run to produce a calibration curve. Theinjection volume was 10 μl.
Fouling layer samples were analysed for selected cations(K+, Na+, Ca2+, Mg2+, P) using a Shimadzu ICP E-9000 unit (Kyoto,Japan). Samples containing a high amount of proteins weresubjected to a wet-digestion step prior to ICP-analysis as sug-gested by Kira and Maihara [20]. Aliquots of 100 μL of sample weremixed with 1 mL of HNO3 (65% v/v) and heated to boilingtemperature for at least an hour or until de-coloration occurredleaving a clear solution as evidence of organics being fullydigested. The digested sample and 10 mL of HNO3 (5%) weretransferred into a volumetric flask and filled to the standardvolume using deionised water to dilute samples as needed toachieve a total solids concentration below 0.1%. Samples notcontaining organics were acidified using the same amount ofHNO3 but were not subjected to a digestion step. All sampleswere filtered through a 0.45 μm syringe filter into ICP samplebottles. All calibration solutions were prepared using standardsolutions for each element following a dilution scheme to establisha calibration curve for each mineral.
2.2.3. Total organic carbon (TOC) and total nitrogen analysis (TN)Samples were analysed for total organic carbon and total
nitrogen using a Total Organic Carbon and Total Nitrogen Analyzer(Shimadzu VCSH). Sample preparation only involved dilution tobelow 100 ppm of carbon. For total nitrogen analysis samplesneeded to be diluted below 50 ppm of nitrogen. Standard solutionsof 100 ppm potassium hydrogen phthalate (KHP) for TOC and50 ppm potassium nitrate (KNO3) for TN analysis were used toconfirm the original calibration. To convert the nitrogen reading tomilk protein, the nitrogen measurement was multiplied by aKjeldahl factor of 6.38 [21]. This is equivalent to the Kjeldahlmethod which is officially recognised as a standard referencemethod in food science and technology [22].
2.3. Fouling layer cross section analysis
2.3.1. Scanning electron microscopy (SEM), coupled with energydispersion spectrometry (EDS)
The morphology of the fouling layers after MD testing wasstudied using a bench-top SEM (Nikon/JEOL Neo-Scope JCM-5000,Melville, NY) applying a voltage of 10 kV and using a secondaryelectron detector. Study of the changes in elemental compositionalong the fouling layers from the anchor point at the membrane tothe top of the fouling layer was performed using a SEM coupledwith energy dispersion spectrometry (EDS). This analysis wascarried out from the surface by observing inside the cracksof the fouling layer which occurred as a result of the drying step.This conveniently excluded artifacts due to sample preparation.Samples were dried in a vacuum oven overnight and 2 min goldcoated for conventional SEM and platinum coated for SEM–EDSanalysis. Cross-sections were prepared by a cryo-snap method[23]. The membrane pores were hydrated using ethanol, thenethanol was replaced by water and the membrane strip placed
into a flint glass test tube which was then submerged in liquidnitrogen for 5 min before freeze snapping the glass tube with thefully hydrated membrane inside. The cleaved membranes stillembedded in ice were then dried as described earlier. Embeddingthe membrane in a continuous matrix of water/ice during fractur-ing reduces artifacts.
2.3.2. ReflectometryReflectometery is an optical measurement for component
adhesion on even surfaces. The principle and detailed method ofthis technique are explained in detail elsewhere [24,25]. Strips ofprime grade 150 mm silicon wafers type P/B with ⟨1−0−0⟩ orien-tation (WaferNet Inc., San Jose, CA, USA) were cleaned withethanol, dried and spin-coated (30 s, 2500 rpm) with an amor-phous fluoropolymer (DuPont Teflon AF). To ensure full vaporisa-tion of volatiles from the Teflon solution coating, silicon stripswere heated to 350 1C for at least 1 h. The Teflon coatingrepresents the membrane material and uniform thickness of thecoating was checked by computer controlled null ellipsometry(Sentech instruments Gmbh). The coated silicon strips were theninserted into the measurement cell of the reflectometer. Buffer andfouling solutions entered the cell directly onto the Teflon surfacevia gravity feeding and were removed by overflowing from thecell. All experiments were carried out at flow rates between0.8 and 1.2 mL min−1. Fouling solutions need to be of low con-centration for this analysis due to the laser passing through thesolution. They were prepared by dissolving 1 g l−1 of the respectivefoulant in a phosphate buffer at pH 7 to reproduce conditions ofthe natural dairy streams.
A linearly polarized He/Ne laser beam entered the measure-ment cell through a 451 glass prism and left the cell through asecond 451 prism. It was split into its parallel and perpendicularcomponents by a polarizing beam splitter, intensities of thenormal and parallel components were recorded over time. Theintensity change of the reflected polarized laser was convertedto adsorbed amounts using a 5-layer matrix model [26,27].This model requires the thickness of the polymer layer andrefractive indices of the various layers, as determined by ellipso-metry (see above). For the silicon substrate, a refractive index of3.85 with imaginary part 0.02 was used [25] and the refractiveindex used for the PTFE top layer was 1.35. A refractive indexincrement (dn/dc) of 0.187 was used for whey proteins and 0.207for caseins [28,29].
2.3.3. Synchrotron infrared microscopyInfrared spectroscopy at the Australian Synchrotron was used
to map organic sub-layers of the fouling layer. To allow forexamination in transmission mode, samples were cut thin enoughfor the beam to pass through the sample. This was done atHawthorn Histology, Melbourne, by embedding the fouled mem-branes in paraffin, microtoming to 10 μm thick sections andsubsequent fusing of the thin sections on CaF2 windows (CrystranLtd, UK) at 60 1C to enable effective transmission analysis of themembrane and fouling layers.
3. Results and discussion
3.1. Fouling development over time
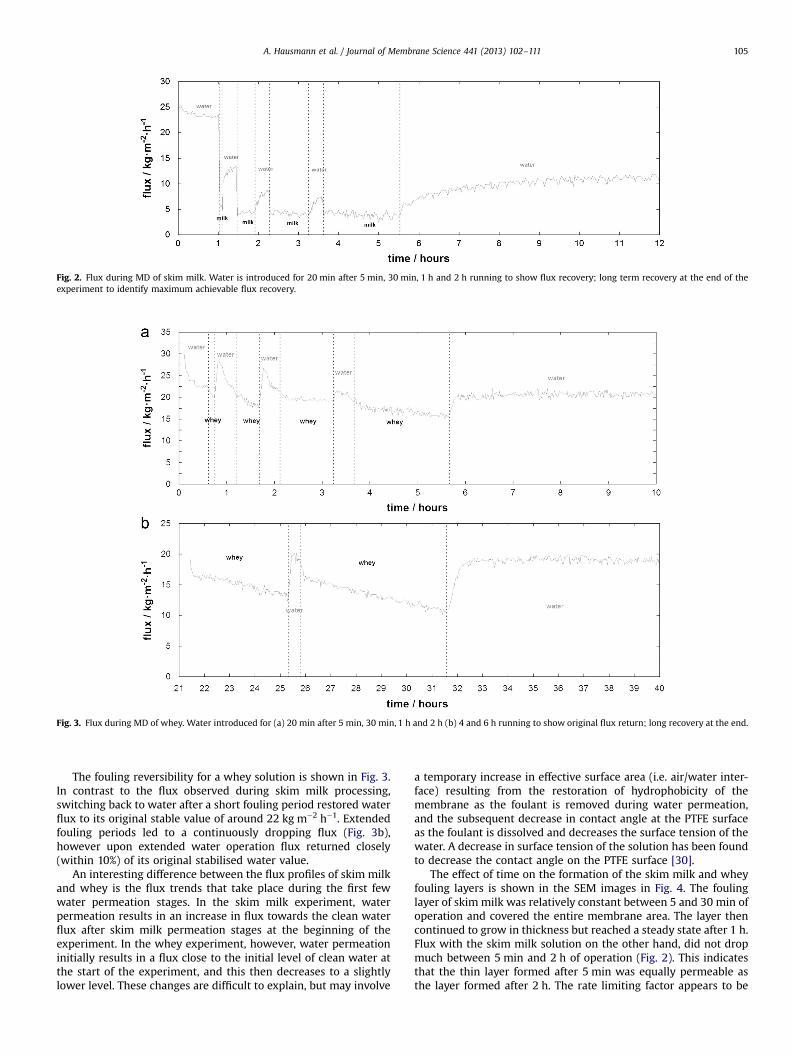
Fouling reversibility during periodic switching from skim milkto water during MD treatment is shown in Fig. 2. Flux declineduring skim milk treatment occurred rapidly (within minutes) andflux recoveries were only partial within 30 min of processing withwater. Even after long recovery periods (i.e. hours) in pure water,flux only returned to about 50% of the original pure water value.
Fig. 2. Flux during MD of skim milk. Water is introduced for 20 min after 5 min, 30 min, 1 h and 2 h running to show flux recovery; long term recovery at the end of theexperiment to identify maximum achievable flux recovery.
Fig. 3. Flux during MD of whey. Water introduced for (a) 20 min after 5 min, 30 min, 1 h and 2 h (b) 4 and 6 h running to show original flux return; long recovery at the end.
A. Hausmann et al. / Journal of Membrane Science 441 (2013) 102–111 105
The fouling reversibility for a whey solution is shown in Fig. 3.In contrast to the flux observed during skim milk processing,switching back to water after a short fouling period restored waterflux to its original stable value of around 22 kg m−2 h−1. Extendedfouling periods led to a continuously dropping flux (Fig. 3b),however upon extended water operation flux returned closely(within 10%) of its original stabilised water value.
An interesting difference between the flux profiles of skim milkand whey is the flux trends that take place during the first fewwater permeation stages. In the skim milk experiment, waterpermeation results in an increase in flux towards the clean waterflux after skim milk permeation stages at the beginning of theexperiment. In the whey experiment, however, water permeationinitially results in a flux close to the initial level of clean water atthe start of the experiment, and this then decreases to a slightlylower level. These changes are difficult to explain, but may involve
a temporary increase in effective surface area (i.e. air/water inter-face) resulting from the restoration of hydrophobicity of themembrane as the foulant is removed during water permeation,and the subsequent decrease in contact angle at the PTFE surfaceas the foulant is dissolved and decreases the surface tension of thewater. A decrease in surface tension of the solution has been foundto decrease the contact angle on the PTFE surface [30].
The effect of time on the formation of the skim milk and wheyfouling layers is shown in the SEM images in Fig. 4. The foulinglayer of skim milk was relatively constant between 5 and 30 min ofoperation and covered the entire membrane area. The layer thencontinued to grow in thickness but reached a steady state after 1 h.Flux with the skim milk solution on the other hand, did not dropmuch between 5 min and 2 h of operation (Fig. 2). This indicatesthat the thin layer formed after 5 min was equally permeable asthe layer formed after 2 h. The rate limiting factor appears to be
Skim
milk
Whe
y
5min 30min 1 hour 2 hours
5min 30min 1 hour
2 hours 4 hours 6 hours
Membrane
Membrane
Fouling
Fouling
Thickness
Thickness
Membranein crack
Membrane
Fouling
Membraneshining through
Membrane Fouling
Fouling
Membrane
Membrane
Membrane
FoulingFouling
Fig. 4. SEM of skim milk fouled membranes (top) from left to right: 5 min fouling, 0.5 h, 1 h, 2 h and whey fouled membranes (bottom): 5 min fouling, 0.5 h, 1 h, 2 h, 4 and 6 h.
A. Hausmann et al. / Journal of Membrane Science 441 (2013) 102–111106
the limited surface area exposed to water due to the low porosityof the fouling layer or also reduced vapour pressure due to thehigher solids content of the fouling layer. Extended build up of thefouling layer seems to lead to increased resistance for watertransport to the surface, but this seems to be small compared tothe limitation of the evaporation area. Whey fouling on the otherhand started with patches on the membrane that developed to alayer that covered the entire membrane surface after 6 h ofoperation. The fouling layer grew in terms of surface area covered,whereas skim milk fouling layer was more homogenous from thebeginning and developed in thickness, and this can also explainthe observed differences in flux reduction (rate).
Changes in composition of the collected fouling layer for skimmilk and whey fouled membranes over time are shown in Fig. 5.Skim milk fouling appears to have occurred in different stages.First, caseins and salts deposited on the membrane surface, whilelactose was only detected after longer fouling times. Proteindeposition was higher for skim milk at all fouling stages, howeverprotein content of the fouling layer increased substantially after30 min of fouling, whereas whey fouled membranes showed agradual rise in protein concentration initially with a great accu-mulation between 2 and 4 h. Also, the ratio between the threemajor components did not change as substantially during wheyfouling. Salts were found to deposit faster than lactose which isconsistent with the skim milk samples.
Overall, whey flux decline appeared to follow the growth of thefouling layer and increased deposited amount of solids, flux istherefore controlled by diffusion resistance in this layer. Howeverfor skim milk, the total deposited amount does not correlate withthe observed differences in flux. Compared to whey, the foulinglayer was thinner but flux was much lower, especially in the firstfew minutes. As described above, we could explain this differencedue to either a denser fouling layer or also reduced vapour
pressure associated with the concentrated solids. Since the skimmilk fouling layer grew continuously over 2 h (Figs. 4 and 5) andthe increase in thickness had an insignificant effect on flux (Fig. 2),it suggests that diffusion resistance did not govern the flux declineas it was for whey. Water vapour pressure reduction dueto dried material at the membrane surface is not linked to thethickness of fouled substance so it is possible that dry foulingsubstance influenced the flux independently to thickness. Unco-vering the separate properties of vapour pressure of fouling layersand linking this to membrane performance is subject of ourongoing work in this area.
During fouling development of whey, the amount of proteinand salt at very early stages was almost equal. This was followedwith greater amounts of protein accumulation in the fouling layerwhile the salt concentration increased only slightly. Table 1 showsthe mineral composition of the fouling layers with time. The keyminerals involved in deposition were calcium and phosphorus,however they appeared to play a more significant role in skim milkfouling than in whey fouling. For skim milk, the high calcium andphosphorus content can be explained by the nature of caseins inskim milk. These proteins are present in the form of micelles,which contain colloidal calcium phosphate via calcium ion bound-ing to phosphoserine residues of these proteins [31]. For the whey,the considerable calcium and phosphorus content of the foulinglayer suggests that protein adsorption involves calcium andphosphate interaction with the protein and/or with the mem-brane. The negative charge of PTFE can lead to charge interactionwith salts [32]. Once a layer of proteins had formed, the wheyproteins could interact with each other via salt bridging with fewsalts adsorbed onto the membrane surface. Generally, wheyproteins are known to aggregate at a high concentration—acondition which occurs near the membrane and is further influ-enced by temperature and pH [33] (Table 2).
0
100
200
300
400
500
600
skim milk
skim milk
skim milk
skim milk
5 min 30 min 1 hour 2 hours
whey5 min
whey30 min
whey1 hour
whey2 hours
whey4 hours
whey6 hours
Foul
ing
laye
r spe
cific
mas
s (μ
g/cm
2 )
Protein Lactose Minerals
Fig. 5. Changes in composition of fouling layer developing over time.
Table 2Mineral content of fouling layers developing over time.
Sample name Concentration [all in μg/cm2]
Ca K Mg Na P
Skim milk—5 min 7 1 0 2 1Skim milk—30 min 6 1 0 0 1Skim milk—1 h 39 5 3 7 17Skim milk—2 h 74 8 3 5 41
Whey—5 min 4 1 0 0 0Whey—30 min 4 2 0 4 0Whey—1 h 6 2 1 4 0Whey—2 h 13 3 0 2 1Whey—4 h 20 12 1 5 5Whey—6 h 32 13 1 5 6
A. Hausmann et al. / Journal of Membrane Science 441 (2013) 102–111 107
3.2. Initial adhesion
Proteins are known to adsorb on hydrophobic surfaces due totheir hydrophobic or amphoteric character [34–36]. As shown inFig. 5, the fouling layer largely consisted of proteins. The extentand rate of adsorption appeared to be governed by the nature andtype of dairy proteins and the presence of calcium phosphate.An insight into adsorption behaviour of the individual dairyproteins and their combinations onto the PTFE surface was gainedvia the use of reflectometry.
To further elucidate complex protein fouling mechanisms ofmilk, the rate and extent of adsorption of the three casein groupspresent in milk is shown in Fig. 6: α-, including both αs1 and αs2casein, β- and κ-casein, individually and in pairs. All three caseinsexhibited different adsorption behaviour. Κ-Casein was found toadsorb faster than the other caseins, while αs-casein was found toabsorb the slowest and to the least extent. β-Casein was also slow toadsorb, but it adsorbed to a greater extent than the other twocaseins. Combining two casein groups greatly accelerated overalldeposition and resulted in fastest adsorption rates when combinedwith κ-casein. The final adsorbed amount was in between that ofthe respective single caseins. When all three caseins were com-bined, however, the rate and extent of adsorption was less thanfor the paired combinations. This is consistent with the formation ofa more stable mixed casein micelle when the three caseins arepresent, which does not adsorb as readily. Micelles in milk suspen-sions are stabilized by the presence of k-casein on the surface of the
micelle where it functions as an interface between the hydrophobiccasein micelle interior and the aqueous environment [37].
Whey proteins as shown in Fig. 7 adsorbed more slowly andresulted in lower adsorbed amounts compared to single caseins.Bovine serum albumin (BSA) led to lowest adsorbed amount,α-lactalbumin (α-La) was the slowest to adsorb to the PTFE surface,whereas β-lactoglobulin (β-Lg) showed the fastest and highestadsorption amongst the single proteins. It has been previouslyshown that β-Lg contributes more to membrane fouling than α-Ladue to the ability of β-Lg to form protein sheets on the membranesurface [38]. All combinations of two whey proteins reachedslightly higher total adsorbed amounts than individual wheyproteins. Also, the combination of α-La and BSA accelerateddeposition, and was faster than respective single proteins. Thetotal deposition amount was only slightly increased when all wheyproteins were combined together compared to the combination ofα-La and β-Lg, but the adsorption rate was much faster. In contrastto the situation with caseins where the combination of all thecaseins appeared to lead to the formation of a more stable mixedmicelle which does not adsorb as readily, the combination of thedifferent whey proteins seemed to decrease the stability of theprotein solution, thereby increasing adsorption rate and extent.
3.3. Fouling layer cross section analysis
3.3.1. SEM imagingSEM pictures of the membranes cross-sections are shown in
Fig. 10 with a new PTFE membrane on the left, a skim milk fouledmembrane including the fouling layer in the middle and a wheyfouled membrane on the right hand side (Fig. 8).
The uniform skim milk fouling layer has not obviously penetratedinto the membrane structure, whereas some membrane fibres can bedetected in the whey fouling layer at its transition point to themembrane. This indicates that the whey fouling layer did not remainon the membrane surface but penetrated at least partly into the webstructure of the membrane, thereby reducing its porosity. The thick-ness of the observed fouling layer was found to be much thinner forskim milk with a fouling layer of around 25 μm, while the wheycovered the membrane with an approximately 40 μm thick layer.Despite the thicker whey fouling layer after 18 h of operation, fluxes ofthe membranes were similar (results not shown). Whey showed aslower interaction with the surface and although thicker, it maynot be as densely packed and can still facilitate water flux to theliquid-vapour interface at the membrane surface. This is confirmed by
Fig. 6. Adsorbed amount and adsorption rate of caseins on a PTFE coating. CN¼casein.
Fig. 7. Adsorbed amount (bars) and adsorption rate (line) of whey proteins on a PTFE coated surface determined by reflectometry. BSA¼Bovine serum albumin, β-LB¼beta-lactoglobulin, α-LA¼alpha-lactalbumin, WPI¼whey protein isolate.
Fig. 8. Left: unused PTFE membrane (control); middle: skim milk fouled membrane cross-section; right: cross-section of whey fouling layer after 20 h of operation.
A. Hausmann et al. / Journal of Membrane Science 441 (2013) 102–111108
the mass per cm3 of the fouling layer which results in 0.33 g/cm3 forskim milk and only 0.13 g/cm3 for whey.
3.3.2. Elemental scanElemental analysis of the cross-section of the membrane and
fouling layer gives insight into which components are located
close to the membrane surface or even inside the membrane fibrestructure and which deposit on top of this initial layer. Anelemental scan using SEM–EDS was performed as a surfaceanalysis by focusing on cracks of the fouling layer which occurredas a result of the drying step. This enabled exclusion of any artefactdue to sample preparation as compared to a sectioning procedure.As shown in Fig. 9 for the skim milk fouling layer, calcium
Fig. 9. SEM–EDS elemental scan of fouled PTFE membranes after DCMD, left: after skim milk operation, right: after whey operation. Bottom rows show separate distributionof the following elements; from left to right: fluorine, nitrogen, calcium and phosphorus.
Fig. 10. IR line scan along cross-section of membrane and fouling layer, (A) skim milk, (B) whey; showing peak intensity of functional groups: 1218 cm−1 indicating PTFE,1080 cm−1 indicating lactose, 1049cm-1 indicating CaP, 1640 cm−1 and 1550 cm−1 indicating proteinaceous matter; A.U.¼arbitrary units.
A. Hausmann et al. / Journal of Membrane Science 441 (2013) 102–111 109
and phosphorus showed very similar distribution towards themembrane sided edge of the crack which could be due to thecasein micelles in skim milk containing phosphorus and calciumwhich work together to form the fouling layer. For the wheyfouling layer, on the other hand, calcium was barely present at themembrane but clearly concentrated at the outer edge of the crackwithin the fouling layer, whereas phosphorus was also present atthe membrane sided edge of the crack representing the membranefouling layer interface. Whey does not contain phospho-proteinscontributing to a uniform distribution of these two minerals. Thefluorine map relates to the membrane material. The sharperdecline in intensity of fluorine for skim milk fouled membranessupports the observation via SEM images that whey anchored
inside the membrane web-structure, while skim milk fouling didnot anchor as strongly into the membrane pores. The occurrenceof minerals inside the membrane structure after MD is in line withfindings by Gryta [4] who reported salt deposition inside mem-branes after DCMD of wastewater.
3.3.3. Synchrotron infrared microscopyUsing synchrotron IR spectroscopy, the multilayered nature of
the dairy fouling layer can be observed from the perspective offunctional groups giving more insight to fouling distributioncaused by organic matter. A line scan derived from an areamap of the analysed membrane cross-sections is shown in
A. Hausmann et al. / Journal of Membrane Science 441 (2013) 102–111110
Fig. 10. The line of the membrane material (PTFE at 1218 cm−1)shows the location of the membrane on the left side of the graph.Relative length on the x-axis is the length across the membrane tofouling layer cross-section. This measure was used as samplesdiffered in actual thickness. The distribution of peaks at wave-number 1550 cm−1 and 1640 cm−1 indicate the distribution ofproteinaceous matter [39,40], confirming that proteins remainedon the membrane surface for skim milk, while for whey an overlapwith the membrane material occurs. These compounds could bedenatured whey proteins interacting with salts or the membraneitself. At wavenumber 1049 cm−1 one single peak occurred whichis assumed to represent calcium phosphate [41,42]. This linescanconfirms SEM–EDS findings, presented above, where calciumphosphate for the skim milk sample was less involved nearer tothe surface. This is also supported by the previous conclusion thatcaseins in skim milk had a stronger interaction with PTFE on theirown, while calcium played a role in accelerating the formation ofthe fouling layer. Instead, the rise in signal for calcium in the skimmilk fouling layer further from the surface in Fig. 10 indicates thatinitial adhesion by proteins can occur when they have a stronginteraction with the membrane polymer, while calcium is involvedin bridging proteins to assemble the complete fouling layer. Also, itis worth pointing out that the calcium phosphate signal by IR wasstronger in the whey fouling layer supporting the concept thatwhey proteins form aggregates at the membrane that may haveincreased ability to bind calcium phosphate due to the exposure offree carboxyl groups [43,44]. These interactions then result ina protein/calcium phosphate complex. These aggregates thenmigrate into the pores bringing calcium into the pores. Thus inthe case of skim milk where less mobile strongly adsorbingproteins were present, they protected the membrane surface fromthis intrusion from calcium.
Lactose absorbs in a similar range as calcium phosphate, howeverwith a double peak at wavenumbers 1075 and 1042 cm−1 [39], asingle peak at 1080 cm−1 has also been associated with lactose [40].In the present study a peak at 1080 cm−1 has been detected and isassumed to be related to lactose. As Fig. 10 demonstrates, lactoseconcentration continually increases within the fouling layer whichconfirms the role of lactose in dairy fouling being related to proteindeposition.
4. Conclusions
This study has shown that skim milk fouling starts with thedeposition of proteins and salts with lactose joining at later foulingstages. In line with this, whey fouling also involved salts andproteins depositing in the early stages. The whey fouling layergrew more consistently in composition, increasing in total deposi-tion amount of all components in similar relative quantities. Also,whey fouling remained reversible for much longer time periodswhile skim milk fouling occurred within a few minutes. Wheyfouling started in patches and grew across the membrane areawhile skim milk formed a homogeneous layer that grew inthickness. Also, the whey fouling layer was less dense than theskim milk layer which can explain differences in flux decline as afunction of time. The results of the adsorption studies suggest thatcaseins adsorb onto the membrane polymer in high amounts andvery quickly and compete for area while whey proteins adsorbmuch slower and need each other to accelerate the adsorptionprocess and to establish a thick layer. During MD of whey, someminerals and proteinaceous material penetrated into the mem-brane fibres while skim milk caseins seemed to form a protectivelayer on the membrane surface. This was attributed to calciumplaying a stronger role on adhesion in the presence of wheyproteins that interacted slower with the membrane. Whey protein
aggregation may be an explanation for these interactions. Thisstudy has uncovered fouling mechanisms during MD of skim milkand whey and future research to explore ways to reduce proteinfouling with these hydrophobic membranes would be of benefit tointroduce this process to dairy processing. Furthermore, theinfluence of operating parameters on fouling mechanisms needsto be explored in order to reduce fouling occurrence.
Acknowledgements
This work was funded by an Australian Research Council LinkageProject (LP0990532) co-funded by Dairy Innovation Australia Ltd.The authors acknowledge the SEM–EDS work by Prof. HuantingWang and Dr. KunWang at the Department of Chemical Engineering,Monash University. We further acknowledge the Australian Synchro-tron for provision of beamtime at the IR beamline and we would liketo thank Dr Mark Tobin for his assistance. We also thank Ian Boundyat Hawthorn Histology for preparing the samples suitable for thesynchrotron IR work.
References
[1] A. Alkhudhiri, N. Darwish, N. Hilal, Membrane distillation: comprehensivereview, Desalination 287 (0) (2012) 2–18.
[2] B. Jiao, A. Cassano, E. Drioli, Recent advances on membrane processes for theconcentration of fruit juices: a review, J. Food Eng. 63 (3) (2004) 303–324.
[3] J. Zhang, N. Dow, M. Duke, E. Ostarcevic, J.-D. Li, S. Gray, Identification ofmaterial and physical features of membrane distillation membranes for highperformance desalination, J. Membr. Sci. 349 (12) (2010) 295–303.
[4] M. Gryta, Fouling in direct contact membrane distillation process, J. Membr.Sci. 325 (1) (2008) 383–394.
[5] A. Chanachai, K. Meksup, R. Jiraratananon, Coating of hydrophobic hollowfiber PVDF membrane with chitosan for protection against wetting and flavorloss in osmotic distillation process, Sep. Purif. Technol., 72 (2) (2010) 217–224.
[6] K.K Sirkar, B. Li, Novel Membrane and Device for Direct Contact MembraneDistillation-Based Desalination Process: Phase II, New Jersey Institute ofTechnology: Newark, New Jersey, 2003.
[7] M. Khayet, T. Matsuura, J.I. Mengual, M. Qtaishat, Design of novel directcontact membrane distillation membranes, Desalination 192 (1–3) (2006)105–111.
[8] A. Piry, W. Kühnl, T. Grein, A. Tolkach, S. Ripperger, U. Kulozik, Lengthdependency of flux and protein permeation in crossflow microfiltration ofskimmed milk, J. Membr. Sci. 325 (2) (2008) 887–894.
[9] S.A. Mourouzidis-Mourouzis, A.J. Karabelas, Whey protein fouling of micro-filtration ceramic membranes—pressure effects, J. Membr. Sci. 282 (1–2)(2006) 124–132.
[10] B.J. James, Y. Jing, X. Dong Chen, Membrane fouling during filtration of milk—amicrostructural study, J. Food Eng. 60 (4) (2003) 431–437.
[11] A.S. Grandison, W. Youravong, M.J. Lewis, Hydrodynamic factors affecting fluxand fouling during ultrafiltration of skimmed milk, Le Lait80 (2000) 165–174.
[12] H. Bouzid, M. Rabiller-Baudry, L. Paugam, F. Rousseau, Z. Derriche, N.E. Bettahar, Impact of zeta potential and size of caseins as precursors offouling deposit on limiting and critical fluxes in spiral ultrafiltration ofmodified skim milks, J. Membr. Sci. 314 (1–2) (2008) 67–75.
[13] A.J.E. Jimenez-Lopez, N. Leconte, F. Garnier-Lambrouin, A. Bouchoux,F. Rousseau, G. Gésan-Guiziou, Ionic strength dependence of skimmed milkmicrofiltration: relations between filtration performance, deposit layer char-acteristics and colloidal properties of casein micelles, J. Membr. Sci. 369 (1–2)(2011) 404–413.
[14] L. Bégoin, M. Rabiller-Baudry, B. Chaufer, C. Faille, P. Blanpain-Avet,T. Bénézech, T. Doneva, Methodology of analysis of a spiral-wound module.Application to PES membrane for ultrafiltration of skimmed milk, Desalination192 (1–3) (2006) 40–53.
[15] H. Sing, P. Havea, Thermal denaturation, aggregation and gelation of wheyproteins, in: P.F. Fox, P.L.H. Mcsweeney (Eds.), Advanced Dairy Chemistry-Proteins Part A, Kluwer Academic, Plenum Publishers, New York, NY, 2003,pp. 1263–1281.
[16] J. Zhang, J.-D. Li, S. Gray, Effect of applied pressure on performance of PTFEmembrane in DCMD, J. Membr. Sci. 369 (12) (2011) 514–525.
[17] A. Chanachai, K. Meksup, R. Jiraratananon, Coating of hydrophobic hollow fiberPVDF membrane with chitosan for protection against wetting and flavor lossin osmotic distillation process, Sep. Purif. Technol. 72 (2) (2010) 217–224.
[18] J.B. Xu, S. Lange, J.P. Bartley, R.A. Johnson, Alginate-coated microporous PTFEmembranes for use in the osmotic distillation of oily feeds, J. Membr. Sci. 240(1–2) (2004) 81–89.
[19] L. Ramchandran, P. Sanciolo, T. Vasiljevic, M. Broome, I. Powell, M. Duke,Improving cell yield and lactic acid production of Lactococcus lactis ssp.
A. Hausmann et al. / Journal of Membrane Science 441 (2013) 102–111 111
cremoris by a novel submerged membrane fermentation process, J. Membr. Sci.403–404 (0) (2012) 179–187.
[20] C.S. Kira, V.A. Maihara, Determination of major and minor elements in dairyproducts through inductively coupled plasma optical emission spectrometryafter wet partial digestion and neutron activation analysis, Food Chem. 100 (1)(2007) 390–395.
[21] C. van der Ven, S. Muresan, H. Gruppen, D.B.A. de Bont, K.B. Merck,A.G.J. Voragen, FTIR spectra of whey and casein hydrolysates in relation totheir functional properties, J. Agric. Food Chem. 50 (24) (2002) 6943–6950.
[22] S. Metsämuuronen, M. Mänttäri, M. Nyström, Comparison of analysis methodsfor protein concentration and its use in UF fractionation of whey. Desalination283 (0) (2011) 156-164.
[23] R.R. Ferlita, D. Phipps, J. Safarik, D.H. Yeh, Cryo-snap: a simple modified freeze-fracture method for SEM imaging of membrane cross-sections, Environ. Prog.27 (2) (2008) 204–209.
[24] C.G.P.H. Schroen, A. Roosjen, K. Tang, W. Norde, R.M. Boom, In situ quantifica-tion of membrane foulant accumulation by reflectometry. J. Membr. Sci. 362(12) (2012) 453–459.
[25] N. Nady, K. Schroën, M.C.R. Franssen, R. Fokkink, M.S. Mohy Eldin, H. Zuilhof,R.M. Boom, Enzyme-catalyzed modification of PES surfaces: reduction inadsorption of BSA, dextrin and tannin. J. Colloid Interface Sci. 378 (1)(2012) 191–200.
[27] J.C. Dijt, M.A.C. Stuart, G.J. Fleer, Reflectometry as a tool for adsorption studies,Adv. Colloid Interface Sci. 50 (0) (1994) 79–101.
[28] P.L.H. McSweeney, P.F. Fox, Advanced Dairy Chemistry: Volume 3: Lactose,Water, Salts and Minor ConstituentsSpringer Science and Business Media,2009.
[29] J.D.S. Goulden, Determination of S.N.F. in milk and unsweetened condensedmilk from refractive index measurements, J. Dairy Res. 30 (03) (1963) 411–417.
[30] R.G. Chaudhuri, S. Paria, Dynamic contact angles on PTFE surface by aqueoussurfactant solution in the absence and presence of electrolytes, J. ColloidInterface Sci. 337 (2) (2009) 555–562.
[31] P.F. Fox, P.L.H. McSweeney, Dairy Chemistry and Biochemistry, Blackie Academic& Professional, London, 1998.
[32] B.A. Jucker, H. Harms, A.J. Zehnder, Adhesion of the positively chargedbacterium Stenotrophomonas (Xanthomonas) maltophilia 70401 to glass andteflon, J. Bacteriol. 178 (18) (1996) 5472–5479.
[33] M.A. de la Fuente, H. Singh, Y. Hemar, Recent advances in the characterisationof heat-induced aggregates and intermediates of whey proteins, Trends FoodSci. Technol. 13 (8) (2002) 262–274.
[34] A. Bottino, G. Capannelli, O. Monticelli, P. Piaggio, Poly(vinylidene fluoride)with improved functionalization for membrane production, J. Membr. Sci. 166(1) (2000) 23–29.
[35] K.J. Howe, M.M. Clark, Fouling of microfiltration and ultrafiltration membranesby natural waters, Environ. Sci. Technol. 36 (16) (2002) 3571–3576.
[36] C. Liu, S. Caothien, J. Hayes, T. Caothuy, T. Otoyo, Membrane ChemicalCleaning: From Art to Science, 2008, 12.2.2009. Available from: ⟨http://www.pall.com/pdf/mtcpaper.pdf⟩.
[37] L.K. Creamer, J.E. Plowman, M.J. Liddell, M.H. Smith, J.P. Hill, Micelle stability:kappa-casein structure and function, J. Dairy Sci. 81 (11) (1998) 3004–3012.
[38] F.A. Glover, Ultrafiltration and reverse osmosis for the dairy industry, vol.,Technical Bulletin 5, Reading: National Institute for Research in Dairying, 1985.
[39] Myrna Solís-Oba, Ogilver Teniza-García, Marlon Rojas-LópezRaúl Delgado-MacuilJoel Díaz-ReyesR. Ruiz1, Application of infrared spectroscopy to themonitoring of lactose and protein from whey after ultra and nano filtrationprocess, J. Mex. Chem. Soc. 55 (3) (2011) 190–193.
[40] C. Grenvall, P. Augustsson, J.R. Folkenberg, T. Laurell, Harmonic microchipacoustophoresis: a route to online raw milk sample precondition in proteinand lipid content quality control, Anal. Chem. 81 (15) (2009) 6195–6200.
[42] A. Ślósarczyk, C.A. Paluszkiewicz, M. Gawlicki, Z. Paszkiewicz, The FTIRspectroscopy and QXRD studies of calcium phosphate based materialsproduced from the powder precursors with different CaP ratios, Ceram. Int.23 (4) (1997) 297–304.
[43] B.T. O'Kennedy, C. Halbert, P.M. Kelly, Formation of whey protein particlesusing calcium phosphate and their subsequent stability to heat, Milchwis-senschaft 56 (11) (2001) 625–628.
[44] C. Halbert, B.T. O'Kennedy, A. Hallihan, P.M. Kelly, Stabilisation of calciumphosphate using denatured whey proteins, Milchwissenschaft 55 (7) (2000)386–389.