Foundations of Comparative Analytics for Uncertainty in Graphs Lise Getoor, University of Maryland Alex Pang, UC Santa Cruz Lisa Singh, Georgetown University Students: MatthiasBroecheler, Hossam Sharara, GalileoNamata, Nathaniel Cesario, AwalinSopan, DenisDimitrov, Katarina Yang
Transcript
Foundations of Comparative Analytics for Uncertainty in Graphs
Lise Getoor, University of Maryland Alex Pang, UC Santa Cruz
Lisa Singh, Georgetown University Students: Matthias Broecheler, Hossam Sharara, Galileo Namata, Nathaniel Cesario, Awalin Sopan, Denis Dimitrov, Katarina Yang
Visual Analytics for Model Comparison - G-Pare - http://www.cs.umd.edu/projects/linqs/gpare
2
PSL Foundations
3
• Declarative language based on logic to express collective probabilistic inference problems
• Probabilistic Model Undirected graphical model Constrained Continuous Markov Random Field (CCMRF)
• Key distinctions Continuous-valued random variables Efficiently compute similarity & propagate similarity Ability to efficiently reason about sets and aggregates
What is PSL Good for? Specifying probabilistic models for:
- Information Alignment - Information Fusion - Information Diffusion
Some examples: - Entity resolution - Link prediction - Collective Classification
4
Example Voter Opinion Modeling
drive(B,M) ∧ popular-car(M,P) vote(B,P) : 0.7
vote(A,P) ∧ friend(B,A) vote(B,P) : 0.8
spouse
spouse
colleague
colleague
spouse friend
friend
friend
friend
PSL Rules
Atoms are real valued [0,1] Value of rule given by Lukasiewicz t-norm
- a ˅ b = min(1, a + b) - a ᴧ b = max(0, a + b -1)
Every ground rule in a PSL program is a feature in a CCMRF Each rule associated with a weight (parameter
of CCMRF)
B1 ^ B2 ^... ^ Bn ⇒ H1 v…v Hm
6
Constrained Continuous MRF (CCMRF)
7 7
:
RVs Range of RVs Domain of MRF
:
features
;
Parameters
Joint Probability
PSL Inference
8
CCMRF translates to a conic program in which: MAP inference is tractable (O(n3.5)) using off-the-shelf
interior point methods (IPM) optimization packages [Broecheler et al. UAI 2010]
Margin inference is based on sampling algorithms adapted from computational geometry methods for volume computation in high dimensional polytopes [Broecheler & Getoor, NIPS 2010]
While a naïve approach is tractable, it still suffers from problems of scalability IPMs operate on matrices. These matrices become large
and dense when many variables are all interdependent, such as is common in alignment problems.
Scaling to large data requires an alternative to forming and operating on such matrices
Partitioned IPM
Iteratively approximates the search direction by partitioning the problem into subproblems. - Partitioning the problem decreases the density of
the matrices, dramatically reducing the computation and memory required.
- Subproblems are also independent and solved in parallel at each iteration.
Convergence guarantees based on the # of dependencies in the probabilistic model the partitions cut. - Simon P. Schurr et. al., ̀ `A Polynomial-Time Interior-Point Method for
Conic Optimization, with Inexact Barrier Evaluations," SIAM Journal on Optimization, 20:1 (2009) 548-571.
Max. number of variables, ground rules, and constraints
Partitioned IPM IPM
PSL Implementation Implemented in Java / Groovy Declarative model definition and imperative model interaction ~40k LOC Performance oriented -Database backend -Memory efficient data structures -High performance solver integration
Similarity Functions similarID(A,B) = new SimFun(){}
Input Model
Graph Preprocessing
Groovy PSL Programming Environment
Grounding
Framework
Reasoner +
Learning
Optimization Toolbox
Similarity Functions
Factor Graph
Inference Result
Analysis & Evaluation
Tools
Comparative Visual Analytics
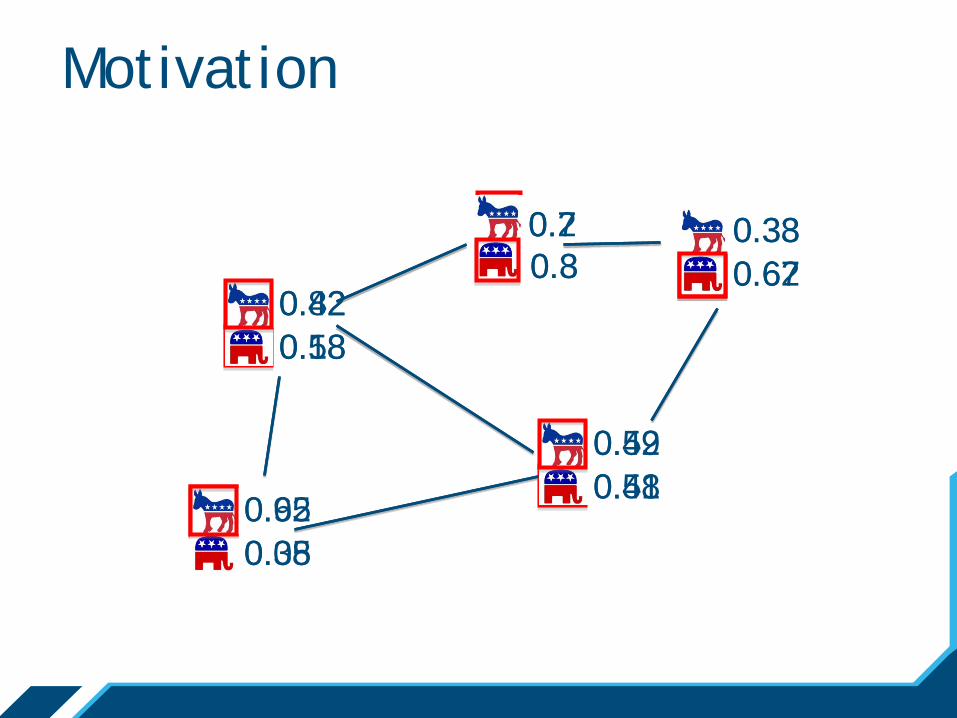
Motivation
0.2 0.8
0.65 0.35
0.82 0.18
0.52 0.48
0.33 0.67
Predicting political affiliation…
0.7 0.3
0.92 0.08
0.42 0.58
0.49 0.51
0.38 0.62
0.2 0.8
0.65 0.35
0.82 0.18
0.52 0.48
0.33 0.67
Motivation
0.7 0.3
0.92 0.08
0.42 0.58
0.38 0.62
0.49 0.51
0.2 0.8
0.65 0.35
0.82 0.18
0.52 0.48
0.33 0.67
Motivation
0.38 0.62
0.33 0.67
0.92 0.08
0.65 0.35
0.7 0.3
0.42 0.58
0.2 0.8
0.82 0.18
0.49 0.51
0.52 0.48
0.76 0.24
0.17 0.83
0.42 0.58
0.48 0.52
0.13 0.87
0.04 0.96
0.63 0.37
0.91 0.09
G-Pare
A visual analytic tool that:
- Supports the comparison of uncertain graphs
- Integrates three coordinated views that enable users to visualize the output at different abstraction levels
- Incorporates an adaptive exploration framework
for identifying the models’ commonalities and differences
Document Classification
Domain: Citation Network
Task: Predicting publication’s topic
Models: Content-based vs.
Neighborhood-based
?
?
? ?
?
?
G-Pare
Tabular View
Matrix View
Network View
Network View
Node-link diagram of the data
Information panel displays attributes of selected nodes
Visual controls and filters for controlling the nodes’ appearance
Color Coding Predicted Label
Fill Area Prediction Confidence
Eccentricity KL-Divergence
Border Highlighting Ground Truth
(Prediction Accuracy)
High Confidence
Moderate Confidence
Low Confidence
Theory Neural Networks Agree Disagree
Model2 Model1
• Model 1 prediction: “Neural Networks” Model 2 prediction: “Theory”
• Model 1 is more confident in its prediction than Model 2
• Distributions of the two models vary significantly
• Model 1’s prediction matches the ground truth
Node Visualization
Theory Neural Networks
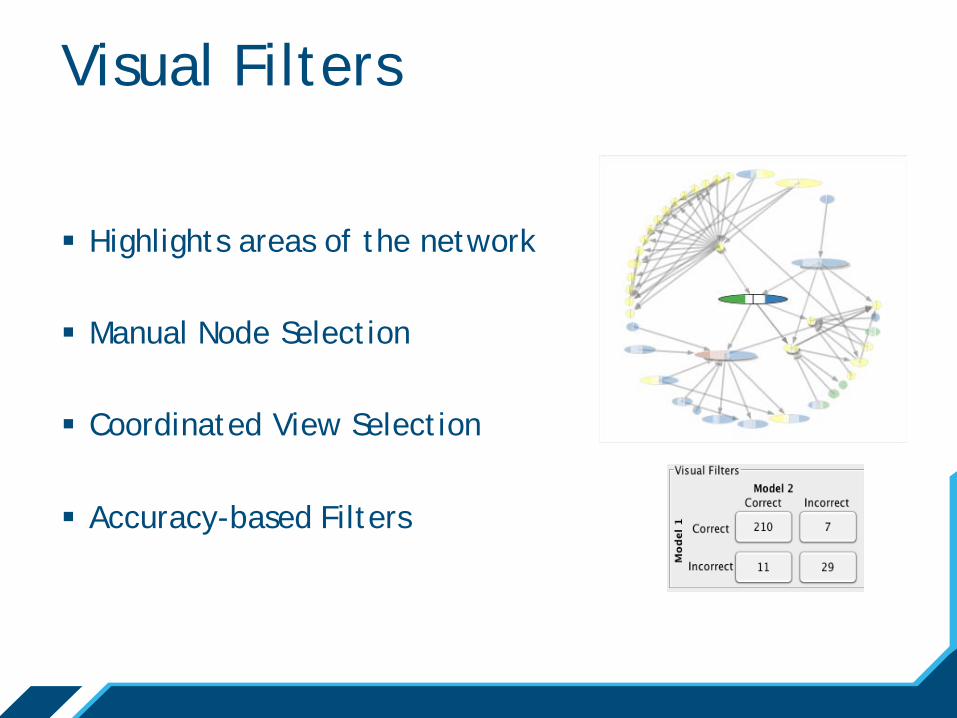
Visual Filters
Highlights areas of the network Manual Node Selection
Coordinated View Selection
Accuracy-based Filters
Side-by-side comparison of the models’ predictions - The predicted label by each model - The probability distribution over the node labels by each model - KL-divergence between the two distributions
Tabular View
Global view highlights where the models agree/disagree
- Heat map visualization of the confusion matrix
- Histogram showing the predictive accuracy of each model
- Interactive cell filtering
Matrix View
Interactive Exploration
Ego-network Expansion
Path-Following
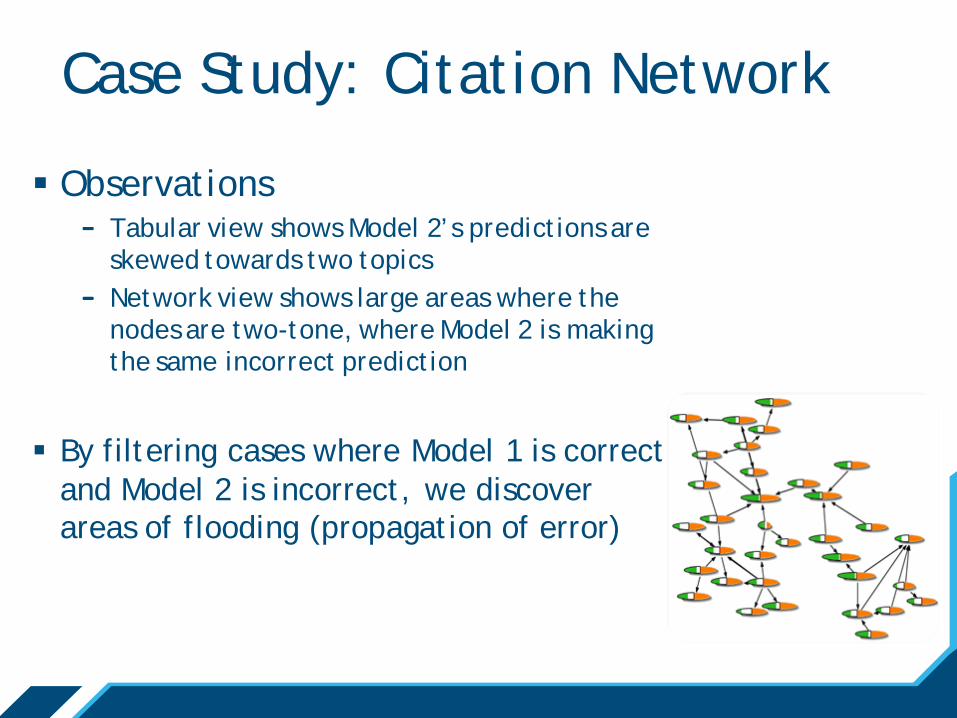
Case Study: Citation Network
Data set from Citeseer digital Library - 2120 publications with 3757 citation links - 3703 word vocabulary - Label indicating the topic of a paper
Comparing two models for predicting the
publication’s topic - Model 1 (SVM) using only document content - Model 2 (Majority) using neighboring nodes’ topics
Observations - Tabular view shows Model 2’s predictions are
skewed towards two topics - Network view shows large areas where the
nodes are two-tone, where Model 2 is making the same incorrect prediction
By filtering cases where Model 1 is correct
and Model 2 is incorrect, we discover areas of flooding (propagation of error)
Visual Analytics for Model Comparison - G-Pare - http://www.cs.umd.edu/projects/linqs/gpare
Supporting publications: UAI2010, NIPS2010, NIPS WS 2010, Invited Talk NIPS WS on Challenges in Data Visualization, VAST 2011
29
Thanks! Questions? Comments? Come to poster!
References
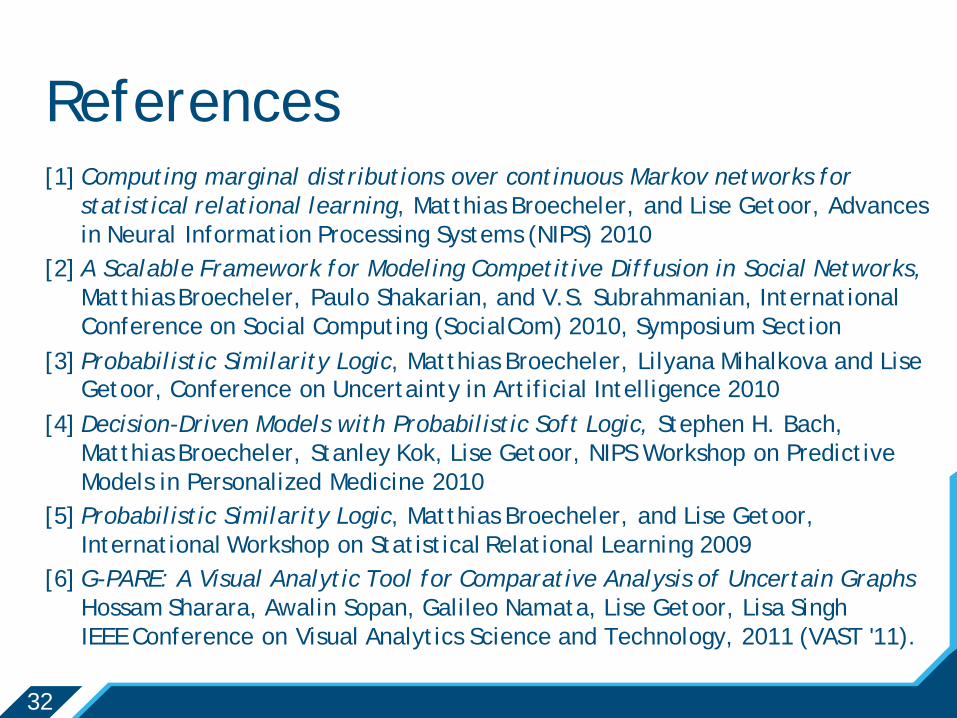
References [1] Computing marginal distributions over continuous Markov networks for
statistical relational learning, Matthias Broecheler, and Lise Getoor, Advances in Neural Information Processing Systems (NIPS) 2010
[2] A Scalable Framework for Modeling Competitive Diffusion in Social Networks, Matthias Broecheler, Paulo Shakarian, and V.S. Subrahmanian, International Conference on Social Computing (SocialCom) 2010, Symposium Section
[3] Probabilistic Similarity Logic, Matthias Broecheler, Lilyana Mihalkova and Lise Getoor, Conference on Uncertainty in Artificial Intelligence 2010
[4] Decision-Driven Models with Probabilistic Soft Logic, Stephen H. Bach, Matthias Broecheler, Stanley Kok, Lise Getoor, NIPS Workshop on Predictive Models in Personalized Medicine 2010
[5] Probabilistic Similarity Logic, Matthias Broecheler, and Lise Getoor, International Workshop on Statistical Relational Learning 2009
[6] G-PARE: A Visual Analytic Tool for Comparative Analysis of Uncertain Graphs Hossam Sharara, Awalin Sopan, Galileo Namata, Lise Getoor, Lisa Singh IEEE Conference on Visual Analytics Science and Technology, 2011 (VAST '11).