foundations Comprehensive Annual Financial Report For The Year Ended December 31, 2003 In 2003, important groundwork was laid for the enduring success of both the Port Authority and the region. Continuing our ongoing vision for the entire region, the literal frameworks and important first steps we implemented over the last twelve months solidify important progress in New York and New Jersey and further our commitment to the community. The work done this year ensures a strong future for us all.
Transcript
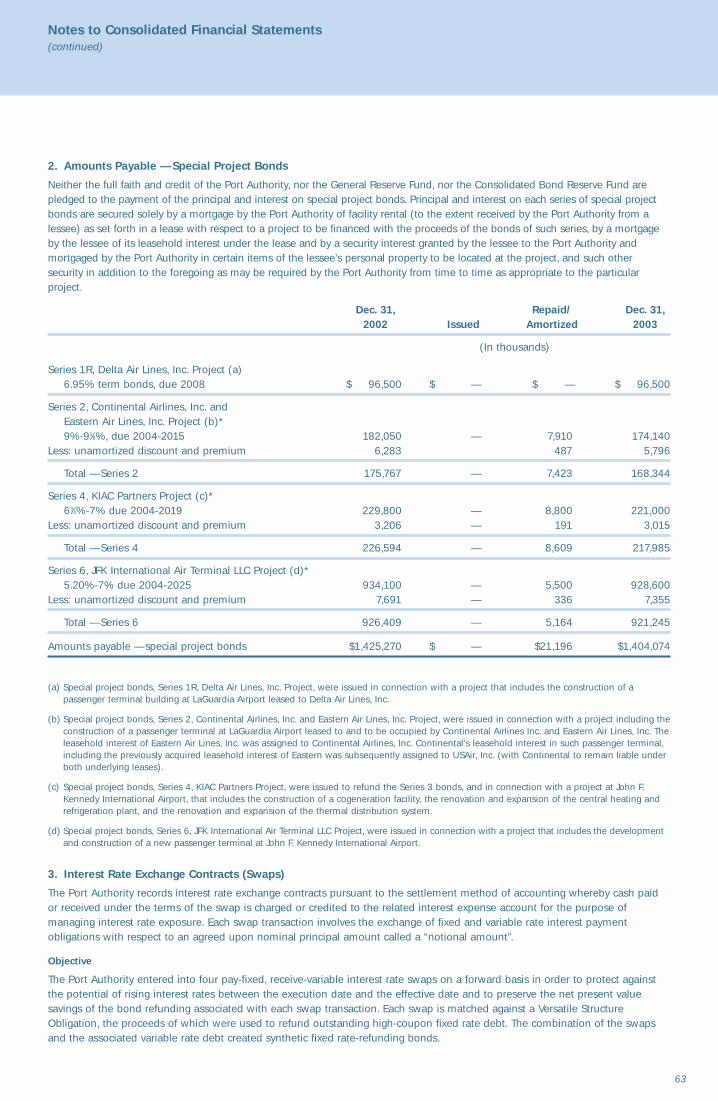
foundations
foundationsComprehensive Annual Financial Report For The Year Ended December 31, 2003
2003 Annual Report
Tina Hansen Senior Editor
Mariana Lopez, John Olberding Deputy Editors
Maximo Dela Cruz Jr. Financial Editor
Wilson Pacheco, Andrea Delmar Financial Section
Kevin Kirchman Managing Editor
Eileen Parisi Production Supervision
William Vasquez, Paul Warchol Photography
G2 Worldwide Inc. Concept and Design
Prepared by the Public Affairs and Comptroller's Departments of The Port Authority of New York and New Jersey225 Park Avenue South New York, NY 10003www.panynj.gov C
om
pre
he
nsi
ve A
nn
ua
l Fi
na
nci
al
Re
po
rt F
or
The
Ye
ar
En
de
d D
ece
mb
er
31
, 2
00
3fo
un
da
tio
ns
In 2003, important groundwork was laid for the enduring success ofboth the Port Authority and the region. Continuing our ongoingvision for the entire region,the literal frameworks and important first steps weimplemented over the last twelve months solidifyimportant progress in New York and New Jerseyand further our commitmentto the community. The workdone this year ensures a strong future for us all.
Building on our vision for the future
foundationsTable of Contents
Introductory Section
2 Mission Statement
3 Port Authority Facilities and Services
4 The New York-New Jersey Region
5 Letter of Transmittal to the Governors
6 Board of Commissioners
8 Officers and Directors, Organization Chart
9 Letter from the Executive Director
10 2003 Highlights
19 2003 Year in Review
33 Letter of Transmittal
Financial Section
39 Report of Independent Auditors
40 Management’s Discussion and Analysis
Basic Financial Statements
46 Consolidated Statements of Net Assets
47 Consolidated Statements of Revenues, Expenses and Changes in Net Assets
48 Consolidated Statements of Cash Flow
50 Notes to Consolidated Financial Statements
Financial Schedules Pursuant to Port Authority Bond Resolutions
76 Schedule A – Revenues and Reserves
77 Schedule B – Assets and Liabilities
78 Schedule C – Analysis of Reserve Funds
Other Supplemental Information
79 Schedule D – Selected Statistical Financial Data
81 Schedule E – Information on Port Authority Operations
82 Schedule F – Information on Port Authority Capital Program Components
Statistical Section
83 Port Authority Facility Traffic
Building on our vision for the future
2
Mission
To identify and meet the critical transportation and infrastructure needs of the bistate region’s
businesses, residents and visitors: providing the highest quality, most efficient transportation
and port commerce facilities and services that move people and goods within the region,
providing access to the rest of the nation and to the world, and strengthening the economic
competitiveness of the New York-New Jersey metropolitan region.
3
Facilities and Services
Aviation
John F. Kennedy International Airport
Newark Liberty International Airport
LaGuardia Airport
Teterboro Airport
Downtown Manhattan Heliport
AirTrain Newark
AirTrain JFK
Tunnels, Bridges & Terminals
George Washington Bridge
George Washington Bridge Bus Station
Lincoln Tunnel
Port Authority Bus Terminal
Holland Tunnel
Bayonne Bridge
Goethals Bridge
Outerbridge Crossing
Port Commerce
Auto Marine Terminal
Brooklyn Port Authority Marine Terminal
Brooklyn Piers
Red Hook Container Terminal
Elizabeth-Port Authority Marine Terminal
Port Newark
Howland Hook Marine Terminal
Oak Point Rail Link
Greenville Yard
Port Authority Trans-Hudson
PATH Rail Transit System
Journal Square Transportation Center
Economic Development
The Legal Center
The Teleport
Ferry Transportation
Essex County Resource Recovery Facility
Bathgate Industrial Park
Industrial Park at Elizabeth
International Business Development Offices
London
Tokyo
Representatives in
Hong Kong, Seoul, Shanghai, Singapore
Waterfront Development
Queens West Waterfront Development
The South Waterfront at Hoboken
4
RocklandPassaic
Westchester
The Bronx
Bergen
Essex
Morris
Somerset
Union
Middlesex
Richmond
ManhattanHudson
Brooklyn
Queens Nassau
Suffolk
RocklandPassaic
Westchester
The Bronx
Bergen
Essex
Morris
Somerset
Union
Middlesex
Richmond
ManhattanHudson
Brooklyn
Queens Nassau
Suffolk
Area 3,900 Square Miles
Population 17.0 Million
Total Labor Force 8.3 Million
Total Wage and Salary Jobs 7.7 Million
Total Personal Income $700 Billion (est.)
The New York-New Jersey Metropolitan Region, one of the largest and most diversified
in the nation, consists of the five New York boroughs of Manhattan, Brooklyn, Queens,
Richmond (Staten Island), and The Bronx; the four suburban New York counties
of Nassau, Rockland, Suffolk and Westchester; and the eight northern New Jersey
counties of Bergen, Essex, Hudson, Middlesex, Morris, Passaic, Somerset, and Union.
The New York-New Jersey Region
5
Dear Governors:
In compliance with the Port Compact of 1921, we are pleased to submit to you and the legislatures
of New York and New Jersey the 2003 Annual Report of The Port Authority of New York and New Jersey.
More than 40 years ago, the visionary leaders of New York and New Jersey worked together to support
the economic vitality of the region by building The World Trade Center and connecting it directly to PATH.
Working together once again, the two states and the Port Authority have reclaimed a critical component
of what we lost on September 11, 2001, by restoring PATH’s essential link to Lower Manhattan.
As originally planned, the Port Authority recommenced PATH service at an improved Exchange Place Station in
Jersey City in June 2003. This past November, we reached a truly remarkable goal by opening the temporary
PATH station at The World Trade Center site. With this accomplishment, we completed a $566 million project
under schedule, reestablished commuter access to the area only 16 months after construction began and set
the foundation for the renewal of the region.
Furthering our mission to enhance regional mobility and deliver innovative customer service, the Port Authority
launched AirTrain JFK, an 8.1-mile light-rail connection to John F. Kennedy International Airport (JFK) in Queens,
which is projected to serve more than 30,000 daily passengers. AirTrain JFK follows AirTrain Newark’s ongoing
success in providing travelers with fast, reliable access to Newark Liberty International Airport.
In 2003, the Port Authority also solidified our role as the leader in regional aviation by reaching an agreement
with the City of New York to extend our operation of JFK and LaGuardia airports to 2050. This follows a similar
agreement executed last year with the City of Newark, all of which ensure that the Port Authority will direct the
development of airport service for the region well into the future.
With your strong endorsement, the Port Authority protected the communities that surround Teterboro Airport
by successfully countering a proposed change in Federal Aviation Administration (FAA) policy that would have
allowed large aircraft to land at the facility. The Board of Commissioners unanimously passed a resolution
reaffirming our commitment to the restriction, while the Congressional delegations of New York and New Jersey,
state and local legislators and community leaders supported the effort at every level. Ultimately, President
George W. Bush signed legislation in January 2004 that included a ban on landing large aircraft at Teterboro.
The Port Authority has invested in an ambitious development program aimed at furthering the growth of the
region’s seaports. Both the agency and our terminal operators have advanced concurrent projects at Port Newark,
the Elizabeth-Port Authority Marine Terminal and Howland Hook Marine Terminal that will harness our port
operation’s considerable potential to function as a powerful economic engine for the region.
The past year witnessed significant physical improvements and extensive state-of-good-repair work at the
Port Authority’s trans-Hudson bridges, tunnels and bus terminals. Capital investments in these facilities will
ensure that our essential infrastructure will serve generations to come.
Overall, the Port Authority achieved significant milestones and made valuable contributions in 2003, surpassing
expectations set in the aftermath of September 11, 2001. In the months and years on the horizon, we will apply
our vision, expertise and dedication to guide our region in a promising direction and deliver on commitments
to the millions of people who live, work, visit and conduct business in New York and New Jersey.
Very truly yours,
Anthony R. Coscia Charles A. GarganoChairman Vice Chairman
April 22, 2004
The Honorable George E. PatakiGovernor, State of New York
The Honorable James E. McGreeveyGovernor, State of New Jersey
6
Board of Commissioners
Origins of the Port Authority
The Port Authority of New York and New Jersey was established on April 30, 1921. It was the first interstate agency ever created under a clause of the Constitution permitting compacts between states with Congressional consent.
The agency’s area of jurisdiction was called the Port District, a bistate region generally within 25 miles of the Statue of Liberty. The mandate of the agency was to promote and protect the commerce of the bistate port and to undertake port and regional improvements not likely to be financed by private enterprise or to be attempted by either state alone: a modern wharfage for the harbor shared by the two states, tunnel and bridge connections between the states and, in general, trade and transportation projects to promote the region’s economic well-being.
Governance of the Port Authority
The Governor of each state appoints six Commissioners to the agency’s Board of Commissioners, each appointment subject to the approval of the respective state senate.
The twelve Commissioners serve as public officials without remuneration.
The Governors retain the right to veto the actions of the Commissioners. Within the Port District, the Port Authority undertakes projects and activities in accordance with the Port Compact of 1921 and amendatory and supplemental bistate legislation.
The Board of Commissioners appoints an Executive Director to effect its policies and manage day-to-day operations.
Charles A. GarganoChairman & ChiefExecutive OfficerEmpire StateDevelopment Corporation
Michael J. ChasanoffManaging PartnerChasanoff Properties
Charles KushnerChairman Kushner Companies
Anthony J. SartorPresident & ChiefOperating OfficerKeySpan Services, Inc.
Jack G. SinagraSenior Vice PresidentTurtle & Hughes Inc.
Bruce A. BlakemanAttorney-at-LawRobert M. Blakeman &Associates
Anthony R. CosciaPartnerWindels Marx Lane & Mittendorf, LLP
Raymond M. PocinoVice President/EasternRegional ManagerLaborers InternationalUnion of NorthAmerica
Henry R. SilvermanChairman, ChiefExecutive Officer &President Cendant Corporation
7
Footnotes
1. Commissioner Coscia joined the Board on April 3, 2003, succeeding CommissionerKushner, who resigned from the Board onFebruary 26, 2003. Commissioner Coscia was elected Chairman of the Board on April 10, 2003.
2. Commissioner Steiner joined theBoard on January 22, 2003, succeeding Commissioner Philibosian.
Board of Commissioners
Anthony R. Coscia, Chairman1
Charles A. Gargano, Vice Chairman
Bruce A. Blakeman
Michael J. Chasanoff
Charles Kushner1
David S. Mack
Alan G. Philibosian2
Raymond M. Pocino
Anthony J. Sartor
Henry R. Silverman
Jack G. Sinagra
Anastasia M. Song
David S. Steiner2
Joseph J. Seymour, Executive Director
David S. MackSenior ManagingPartnerThe Mack Company
Alan G. PhilibosianAttorney-at-Law
Anastasia M. SongSenior AdvisorArctas Capital Group
David S. SteinerChairmanSteiner Equities Group,LLC
Joseph J. SeymourExecutive Director
8
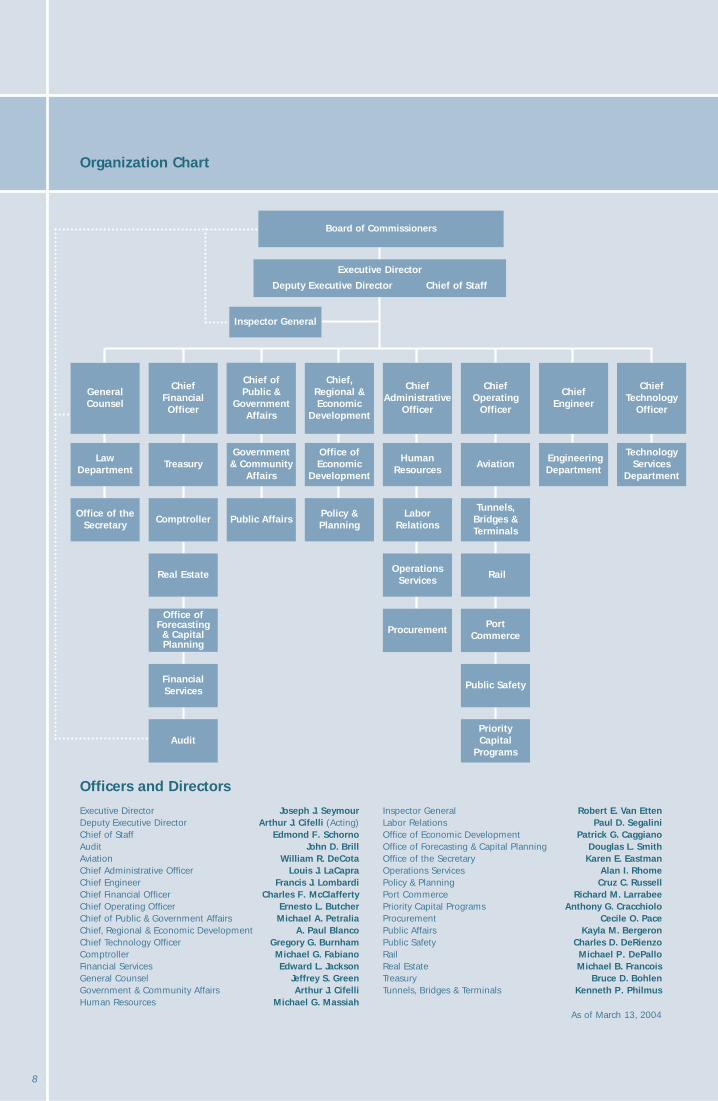
Organization Chart
Officers and Directors
Executive Director Joseph J. SeymourDeputy Executive Director Arthur J. Cifelli (Acting)Chief of Staff Edmond F. SchornoAudit John D. BrillAviation William R. DeCotaChief Administrative Officer Louis J. LaCapraChief Engineer Francis J. LombardiChief Financial Officer Charles F. McClaffertyChief Operating Officer Ernesto L. ButcherChief of Public & Government Affairs Michael A. PetraliaChief, Regional & Economic Development A. Paul BlancoChief Technology Officer Gregory G. BurnhamComptroller Michael G. FabianoFinancial Services Edward L. JacksonGeneral Counsel Jeffrey S. GreenGovernment & Community Affairs Arthur J. CifelliHuman Resources Michael G. Massiah
Inspector General Robert E. Van EttenLabor Relations Paul D. SegaliniOffice of Economic Development Patrick G. CaggianoOffice of Forecasting & Capital Planning Douglas L. Smith Office of the Secretary Karen E. EastmanOperations Services Alan I. RhomePolicy & Planning Cruz C. Russell Port Commerce Richard M. Larrabee Priority Capital Programs Anthony G. CracchioloProcurement Cecile O. PacePublic Affairs Kayla M. BergeronPublic Safety Charles D. DeRienzoRail Michael P. DePallo Real Estate Michael B. FrancoisTreasury Bruce D. BohlenTunnels, Bridges & Terminals Kenneth P. Philmus
As of March 13, 2004
Inspector GeneralInspector General
Board of CommissionersBoard of Commissioners
Executive Director
Deputy Executive Director Chief of Staff
Executive Director
Deputy Executive Director Chief of Staff
LawDepartment
LawDepartment
Office of theSecretary
Office of theSecretary
TreasuryTreasury
ComptrollerComptroller
Real EstateReal Estate
Office ofForecasting & CapitalPlanning
Office ofForecasting & CapitalPlanning
FinancialServicesFinancialServices
AuditAudit
Government & Community
Affairs
Government & Community
Affairs
Public AffairsPublic Affairs
Office ofEconomic
Development
Office ofEconomic
Development
Policy &PlanningPolicy &Planning
HumanResources
HumanResources
LaborRelations
LaborRelations
OperationsServices
OperationsServices
ProcurementProcurement
AviationAviation
Tunnels,Bridges &Terminals
Tunnels,Bridges &Terminals
RailRail
PortCommerce
PortCommerce
Public SafetyPublic Safety
Priority Capital
Programs
Priority Capital
Programs
EngineeringDepartmentEngineeringDepartment
TechnologyServices
Department
TechnologyServices
Department
GeneralCounselGeneralCounsel
Chief FinancialOfficer
Chief FinancialOfficer
Chief ofPublic &
GovernmentAffairs
Chief, Regional &Economic
Development
Chief, Regional &Economic
Development
ChiefAdministrative
Officer
ChiefAdministrative
Officer
ChiefOperating
Officer
ChiefOperating
Officer
Chief Engineer
Chief Engineer
ChiefTechnology
Officer
ChiefTechnology
Officer
9
The Port Authority of New York and New Jersey achieved significant goals in 2003 that set the foundation for future growth.
Restoration of PATH service between New Jersey and Lower Manhattan marked a meaningful milestone for the men andwomen of the Port Authority, who worked around the clock in memory of their colleagues to open the temporary stationone month ahead of schedule and just 16 months after construction began. Thanks to their steadfastness, this crucial railconnection is available once again for the tens of thousands of New Jersey residents who work in Lower Manhattan.
Reflecting the deep commitment of Governor George E. Pataki and Governor James E. McGreevey to restore and rebuildthe transportation infrastructure of Lower Manhattan, the Port Authority identified projects that will enhance access toLower Manhattan and The World Trade Center site. Critical among these is The World Trade Center Transportation Hub, forwhich the Port Authority selected as designers DMJM + Harris and STV Group, Inc., in association with Santiago Calatrava.
Mr. Calatrava and the Port Authority set new standards in transportation design with the 2004 unveiling of a spectacularconcept for the hub, one that balances beauty and function. When the hub is completed in 2009, Lower Manhattan'sknotted mass-transit network will be untangled for the first time in a century. The hub is scheduled to begin servingpassengers in 2006.
An agreement was reached with Silverstein Properties, Inc. and Westfield America, Inc. on the Port Authority's acquisitionof development rights to approximately 600,000 square feet of retail space at the site. This acquisition was critical forfuture development of the WTC and of appropriate retail that will enliven street life in the vicinity.
These actions are important components of the vision articulated for the site in 2003 by Daniel Libeskind in his masterplan, developed in cooperation with the Lower Manhattan Development Corporation, New York City, and SilversteinProperties in an unprecedented public process. The end result is a widely accepted redevelopment strategy that providesmore open space, offers a large area for the 9/11 Memorial and includes the 1,776-foot Freedom Tower, which will beginto rise this year. With the majestic hub design proposed by Mr. Calatrava, the new World Trade Center will surely take itsplace as one of the world's greatest architectural achievements.
As we move forward on the renewal of Lower Manhattan, we will never forget the tragedy of September 11, 2001. We carry with us the memory of the brave men and women who gave their lives and labor in honor of the nearly 3,000people who perished in the attacks, including 84 members of the Port Authority family.
When the Port Authority and the City of New York agreed on an extension to 2050 of Port Authority operation of John F.Kennedy International and LaGuardia airports in Queens, N.Y., it was a proud moment for the agency, which has operatedthese vital gateways for more than 55 years. The proposal ensures the Port Authority will invest in Kennedy and LaGuardiagoing forward.
The December opening of AirTrain JFK underscored a commitment to enhance our region's transportation infrastructure.The new rail connection represents a significant part of the $9.4 billion redevelopment that has delivered new terminals,new parking facilities and a more efficient roadway system.
The Port Authority expects to invest approximately $9 billion over the next several years to make capital improvements at the airports, tunnels and bridges, the seaport and PATH. These bistate enhancements emphasize transportation, securityand commerce, strengthening services the public deserves.
Governors Pataki and McGreevey have made it a priority that the Port Authority maintain the highest level of safety in itsdaily operations and protect critical regional assets. Our efforts to meet the governors' vital mandates are multi-dimensionaland include physical investments, state-of-the-art technologies, and the expertise of the Port Authority Police Department.
The Port Authority's important achievements in 2003 have strengthened the economic viability of the region. We will buildon the momentum generated in 2003 to fulfill our essential mission and provide a strong foundation for the well-being ofthe region now and in the future.
Sincerely,
Joseph J. SeymourExecutive Director
April 22, 2004
Letter from the Executive Director
Creating a new beginning inLower Manhattan, and the region
Undertaking an ambitious task felt deeply
in hearts around the world, we approached
the first phase of rebuilding Lower Manhattan
with respect, inspiration and industriousness,
fulfilling our promise to help the community
return to full strength. Working with public
and private partners, we reopened the
Exchange Place Station in Jersey City, N.J. on
time on June 29 and The World Trade Center
PATH Station ahead of schedule on November
23, marking a new era of commercial and
residential revitalization in Lower Manhattan.
Our commitment to future economic success
begins with the temporary World Trade Center
PATH Station, a significant step toward our
proposed World Trade Center Transportation
Hub, which will provide connections to ferries
and subway lines for thousands of daily
commuters and visitors beginning in 2006.
We selected the Downtown Design
Partnership and world-renowned architect
Santiago Calatrava to express our vision of
this world-class facility. The proposed design
reflects the forward thinking, devotion and
spirit in which we honor the past and create
new promise for the future.
11
Nov. 23
Restored service to Exchange Place andWorld Trade Center PATH stations is the firststep in renewing a vital community.
Securing a long-termsource of revenue
For as long as flight has been indispensable
to travel, the airports in our region have
been a mainstay in the local economy.
For more than 55 years, we have managed
the John F. Kennedy International and
LaGuardia airports as supportive neighbors
and forward-looking stewards. And now
the lease extension, awarded through
collaboration with the State and City of
New York, allows us to move forward with
current projects and to commit, with our
airport partners, to future innovations —
such as state-of-the-art technology and
advanced security in all areas of the
airports. With our important presence
in the community, our airports currently
contribute more than $28 billion in
economic activity in the New York
metropolitan area and support 265,000
regional jobs. Our contribution to the
region will continue to develop as we
strengthen our relationship with local
communities and enhance our connections
with the rest of the world.
13
Oct. 15
Supporting future capital investment opportunities,the airport lease extension strengthens the economichealth of the region, and this agency.
Preparing for growing market demands
15
Living in the New York-New Jersey region
has many distinct advantages, one of the
foremost being our vital harbor. Our seaport
is a substantial source of economic success
and environmental guardianship, generating
$25 billion annually in local economic activity,
supporting 230,000 highly skilled jobs, and
employing measures to improve the quality
of life throughout the region. As part of a five-
year redevelopment effort to ensure future port
efficiency and competitiveness, we completed
the first phase of an expanded ExpressRail
on-dock rail facility. Featuring a rail overpass
at Elizabeth-Port Authority Marine Terminal to
eliminate conflict among vehicular traffic and
trains, ExpressRail is just part of our effective
Port Inland Distribution Network that speeds
cargo to inland markets while reducing reliance
on trucks to move cargo. We also launched
Albany ExpressBargeSM, a cost-efficient and
environmentally friendly solution to get cargo
closer to destinations in the Northeast and
Canada. These efforts will allow our port’s
potential to expand quickly as consumer
demand grows, for the benefit of everyone
who lives within our reach.
Mar. 31
Enhanced ExpressRail service spearheads an inlanddistribution network that will keep our portcompetitive and the regional economy thriving.
Making vital connectionsmore efficient
17
In this growing economy, millions of commuters rely on our comprehensive
transportation network every day. For this reason, we are dedicated to facilitating
the efficient movement of vehicles and ensuring traffic safety at our bridges and
tunnels. For improved customer service, we introduced three new 25-mph E-ZPassSM
toll lanes at the Outerbridge Crossing that allow motorists to pass through at more
efficient speeds — an enhanced consumer convenience that we expect to introduce
at more facilities in the future. In addition, we partnered with the New York City
Department of Transportation on key initiatives to improve traffic patterns at the
Lincoln Tunnel in order to reduce congestion in New York City streets. Moving
forward, we will continue to look for thoughtful and innovative solutions that
anticipate the needs of commuters, travelers and visitors throughout the region.
Jan. 9
Advanced E-ZPassSM options begin a coordinated effort to improve the flow of vehicular traffic throughout the region.
18
19
2003 Year in Review
A Year of Progress, Accomplishment and Promise
Although its full impact has yet to be realized, 2003 was an historical year for The Port Authority of
New York and New Jersey. Guided by the vision of New York Governor George E. Pataki, New Jersey
Governor James E. McGreevey and the Port Authority’s Board of Commissioners, and strengthened
by our partnerships, the agency achieved important milestones in 2003 that reaffirm our dedication
to the bistate region today, and set in motion far-reaching objectives that will help bring about
a more prosperous tomorrow.
It was a year in which we again made substantial contributions to the region, while ensuring
that safety and security continue to be our highest priorities. Whether it was meeting critical
transportation needs, providing vital access for commerce and travel, or enhancing the region’s
global competitiveness, the Port Authority applied proven experience to serve the region.
From Port Newark to John F. Kennedy International Airport, from the Journal Square Transportation
Center to the George Washington Bridge, the Port Authority made substantial gains on several
landmark projects. Perhaps most significantly — and working in concert with our private and public
sector partners — we established the groundwork for a grand vision to rebuild Lower Manhattan.
These accomplishments set the foundations upon which we will build future successes.
Throughout 2003, the Port Authority advanced the agency’s largest-ever capital improvement
program to strengthen our ability to serve transportation and commerce needs well into the future.
A significant portion of this investment program went to a critical project for Lower Manhattan:
$566 million to quickly restore PATH service to The World Trade Center site. At year-end, the Federal
Transit Administration authorized a grant for a permanent PATH terminal as part of The World Trade
Center Transportation Hub, a project expected to total $2 billion.
The entire Port Authority capital improvement program of almost $9 billion is helping the agency be
more responsive to forecasted demand, while ensuring that the New York-New Jersey region retains
Our achievements in 2003, from meeting vital
transportation needs to providing economic opportunity,
lay the foundation for a more prosperous future.
20
its prominence as one of the world’s greatest. In addition, our long-term capital plan reflects
the critical priority of improving security for everyone who travels in this region. Toward that end,
we have earmarked more than $500 million to reinforce security systems and improve public
safety at all of our land, sea and air facilities.
With sound financial management, operational excellence and well-planned investments, the
Port Authority again demonstrated outstanding leadership and service to the region.
New Heights in Aviation Operations, Service and Standards
Under the Port Authority’s expert management, John F. Kennedy International, Newark Liberty International
and LaGuardia airports continue to be vital transportation centers, world-class facilities and indispensable
economic engines.
Newark Liberty International Airport, the region’s earliest major commercial airport, celebrated its 75th year
of service in 2003. Under Governor McGreevey’s leadership, the Port Authority is nearing completion of
a $3.8 billion redevelopment initiative at the airport. Public-private cooperation has brought airport-wide
improvements, including two new parking garages, the AirTrain Newark connection to the Northeast corridor
rail line, new signage, better terminal facilities and roadway and runway enhancements. This key hub in our
regional airport network remains a significant contributor to the regional economy, supporting approximately
25,000 on-airport jobs, with an additional 85,000 jobs derived from its activity in such important industries
as tourism and package delivery.
With a 2002 agreement between the Port Authority and the City of Newark to extend the agency’s lease of
the airport through 2065, the Port Authority will ensure Newark Liberty remains a cornerstone of economic
strength for the region.
In recognition of our successful stewardship of the region’s airports, New York State and City officials agreed
to an extension of the lease for Port Authority operation of Kennedy International and LaGuardia airports
to 2050. This agreement will provide a sound financial foundation and management structure for long-term
capital investment and growth at the airports.
21
As part of the agreement, New York City will have a role in the oversight of the Queens airports. A joint
Airport Board of City and Port Authority officials will review airport standards, operations and performance,
to ensure that Kennedy and LaGuardia continue to successfully advance strong customer service and
promote the most important trade and travel market in the world.
The New York airports have surged under the Port Authority’s management, in large measure because the
Port Authority and its airport partners invested more than $11 billion in improvements to ensure the airports’
viability. Today, Kennedy and LaGuardia provide approximately 50,000 on-airport jobs and more than 265,000
regional jobs.
The Port Authority continues to improve the airport experience for customers. On December 17, the
Centennial of the Wright Brothers’ historic flight, Governor Pataki and the Port Authority launched AirTrain JFK,
the promised light-rail connection to Kennedy International Airport. Using brand-new and spacious terminals
designed and built by the Port Authority at Howard Beach and Jamaica Station, the 8.1-mile system connects
airport travelers and employees with the Metropolitan Transportation Authority’s (MTA) Long Island Rail Road
and MTA New York City Transit subway lines and local buses. As added value for travelers and airport
employees, rides between airport facilities on AirTrain JFK are free.
AirTrain JFK is already recognized as a fast, easy and affordable rail link. More than 30,000 passengers a day
are expected to use AirTrain JFK in its first year of service, which would make it the nation’s second busiest
airport access system. To further the concept of a “one-seat ride,” the Port Authority is participating in
feasibility studies for connections from Downtown Manhattan to both Kennedy International and Newark
Liberty International airports.
AirTrain JFK represents a major component of Kennedy’s renaissance — a comprehensive $9.4 billion
investment initiative underway since the 1990s. This unprecedented redevelopment by the Port Authority
and our private-sector partners has transformed the airport with new terminals, new parking garages,
a more efficient roadway system and award-winning signage that has significantly reduced congestion.
For more than 30 years, the Port Authority’s 100,000-pound plane limit at Teterboro Airport has been
a reliable safeguard to support the facility’s designation as a reliever airport. In response to a proposed
revision to Federal Aviation Administration (FAA) policy that would have allowed planes as large as
AirTrain JFK is projected to serve more than
30,000 passengers a day, making it one of the
busiest airport rail systems in the nation.
22
23
Boeing 737s to land at the airport, the Port Authority’s Board of Commissioners joined with local residents
in opposing the change. With support for aircraft restrictions from Governor McGreevey, the Congressional
delegations of New Jersey and New York, state and local legislators, and community leaders, President
George W. Bush signed FAA funding legislation in 2004 that included a one-year ban on large aircraft
landing at the facility.
Concessions at all three airports once again received top honors in the prestigious 2003 Airport Revenue
News “Best Concessions” competition, leading all U.S. airports in total awards. For the second time in three
years, LaGuardia captured first place in the Airports Council International “Excellence in Airport Concessions”
competition. The Central Terminal Building — competing against more than 20 major North American airports
— took top prize for Best Food and Beverage Program.
Air cargo operations continue to provide substantial economic benefits, handling 25 percent of the nation’s
air imports and supporting 85,000 regional jobs. In 2003, the Port Authority opened new, fully modern
cargo buildings at Newark Liberty and Kennedy. The Newark Liberty facility, a $33.4 million Port Authority
investment, expands warehouse space to 1.45 million square feet. At Kennedy, two new buildings totaling
435,000 square feet provide space for four major tenants.
Following its successful introduction at Kennedy in 2002, E-ZPass PlusSM became available at all public
parking lots at LaGuardia and almost all public parking lots at Newark Liberty in 2003. This innovative,
automated system allows customers to pay for parking by using E-ZPassSM technology.
Building upon our commitment to put the safety and well-being of our customers first, the Port Authority
launched another major effort to enhance security with the first phase of a $125 million security
improvement program at the region’s airports. This new initiative includes design of a comprehensive
perimeter surveillance and intrusion detection system, new deterrence systems for unauthorized entry into
secure areas, and other state-of-the-art technologies.
Staffing all of our facilities with the best-trained police force continues to be among our most important
priorities. A new class of approximately 100 officers joined the ranks of the Port Authority Police last year.
More than 500 cadets have successfully completed training since September 11, 2001.
Air cargo operations continue to provide substantial
opportunities for residents and businesses, handling 25 percent
of the nation’s imports and supporting 85,000 regional jobs.
24
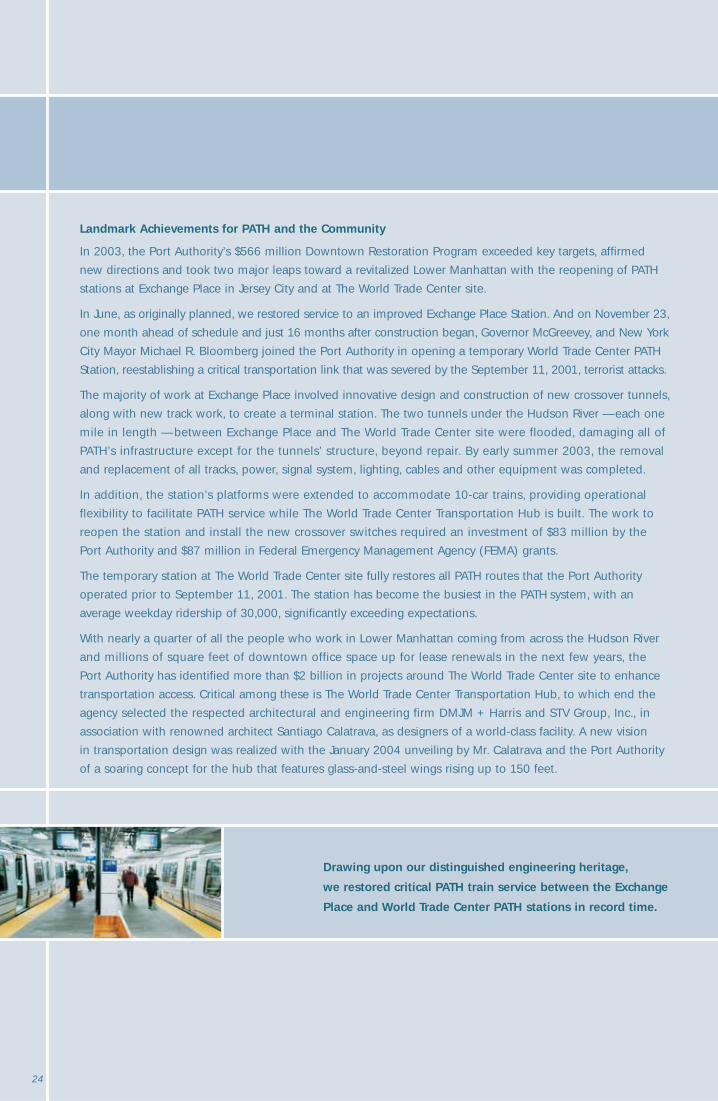
Drawing upon our distinguished engineering heritage,
we restored critical PATH train service between the Exchange
Place and World Trade Center PATH stations in record time.
Landmark Achievements for PATH and the Community
In 2003, the Port Authority’s $566 million Downtown Restoration Program exceeded key targets, affirmed
new directions and took two major leaps toward a revitalized Lower Manhattan with the reopening of PATH
stations at Exchange Place in Jersey City and at The World Trade Center site.
In June, as originally planned, we restored service to an improved Exchange Place Station. And on November 23,
one month ahead of schedule and just 16 months after construction began, Governor McGreevey, and New York
City Mayor Michael R. Bloomberg joined the Port Authority in opening a temporary World Trade Center PATH
Station, reestablishing a critical transportation link that was severed by the September 11, 2001, terrorist attacks.
The majority of work at Exchange Place involved innovative design and construction of new crossover tunnels,
along with new track work, to create a terminal station. The two tunnels under the Hudson River — each one
mile in length — between Exchange Place and The World Trade Center site were flooded, damaging all of
PATH’s infrastructure except for the tunnels’ structure, beyond repair. By early summer 2003, the removal
and replacement of all tracks, power, signal system, lighting, cables and other equipment was completed.
In addition, the station’s platforms were extended to accommodate 10-car trains, providing operational
flexibility to facilitate PATH service while The World Trade Center Transportation Hub is built. The work to
reopen the station and install the new crossover switches required an investment of $83 million by the
Port Authority and $87 million in Federal Emergency Management Agency (FEMA) grants.
The temporary station at The World Trade Center site fully restores all PATH routes that the Port Authority
operated prior to September 11, 2001. The station has become the busiest in the PATH system, with an
average weekday ridership of 30,000, significantly exceeding expectations.
With nearly a quarter of all the people who work in Lower Manhattan coming from across the Hudson River
and millions of square feet of downtown office space up for lease renewals in the next few years, the
Port Authority has identified more than $2 billion in projects around The World Trade Center site to enhance
transportation access. Critical among these is The World Trade Center Transportation Hub, to which end the
agency selected the respected architectural and engineering firm DMJM + Harris and STV Group, Inc., in
association with renowned architect Santiago Calatrava, as designers of a world-class facility. A new vision
in transportation design was realized with the January 2004 unveiling by Mr. Calatrava and the Port Authority
of a soaring concept for the hub that features glass-and-steel wings rising up to 150 feet.
25
26
27
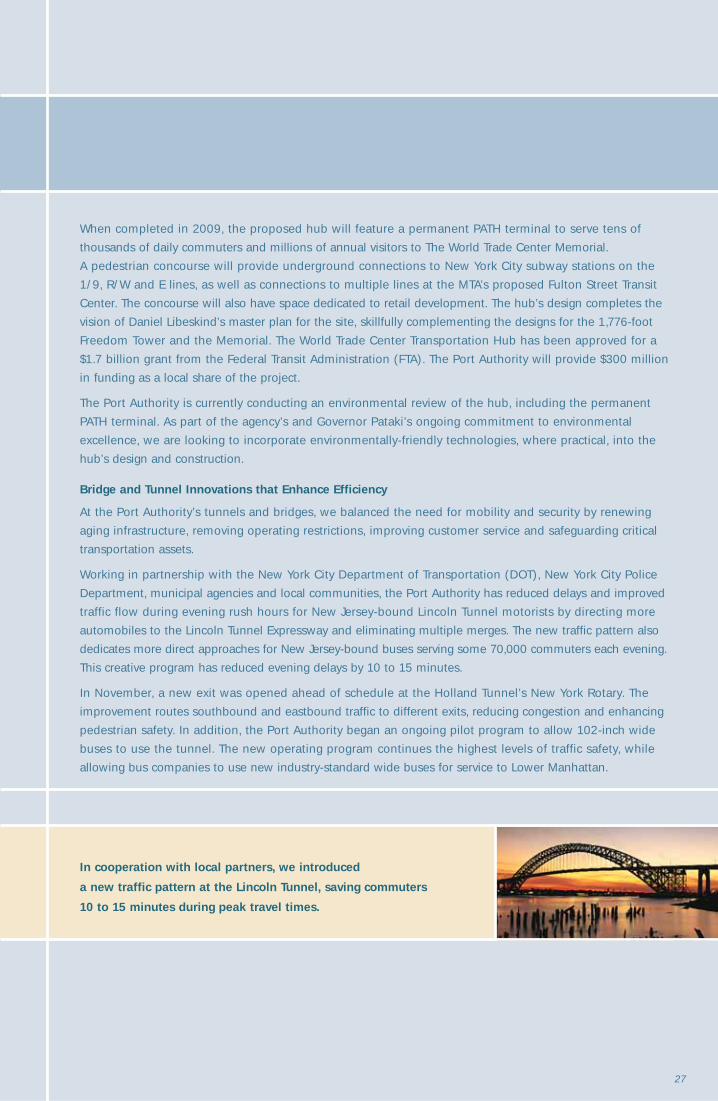
In cooperation with local partners, we introduced
a new traffic pattern at the Lincoln Tunnel, saving commuters
10 to 15 minutes during peak travel times.
When completed in 2009, the proposed hub will feature a permanent PATH terminal to serve tens of
thousands of daily commuters and millions of annual visitors to The World Trade Center Memorial.
A pedestrian concourse will provide underground connections to New York City subway stations on the
1/9, R/W and E lines, as well as connections to multiple lines at the MTA’s proposed Fulton Street Transit
Center. The concourse will also have space dedicated to retail development. The hub’s design completes the
vision of Daniel Libeskind’s master plan for the site, skillfully complementing the designs for the 1,776-foot
Freedom Tower and the Memorial. The World Trade Center Transportation Hub has been approved for a
$1.7 billion grant from the Federal Transit Administration (FTA). The Port Authority will provide $300 million
in funding as a local share of the project.
The Port Authority is currently conducting an environmental review of the hub, including the permanent
PATH terminal. As part of the agency’s and Governor Pataki’s ongoing commitment to environmental
excellence, we are looking to incorporate environmentally-friendly technologies, where practical, into the
hub’s design and construction.
Bridge and Tunnel Innovations that Enhance Efficiency
At the Port Authority’s tunnels and bridges, we balanced the need for mobility and security by renewing
aging infrastructure, removing operating restrictions, improving customer service and safeguarding critical
transportation assets.
Working in partnership with the New York City Department of Transportation (DOT), New York City Police
Department, municipal agencies and local communities, the Port Authority has reduced delays and improved
traffic flow during evening rush hours for New Jersey-bound Lincoln Tunnel motorists by directing more
automobiles to the Lincoln Tunnel Expressway and eliminating multiple merges. The new traffic pattern also
dedicates more direct approaches for New Jersey-bound buses serving some 70,000 commuters each evening.
This creative program has reduced evening delays by 10 to 15 minutes.
In November, a new exit was opened ahead of schedule at the Holland Tunnel’s New York Rotary. The
improvement routes southbound and eastbound traffic to different exits, reducing congestion and enhancing
pedestrian safety. In addition, the Port Authority began an ongoing pilot program to allow 102-inch wide
buses to use the tunnel. The new operating program continues the highest levels of traffic safety, while
allowing bus companies to use new industry-standard wide buses for service to Lower Manhattan.
28
Significant port redevelopment projects strengthen
both the region’s economic competitiveness and the port’s
position as a leading shipping destination.
In cooperation with the New York City DOT, the Port Authority lifted the 6 a.m. to 10 a.m. weekday ban
on single-occupant autos at the Holland Tunnel beginning in mid-November. The Port Authority joined
DOT and the MTA Bridges and Tunnels Authority in enforcing the restriction at the bridges and tunnels to
Lower Manhattan following the September 11, 2001, terrorist attacks.
We made strides in improving mobility and convenience for motorists by implementing the first 25-mph
E-ZPassSM lanes at the Outerbridge Crossing, helping E-ZPassSM customers save time and reducing congestion
at staffed toll lanes. The 25-mph lanes will be implemented at the Goethals Bridge and all George Washington
Bridge toll plazas in 2004.
Demonstrating our commitment to maintaining the structural integrity of the interstate crossings, the
Port Authority took a major step on the future of the Goethals Bridge by seeking proposals from experienced
environmental consultants interested in preparing an environmental review and evaluating alternatives
to upgrading the 75-year-old bridge. The $47 million environmental review program is expected to last
approximately three years and will include extensive opportunities for public comment.
The Port Authority was awarded more than $110 million in grants under FEMA’s Hazard Mitigation Grant
Program for security projects at our tunnels, bridges and terminals. This amount represents an unprecedented
level of funding for the Port Authority, encompassing projects such as the expansion of Intelligent
Transportation Systems to the Lincoln and Holland Tunnels, which will enhance our ability to identify and
respond to security incidents.
Region-wide Port Improvements Anticipate Global Demand
With more than 100 million customers within a day’s reach of the Port of New York and New Jersey,
businesses are more reliant than ever on the efficient movement of goods. To ensure our seaport will meet
the forecasted needs of the marketplace, the Port Authority and our container terminal operators made
progress on several redevelopment projects at Port Newark and the Elizabeth-Port Authority Marine Terminal
in New Jersey. The Port Authority began work on a project that will further improve traffic flow through Port
Newark and Elizabeth. Reconfiguration of a key intersection and conversion of Corbin Street in Elizabeth to
a two-way thoroughfare will prepare the area for construction of a new, modern gate entry complex at the
reconfigured Maher Terminal in Elizabeth.
29
30
Strong business from Canada helped set new
records for on-dock rail movement in the first full year
of operation for the Port Newark rail facility.
At Howland Hook in Staten Island, N.Y., the Port Authority completed the southerly 200-foot extension
of the existing wharf, the first step to creating a 3,000-foot long deepwater berth. Work also began on
construction of a 39-acre intermodal ship-to-rail terminal on the “Port Ivory” property, east of the existing
container terminal, to serve Howland Hook. In conjunction with this project, the Port Authority will construct
a connection between the Staten Island Railroad and the Conrail “Chemical Coast Line” in Elizabeth, just
across the Arthur Kill from Howland Hook. When both projects are completed, Howland Hook and Staten
Island will benefit from direct freight rail service for the first time in more than a decade.
In order to maintain the port’s position as the premier East Coast shipping destination with the ability to
serve many of the world’s largest containerships, the Port Authority and the U.S. Army Corps of Engineers
advanced several major channel-deepening projects in 2003. Work began on the final stage of the Army
Corps’ deepening of the Kill Van Kull/Newark Bay Channels from 40 feet to 45 feet to provide critical access
to the Port Newark and Elizabeth-Port Authority marine terminals. The Port Authority is also the local sponsor
of a project, which began in 2003, to deepen the Arthur Kill Channel between the Kill Van Kull confluence
and Howland Hook from 35 to 41 feet.
As part of our ongoing commitment to the environment, the Port Authority continued to apply environmentally
sound and innovative practices to our dredging operations. Now, nearly 100 percent of all dredged material
is beneficially used throughout the region, from remediating brownfields to creating fish and other marine
habitats.
Amid an extensive capital construction program, the Port of New York and New Jersey once again experienced
significant increases in cargo volumes during 2003. Container volumes at all facilities rose nine percent in
2003 with a total of 2,818,557 loaded twenty-foot-equivalent (TEUs) container units moved through the port.
Exports rose 11.6 percent while imports increased by 6.4 percent over 2002 volumes.
The port’s on-dock rail business set a new record with 232,867 lifts, a 1.1 percent increase over 2002.
Strong business from Canada (up 17 percent over 2002) contributed to the rise, along with the new Port
Newark rail facility, which completed its first full year of operation with more than 25,000 lifts. Because
on-dock rail capabilities are essential to rapid and efficient inland distribution, we are developing more
on-dock opportunities. At Port Newark/Elizabeth, a ceremonial first spike was driven by Governor McGreevey
31
to inaugurate construction of the new ExpressRail intermodal rail terminal. When completed, the container
transfer facility will have a capacity of up to one million container lifts per year.
In April, the Port Authority, the Port of Albany and a private barge operator inaugurated service on the Albany
ExpressBargeSM. This container barge service is part of the Port Authority’s concept of a Port Inland Distribution
Network, designed to speed the flow of goods between the port and inland markets, while reducing highway
truck traffic.
The Port Authority is meeting other global challenges by enhancing security at all of our maritime facilities. In
2003, enhancements included comprehensive, port-wide security audits, thorough surveys of all port tenants,
and the installation of closed-circuit TV systems at the New York and New Jersey marine terminals. The agency
also completed an Operations Control Center to improve security monitoring and emergency response.
Economic and Commercial Initiatives to Advance the Region
As part of our commitment to the region’s quality of life, the Port Authority pursued several important
transportation, redevelopment and economic development projects.
Building upon our position as a leading transportation agency, we expanded our role in developing and
enhancing regional ferry transportation. This effort included designing a new permanent ferry terminal
to accommodate increased traffic to Battery Park City in Lower Manhattan, investigating service to Lower
Manhattan from LaGuardia and Kennedy airports and Staten Island’s South Shore, and providing financial
support, along with the FTA and NJ Transit, for the restoration of the Historic Hoboken Ferry Terminal.
For local communities, the Port Authority advanced mixed-use, public-private waterfront improvement
projects in both New Jersey and New York. At the South Waterfront in Hoboken, N.J., a 470,000 square-foot
office building and 526-unit residential building transformed unused waterfront on three new city blocks.
A second 470,000 square-foot office building was completed and occupied in 2003. In addition, pre-
development agreements were executed with two developers to build a 200,000 square-foot, 275-room
hotel and a 450,000 square-foot office building on the waterfront site.
At Queens West, the waterfront development site on 74 acres of land at Hunters Point in Long Island City,
N.Y., a development deal was closed for construction of 3,200 residential units in seven buildings at the
32
Looking ahead, we’re focusing on financial
performance in 2004 in order to continue our commitment
to the region’s well-being and long-term prosperity.
northern end of the development. With New York City’s designation by the U.S. Olympic Committee as
a U.S. Candidate City for the 2012 Olympic Games, the Port Authority-owned property at the southern end
of Queens West has been identified as a possible site for the Olympic Village. Final selection of the host city
for the 2012 Games will be made in 2005.
We awarded more than $1 billion in construction contracts, an all-time high for the agency, surpassing the
record set in 2002. Our purchasing awards totaled $730 million, a 61 percent increase over 2002 and the
largest yearly amount awarded to date. Under the Port Authority’s minority, woman-owned and small business
enterprise program (M/W/SBE), $192.3 million in construction, goods and services and architectural and
engineering contracts were awarded in 2003. The total impact in the New York-New Jersey region of this
M/W/SBE program is estimated at creating 1,660 jobs, more than $73 million in wages and $313 million
in economic activity.
Toward the Future
The Port Authority has embarked on an extraordinary period in our distinguished history,
combining proven leadership and forward-thinking innovations within our core business.
The agency is dedicated to enduring partnerships, customer service and economic prosperity —
principles that reflect our strategic planning as well — and remains exceptionally well positioned
to deliver services and honor commitments to the millions of people who live, work, visit and
conduct business in New York and New Jersey. Building on the momentum we’ve gathered in
recent years — and accelerated in 2003 — to bring about valuable transportation solutions, we
are taking steps in 2004 to focus on our financial performance. Reinforcing our long-term
financial strength will ensure that the Port Authority has the ability in the years to come to fulfill
an agenda that is so critical to the well-being of the region. With solid foundations set in 2003,
we will continue to use our vision and expertise, fully dedicated to keeping the bistate region
moving forward.
33
To The Board of Commissioners of The Port Authority of New York and New Jersey
The Consolidated Financial Statements of The Port Authority of New York and New Jersey (including its
wholly-owned subsidiaries and affiliated entity) as of and for the years ended December 31, 2003 and
December 31, 2002, are enclosed. Responsibility for both the accuracy of the data and the completeness
and fairness of the presentation in the Consolidated Financial Statements rests with management of the
Port Authority. Management’s Discussion and Analysis (“MD&A”) of the Port Authority’s financial performance
and activity provides a narrative introduction, overview, and analysis to accompany the Consolidated Financial
Statements and is supplemental information that is required by accounting principles generally accepted
in the United States of America (“GAAP”). The Statistical Section provides statistical information with respect
to facility traffic and is also required by GAAP. Schedules A, B, and C have been prepared pursuant to the
requirements of law and Port Authority bond resolutions and are not intended to be a presentation in
conformity with GAAP. Schedules D, E, and F are supplementary information presented for purposes of
additional analysis, and are not a required part of the Consolidated Financial Statements. To the best of my
knowledge and belief, such financial and other information set forth in the Consolidated Financial Statements
is accurate in all material respects and is reported in a manner designed to present fairly the Port Authority’s
net assets, changes in net assets, and cash flows in conformity with GAAP.
On the basis that the cost of internal controls should not outweigh their benefits, the Port Authority has
established a comprehensive framework of internal controls to protect its assets from loss, theft, or misuse,
and to provide reasonable (rather than absolute) assurance regarding the reliability of financial reporting
and the preparation of the Consolidated Financial Statements in accordance with GAAP.
A firm of independent auditors is retained each year to conduct an audit of the Consolidated Financial
Statements in accordance with auditing standards generally accepted in the United States of America. The
goal of the independent audit is to provide reasonable assurance that the Consolidated Financial Statements
are free of material misstatement. The audit includes an examination, on a test basis, of the evidence
supporting the amounts and disclosures in the Consolidated Financial Statements, an assessment of the
accounting principles used and significant estimates made by management, as well as the overall presentation
of the Consolidated Financial Statements. In planning and performing their audit, the independent auditors
gave consideration to the Port Authority’s comprehensive framework of internal controls in order to determine
auditing procedures for the purpose of expressing an opinion on the Consolidated Financial Statements.
The independent auditors’ report is presented as the first component in the financial section following this letter.
The engagement of the independent auditors also includes an examination, based on federally mandated
standards, of the Single Audit Act of 1996 and the U.S. Office of Management and Budget Circular A-133,
“Audits of States, Local Governments and Non-profit Organizations,” designed to meet the special needs
of federal grantor agencies. The standards governing Single Audit engagements require the independent
auditors to report not only on the fair presentation of the financial statements, but also on the audited
government’s internal controls and compliance with legal requirements involving the administration of
federal awards.
This letter of transmittal is designed to complement the MD&A and should be read in conjunction with it.
225 Park Avenue South, New York, NY 10003-1604
34
Profile of the Port Authority
The Port Authority is a municipal corporate instrumentality and political subdivision of the States of
New York and New Jersey, which was established in 1921 to provide transportation, terminal, and other
facilities of commerce within the Port District, an area of about 1,500 square miles in both States centering
about New York Harbor. The Port Authority raises the funds necessary for the improvement, construction,
or acquisition of its facilities generally upon the basis of its own credit. It has neither the power to pledge
the credit of either State or any municipality nor to levy taxes or assessments.
The Port Authority maintains an infrastructure of financial systems to record the financial results of
operations and provide an audit trail to be used in a review of accountability.
The financial planning process integrates an annual budget process with multi-year forecasting projections.
Through the budget process, staff identifies strategic, financial and operational issues that affect resource
allocations; sets forth an expenditure plan for the year that balances priorities across all agency lines of
operation; and provides alternate financial scenarios of proposed operating and financial arrangements
and their impact on the agency’s financial position. Each new budget is separately considered and approved
by the Board of Commissioners, although such approval does not in itself authorize specific expenditures,
which are authorized from time to time by, or as contemplated by, other specific actions of the Board of
Commissioners.
The approved budget becomes a mechanism that facilitates the systematic review of program expenditures
to ensure that they are made consistent with statutory, contractual, and other commitments of the agency,
the policies and financial decisions of the Board of Commissioners and the requirements of the By-Laws
of the Port Authority. Forecasting models are used to assess the agency’s projected long-range financial
condition; determine the financial feasibility of future capital investment; and perform financial tests
to measure fiscal risk and to ensure the organization’s integrity in the credit markets. This comprehensive
approach to planning, budgeting and forecasting enables the agency to identify, track and take corrective
action with respect to the funding requirements needed to deliver the projects and services that the
Port Authority provides.
Regional Economic Condition and Outlook
The economy of the New York and New Jersey Region improved noticeably in 2003, with signs that the
recession was ending and growth was on the horizon. The year’s employment loss slowed to a decline
of 72,000, or 0.9 %, of the regional job base. This figure equaled about half of the job reductions that
occurred in 2002, when the region suffered the most dramatic effects from the events of September 11
and the national recession. Apart from the slowdown in the rate of job losses, there were many signs of
a burgeoning improvement in the regional economy. The equity markets ended 2003 with positive gains
for the year, breaking three years of decline. Residential construction was very strong, with more than
37,000 dwelling units valued at $5.6 billion built. New York City’s visitor market also picked up. In 2003,
the New York City hotel occupancy increased to 82.7 %, up from 79.3 % in 2002, and the average daily
room rate increased 3.5 %, to $235. In addition, the resumption of healthy corporate profits, combined
with robust productivity growth, bode well for the region’s corporate service industries and financial sector.
35
New York City once again accounted for the most job losses in the region, with a decline for the year
of 55,000 jobs, or 1.5 %. These were led by three of the most important sectors of the economy that
sell their services nationally and internationally. The Financial sector of New York City fell by 11,000 jobs,
the Information industry lost 12,800 jobs, and Professional and Business Services shed 14,800 jobs.
Manufacturing also experienced a downturn in jobs, losing 13,200 by year’s end. On the plus side,
Education and Health Services added 13,100 jobs and Leisure and Hospitality sector turned positive,
with a 2,700 job increase.
The Northern New Jersey economy was affected by many of the same forces that influenced New York
City’s economy, and the same employment sectors struggled in this part of the region. In the 8-county
Northern New Jersey area, jobs declined by 1.1 %, or 26,000. The Information industry, which includes
telecommunications, Internet service providers, and data processing services, lost 10,100 jobs, a 12.1 %
decline. Professional and Business Services declined 2.3 %, or 9,300 jobs. The Manufacturing and Financial
sectors also added to the job declines. On the positive side, Education and Health Services added 6,300
jobs, Leisure and Hospitality gained 5,100 jobs, and miscellaneous services grew by 1,700 jobs.
The New York Suburbs, comprised of Long Island, Westchester, and Rockland, was the only part of the
region to add jobs in 2003. Here, there was a net gain of 9,000 jobs, or 0.5 %. Professional and Business
Services added 7,500 jobs, and Education and Health Services gained 2,700 jobs. All parts of this area’s
economy grew, except Financial Activities, Information and Manufacturing. Long Island accounted for
80 % of the job gains in this sub-region.
Inflation in the New York and New Jersey region, as measured by the Consumer Price Index, advanced
3.1 %, 80 basis points higher than the national rate. Most of the differential is attributable to the region’s
housing costs, which are considerably higher than those of the rest of the nation, and to higher
transportation costs.
At the national level, the economy gained momentum in 2003. Preliminary estimates for the year indicate
a real Gross Domestic Product (GDP) growth of 3.1 %, compared with an increase of 2.2 % in 2002.
The nation’s economy grew, despite lagging labor markets, primarily because of productivity improvements.
For the year, nonfarm business productivity grew 4.4 %, more than twice the long-term rate. Meanwhile,
although output was expanding, the nation’s employment base declined by 0.3 %. Consumer spending
retained its position as the main driver of GDP growth, accounting for 70 % of GDP gains. Investment
and government expenditures each added more than 0.6 points to GDP growth, while trade served as
a small drag.
The national economy is expected to register robust GDP growth in 2004. The major risk for the nation,
and for this region, is the pace of job recovery. If job expansion does not begin soon, the overall recovery
could lose momentum. The improvement in the global economy in 2004, combined with the significant
appreciation of major currencies against the dollar in 2003, should bolster this region’s tourism economy.
Therefore, continued improvement in this region’s job markets is expected in 2004. However, the strength
of the region’s recovery will be contingent upon the nation’s employment growth returning to a more
typical pace.
36
Certificate of Achievement
The Government Finance Officers Association of the United States and Canada (GFOA) awarded
a Certificate of Achievement for Excellence in Financial Reporting to The Port Authority of New York and
New Jersey for its Comprehensive Annual Financial Report for the fiscal year ended December 31, 2002.
This was the nineteenth consecutive year that the Port Authority has achieved this prestigious award.
In order to be awarded a Certificate of Achievement, a government must publish an easily readable
and efficiently organized comprehensive annual financial report. This report must satisfy both generally
accepted accounting principles and applicable legal requirements.
A Certificate of Achievement is valid for a period of one year only. We believe that our current
Comprehensive Annual Financial Report continues to meet the Certificate of Achievement Program’s
requirements and we are submitting it to the GFOA to determine its eligibility for another certificate.
February 27, 2004
Charles F. McClaffertyChief Financial Officer
For the nineteenth consecutive year, The Port Authority of New York and New Jersey was awarded the Certificate of Achievement for Excellence in Financial Reporting by the Government Finance Officers Association of the UnitedStates and Canada for its 2002 Comprehensive AnnualFinancial Report.
foundationsFinancial Section
Prepared by the Comptroller’s Department
The Port Authority of New York and New Jersey Annual Report for the Year Ended December 31, 2003
39
Deloitte & Touche LLPTwo World Financial CenterNew York. New York 10281-1414
Board of CommissionersThe Port Authority of New York and New Jersey
We have audited the accompanying consolidated statements of net assets of The Port Authority of New York and New Jersey,which includes its wholly-owned subsidiaries and affiliated entity (collectively the “Port Authority”), as of December 31, 2003 and2002, and the related consolidated statements of revenues, expenses, and changes in net assets and cash flows for the years thenended. We also audited the financial information included in Schedules A, B, and C. These consolidated financial statements andschedules are the responsibility of the Port Authority’s management. Our responsibility is to express an opinion on the financialstatements based on our audit.
We conducted our audit in accordance with auditing standards generally accepted in the United States of America. Thosestandards require that we plan and perform the audit to obtain reasonable assurance about whether the financial statements and schedules are free of material misstatement. An audit includes examining, on a test basis, evidence supporting the amountsand disclosures in the financial statements and schedules. An audit also includes assessing the accounting principles used andsignificant estimates made by management, as well as evaluating the overall financial statement and schedule presentation. We believe that our audit provides a reasonable basis for our opinion.
In our opinion, the consolidated financial statements referred to above present fairly, in all material respects, the net assets of thePort Authority as of December 31, 2003 and 2002, and the changes in its net assets, and cash flows for the years then ended inconformity with accounting principles generally accepted in the United States of America.
The accompanying Schedules A, B, and C have been prepared pursuant to the requirements of law and Port Authority bondresolutions and are not intended to be a presentation in conformity with accounting principles generally accepted in the UnitedStates of America. However, in our opinion, Schedules A, B, and C present fairly, in all material respects, the assets and liabilities of the Port Authority at December 31, 2003 and 2002, and the revenues and reserves for the years then ended in conformity withthe accounting principles described in Note A-4.
The “Management’s Discussion and Analysis” is not a required part of the consolidated financial statements but is supplementalinformation required by the Governmental Accounting Standards Board. This supplemental information is the responsibility of thePort Authority’s management. We have applied certain limited procedures, which consisted principally of inquiries of managementof the Port Authority regarding the methods of measurement and presentation of this supplemental information. However, we didnot audit such information and we do not express an opinion on it.
Our audits were conducted for the purpose of forming opinions on the consolidated financial statements and Schedules A, B, and C taken as a whole. The supplemental information presented in Schedules D, E, and F is presented for purposes of additionalanalysis and is not a required part of the consolidated financial statements. This supplemental information is the responsibility of the Port Authority’s management. The supplemental information presented in Schedules D, E, and F has been subjected to the auditing procedures applied by us in the audit of the consolidated financial statements and in our opinion, is fairly stated in all material respects in relation to the consolidated financial statements taken as a whole.
February 27, 2004
Report of Independent Auditors
40
Management’s Discussion and Analysis Year ended December 31, 2003
IntroductionThe following discussion and analysis of the financial performance and activity of The Port Authority of New York and New Jersey(Port Authority) is intended to provide an introduction to and understanding of the financial statements of the Port Authority,which includes its wholly-owned subsidiaries, the Port Authority Trans-Hudson Corporation (PATH), the Newark Legal andCommunications Center Urban Renewal Corporation, and the New York and New Jersey Railroad Corporation, and its affiliatedentity WTC Retail LLC, for the year ended December 31, 2003, with selected comparative information for the year endedDecember 31, 2002. This section has been prepared by the management of the Port Authority and should be read in conjunctionwith the financial statements and the notes thereto, which follow this section.
Financial Highlights• The Port Authority continued to demonstrate financial strength in 2003 with an increase in net assets of $883 million.
• Gross operating revenues of $2.8 billion increased by $93 million in 2003 compared to 2002.
• Operating expenses of $1.9 billion in 2003 reflected an increase of $33 million from 2002.
• During 2003, the Port Authority recognized receipts of $684 million from insurance proceeds and the Federal EmergencyManagement Agency (FEMA) related to the events of September 11, 2001.
• Capital expenditures totaled $1.9 billion in 2003, an increase of $388 million from 2002.
• Certain elements of the John F. Kennedy International Airport AirTrain system (JFK AirTrain) opened in December of thisyear including the on-airport terminal connector in the Central Terminal Area and the link to existing transit lines in Howard Beach Queens, New York. Approximately $1.4 billion in capital expenditures related to the JFK AirTrain project was transferred to completed construction in 2003.
• Construction of the temporary PATH station at the World Trade Center (WTC) site was completed this year and the stationopened in November 2003. Cumulative costs associated with the construction of the temporary station, along with therehabilitation of the PATH Exchange Place Station, which reopened in June 2003, and associated track and tunnel worktotaled $551 million, of which $395 million was spent in 2003.
• In 2003, the Port Authority entered into a Memorandum of Understanding (MOU) with the City of New York with respectto the lease agreement covering John F. Kennedy International Airport (JFK) and LaGuardia Airport (LGA), and a MOU withthe Brooklyn Bridge Park Development Corporation (BBPDC) with respect to the transfer of piers 1, 2, 3, and 5 at theBrooklyn-Port Authority Marine Terminal to BBPDC. As of December 31, 2003, certain liabilities and expenses associatedwith the MOU have been reflected in the financial records of the Port Authority (see Notes G and J).
Overview of the Financial StatementsThe financial section of this annual report consists of five parts: management’s discussion and analysis, the basic financialstatements, the notes to the financial statements, financial schedules pursuant to Port Authority bond resolutions, and othersupplemental information. The basic financial statements include: the Consolidated Statements of Net Assets, the ConsolidatedStatements of Revenues, Expenses and Changes in Net Assets, and the Consolidated Statements of Cash Flows.
Consolidated Statements of Net AssetsThe Consolidated Statements of Net Assets present the financial position of the Port Authority at the end of the fiscal year andinclude all assets and liabilities of the Port Authority. Net assets represent the difference between total assets and total liabilities. A summarized comparison of the Port Authority’s assets, liabilities, and net assets at December 31, 2003 and 2002 follows:
Facilities, net 11,403,696 10,077,080Other noncurrent assets 4,927,291 4,778,952
Total assets 18,879,282 16,903,012
LIABILITIES
Current liabilities 2,584,217 1,717,123Noncurrent liabilities
Bonds and other asset financing obligations 7,470,893 7,294,147Other noncurrent liabilities 2,021,841 1,972,447
Total liabilities 12,076,951 10,983,717
NET ASSETS
Invested in capital assets, net of related debt 5,397,959 4,492,027Restricted 15,153 16,505Unrestricted 1,389,219 1,410,763
Total net assets $ 6,802,331 $ 5,919,295
In its eighty-second year of existence, the Port Authority’s financial position remained strong at December 31, 2003, with assets of $18.9 billion and liabilities of $12.1 billion. Investment in facilities, net of depreciation, increased $1.3 billion from 2002. Thisamount includes both fully completed facilities and construction in progress.
The Port Authority’s current investments increased by $493 million from 2002 stemming from an increase in short term investments in United States Government securities and commercial paper notes.
At December 31, 2003, the Port Authority had recognized liabilities totaling $856 million for rents, an increase of $690 million over the prior year. This increase was primarily due to an accrual for increased rental obligations associated with the anticipatedextension of the lease agreement covering JFK and LGA pursuant to the MOU between the City of New York and the Port Authority.
Net assets, which represent the residual interest in the Port Authority’s assets after liabilities are deducted, were $6.8 billion at December 31, 2003, an increase of $883 million from 2002. Invested in capital assets, net of related debt, increased by$906 million to $5.4 billion. Amounts reported as restricted net assets consist of restricted receivables in connection withPassenger Facility Charges, which decreased $1.3 million from 2002. Unrestricted net assets decreased by $22 million from 2002.
41
Management’s Discussion and Analysis(continued)
42
Management’s Discussion and Analysis(continued)
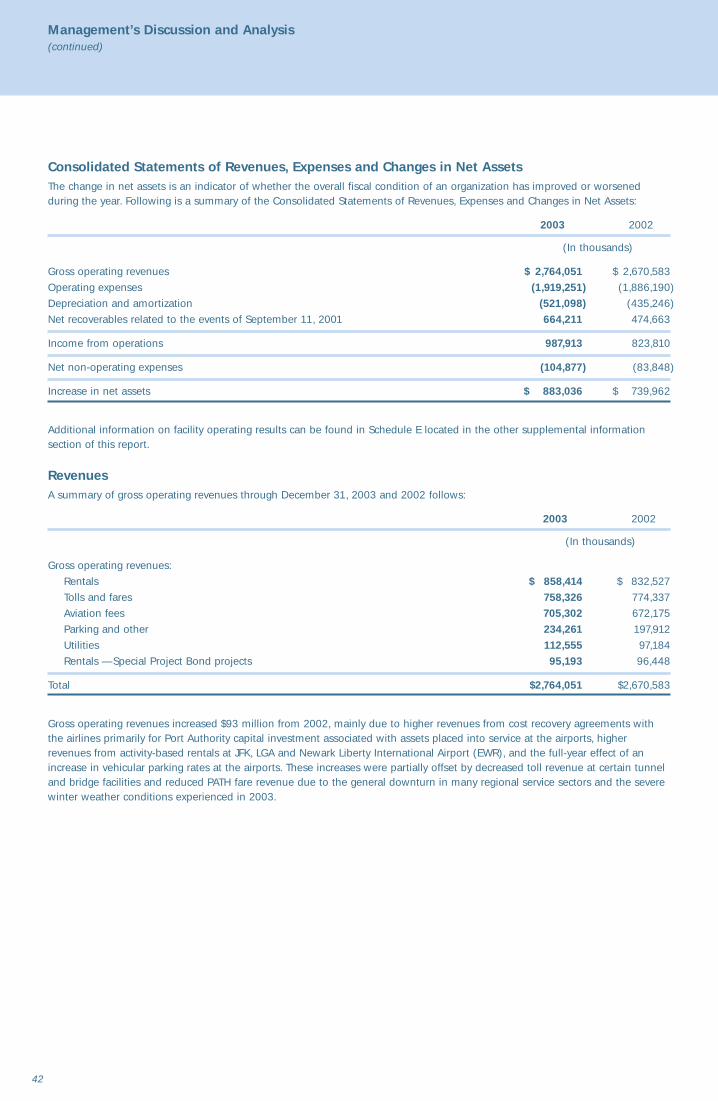
Consolidated Statements of Revenues, Expenses and Changes in Net AssetsThe change in net assets is an indicator of whether the overall fiscal condition of an organization has improved or worsenedduring the year. Following is a summary of the Consolidated Statements of Revenues, Expenses and Changes in Net Assets:
2003 2002
(In thousands)
Gross operating revenues $ 2,764,051 $ 2,670,583Operating expenses (1,919,251) (1,886,190)Depreciation and amortization (521,098) (435,246)Net recoverables related to the events of September 11, 2001 664,211 474,663
Income from operations 987,913 823,810
Net non-operating expenses (104,877) (83,848)
Increase in net assets $ 883,036 $ 739,962
Additional information on facility operating results can be found in Schedule E located in the other supplemental informationsection of this report.
RevenuesA summary of gross operating revenues through December 31, 2003 and 2002 follows:
2003 2002
(In thousands)
Gross operating revenues:Rentals $ 858,414 $ 832,527Tolls and fares 758,326 774,337Aviation fees 705,302 672,175Parking and other 234,261 197,912Utilities 112,555 97,184Rentals — Special Project Bond projects 95,193 96,448
Total $2,764,051 $2,670,583
Gross operating revenues increased $93 million from 2002, mainly due to higher revenues from cost recovery agreements withthe airlines primarily for Port Authority capital investment associated with assets placed into service at the airports, higherrevenues from activity-based rentals at JFK, LGA and Newark Liberty International Airport (EWR), and the full-year effect of anincrease in vehicular parking rates at the airports. These increases were partially offset by decreased toll revenue at certain tunneland bridge facilities and reduced PATH fare revenue due to the general downturn in many regional service sectors and the severewinter weather conditions experienced in 2003.
43
Management’s Discussion and Analysis(continued)
ExpensesA summary of operating expenses, including depreciation and amortization, through December 31, 2003 and 2002 follows:
2003 2002
(In thousands)
Operating expenses:Employee compensation, including benefits $ 769,711 $ 777,146Contract services 543,926 622,781Rents and amounts in-lieu-of taxes 237,276 140,614Materials, equipment and other 150,700 135,321Utilities 122,445 113,880Interest on Special Project Bonds 95,193 96,448
Total operating expenses 1,919,251 1,886,190Depreciation and amortization 521,098 435,246
Total $2,440,349 $2,321,436
Operating expenses, including depreciation and amortization, totaled $2.4 billion through December 31, 2003, an increase of$119 million over 2002. Total rents and amounts in-lieu-of taxes increased by $97 million resulting from an increase in municipalrent expense associated with the anticipated extension of the lease with the City of New York for JFK and LGA. Total depreciationand amortization expense increased by $86 million primarily due to the completion of construction and placement into service of the JFK AirTrain and the Exchange Place and temporary WTC PATH Stations in 2003, the planned transfer of Brooklyn-PortAuthority Marine Terminal Piers 1, 2, 3 and 5 to BBPDC, and the demolition of the former Port Authority Administration Buildingat EWR. Increased expenses were partially offset by lower contract service costs of $79 million primarily in the area ofarchitectural, engineering and construction contracts and because costs associated with the termination of the E-ZPassConsortium were recognized in 2002.
Recoverables Related to the Events of September 11, 20012003 2002
Total net recoverables related to the events of September 11, 2001 $664,211 $474,663
Approximately $684 million was received by the Port Authority in 2003 comprising $309 million in insurance advances and$375 million in payments from FEMA. These amounts represent reimbursements to the Port Authority for costs incurred in itsrecovery efforts and for business interruption costs resulting from the events of September 11, 2001. Of these amounts,$682 million was recognized as revenue in 2003, and the balance was applied to a portion of the outstanding receivablerepresenting the net book value of the properties destroyed as a result of the terrorist attacks.
As of December 31, 2003, cumulative insurance proceeds and payments from FEMA recognized by the Port Authority totaledapproximately $1.37 billion. Of this amount, $869 million has been recognized as income net of $429 million of expenses relatedto the events of September 11, 2001, primarily the cost of office space necessary to replace the Port Authority’s offices that werelocated at the World Trade Center, and the balance of approximately $68 million has been applied to a portion of the outstandingreceivable representing the net book value of the properties destroyed as a result of the terrorist attacks.
44
Management’s Discussion and Analysis(continued)
Non-operating Revenues and Expenses2003 2002
(In thousands)
Non-operating revenues and (expenses):Income on investments $ 50,306 $ 67,898Increase in fair value of investments 15,842 29,914Interest expense in connection with bonds and other asset financing (344,755) (336,725)
Net financial expense (278,607) (238,913)
Gain on Disposition of Assets 787 —
Passenger Facility Charges 109,111 110,471
Contributions in aid of construction 57,568 36,258Grants 34,501 19,892Regional ferry pass-through grant program payments (28,237) (11,556)
Net non-operating grants 63,832 44,594
Net non-operating expenses $(104,877) $ (83,848)
Financial income, which totaled $66 million for 2003, decreased by $32 million reflecting a lower interest rate environment in2003 compared to 2002. Financial expense of $345 million in 2003 remained relatively stable compared to 2002.
Contributions and grants provided by others to the Port Authority in 2003 were as follows:
• Contributions received in aid of construction from federal, state and other entities with respect to Port Authority facilitiestotaled $58 million.
• Federal and state pass-through grants designated for the expansion of ferry transportation service across the Hudson River topartially offset lost interstate mass transportation capacity between New York and New Jersey totaled $28 million.
• Grants received for reimbursement of snow removal costs incurred in connection with the February 2003 snowstorm totaled$3.3 million.
• Grants for implementing enhanced security measures at various ports in the bi-state region totaled $1.9 million.
Capital ConstructionDuring 2003, Port Authority expenditures and amounts accrued for capital construction projects totaled $1.9 billion, an increase of $388 million from last year’s activity. Capital construction in 2003 was primarily associated with the following projects:
• Exchange Place and Temporary WTC PATH Stations*• PATH Tunnels E & F*• AirTrain at JFK
- On-airport Terminal Connector*- Link to Transit Lines in Howard Beach Queens, New York*- Link to Transit Lines in Jamaica Queens, New York
• General harbor channel improvements• Terminal developments at various New Jersey marine terminals• NY Economic Development and Regional Transportation Programs• Runway, taxiway, roadway and parking area rehabilitation work at JFK, EWR and LGA• Rehabilitation projects at various Port Authority tunnel and bridge facilities• Implementation of the E-ZPass Fare Collection System at the parking lots located at JFK, EWR and LGA*• Elizabeth Marine Terminal roadway improvements*
* Project was completed in 2003.
In connection with the adoption of the 2004 Budget, the Port Authority has approved a capital plan which calls for total spendingof approximately $9 billion over the 2004 to 2008 period as follows:
Additional capital investment information on Port Authority facilities can be found in Note B to the financial statements and inSchedule F located in the other supplemental information section of this report.
Capital Financing and Debt ManagementAs of December 31, 2003, bonds and other asset financing obligations of the Port Authority totaled $8.4 billion, a $443 millionyear to year increase.
During 2003, the Port Authority issued approximately $1.4 billion in new consolidated bonds and notes. Of this amount,$1.3 billion was issued to fund capital construction projects in connection with Port Authority facilities and $84 million was usedto refund existing outstanding obligations.
In 2003, the Port Authority was awarded a grant by the Federal Transit Administration of approximately $1.7 billion which will beused in connection with the permanent PATH terminal at the WTC site.
Listed below is a summary of credit ratings that are assigned to the outstanding obligations of the Port Authority. The ratings forthe obligations outstanding in 2002 have remained the same for 2003. It is important to note that subsequent to the events ofSeptember 11, 2001, Standard & Poor’s placed all United States and Canadian Airports, as well as the Port Authority, on creditwatch with negative implications. In January 2004, Standard & Poor’s changed the Port Authority’s outlook to stable. During2003, Moody’s and Fitch considered the Port Authority’s outlook as stable.
OBLIGATION S&P Fitch Moody’sConsolidated Bonds AA– AA– A1Consolidated Notes SP-1+ F-1+ MIG1Commercial Paper A-1+ F-1+ P-1VSO Short Term A-1+ F-1+ VMIG1VSO Long Term A– A+ A2
Each rating reflects only the view of the ratings service issuing such rating and is not a recommendation by such ratings service topurchase, sell or hold any maturity of Port Authority Bonds or as to market price or suitability of any maturity of the Bonds for aparticular investor. An explanation of the significance of a rating may be obtained from the ratings service issuing such rating.There is no assurance that any rating will continue for any period of time or that it will not be revised or withdrawn. A revision orwithdrawal of a rating may have an effect on market price.
Additional information on Port Authority debt can be found in Note D to the financial statements.
45
Management’s Discussion and Analysis(continued)
46
Consolidated Statements of Net Assets
December 31,
2003 2002
(In thousands)
ASSETS
Current assets:
Cash $ 29,398 $ 40,563Investments 2,156,871 1,663,474Current receivables, net 282,113 275,294Other current assets 64,760 51,144Restricted receivables in connection with Passenger Facility Charges 15,153 16,505
Total current assets 2,548,295 2,046,980
Noncurrent assets:
Restricted cash 10,295 9,362 Investments 1,069,794 1,329,837Other amounts receivable, net 1,036,473 1,274,239Deferred charges and other noncurrent assets 952,491 354,134Amounts receivable — Special Project Bond projects 1,404,074 1,425,270Unamortized costs for regional programs 454,164 386,110Facilities, net 11,403,696 10,077,080
Total noncurrent assets 16,330,987 14,856,032
Total assets 18,879,282 16,903,012
LIABILITIES
Current liabilities:
Accounts payable 525,829 565,695Accrued interest and other current liabilities 1,077,225 430,975Accrued payroll and other employee benefits 99,942 105,162Current portion bonds and other asset financing obligations 881,221 615,291
Total current liabilities 2,584,217 1,717,123
Noncurrent liabilities:
Accrued pension and other noncurrent employee benefits 533,524 465,547Other noncurrent liabilities 84,243 81,630Amounts payable — Special Project Bonds 1,404,074 1,425,270Bonds and other asset financing obligations 7,470,893 7,294,147
Total noncurrent liabilities 9,492,734 9,266,594
Total liabilities 12,076,951 10,983,717
NET ASSETS $ 6,802,331 $ 5,919,295
Net assets are composed of:
Invested in capital assets, net of related debt $ 5,397,959 $ 4,492,027Restricted 15,153 16,505Unrestricted 1,389,219 1,410,763
Net assets $ 6,802,331 $ 5,919,295
See Notes to Consolidated Financial Statements.
47
Consolidated Statements of Revenues, Expenses and Changes in Net Assets
Year ended December 31,
2003 2002
(In thousands)
Gross operating revenues:
Rentals $ 858,414 $ 832,527Tolls and fares 758,326 774,337Aviation fees 705,302 672,175Parking and other 234,261 197,912Utilities 112,555 97,184Rentals — Special Project Bond projects 95,193 96,448
Total gross operating revenues 2,764,051 2,670,583
Operating expenses:
Employee compensation, including benefits 769,711 777,146Contract services 543,926 622,781Rents and amounts in-lieu-of taxes 237,276 140,614Materials, equipment and other 150,700 135,321Utilities 122,445 113,880Interest on Special Project Bonds 95,193 96,448
Total operating expenses 1,919,251 1,886,190
Net recoverables related to the events of September 11, 2001 664,211 474,663Depreciation of facilities (488,986) (406,484)Amortization of costs for regional programs (32,112) (28,762)
Income from operations 987,913 823,810
Non-operating revenues and (expenses):
Income on investments 50,306 67,898Net increase in fair value of investments 15,842 29,914Interest expense in connection with bonds and other asset financing (344,755) (336,725)Gain on disposition of assets 787 —Passenger Facility Charges 109,111 110,471Contributions in aid of construction 57,568 36,258Grants 34,501 19,892Regional ferry pass-through grant program payments (28,237) (11,556)
Increase in net assets 883,036 739,962Net assets, January 1 5,919,295 5,179,333
Net assets, December 31 $6,802,331 $5,919,295
See Notes to Consolidated Financial Statements.
48
Consolidated Statements of Cash Flows
Year ended December 31,
2003 2002
(In thousands)
1. Cash flows from operating activities:
Cash received from operations $ 2,647,634 $ 2,576,509Cash received related to the events of September 11, 2001 683,749 613,952Cash paid to suppliers (885,650) (901,805)Cash paid to or on behalf of employees (706,375) (714,793)Cash paid to municipalities (136,684) (153,930)Cash payments related to the events of September 11, 2001 (21,427) (126,068)
Net cash provided by operating activities 1,581,247 1,293,865
Cash flows from capital activities:
Proceeds from sales of capital obligations 1,365,507 759,868 Principal paid on capital obligations (887,729) (470,615)Proceeds from capital obligations issued for refunding purposes 2,078,996 2,607,108 Principal paid through capital obligations refundings (2,078,996) (2,607,108)Interest paid on capital obligations (385,755) (396,305)Investment in facilities and construction of capital assets (1,513,037) (1,396,263)Financial income allocated to capital projects 1,380 2,592 Investment in regional programs (100,166) 2,937 Insurance proceeds related to the destruction of Port Authority
property on September 11, 2001 — 36,347 Contributions in aid of construction 62,376 30,727
Subtotal (1,457,424) (1,430,712)
Cash flows from related financing activities:
Interest paid on equipment notes (1,083) (1,838)Principal paid on equipment notes (45,300) (5,000)Payments for Fund buy-out obligation (35,213) (35,215)Proceeds from Passenger Facility Charges 110,463 105,128 Grants 34,501 19,892 Regional ferry pass-through grant program payments (28,237) (11,556)
Subtotal 35,131 71,411
Net cash used for capital and related financing activities (1,422,293) (1,359,301)
Cash flows from investing activities:
Purchase of investment securities (66,562,489) (44,372,147)Proceeds from maturity and sale of investment securities 66,345,245 44,383,978 Interest received on investment securities 31,563 41,190 Miscellaneous financial income 16,495 15,605
Net cash (used for) provided by investing activities (169,186) 68,626
Net (decrease) increase in cash (10,232) 3,190 Cash at beginning of year 49,925 46,735
Cash at end of year $ 39,693 $ 49,925
(Consolidated Statements of Cash Flows continued on next page.)
See Notes to Consolidated Financial Statements.
49
Consolidated Statements of Cash Flows (continued)
Year ended December 31,
2003 2002
(In thousands)
2. Reconciliation of income from operations to net cash provided by operating activities:
Income from operations $ 987,913 $ 823,810
Adjustments to reconcile income from operations to net cash provided by operating activities:
Depreciation of facilities 488,986 406,484Amortization of costs for regional programs 32,112 28,762Amortization of other assets 35,267 57,400
Change in operating assets and operating liabilities:(Increase) decrease in receivables (20,498) 5,590(Increase) in prepaid expenses (46,060) (218,898)Decrease in payables (10,361) (41,291)Increase in employee benefits 62,757 60,169Increase in other liabilities 49,650 171,877Increase (decrease) in deferred income 1,481 (38)
Total adjustments 593,334 470,055
Net cash provided by operating activities $1,581,247 $1,293,865
3. Capital obligations:
Consolidated bonds and notes, commercial paper, variable rate master notes and versatile structure obligations.
4. Noncash capital financing activity:
Noncash activity of $85,377,000 in 2003 and $88,663,000 in 2002 includes amortization of discount and premium onconsolidated bonds and notes, accretion associated with capital appreciation bonds and amounts payable in connection withSpecial Project Bonds. Noncash capital financing did not include any activities that required a change in fair value.
See Notes to Consolidated Financial Statements.
Note A Nature of the Organization and Summary of Significant Accounting Policies
1. Reporting Entity
a. The Port Authority of New York and New Jersey was created in 1921 by Compact between the two States and consented toby the Congress of the United States. The Compact envisions the Port Authority as being financially self-sustaining. As such, itmust raise the funds necessary for the improvement, construction or acquisition of its facilities generally upon the basis of itsown credit. Cash derived from Port Authority operations and other cash received may be disbursed only for specific purposes inaccordance with provisions of various statutes and agreements with holders of its obligations and others. The costs of providingfacilities and services to the general public on a continuing basis are recovered primarily from operating revenue sources,including rentals, tolls, fares, aviation fees and other charges.
b. The Governor of each State, with the consent of the respective State Senate, appoints six of the twelve members of thegoverning Board of Commissioners. The Commissioners serve without remuneration for six-year overlapping terms. Meetingsof the Commissioners of the Port Authority are open to the public in accordance with policies adopted by the Commissioners;the actions the Commissioners take at Port Authority meetings are subject to gubernatorial review and may be vetoed by theGovernor of their respective State.
c. The Audit Committee, which consists of four members of the Board of Commissioners, provides oversight of the quality andintegrity of the accounting, auditing and financial reporting processes. The independent auditors are retained by and meet directly,on a regular basis, with the Audit Committee. The Audit Committee also reviews the performance and independence of theindependent auditors, who are required to provide written disclosure of, and discuss with the Committee, any significantrelationships or issues that would have a bearing on their independence. The Chairman of the Audit Committee periodicallyadvises the Board of Commissioners on the activities of the Committee.
d. The financial statements and schedules include the accounts of the Port Authority and its wholly-owned subsidiaries, PortAuthority Trans-Hudson Corporation (PATH), the Newark Legal and Communications Center Urban Renewal Corporation, theNew York and New Jersey Railroad Corporation, and in 2003, its affiliated entity WTC Retail LLC.
2. Basis of Accounting
a. The Port Authority’s activities are accounted for using the flow of economic resources measurement focus and the accrualbasis of accounting. All assets, liabilities, net assets, revenues and expenses are accounted for in an enterprise fund with revenuesrecorded when earned and expenses recorded at the time liabilities are incurred.
b. In its accounting and financial reporting, the Port Authority follows the pronouncements of the Governmental AccountingStandards Board (GASB). In addition, the Port Authority follows the pronouncements of all applicable Financial AccountingStandards Board Statements and Interpretations, Accounting Principles Board Opinions and Accounting Research Bulletins of theCommittee on Accounting Procedure issued on or before November 30, 1989, unless they conflict with or contradict GASBpronouncements.
3. Significant Accounting Policies
a. Facilities are carried at cost. Facilities do not include regional programs undertaken at the request of the Governor of the Stateof New Jersey or the Governor of the State of New York (see Note H). Costs that benefit future accounting periods and areexpected to prolong the service lives of assets beyond the originally assigned life are capitalized, including net interest expenseincurred from the date of issuance of debt for purposes of a capital project until such project is completed and ready for itsintended use (see Note B).
b. Depreciation of facilities is computed using the straight-line method during the estimated useful lives of the related assets. Theuseful lives of assets are developed by the various related disciplines in the Port Authority’s Engineering Department utilizing pastexperience, standard industrial expectations, and external sources such as consultants, manufacturers and contractors. Useful lives arereviewed periodically for each specific type of asset class. Asset lives used in the calculation of depreciation are generally as follows:
Buildings, bridges, tunnels, other structures 25 to 100 years
Machinery and equipment 5 to 35 years
Runways, roadways and other paving 10 to 20 years
Utility infrastructure 20 to 40 years
Assets located at facilities leased by the Port Authority from others are depreciated over the lesser of the remaining term of thefacility lease or the asset life stated above.
50
Notes to Consolidated Financial Statements
51
Costs of regional programs are amortized on a straight-line basis (see Note H). Certain operating costs, which provide benefits forperiods exceeding one year, are deferred and amortized over the period benefited.
c. Cash consists of cash on hand and demand deposits.
d. Inventories are valued at average cost.
e. Operating revenues include rentals, tolls, fares, aviation fees, and other charges derived in connection with the use of andprivileges granted at Port Authority facilities, and amounts received from operating grants. Operating expenses include those costsincurred for the operation, maintenance and security of Port Authority facilities. All other revenues, which include financialincome, Passenger Facility Charges (PFCs), contributions in aid of construction, non-operating grants, and gains resulting from thedisposition of assets, if any, are reported as non-operating revenues, and all other expenses, such as interest expense, lossesresulting from the disposition of assets, and pass-through grant sponsor costs are reported as non-operating expenses.
f. Pursuant to the Aviation Safety and Capacity Expansion Act of 1990, the Port Authority has been authorized to impose$3 Passenger Facility Charges on enplaning passengers. Amounts attributable to the collection and investment of PFCs are restrictedand can only be used for Federal Aviation Administration approved airport-related projects. Revenue derived from the collection ofPFCs, net of the air carriers’ handling charges, is recognized and reported as non-operating revenue in the year the fees are duefrom the air carriers (see Consolidated Statements of Revenues, Expenses and Changes in Net Assets and Schedule E). PFC revenueapplied to eligible capital projects is reflected as a component of “Facilities, net” on the Consolidated Statements of Net Assets andSchedule F.
g. All Port Authority investments whose values are affected by interest rate changes have been reported at their fair value, usingpublished market prices. The Port Authority is authorized to use a variety of financial instruments to assist in the management ofits financing and investment objectives. The Port Authority may also employ hedging strategies to minimize interest rate risk andenters into various derivative instruments, including options on United States Treasury securities, repurchase and reverserepurchase (yield maintenance) agreements, United States Treasury and municipal bond futures contracts (see Note C) andinterest rate exchange contracts (swaps) (see Note D).
h. When issuing new debt for refunding purposes, the difference between the acquisition price of the new debt and the netcarrying amount of the refunded debt is deferred and amortized as a component of interest expense over the remaining lifeof the old debt or the life of the new debt, whichever is shorter.
i. Environmental costs, including costs associated with the Port Authority’s dredging and disposal plan, are generally charged asan operating expense. However, such costs, when they result in the construction of a new asset or the improvement of an existingasset compared with its condition when it was constructed or acquired, are capitalized. Improved asset conditions include theextension of the useful life, increased capacity, and improvement of safety or efficiency.
j. The 2002 financial statements contain the reclassification of certain amounts, which have been made in order to conformto the classifications in 2003.
4. Reconciliation of Consolidated Statements Prepared in Accordance with Accounting Principles Generally Accepted inthe United States of America to Schedules Prepared Pursuant to Port Authority Bond Resolutions
Schedules A, B, and C, which follow the notes to the consolidated financial statements, have been prepared in accordance withlegal requirements and Port Authority bond resolutions which differ in some respects from accounting principles that are generallyaccepted in the United States of America, as follows:
a. The revenues and expenses of facilities are accounted for in the operating fund. The financial resources expended for theconstruction or acquisition of major facilities or improvements are accounted for in the capital fund. Transactions involving theapplication of net revenues are accounted for in the reserve funds.
Notes to Consolidated Financial Statements(continued)
52
Notes to Consolidated Financial Statements (continued)
b. Consistent with Port Authority bond resolutions, Passenger Facility Charges are deferred until spent on approved project costs.Unspent PFC program amounts are a Port Authority liability, which are reflected as “Deferred income in connection with PFCs”. A reconciliation of revenues related to PFCs on the Consolidated Statements of Revenues, Expenses and Changes in Net Assets to deferred income in connection with PFCs on Schedule B — Assets and Liabilities follows:
PFC deferred income, December 31 $ 15,153 $ 16,505
c. Port Authority bond resolutions provide that net operating revenues shall not include an allowance for depreciation on facilitiesother than of ancillary equipment. Thus, depreciation is not a significant factor in determining the net revenues and the reserves ofthe Port Authority or their application as provided in the Port Authority’s bond resolutions. Instead, facility capital costs are providedfor through deductions from net revenues and reserves of amounts equal to principal payments on debt or through directinvestment in facilities. These amounts are credited at par to “Facility infrastructure investment” on Schedule B — Assets andLiabilities.
d. Debt service in connection with operating asset obligations is paid from the same revenues and in the same manner asoperating expenses of the Port Authority.
e. Capital costs for regional programs are included in “Invested in facilities” in accordance with Port Authority bond resolutions.
f. Consolidated bonds and notes are recorded as outstanding at their par value commencing on the date that the Port Authorityis contractually obligated to issue and sell such obligations. Discounts and premiums are capitalized at issuance.
g. To reflect the cumulative amount invested by the Port Authority since 1921 in connection with its facilities, the cost of assetsremoved from service is not deducted from “Invested in facilities”. However, in the event of the sale of assets removed fromservice or recovery of amounts related to assets destroyed or damaged, the amount of proceeds received from such sale orrecovery is deducted from “Invested in facilities”.
53
Notes to Consolidated Financial Statements (continued)
A reconciliation of the Consolidated Statements of Revenues, Expenses and Changes in Net Assets and the Consolidated Statements of Net Assets to Schedules A and B follows:
Consolidated Statements of Revenues, Expenses and Changes in Net Assets to Schedule A — Revenues and Reserves
Year ended December 31,
2003 2002
(In thousands)
Increase in net assets reported on Consolidated Statements of Revenues, Expenses and Changes in Net Assets $ 883,036 $ 739,962
Add: Depreciation of facilities 488,986 406,484Amortization of costs for regional programs 32,112 28,762Amortization of discount and premium 7,728 5,409
1,411,862 1,180,617
Less: Debt maturities and retirements 698,280 181,250Call premiums on refunded bonds 839 4,957Repayment of capital asset obligations 6,329 5,863Debt retirement acceleration 183,120 283,502Appropriations for self-insurance 15,201 19,017 Direct investment in facilities 542,260 433,747Gain on disposition of assets 787 —Passenger Facility Charges 109,111 110,471PFC income on investments (including net increase in
fair value of investments) 4 —
1,555,931 1,038,807
(Decrease) increase in reserves reported on Schedule A — Revenues and Reserves (pursuant to Port Authority bond resolutions) $ (144,069) $ 141,810
Consolidated Statements of Net Assets To Schedule B — Assets and Liabilities
December 31,
2003 2002
(In thousands)
Net assets reported on Consolidated Statements of Net Assets $ 6,802,331 $ 5,919,295
Add: Accumulated depreciation of facilities 5,593,461 5,158,970Accumulated retirements and gains and losses on disposal
of invested in facilities 1,563,819 1,510,111Cumulative amortization of costs for regional programs 656,112 624,000Cumulative amortization of discount and premium 55,028 48,139
14,670,751 13,260,515Less: Deferred income in connection with PFCs 15,153 16,505
Net assets reported on Schedule B — Assets and Liabilities (pursuant to Port Authority bond resolutions) $14,655,598 $13,244,010
54
Notes to Consolidated Financial Statements(continued)
Note B Facilities
1. Facilities, net is comprised of the following:
Beginning Endof Year Additions Transfers Retirements of Year
(In thousands)
2003Facilities
Land $ 502,095 $ — $ 15,611 $ — $ 517,706Buildings, bridges, tunnels, other structures 4,479,493 — 1,120,749 (21,550) 5,578,692Machinery and equipment 3,148,599 — 1,300,572 (12,895) 4,436,276Runways, roadways and other paving 2,478,900 — 491,380 (11,869) 2,958,411Utility infrastructure 1,573,682 — 186,996 (8,181) 1,752,497Construction in progress 3,053,281 1,815,602 (3,115,308) — 1,753,575
Total Facilities 15,236,050 1,815,602 — (54,495) 16,997,157
Less accumulated depreciation:Buildings, bridges, tunnels, other structures 1,961,791 166,778 — (21,550) 2,107,019Machinery and equipment 1,397,433 133,124 — (12,895) 1,517,662Runways, roadways and other paving 1,030,533 117,119 — (11,869) 1,135,783Utility infrastructure 769,213 71,965 — (8,181) 832,997
Total accumulated depreciation 5,158,970 488,986 — (54,495) 5,593,461
Facilities, net $10,077,080 $1,326,616 $ — $ — $11,403,696
2002Facilities
Land $ 461,478 $ — $ 40,617 $ — $ 502,095Buildings, bridges, tunnels, other structures 4,258,162 — 226,088 (4,757) 4,479,493Machinery and equipment 3,041,667 — 108,280 (1,348) 3,148,599Runways, roadways and other paving 2,213,108 — 272,914 (7,122) 2,478,900Utility infrastructure 1,504,801 — 79,348 (10,467) 1,573,682Construction in progress 2,250,204 1,530,324 (727,247) — 3,053,281
Total Facilities 13,729,420 1,530,324 — (23,694) 15,236,050
Less accumulated depreciation:Buildings, bridges, tunnels, other structures 1,833,724 132,824 — (4,757) 1,961,791Machinery and equipment 1,288,288 110,493 — (1,348) 1,397,433Runways, roadways and other paving 938,500 99,155 — (7,122) 1,030,533Utility infrastructure 715,668 64,012 — (10,467) 769,213
Total accumulated depreciation 4,776,180 406,484 — (23,694) 5,158,970
Facilities, net $ 8,953,240 $1,123,840 $ — $ — $10,077,080
2. Net interest expense added to the cost of facilities was $86,119,000 in 2003 and $90,808,000 in 2002.
55
Note C Cash and Investments
1. The components of cash and investments are:
December 31,
2003 2002
(In thousands)
CASH
Cash on hand $ 1,960 $ 1,906Demand deposits 37,733 48,019
Total cash 39,693 49,925Less restricted cash 10,295 9,362
Unrestricted cash $ 29,398 $ 40,563
December 31,
2003 2002
(In thousands)
INVESTMENTS
United States Treasury notes $ 717,608 $ 496,974United States Treasury bills 1,462,552 1,115,471United States government agency obligations 689,686 716,066Commercial paper notes 107,987 –United States Treasury obligations held pursuant to repurchase agreements 72,394 511,246JFK International Air Terminal LLC obligations 172,514 147,500Accrued interest receivable 3,924 6,054
Total investments 3,226,665 2,993,311Less current investments 2,156,871 1,663,474
Noncurrent investments $1,069,794 $1,329,837
2. Port Authority policy provides for funds of the Port Authority to be deposited in banks with offices located in the Port District,provided that the total funds on deposit in any bank do not exceed 50% of the bank’s combined capital and permanent surplus.These funds must be fully secured by deposit of collateral having a minimum market value of 110% of average daily balances inexcess of that part of the deposits secured through the Federal Deposit Insurance Corporation (FDIC). Actual daily balances maydiffer from the average daily balances. The collateral must consist of obligations of the United States of America, the PortAuthority, the State of New York or the State of New Jersey held in custodial bank accounts in banks in the Port District havingcombined capital and surplus in excess of $1 million.
Total actual bank balances were $30,340,000 as of December 31, 2003. Of that amount, $27,892,000 was either secured throughthe FDIC or was fully collateralized by collateral held by a bank acting as the Port Authority’s agent and held by such bank in thePort Authority’s name. The balance of $2,448,000 was not collateralized.
3. The investment policies of the Port Authority are established in conformity with its agreements with the holders of itsobligations, generally through resolutions of the Board of Commissioners or its Committee on Finance. Individual investmenttransactions are executed with recognized and established securities dealers and commercial banks. Investment securities aremaintained, in the Port Authority’s name, by a third party financial institution acting as the Port Authority’s agent. Securitiestransactions are conducted in the open market at competitive prices. Transactions (including repurchase and reverse repurchaseagreement transactions) are completed when the Port Authority’s securities custodian, in the Port Authority’s name, makes orreceives payment upon receipt of confirmation that the securities have been transferred at the Federal Reserve Bank of New Yorkor other repository in accordance with the Port Authority’s instructions.
Notes to Consolidated Financial Statements(continued)
56
Proceeds of “Bonds and other asset financing obligations” may be invested, on an interim basis, in conformance with applicableFederal law and regulations, in obligations of (or fully guaranteed by) the United States of America (including such securities heldpursuant to repurchase agreements) and collateralized time accounts. The Consolidated Bond Reserve Fund and the GeneralReserve Fund amounts may be invested in obligations of (or fully guaranteed by) the United States of America. Additionally,amounts in the Consolidated Bond Reserve Fund and the General Reserve Fund (subject to certain limitations) may be investedin obligations of the State of New York or the State of New Jersey, collateralized time accounts, and Port Authority bonds actuallyissued and secured by a pledge of the General Reserve Fund. Operating funds may presently be invested in direct obligations ofthe United States of America and obligations of United States government agencies and sponsored enterprises, investment gradenegotiable certificates of deposit, negotiable bankers’ acceptances, commercial paper, United States Treasury and municipal bondfutures contracts, certain interest rate exchange contracts with banks and investment firms, certain interest rate options contractswith primary dealers in United States Treasury securities, and obligations of JFK International Air Terminal LLC for certain costsattributable to the completion of the passenger terminal project. The Board has from time to time authorized other investmentsof operating funds.
The passenger terminal lease with JFK International Air Terminal LLC (JFKIAT) was amended during 2001 to provide for, amongother items, the Port Authority to invest up to $180 million of operating funds to be used by JFKIAT for certain costs attributableto the completion of its passenger terminal project at John F. Kennedy International Airport (JFK). Payments by JFKIAT to the PortAuthority on account of such investment (JFKIAT payment obligation) are to be made on a subordinated basis to certain otherrental obligations of JFKIAT under such lease, including facility rental pledged to the payment of debt service on Special ProjectBonds, Series 6 (see Note D-2). In 2002, the JFKIAT passenger terminal lease was further supplemented to provide for the deferralof approximately $11 million of JFKIAT payment obligations in 2003 resulting in an increase in the authorized amount of operatingfunds that could be invested in this project. JFKIAT’s ability to meet its contractual commitments under the lease may be affectedby trends in the airline industry which may have a negative effect on air traffic and revenues derived from the operation of theair terminal.
The Port Authority has entered into reverse repurchase (yield maintenance) agreements under which the Port Authority contractedto sell a specified United States Treasury security to a counterparty and simultaneously agreed to purchase it back from that partyat a predetermined price and future date. All reverse repurchase agreements sold are matched to repurchase agreements bought,thereby minimizing market risk. The credit risk is managed by a daily evaluation of the market value of the underlying securitiesand periodic cash adjustments, as necessary, in accordance with the terms of the repurchase agreements. Although there wereno investments in reverse repurchase agreements at December 31, 2003, during 2003, reverse repurchase agreements in effectat any one time ranged as high as $844,860,000. Repurchase agreements in effect at any one time during 2003 ranged as highas $1,232,334,000.
Notes to Consolidated Financial Statements(continued)
57
Note D Outstanding Obligations and Financing
1. Outstanding bonds and other asset financing obligations
The obligations noted with “(*)” on original issuance were subject to the alternative minimum tax imposed under the Internal Revenue Code of 1986, as amended, with respect to individuals and corporations. Obligations noted with (**) are subject to Federal taxation.
December 31, 2003
Current Noncurrent Total
(In thousands)
A. CONSOLIDATED BONDS AND NOTES $420,420 $6,492,874 $6,913,294B. COMMERCIAL PAPER NOTES 249,200 — 249,200C. VARIABLE RATE MASTER NOTES 149,990 — 149,990D. VERSATILE STRUCTURE OBLIGATIONS 10,500 544,000 554,500E. PORT AUTHORITY EQUIPMENT NOTES 15,900 45,900 61,800F. FUND BUY-OUT OBLIGATION 35,211 388,119 423,330
$881,221 $7,470,893 $8,352,114
December 31, 2002
Current Noncurrent Total
(In thousands)
A. CONSOLIDATED BONDS AND NOTES $198,280 $6,288,547 $6,486,827B. COMMERCIAL PAPER NOTES 180,408 — 180,408C. VARIABLE RATE MASTER NOTES 149,990 — 149,990D. VERSATILE STRUCTURE OBLIGATIONS 6,100 554,500 560,600E. PORT AUTHORITY EQUIPMENT NOTES 45,300 61,800 107,100F. FUND BUY-OUT OBLIGATION 35,213 389,300 424,513
$615,291 $7,294,147 $7,909,438
Notes to Consolidated Financial Statements(continued)
58
Notes to Consolidated Financial Statements(continued)
A. CONSOLIDATED BONDS AND NOTESDec. 31, Issued/ Refunded/ Dec. 31,
2002 Accreted Retired 2003
(In thousands)
Consolidated bondsSixty-ninth series (a) Due 2004-2011 $ 23,630 $ 2,030 $ 2,720 $ 22,940Seventy-fourth series (b) Due 2004-2014 29,545 2,461 1,785 30,221Seventy-ninth series 5.9%-6% due 2004-2005 20,865 — 7,010 13,855Eightieth series 5.9%-6% due 2004-2005 10,560 — 3,535 7,025Eighty-fourth series* 5 3/4%-6% due 2008-2028 97,250 — 97,250 —Eighty-fifth series 5%-5 3/8% due 2008-2028 98,000 — — 98,000Eighty-sixth series 4.8%-5.2% due 2004-2012 69,845 — 11,520 58,325Eighty-seventh series 4.7%-5 1/4% due 2003-2021 86,315 — 86,315 —Eighty-eighth series 4 1/2%-4 3/4% due 2004-2008 74,120 — 20,050 54,070Eighty-ninth series 4.4%-5 1/8% due 2003-2021 88,685 — 88,685 —Ninetieth series** 6.05%-6 1/8% due 2004-2005 23,510 — 7,385 16,125Ninety-first series 4.7%-5.2% due 2004-2020 252,975 — 8,495 244,480Ninety-second series 4 3/4%-5 5/8% due 2009-2029 90,680 — — 90,680Ninety-third series 6 1/8% due 2094 100,000 — — 100,000Ninety-fourth series 5.2%-6% due 2004-2017 100,000 — 4,345 95,655Ninety-fifth series* 5 1/2%-6 1/8% due 2005-2029 95,000 — — 95,000Ninety-sixth series* 5.7%-6.6% due 2004-2023 100,000 — 2,525 97,475Ninety-seventh series* 6%-7.1% due 2004-2023 100,000 — 1,900 98,100Ninety-eighth series* 5.7%-6.2% due 2005-2015 100,000 — — 100,000Ninety-ninth series* 5 1/4%-7% due 2004-2015 86,000 — — 86,000One hundredth series 5 5/8%-5 3/4% due 2010-2030 135,000 — — 135,000One hundred first series* 5.1%-6% due 2004-2015 75,380 — 4,200 71,180One hundred third series 4.7%-5 1/4% due 2004-2014 64,000 — 4,500 59,500One hundred fourth series 4 3/4%-5.2% due 2011-2026 150,000 — — 150,000One hundred fifth series* 5%-6 1/4% due 2004-2016 116,760 — 6,340 110,420One hundred sixth series* 5.3%-6% due 2004-2016 79,900 — 2,000 77,900One hundred seventh series* 4.9%-6% due 2004-2016 100,000 — — 100,000One hundred eighth series* 4.8%-6% due 2004-2017 124,550 — 5,770 118,780One hundred ninth series 5 3/8%-5 1/2% due 2012-2032 150,000 — — 150,000One hundred tenth series* 4.6%-5 3/8% due 2004-2017 83,390 — 3,800 79,590One hundred eleventh series 5% due 2012-2032 100,000 — — 100,000 One hundred twelfth series* 4 1/2%-5 1/4% due 2004-2018 130,060 — 5,530 124,530 One hundred thirteenth series 4 1/8%-4 3/4% due 2004-2013 105,000 — 14,250 90,750 One hundred fourteenth series 4 3/4%-5 1/2% due 2013-2033 100,000 — — 100,000One hundred fifteenth series 4.2%-4 3/8% due 2004-2008 41,000 — 6,000 35,000One hundred sixteenth series 4 1/4%-5 1/4% due 2005-2033 450,000 — — 450,000One hundred seventeenth series* 4.1%-5 1/8% due 2004-2018 85,680 — 3,865 81,815One hundred eighteenth series 4 1/4%-5.35% due 2004-2014 80,500 — 6,500 74,000One hundred nineteenth series* 5%-5.875% due 2004-2019 271,680 — 10,510 261,170One hundred twentieth series* 4 1/2%-6% due 2004-2035 280,835 — 10,365 270,470One hundred twenty-first series 5%-5 1/2% due 2016-2035 200,000 — — 200,000One hundred twenty-second series* 5%-5 1/2% due 2004-2036 242,150 — 8,195 233,955One hundred twenty-third series 4 3/4%-5% due 2017-2036 100,000 — — 100,000One hundred twenty-fourth series* 4 1/2%-5% due 2004-2036 292,340 — 8,570 283,770One hundred twenty-fifth series 5% due 2018-2032 300,000 — — 300,000One hundred twenty-sixth series* 5%-5 1/2% due 2004-2037 300,000 — 9,920 290,080One hundred twenty-seventh series* 4%-5 1/2% due 2004-2037 300,000 — 7,875 292,125One hundred twenty-eighth series 4%-5% due 2007-2032 250,000 — — 250,000One hundred twenty-ninth series 2%-4% due 2004-2015 75,000 — 3,555 71,445One hundred thirtieth series 1.30%-3 3/4% due 2004-2015 — 83,865 — 83,865One hundred thirty-first series* 2%-5% due 2004-2033 — 500,000 — 500,000One hundred thirty-second series 5% due 2024-2038 — 300,000 — 300,000
Consolidated notesSeries TT 3 5/8% due 2004 200,000 — — 200,000Series UU 2% due 2003 — 250,000 250,000 —Series VV* 1.15% due 2003 — 250,000 250,000 —
Consolidated bonds and notes pursuant to Port Authority bond resolutions (c) 6,630,205 $1,388,356 $965,265 7,053,296
Less unamortized discount and premium (d) 143,378 140,002
Consolidated bonds and notes $6,486,827 $6,913,294
59
Notes to Consolidated Financial Statements(continued)
A. CONSOLIDATED BONDS AND NOTES (continued)
(a) Includes $8,313,000 serial bonds issued on a capital appreciation basis; the only payments with respect to these bonds will bemade at their respective maturities, ranging from years 2004 to 2011, in total aggregate maturity amounts of $29,035,000.
(b) Includes $12,450,000 serial bonds issued on a capital appreciation basis; the only payments with respect to these bonds willbe made at their respective maturities, ranging from years 2004 to 2014, in total aggregate maturity amounts of $40,970,000.
(c) Debt service requirements to maturity for consolidated bonds and notes outstanding on December 31, 2003 are as follows:
DebtYear ending December 31: Principal Interest Service
*** Debt service 2039-2094 reflects principal and interest payments associated with a single series of outstanding consolidated bonds.
Total principal of $7,070,000 shown above differs from the total consolidated bonds and notes pursuant to Port Authority bondresolutions of $7,053,000 because of differences in the par value at maturity of the capital appreciation bonds of $16,844,000.
(d) Amount includes the unamortized difference between acquisition price and carrying amount on refunded debt.
Consolidated bonds and notes outstanding as of February 27, 2004 (pursuant to Port Authority bond resolutions) totaled$7,548,417,000.
The Board of Commissioners has authorized the issuance of consolidated bonds, one hundred thirty-third series through onehundred forty-second series, in aggregate principal amount of up to $500 million of each series, and consolidated notes, Series WW,XX and YY of up to $300 million in aggregate principal amount of each series.
The Port Authority operates JFK and LaGuardia Airport (LGA) under a lease agreement with the City of New York, which expires in 2015. During 1994, the City of New York suspended negotiations to extend the lease term. In the context of the suspension ofnegotiations to extend the term of the lease, in 1994 the Port Authority instituted a program to accelerate the retirement of certainconsolidated bonds that were outstanding as of December 31, 1994, and had maturities extending beyond 2015, in which thelease expired. As of December 31, 2003, the Port Authority had achieved its program goals through the year 2011 with theretirement of $1,380,290,000 in principal amount of such consolidated bonds, through open-market purchases and refundings.Additionally, bonds issued for purposes of capital projects at JFK and/or LGA were structured to mature on or before December 31,2015. As a result of the authorization in November 2003 by the Board of Commissioners of a Memorandum of Understandingbetween the City of New York and the Port Authority in with respect to the extension of the lease agreement covering JFK and LGA(see Note G), the program of accelerated retirements and maturity limitations was discontinued.
During 2003, the Port Authority refunded $83,865,000 in outstanding consolidated bonds. Although the refundings resulted in an additional cash outlay of $2,441,000, the Port Authority in effect reduced its aggregate debt service payments by approximately$30,336,000 over the life of the refunded issues. The economic gain resulting from the debt refunding (the difference between the present value of the cash flows required to service the old debt and the present value of the cash flows required to service the new debt) is worth approximately $11,800,000 in present value savings to the Port Authority.
60
Notes to Consolidated Financial Statements(continued)
B. COMMERCIAL PAPER NOTES
Commercial paper obligations are issued to provide interim financing for authorized projects at Port Authority facilities and maybe issued until December 31, 2005, in an aggregate principal amount outstanding at any one time not in excess of $500 millionin two separate series. Each series includes a standby revolving credit facility and the maximum aggregate principal amount thatmay be outstanding at any one time is $300 million for Series A and $200 million for Series B.
Interest rates are determined weekly, based upon specific industry indices (e.g. three-month Treasury bill rate, tax exempt noterate published by Lehman Brothers, JP Morgan Rate published by JP Morgan or the Bond Market Association rate) as stated ineach master note agreement, and ranged from 0.68% to 1.676% in 2003.
Debt service requirements on outstanding variable rate master notes, valued for presentation purposes at the rate in effect onDecember 31, 2003, would be as follows:
Variable interest rates, set daily by the remarketing agent for each series, ranged from 0.44% to 1.75% in 2003.
Debt service requirements on outstanding versatile structure obligations, valued for presentation purposes at the rate in effect onDecember 31, 2003, would be as follows:
The Port Authority has entered into a separate standby certificate purchase agreement pertaining to each series of versatilestructure obligations with certain banks, which provide that during the term of the banks’ commitment (generally three years,subject to renewal), if the remarketing agent fails to remarket any obligations that are tendered by the holders, the bank may berequired, subject to certain conditions, to purchase such unremarketed portion of the obligations. If not purchased prior thereto atthe Port Authority’s option, the Port Authority has agreed to purchase such portion of the obligations within 90 business daysafter the purchase thereof by the bank. Bank commitment fees during 2003 in connection with the agreements were $1,311,000.No bank was required to purchase any of the obligations under the agreements in 2003.
62
E. PORT AUTHORITY EQUIPMENT NOTES
Equipment notes may be issued in aggregate principal amounts outstanding at any one time not to exceed $250 million.
Variable interest rates, set weekly by a remarketing agent for each series, ranged from 0.75% to 1.65% in 2003.
Annual debt service requirements on outstanding Port Authority equipment notes, valued for presentation purposes at the rate ineffect on December 31, 2003, would be as follows:
(a) Represents the annual implicit interest cost (8.25%) contained in the present value of amounts due to the States of New York and New Jerseyupon the termination, in 1990, of the Fund for Regional Development.
Payment requirements of the fund buy-out obligation outstanding on December 31, 2003 are as follows:
As of February 27, 2004, the fund buy-out obligation outstanding totaled $428,800,000.
Notes to Consolidated Financial Statements(continued)
63
Notes to Consolidated Financial Statements(continued)
2. Amounts Payable — Special Project Bonds
Neither the full faith and credit of the Port Authority, nor the General Reserve Fund, nor the Consolidated Bond Reserve Fund arepledged to the payment of the principal and interest on special project bonds. Principal and interest on each series of special projectbonds are secured solely by a mortgage by the Port Authority of facility rental (to the extent received by the Port Authority from alessee) as set forth in a lease with respect to a project to be financed with the proceeds of the bonds of such series, by a mortgageby the lessee of its leasehold interest under the lease and by a security interest granted by the lessee to the Port Authority andmortgaged by the Port Authority in certain items of the lessee’s personal property to be located at the project, and such othersecurity in addition to the foregoing as may be required by the Port Authority from time to time as appropriate to the particularproject.
(a) Special project bonds, Series 1R, Delta Air Lines, Inc. Project, were issued in connection with a project that includes the construction of apassenger terminal building at LaGuardia Airport leased to Delta Air Lines, Inc.
(b) Special project bonds, Series 2, Continental Airlines, Inc. and Eastern Air Lines, Inc. Project, were issued in connection with a project including theconstruction of a passenger terminal at LaGuardia Airport leased to and to be occupied by Continental Airlines Inc. and Eastern Air Lines, Inc. Theleasehold interest of Eastern Air Lines, Inc. was assigned to Continental Airlines, Inc. Continental’s leasehold interest in such passenger terminal,including the previously acquired leasehold interest of Eastern was subsequently assigned to USAir, Inc. (with Continental to remain liable underboth underlying leases).
(c) Special project bonds, Series 4, KIAC Partners Project, were issued to refund the Series 3 bonds, and in connection with a project at John F.Kennedy International Airport, that includes the construction of a cogeneration facility, the renovation and expansion of the central heating andrefrigeration plant, and the renovation and expansion of the thermal distribution system.
(d) Special project bonds, Series 6, JFK International Air Terminal LLC Project, were issued in connection with a project that includes the developmentand construction of a new passenger terminal at John F. Kennedy International Airport.
3. Interest Rate Exchange Contracts (Swaps)
The Port Authority records interest rate exchange contracts pursuant to the settlement method of accounting whereby cash paidor received under the terms of the swap is charged or credited to the related interest expense account for the purpose ofmanaging interest rate exposure. Each swap transaction involves the exchange of fixed and variable rate interest paymentobligations with respect to an agreed upon nominal principal amount called a “notional amount”.
Objective
The Port Authority entered into four pay-fixed, receive-variable interest rate swaps on a forward basis in order to protect againstthe potential of rising interest rates between the execution date and the effective date and to preserve the net present valuesavings of the bond refunding associated with each swap transaction. Each swap is matched against a Versatile StructureObligation, the proceeds of which were used to refund outstanding high-coupon fixed rate debt. The combination of the swapsand the associated variable rate debt created synthetic fixed rate-refunding bonds.
64
Notes to Consolidated Financial Statements(continued)
The notional amount of the swaps matches the principal amount of the associated debt. The Port Authority’s swap agreementscontain scheduled reductions to outstanding notional amounts to approximately follow scheduled reductions of the associateddebt. The terms, including the fair values and credit ratings of the outstanding swaps as of December 31, 2003, are as follows:
(a) Ratings supplied by Standard & Poor’s/Moody’s/Fitch Ratings.
(b) The JJ Kenny “High Grade” Index.
(c) The Bond Market Association Municipal Swap Index.
Debt service requirements of the underlying variable rate debt and net swap payments, valued for presentation purposes at therate in effect on December 31, 2003, are shown below. As rates vary, variable rate debt interest payments and net swap paymentswill vary.
Because interest rates have declined, all swaps had a negative fair value as of December 31, 2003. The negative fair values may becountered by reductions in total interest payments under the variable rate obligations, creating lower synthetic interest rates.Because interest rates on the Versatile Structure Obligations are reset on a daily basis, thereby reflecting market interest rates, theobligations do not have corresponding fair value increases. The fair values of the swaps were estimated using the zero couponmethod. This method calculates the future net settlement payments required by the swap, assuming that the current forward ratesimplied by the yield curve correctly anticipate future spot interest rates. These payments are then discounted using the spot ratesimplied by the current yield curve for hypothetical zero-coupon bonds due on the date of each future net settlement on the swaps.
Credit Risk
As of December 31, 2003, the Port Authority was not exposed to credit risk on any of its outstanding swaps because the swapshad negative fair values. However, should interest rates change and the fair values of the swaps become positive, the PortAuthority would be exposed to credit risk in the amount of the swaps’ fair value.
All of the swap agreements provide each party the right to set-off, counterclaim, or withhold payment upon and during thecontinuation of an event of default by the other party until the event of default is remedied, and, in addition, an early terminationdate may be designated if an event of default occurs. Of the four swap transactions currently outstanding, three swaps are heldwith one counterparty. Both counterparties are rated A+/Aa3/AA—.
65
Notes to Consolidated Financial Statements(continued)
Basis Risk
The Port Authority’s interest payments on the associated debt are equivalent to the daily variable market rates set by theremarketing agent. The Port Authority receives a variable rate payment based on an index other than the daily market rates oneach swap and would be exposed to basis risk should the relationship between the actual rate and the swap rate index differ. Tothe degree these rates differ, expected cost savings may not be realized. As of December 31, 2003, the variable market rates were1.27%, 1.29%, 1.29% and 1.32%, whereas the swap rate indexes were 1.15% for the JJ Kenny “High Grade” Index and 1.23% forthe Bond Market Association Municipal Swap Index.
Termination Risk
The Port Authority or the counterparty may terminate any of the swaps if the other party fails to perform under the terms of theagreement. If any of the swaps are terminated, the associated variable rate debt will no longer carry synthetic fixed interest rates.Also, if at the time of termination the counterparty suffers a loss, the Port Authority would be liable to the counterparty for apayment calculated pursuant to the agreement with respect to such loss.
Rollover Risk
The Port Authority is exposed to rollover risk on swaps that mature or may be terminated prior to the maturity of the associateddebt. When these swaps terminate, the Port Authority will not realize the synthetic rate offered by the swaps on the underlyingissues. The following debt is exposed to rollover risk:
Associated Associated Debt SwapDebt Maturity Date Termination Date
(d) When the swap agreement was originally executed, notwithstanding its automatic termination in 2005, it was based on a market rate to thematurity date of the series of Versatile Structure Obligations to which it pertained. At the end of the initial term of the swap agreement, a paymentwill either be made to the Port Authority or to the counterparty. In the event that a new swap agreement is entered into with the samecounterparty for the remaining term of such series of Versatile Structure Obligations, it was intended that the payment calculated at the end of theinitial term of the swap agreement, combined with the new swap agreement, would equal the effective fixed rate at the original execution date.
66
Note E Reserves
The General Reserve Fund is pledged in support of Consolidated Bonds and Notes. Statutes which required the Port Authority tocreate the General Reserve Fund established the principle of pooling revenues from all facilities and require that the Port Authorityapply surplus revenues from all of its existing facilities to maintain the General Reserve Fund in an amount at least equal to 10% ofthe par value of outstanding bonds legal for investment. At December 31, 2003, the General Reserve Fund balance was$948,902,000 and met the prescribed statutory amount.
The balance remaining of all net revenues of the Port Authority’s existing facilities after deducting payments for debt service upon allConsolidated Bonds and Notes and the amount necessary to maintain the General Reserve Fund at its statutorily required amount, isto be paid into the Consolidated Bond Reserve Fund, which is pledged as additional security for all outstanding Consolidated Bondsand Notes. Consolidated Bonds and Notes have a first lien upon the net revenues (as defined in the Consolidated Bond Resolution)of all existing facilities of the Port Authority and any additional facility financed by Consolidated Bonds.
Other capital asset obligations (versatile structure obligations, commercial paper obligations, and variable rate master notes), and theinterest thereon, are not secured by or payable from the General Reserve Fund. Principal of, and interest on, other capital assetobligations are payable solely from the proceeds of obligations issued for such purposes or from net revenues paid into theConsolidated Bond Reserve Fund and, in the event such proceeds or net revenues are insufficient therefore, from other moneys ofthe Port Authority legally available for such payments. Operating asset obligations (equipment notes and the Fund buy-outobligation) are paid in the same manner and from the same sources as operating expenses. Special project bonds are not secured byor payable from the General Reserve Fund or the Consolidated Bond Reserve Fund.
The Port Authority has a long-standing policy of maintaining total reserve funds in an amount equal to at least the next two years’bonded debt service on outstanding debt secured by a pledge of the General Reserve Fund. The moneys in the reserve funds maybe accumulated or applied only to purposes set forth in legislation and the agreements with the holders of the Port Authority’sobligations pertaining thereto. At December 31, 2003, the Port Authority met the requirements of the Consolidated BondResolution to maintain total reserve funds in cash and certain specified securities.
Note F Funding Provided by Others
During 2003 and 2002, the Port Authority received federal and state grants and contributions from other entities for variousprograms as summarized below:
1. Operating programs
• Federal Aviation Administration (FAA) K-9 program — The FAA provided funds used to offset the costs of training and caring for explosive detection dogs. Amounts received in connection with this program were approximately $600,500 in 2003 and $979,000in 2002.
• Transportation Security Administration (TSA) funds for airport screening — The TSA provided approximately $9.1 million in2003 and $11 million in 2002 to reimburse the Port Authority for costs primarily attributable to providing police personnel at thePort Authority’s three major airports.
Grant receipts for operating activities are recorded as operating revenues on the Consolidated Statements of Revenues, Expensesand Changes in Net Assets and on Schedule A — Revenues and Reserves.
2. Non-operating grants
• Federal Emergency Management Agency (FEMA) Funds — February 2003 Snowstorm — The Port Authority receivedapproximately $3.3 million in funds from FEMA for the reimbursement of certain costs incurred as a result of the Presidents’ Daysnowstorm in February 2003.
• TSA Port Security Grant — In 2003, the TSA provided approximately $1.9 million to reimburse the Port Authority for costs incurredas a result of implementing enhanced security at various ports in the New York and New Jersey region.
• New York State Department of Transportation (NYSDOT) — Congestion Mitigation and Air Quality Grants:
George Washington Bridge — The Port Authority received approximately $600,000 in funds from the NYSDOT to help stimulateincreased ridership on buses to and from the George Washington Bridge Bus Station in order to reduce automobile congestionin New York City and improve air quality.
LGA — In 2003, the NYSDOT provided approximately $500,000 in funds for reimbursement of costs incurred by the PortAuthority associated with the installation of a compressed natural gas station at LGA.
Notes to Consolidated Financial Statements(continued)
67
• Regional ferry pass-through grant program — The Port Authority has acted as a sponsoring agency for FEMA funds to expandferry service to partially make up for the diminished cross-Hudson River public transportation service resulting from thedestruction of the PATH World Trade Center station. Amounts recognized in connection with this program, which was effectivelycompleted in December 2003, were approximately $28.2 million and $11.5 million during 2003 and 2002, respectively. NY Waterways, the provider of these ferry services, is currently under investigation by the Federal Government with respect toits activities in connection with the receipt of federal grant funds.
3. Contributions In Aid of Construction
The Port Authority receives contributions in aid of construction with respect to its facilities from federal, state and other entities.Federal and state contributions (including amounts receivable) were approximately $55 million in 2003 and $35.4 million in 2002.Contributions from other entities were $2.5 million in 2003 and $800,000 in 2002.
Note G Lease Commitments
1. Operating lease revenues
Gross operating revenues attributable to fixed rentals associated with operating leases amounted to $816.8 million in 2003 and$800.6 million in 2002.
2. Property held for lease
The Port Authority, its subsidiaries or affiliated entities have entered into operating leases with tenants for the use of space atvarious Port Authority facilities including buildings, terminals, offices and consumer service areas at air terminals, marine terminals,bus terminals, rail facilities, industrial parks, the Teleport, the World Trade Center and the Newark Legal and CommunicationsCenter. Investments in such facilities, as of December 31, 2003, include property associated with minimum rentals derived fromthe leases. It is not reasonably practicable to segregate the value of assets associated with producing minimum rental revenuefrom the value of assets associated with an entire facility.
Future minimum rentals are predicated upon the ability of the lessees to meet their commitments. Future minimum rentalsscheduled to be received on operating leases in effect on December 31, 2003 are:
Year ending December 31:
(In thousands)
2004 $ 652,7372005 624,6632006 559,8692007 554,9032008 564,255Later years 101,154,638
Total future minimum rentals (a) $104,111,065
(a) Includes future rentals of approximately $97.3 billion attributable to World Trade Center leases (see Note K).
Notes to Consolidated Financial Statements(continued)
68
Notes to Consolidated Financial Statements(continued)
3. Property leased from others
Rental expenses under leases, including payments to the cities of New York and Newark for various air terminals, marineterminals and other facilities and the cost of replacement office space due to the destruction of the World Trade Center,aggregated $240.6 million in 2003 and $128.7 million in 2002. Future minimum rentals scheduled to be paid on operating leasesin effect on December 31, 2003 are detailed below. Additional rentals may be payable based on earnings of specified facilitiesunder some of these leases.
* Future minimum rent payments for years 2034-2065 reflect payments associated with the City of Newark lease commitment.Future minimum rent payments do not include payments of approximately $90 million per year associated with the MOUauthorized on November 20, 2003 with the City of New York with respect to the lease extension for JFK and LGA.
4. Information on leases at the New York City Airports, Newark Liberty International Airport (EWR) and Port Newark, and certain agreements relating to other Port Authority facilities located in the City of Newark.
The Port Authority operates JFK and LGA under a lease agreement entered into in 1947 and amended and supplemented fromtime to time thereafter, with the City of New York, which expires on December 31, 2015. The lease currently provides for basicannual rental payments to be made by the Port Authority to the City of approximately $3 million from 1985 through 1997, and$3.5 million for the remaining term of the lease. The City receives additional rent in any year in which the basic annual rental is lessthan the amount of airport revenues net of Port Authority expenses and debt service on obligations of the Port Authority incurred toprovide capital improvements at LGA and JFK.
On November 20, 2003, the Board of Commissioners authorized the Port Authority to enter into a Memorandum ofUnderstanding (MOU) with the City of New York with respect to the lease agreement covering JFK and LGA, and the agreementbetween the City of New York and the Port Authority with respect to payments-in-lieu-of-taxes (PILOT) to the City for the WorldTrade Center site. Among other items, the MOU provides for the extension of the lease agreement to December 31, 2050. Uponexecution of the lease extension, an initial lump sum rental payment in the amount of $500 million, which may be deferred forup to two years at the discretion of the City of New York, and the minimum annual rental of $90 million for each of years 2002and 2003, as well as the portion of such amounts for 2004 that has accrued at the time of execution, will be due to the City ofNew York. The balance of the minimum annual rent for 2004 will be paid in equal monthly installments over the remainder of theyear. As of December 31, 2003 certain liabilities and expenses associated with the MOU have been reflected in the financialrecords of the Port Authority.
The execution of the amended lease agreement between the City and the Port Authority is conditioned upon the completion of theCity of New York’s Uniform Land Use Review Procedure, replacement of the current framework upon which flight fees paid by airlinesoperating at JFK and LGA are calculated on terms substantially similar to those currently in effect no later than July 1, 2004, andresolution by the City of New York and the Port Authority of all property issues with respect to the street grid at the World TradeCenter site.
In October 2002, the Port Authority and the City of Newark entered into agreements pertaining to EWR and Port Newark,providing in part for an extension of the expiration date of the lease for each facility from December 31, 2031 to December 31,2065. The agreements provide that, if the Port Authority enters into a new lease with the City of New York relating to JFK andLGA, or amends the existing lease with respect to those airports, the City of Newark will have the right to amend the provisions ofits lease with the Port Authority to conform to the terms agreed upon with the City of New York (see Note J).
69
Notes to Consolidated Financial Statements(continued)
Note H Regional Programs
1. The Port Authority has established, at the request of the Governors of New York and New Jersey, several facilities described briefly below under which certain projects, not a part of other Port Authority facilities, have been and/or will be undertaken.
• Regional Development Facility — This facility was established in conjunction with a program of up to $250 million fortransportation, economic development and infrastructure renewal projects authorized in connection with the Governors’ Program ofJune 1983. Some of the projects in this program have been associated with other existing Port Authority facilities, while a balance of$139 million was associated with the Regional Development Facility.
• Regional Economic Development Program — This facility was authorized in 1989 in conjunction with a centralized program ofup to $400 million for transportation, economic development and infrastructure renewal projects authorized pursuant togubernatorial request. As of December 31, 2003, $394 million had been authorized of which $326 million was associated with theRegional Economic Development Program facility and the balance has been associated with other existing Port Authority facilities.
• Oak Point Rail Freight Link — The Port Authority has participated with the New York State Department of Transportation inthe development of the Oak Point Rail Freight Link, which was authorized in 1980. Approximately $63 million of the $102 millionPort Authority’s share of the total project cost was allocated against moneys made available through the Regional DevelopmentFacility and the Regional Economic Development Program.
• The New Jersey Marine Development Program — This program, authorized in 1989, was undertaken to fund certain fishery,marine or port development projects in the State of New Jersey with a total cost of $27 million.
• New York Transportation, Economic Development and Infrastructure Renewal Program — This facility was authorized in2000 in conjunction with a program of up to $250 million for transportation, economic development and infrastructure renewalprojects in the State of New York to be designated by the Governor. As of December 31, 2003, projects totaling approximately$230 million have been designated by the Governor.
• Regional Transportation Program — This facility was authorized in 2002 in conjunction with a program to provide up to$500 million, with $250 million to be provided in each of the States of New York and New Jersey, for regional transportationinitiatives to be designated by the respective Governor of each state. As of December 31, 2003, the Governor of the State of New Jersey had designated a project totaling approximately $250 million for the acquisition of bi-level rail cars for New JerseyTransit Corporation as the New Jersey transportation project to be effectuated through this facility.
• Hudson-Raritan Estuary Resources Program — This facility was authorized in 2001 in conjunction with a program to acquirecertain real property in the Port District area of the Hudson-Raritan Estuary, in support of the Port Authority’s capital program. Theproperty would be acquired in consultation with the Governor of the State in which the property is located together with therespective state natural resources agencies and environmental organizations. The cost of any real property to be acquired under thisprogram will not exceed $60 million (with up to $30 million allocated to property to be acquired in each state).
• Regional Rail Freight Program — This facility was authorized in 2001 to provide for the Port Authority to participate, inconsultation with other governmental entities in the States of New York and New Jersey, in the development of rail freight projects toincrease regional capacity. The Port Authority is authorized to provide up to $50 million, with $25 million to be provided for projectsin each of the states.
70
Notes to Consolidated Financial Statements(continued)
As of December 31, 2003, $1.2 billion has been expended for regional programs. Costs for regional programs are deferred andamortized over the period benefited, up to a maximum of 15 years. The unamortized costs of the regional programs are as follows:
Regional Development Facility $ 84,527 $ 133 $ 6,039 $ 78,621Regional Economic Development Program 267,240 5,000 20,361 251,879Oak Point Rail Freight Link 22,819 — 1,630 21,189New Jersey Marine Development Program 11,524 — 824 10,700New York Transportation, Economic
Development and Infrastructure Renewal Program — 37,466 1,469 35,997Regional Transportation Program — 51,065 1,500 49,565Hudson-Raritan Estuary Resources Program — 2 — 2Regional Rail Freight Program — 6,500 289 6,211
Total unamortized costs of regional programs $386,110 $100,166 $32,112 $454,164
2. Bi-State Initiatives — From time to time the Port Authority makes payments to assist various bi-state regional operatinginitiatives. During 2003, the Port Authority expended $9 million on regional initiatives.
3. Buy-out of Fund for Regional Development — In 1983, the Fund for Regional Development (Fund) was established to subleasespace in the World Trade Center that was previously held by the State of New York as tenant. An agreement between the PortAuthority and the States of New York and New Jersey with respect to the Fund provided that net revenues from the subleasingwere to be accumulated subject to disbursements to be made upon the concurrence of the Governors of New York and NewJersey. The assets, liabilities, revenues and expenses of the Fund were not consolidated with those of the Port Authority. In 1990,the Port Authority and the States of New York and New Jersey agreed to terminate the Fund. The present value (calculated at thetime of the termination agreement) of the cost to the Port Authority of its purchase of the Fund’s interest in the World TradeCenter subleased space was approximately $431 million. The liability for payments to the States of New York and New Jerseyattributable to the Fund buy-out is further described in Note D.
71
Note I Pension Plans and Other Employee Benefits
1. Pension Plans
a. Generally, full-time employees of the Port Authority (but not its subsidiaries) are required to join one of two cost-sharing multiple-employer defined benefit pension plans, the New York State and Local Employees’ Retirement System (ERS) or the New YorkState and Local Police and Fire Retirement System (PFRS), collectively referred to as the “Retirement Systems”. The New York StateConstitution provides that membership in a pension or retirement system of the State or of a civil division thereof is a contractualrelationship, the benefits of which may not be diminished or impaired.
The Retirement Systems provide retirement benefits related to years of service and final average salary, death and disabilitybenefits, vesting of benefits after a set period of credited public service (generally five years), and optional methods of benefitpayment. Depending upon the date of membership, retirement benefits differ as to the qualifying age or years-of-servicerequirement for service retirement, the benefit formula used in calculating the retirement allowance and the contributory or non-contributory nature of the plan. Contributions are not required from police personnel who are members of the PFRS or fromthose non-police employees who joined the ERS prior to July 27, 1976 or, effective October 1, 2000, members of the ERS withmore than ten years of credited service. ERS members with less than ten years of credited service are required to contribute3% of their annual gross wages to the ERS.
The Port Authority’s payroll expense for 2003 was $526,550,000 of which $351,590,000 and $166,078,000 represent the cost foremployees covered by ERS and PFRS, respectively.
Required Port Authority contributions to the Retirement Systems, including costs for participation in retirement incentiveprograms, are as follows:
Year % of % ofEnded ERS Covered Payroll PFRS Covered Payroll
These contributions cover the entire funding requirements for the current year and each of the two preceding years.
Employee contributions of $7,913,000 to the ERS represented 1.5% of the total Port Authority covered payroll in 2003.
The Annual Report of the New York State and Local Retirement Systems, which provides details on valuation methods and tenyear historical trend information, is available from the Comptroller of the State of New York, 110 State Street, Albany, NY 12236.
b. Employees of the Port Authority Trans-Hudson Corporation are not eligible to participate in existing New York State RetirementSystems. PATH provides supplemental pension plans for most of its union employees. Annual PATH contributions to these plansare defined in the various collective bargaining agreements; no employee contributions are required. Eligibility for all benefitsprior to normal retirement requires the completion of at least five years of vested service and depends upon years of creditedservice and monthly benefit rates in effect at the time of retirement. Trustees, appointed by the various unions, are responsible forthe administration of these pension plans. PATH payroll expense in 2003 for these employees was $65,321,000. For the year2003, contributions made by PATH in accordance with the terms of various collective bargaining agreements totaled $3,666,000,which represented approximately 4.9% of the total PATH covered payroll for 2003. Contributions in 2002 and 2001 were$3,569,000 and $3,088,000 respectively.
Notes to Consolidated Financial Statements(continued)
72
2. Other Employee Benefits
The Port Authority and PATH provide certain group health care, dental, vision and term life insurance benefits for active employeesand for employees who have retired from the Port Authority or PATH (and for eligible dependents and survivors of active andretired employees). Contributions towards the costs of some of these benefits are required of certain participants. Benefits areprovided through insurance companies whose premiums are based on the benefits paid during the year, or through plans underwhich benefits are paid by service providers on behalf of the Port Authority or PATH. The actuarially determined valuation of thesebenefits is reviewed annually for the purpose of estimating the present value of future benefits for active and retired employeesand their dependents. As of December 31, 2003, the actuarially determined value of these benefits is $957,900,000 consisting ofthe following:
The obligation accrued as of December 31, 2003 was $527,027,000. The difference between the actuarial present value of futurebenefits for prior service and the amount accrued as of December 31, 2003 is being amortized over a 15 year period.
The cost of providing health care, dental, vision and life insurance benefits, not including the accrual for prior service costs, totaled$135,440,000 in 2003 and $125,050,000 in 2002, of which $51,845,000 in 2003 and $45,681,000 in 2002 were the costsassociated with providing these benefits to retired employees and their eligible dependents.
Note J Commitments and Certain Charges to Operations
1. On December 11, 2003, the Board of Commissioners adopted the annual budget for 2004. Approval of a budget by the Boardof Commissioners does not in itself authorize any specific expenditures, which are authorized from time to time by or ascontemplated by other actions of the Board of Commissioners of the Port Authority consistent with statutory, contractual andother commitments of the Port Authority, including agreements with the holders of its obligations.
2. At December 31, 2003, the Port Authority had entered into various construction contracts totaling approximately $1.4 billion,which are expected to be completed within the next three years.
3. The Port Authority carries insurance or requires insurance to be carried (if available) on or in connection with its facilities toprotect against direct physical loss or damage and resulting loss of revenue and against liability in such amounts as it deemsappropriate, considering self-insured retentions, exceptions, or exclusions of portions of facilities, and the scope of insurable hazards.
Insurance coverage as of December 31, 2003 is as follows:
a. Property damage and loss of revenue insurance program:
General Coverage Terrorism(excluding terrorism) Coverage
Limits: • $475 million, per occurrence, excess of deductible and self-insurance
Deductible: • $5 million per occurrence
Self-Insurance: • $25 million in the aggregate, excess of deductible
• Upon sustaining $25 million in aggregate losses above the deductible, purchased coverage applies
Notes to Consolidated Financial Statements(continued)
• $25 million full terrorism coverage, peroccurrence, excess of deductible and self-insurance
• $450 million TRIA* coverage, peroccurrence, excess of $25 million fullterrorism coverage
• $5 million per occurrence
• $25 million in the aggregate, excess ofdeductible
• Upon sustaining $25 million inaggregate losses above the deductible,purchased coverage applies
b. Public liability insurance program:
1. Aviation facilities
General Coverage Terrorism(excluding terrorism) Coverage
Limits: • $1 billion, per occurrence and in the aggregate, excess of deductible
Deductible: • $3 million per occurrence
2. Non-aviation facilities
General Coverage Terrorism(excluding terrorism) Coverage
Limits: • $750 million per occurrence and in the aggregate, excess of deductible
Deductible: • $5 million per occurrence
Self-insurance: • 10% of $50 million excess of deductible
73
Notes to Consolidated Financial Statements(continued)
* The Terrorism Risk Insurance Act of 2002
At December 31, 2002, public liability insurance totaled $1 billion per occurrence for aviation facilities and $750 million for non-aviation facilities per occurrence and in the aggregate.
During each of the past three years, claims payments have not exceeded insurance coverage.
In providing for uninsured potential losses, the Port Authority administers its self-insurance program by applications from theConsolidated Bond Reserve Fund and provides for losses by charging operating expense as liabilities are incurred.
A liability is recognized when it is probable that the Port Authority has incurred an uninsured loss and the amount of the loss canbe reasonably estimated. The liability for unpaid claims is based upon the estimated cost of settling the claims, which includes areview of estimated claims expenses and estimated recoveries. Changes in the liability amounts in 2002 and 2003 were:
Beginning Additions Year-endBalance and Changes Payments Balance
4. The 2003 balance of “Other amounts receivable, net” on the Consolidated Statements of Net Assets consists of the anticipatedrecovery of $874 million net book value of various assets which comprised components of the World Trade Center complexdestroyed on September 11, 2001; $109 million representing the balance due from the private full service vendor operating theplant at the Essex County Resource Recovery Facility, under the conditional sale agreement through which the vendor financed a portion of the construction costs of the plant; $6 million representing the balance due from Howland Hook Container Terminal, Inc.for the purchase of five cargo cranes; and $47 million in long-term receivables from Port Authority tenants. The Port Authority hascontractual agreements to collect $15 million of the “Other amounts receivable, net” balance during 2004.
5. On November 20, 2003, the Board of Commissioners of the Port Authority authorized a Memorandum of Understanding(MOU) with the City of New York (executed on January 16, 2004) which, among other items, provides for the extension of thelease agreement relating to JFK and LGA to December 31, 2050 effective as of January 1, 2002. Certain contingencies exist within
• $1 billion aviation war riskcoverage, per occurrence and in theaggregate, excess of deductible
• $3 million per occurrence
• $50 million full terrorism coverage,per occurrence and in theaggregate, excess of deductible
• $200 million TRIA* coverage, peroccurrence and in the aggregate,excess of $50 million full terrorismcoverage
• $5 million per occurrence
• 10% of $50 million excess ofdeductible
74
Notes to Consolidated Financial Statements(continued)
the MOU that need to be satisfied before the agreement will be executed. The Port Authority presently anticipates that all of thecontingencies set forth in the MOU will be satisfied in the required time frames and a new lease agreement will be executed. Asof December 31, 2003, the Port Authority recognized a liability of approximately $688.7 million, representing the lump sumpayment of $500 million and the additional base rent payments of $90 million for each of years 2002 and 2003 that will be madeto the City upon execution of the agreement, as set forth in the MOU. The balance of the liability associated with the agreementis attributable to the 2003 interest expense on the additional 2002 and 2003 base rent amounts. The lump sum payment and theadditional base rent for 2002 have been deferred and will be amortized through 2050.
Additionally, under the terms of the October 31, 2002 agreements between the City of Newark and the Port Authority pertainingto EWR and Port Newark, if the Port Authority enters into a new lease with the City of New York relative to JFK and LGA, the Cityof Newark will have the right to amend the provisions of its lease with the Port Authority with respect to EWR to conform to theterms agreed upon with the City of New York. The Port Authority has not recorded a liability for any additional rental paymentsbecause the agreement with the City of Newark has not been finalized and the amount of any additional payments has not beendetermined (see Note G).
6. The City of New York commenced several actions, the first of which occurred in 1999, in the Supreme Court of the State ofNew York alleging that the Port Authority breached its agreement to make payments in-lieu-of taxes (PILOT) relating to the WorldTrade Center. On November 20, 2003, the Board of Commissioners of the Port Authority authorized a MOU with the City which,among other items, provides for the Port Authority and the City of New York to enter into an amended agreement with respect toPILOT for the World Trade Center site. Upon execution of the amended agreement, all pending litigation with respect to PILOTswill be terminated with prejudice.
Under the amended agreement with respect to PILOTs, beginning January 1, 2004, the Port Authority would make a minimumannual payment equal to 12% of rent payments from the net lessees of One, Two, Four and Five World Trade Center and theretail components of the World Trade Center. Upon full development of the site, the Port Authority would pay the greater of theminimum annual payment or an increased amount, which escalates based upon a base amount of $55 million, a multiplier basedon values of comparable Manhattan commercial office space, and the amount of occupied space in the buildings that aredeveloped on the site (see Note G).
7. In October 2002 and November 2003, the Port Authority and the Newark Legal and Communications Center Urban RenewalCorporation received tax bills for the calendar years 2001, 2002 and 2003 totaling approximately $200,000, based on the City ofNewark’s assessed value for the land upon which the Newark Legal and Communications Center is located. The Port Authority iscontesting the City of Newark’s allegation that the land upon which the Newark Legal and Communications Center is located issubject to real property tax.
8. Employees of PATH are not eligible to participate in existing New York State Retirement Systems. However, for PATH employeeswho are not covered by collective bargaining agreements, the Port Authority has recognized, as a matter of policy, an obligation toprovide supplemental payments resulting in amounts generally comparable to benefits available to similarly situated PortAuthority employees. Such payments for PATH exempt employees totaled $1,956,000 in 2003 and $1,945,000 in 2002.
9. The 2003 balance of “Other noncurrent liabilities” consists of the following:
Gross other liabilities $143,767 $27,772 $71,737 99,802
Less current portion:Workers’ compensation liability 13,603PATH exempt employee supplemental 1,956
Total other noncurrent liabilities $84,243
75
Notes to Consolidated Financial Statements(continued)
10. On December 31, 2003, the Port Authority and the Brooklyn Bridge Park Development Corporation (BBPDC) entered into a Memorandum of Understanding providing for the Port Authority to transfer its property rights in Piers 1, 2, 3 and 5 at theBrooklyn-Port Authority Marine Terminal to BBPDC, and to allocate approximately $85 million for the development of a park onsuch property, subject to completion of certain environmental reviews and completion of the planning and authorizationnecessary for the BBPDC to acquire the property. The net book value of the piers as of December 31, 2003 was $ 31.6 million.
Note K Information with Respect to the Events of September 11, 2001
The World Trade Center’s components, which included two 110-story office towers (One and Two World Trade Center), two nine-story office buildings (Four and Five World Trade Center), an eight-story office building (Six World Trade Center), a 22-story hotel(Three World Trade Center), a 47-story office building (Seven World Trade Center), an electrical sub-station (Con Ed Substation)under Seven World Trade Center, a retail shopping mall, and a six level sub-grade area located below the World Trade Centercomplex, together with the PATH-World Trade Center rail station (PATH-WTC station) were destroyed as a result of the terroristattacks of September 11, 2001.
On July 24, 2001, the Port Authority entered into net leases with respect to One, Two, Four and Five World Trade Center with singlepurpose entities established by Silverstein Properties, Inc. (the Silverstein net lessees), and with respect to the retail componentsof the World Trade Center, with a single purpose entity established by an affiliate of Westfield America, Inc. (Westfield). The termsof the 99-year net leases generally required the net lessees to pay in the aggregate $616 million upon commencement of the netleases, base rent starting at $102 million annually and, when applicable, a graduating percentage of gross revenues. The netleases do not provide for rent abatement before or during the restoration period.
The terms of the net leases establish both an obligation and concomitant right for the net lessees, at their sole cost and expense, torestore their net leased premises following a casualty whether or not the damage is covered by insurance proceeds in accordance,to the extent feasible, prudent and commercially reasonable, with the plans and specifications as they existed before the casualty oras otherwise agreed to with the Port Authority. The net lessees obtained property damage and business interruption insurance in acombined single limit of approximately $3.5 billion per occurrence. Since the events of September 11, 2001, the insurancecompanies participating in this program have made advances of approximately $2 billion under the program. Approximately$1.3 billion of these advances has been used for the net lessees’ business interruption expenses, including the payment of rent tothe Port Authority, the prepayment of the mortgage loan entered into on July 24, 2001 by the Silverstein net lessees with GMACCommercial Mortgage Corporation in the amount of approximately $562 million, and the purchase by the Port Authority onDecember 23, 2003 of the retail net lessee from Westfield for $140 million. The Port Authority now owns 100% of the membershipinterest in and is the sole managing member of this single purpose entity, which is now known as “WTC Retail LLC”.
Future minimum rentals (see Note G) include rentals of approximately $97.3 billion attributable to the World Trade Center netleases described above. The inclusion of this amount in future rentals is predicated upon the assumption that the net lessees ofvarious components of the World Trade Center will continue to meet their contractual commitments pertaining to their net leasedproperties, including those with respect to the payment of rent and the restoration of their net leased properties. The net lessees’ability to meet these contractual commitments may be affected by the outcome of certain pending and future litigation involvinginsurance and other matters, the nature of the downtown Manhattan real estate market, and coordination among various publicand private sector entities involved in the redevelopment of downtown Manhattan.
Accounting
In 2001, the Port Authority reclassified and recognized as an operating expense the $1.1 billion net book value of various assetsconsisting primarily of buildings, infrastructure and certain ancillary equipment that together comprised the components of theWorld Trade Center complex destroyed as a result of the September 11, 2001 terrorist attacks. A receivable in an amount equal tosuch net book value was recorded in 2001. As of December 31, 2003, the remaining balance of $874 million of the receivablerecognized in 2001 represents amounts at least equal to the presently expected value of the properties to be constructed by thenet lessees at the World Trade Center site.
As of December 31, 2003, recoverable amounts of approximately $1.37 billion comprising $953 million in proceeds from the PortAuthority’s insurance policies and $413 million from the Federal Emergency Management Agency (FEMA) have been recognizedby the Port Authority. Of this amount, $869 million has been recognized as income net of $429 million of expenses related to theevents of September 11, 2001, primarily the cost of office space necessary to replace the Port Authority’s offices that were locatedat the World Trade Center, and the balance of approximately $68 million has been applied to a portion of the outstandingreceivable representing the net book value of the properties destroyed. The Port Authority received the maximum amountallocated by FEMA for reimbursement of the Port Authority’s costs related to the events of September 11, 2001.
76
Schedule A — Revenues and Reserves(Pursuant to Port Authority bond resolutions)
Year ended December 31, 2003 2002
Operating Reserve Combined CombinedFund Funds Total Total
(In thousands)
GROSS OPERATING REVENUES:Rentals $ 858,414 $ — $ 858,414 $ 832,527Tolls and fares 758,326 — 758,326 774,337Aviation fees 705,302 — 705,302 672,175Parking and other 234,261 — 234,261 197,912Utilities 112,555 — 112,555 97,184Rentals — Special Project Bond projects 95,193 — 95,193 96,448
Total gross operating revenues 2,764,051 — 2,764,051 2,670,583
OPERATING EXPENSES:Employee compensation, including benefits 769,711 — 769,711 777,146Contract services 543,926 — 543,926 622,781Rents and amounts in-lieu-of taxes 237,276 — 237,276 140,614Materials, equipment and other 150,700 — 150,700 135,321Utilities 122,445 — 122,445 113,880Interest on Special Project Bonds 95,193 — 95,193 96,448
Total operating expenses 1,919,251 — 1,919,251 1,886,190
Amounts in connection with operating asset obligations (35,113) — (35,113) (35,960)Net recoverables related to the events of
September 11, 2001 664,211 — 664,211 474,663
Net operating revenues 1,473,898 — 1,473,898 1,223,096
FINANCIAL INCOME:Income on investments 33,952 11,975 45,927 66,048Net increase in fair value of investments 11,598 4,240 15,838 29,914
Contributions in aid of construction 57,568 — 57,568 36,258Grants 34,501 — 34,501 19,892Regional ferry pass-through grant program payments (28,237) — (28,237) (11,556)
Net revenues available for debt service and reserves 1,583,280 16,215 1,599,495 1,363,652
DEBT SERVICE:Interest on bonds and other capital asset obligations 291,514 6,860 298,374 298,463Debt maturities and retirements 698,280 — 698,280 181,250Debt retirement acceleration — 183,120 183,120 283,502Repayment of capital asset obligations — 6,329 6,329 5,863
Total debt service 989,794 196,309 1,186,103 769,078
Transfers to reserves $ (593,486) 593,486 — —
Revenues after debt service and transfers to reserves 413,392 413,392 594,574Direct investment in facilities (542,260) (542,260) (433,747)Appropriations for self-insurance (15,201) (15,201) (19,017)
(Decrease) increase in reserves (144,069) (144,069) 141,810Reserve balances, January 1 1,717,115 1,717,115 1,575,305
Reserve balances, December 31 $1,573,046 $1,573,046 $1,717,115
See Notes to Consolidated Financial Statements.
Schedule B — Assets and Liabilities(Pursuant to Port Authority bond resolutions)
December 31, 2003 2002
Operating Capital Reserve Combined CombinedFund Fund Funds Total Total
(In thousands)
ASSETSCurrent assets:
Cash $ 28,398 $ — $ 1,000 $ 29,398 $ 40,563Investments 998,458 329,303 829,110 2,156,871 1,663,474Current receivables, net 282,111 2 — 282,113 275,294Other current assets 41,477 23,283 — 64,760 51,144Restricted receivables in connection with
PFC projects 15,153 — — 15,153 16,505
Total current assets 1,365,597 352,588 830,110 2,548,295 2,046,980
Noncurrent assets:Restricted cash 10,295 — — 10,295 9,362Investments 172,515 154,343 742,936 1,069,794 1,329,837Other amounts receivable, net 36,829 999,644 — 1,036,473 1,274,239Deferred charges and other noncurrent assets 952,491 16,166 — 968,657 371,314Amounts receivable — Special Project Bond projects — 1,404,074 — 1,404,074 1,425,270Invested in facilities — 19,866,282 — 19,866,282 17,947,787
Total noncurrent assets 1,172,130 22,440,509 742,936 24,355,575 22,357,809
Total assets 2,537,727 22,793,097 1,573,046 26,903,870 24,404,789
LIABILITIESCurrent liabilities:
Accounts payable 196,526 329,303 — 525,829 565,695Accrued interest and other current liabilities 1,056,855 20,370 — 1,077,225 430,975Accrued payroll and other employee benefits 99,942 — — 99,942 105,162Deferred income in connection with PFCs 15,153 — — 15,153 16,505Current portion bonds and other asset
Total noncurrent liabilities 1,048,779 8,600,123 — 9,648,902 9,427,151
Total liabilities 2,468,366 9,779,906 — 12,248,272 11,160,779
NET ASSETS $ 69,361 $13,013,191 $1,573,046 $14,655,598 $13,244,010
Net assets are composed of:Facility infrastructure investment $ — $13,013,191 $ — $13,013,191 $11,472,735Reserves — — 1,573,046 1,573,046 1,717,115Appropriated reserves for self-insurance 69,361 — — 69,361 54,160
Net assets $ 69,361 $13,013,191 $1,573,046 $14,655,598 $13,244,010
77
See Notes to Consolidated Financial Statements.
78
Schedule C — Analysis of Reserve Funds(Pursuant to Port Authority bond resolutions)
Year ended December 31, 2003 2002
General ConsolidatedReserve Bond Reserve Combined Combined
Fund Fund Total Total
(In thousands)
Balance, January 1 $907,075 $ 810,040 $1,717,115 $1,575,305Income on investments 8,769 3,206 11,975 22,976Net increase in fair value of investments 2,491 1,749 4,240 8,660Transfer from operating fund 30,567 562,919 593,486 868,131
948,902 1,377,914 2,326,816 2,475,072
APPLICATIONS:
Repayment of capital asset obligations — 6,329 6,329 5,863Interest on capital asset obligations — 6,860 6,860 15,828Debt retirement acceleration — 183,120 183,120 283,502Direct investment in facilities — 542,260 542,260 433,747Self-insurance — 15,201 15,201 19,017
Total applications — 753,770 753,770 757,957
Balance, December 31 $948,902 $ 624,144 $1,573,046 $1,717,115
(a) Data not available for categorizing operating revenues and expenses for the years prior to 1998.
(b) Debt service ratios excluding net recoverables (expenses) related to the events of September 11, 2001 and net amounts associated with the 1993 WTC bombing are as follows:
Times debt service earned 0.94 1.92 2.55 — — — 2.05 — — —
(c) Amounts for 2003 include $500 million due to the maturity of Consolidated Notes issued during 2003 to pay for capital construction in anticipation of the receipt of proceeds from
insurers and FEMA in connection with the events of September 11th. During 2003, such receipts totaled $684 million.
NOTE: This selected financial data is prepared primarily from information contained in Schedules A, B and C and is presented for general information purposes only and is not intended to
reflect specific applications of the revenues and reserves of the Port Authority, which are governed by statutes and its bond resolutions.
See Notes to Consolidated Financial Statements.
80
Schedule D — Selected Statistical Financial Data(continued)
NOTE: This selected financial data is prepared primarily from information contained in Schedules A, B and C and is presented for general information purposes only and is not intended to
reflect specific applications of the revenues and reserves of the Port Authority, which are governed by statutes and its bond resolutions.
See Notes to Consolidated Financial Statements.
81
Schedule E — Information on Port Authority Operations
Year ended December 31, 2003 2002
Gross Income (Loss) Interest & PFC Net NetOperating Operating Depreciation from Other Revenues & Income IncomeRevenues Expenses(a) & Amortization Operations Expenses(b) Grants (Loss) (Loss)
All CrossingsAutomobiles 112,869,000 114,005,000Buses 3,041,000 3,121,000Trucks 7,910,000 8,118,000
Total vehicles 123,820,000 125,244,000
George Washington BridgeAutomobiles 48,354,000 49,921,000Buses 594,000 598,000Trucks 4,023,000 4,155,000
Total vehicles 52,971,000 54,674,000
Lincoln TunnelAutomobiles 18,120,000 17,750,000Buses 1,973,000 2,042,000Trucks 985,000 1,139,000
Total vehicles 21,078,000 20,931,000
Holland TunnelAutomobiles 15,790,000 15,227,000Buses 232,000 213,000Trucks 544,000 324,000
Total vehicles 16,566,000 15,764,000
Staten Island BridgesAutomobiles 30,605,000 31,107,000Buses 242,000 268,000Trucks 2,358,000 2,500,000
Total vehicles 33,205,000 33,875,000
Cumulative PA Investment in Tunnels and Bridges(In thousands) $ 2,633,246 $ 2,424,316
PATH
2003 2002
Total passengers 47,890,000 51,920,000Passenger weekday average 160,000 174,000
Cumulative PA Investmentin PATH(In thousands) $ 2,170,285 $ 1,663,593
MARINE TERMINALS2003 2002
All TerminalsContainers 2,231,931 2,143,827General cargo(a)(Metric tons) 23,539,000 21,633,000
New Jersey Marine TerminalsContainers 1,903,367 1,802,809
New York Marine TerminalsContainers 328,564 341,018
Cumulative PA Investment in Marine Terminals(In thousands) $ 2,078,759 $ 1,845,964
AIR TERMINALS2003 2002
Totals at the Three Major AirportsPlane movements 1,061,000 1,055,900Passenger traffic 83,646,500 81,146,700Cargo-tons 2,612,200 2,582,600Revenue mail-tons 176,775 147,108
Cumulative PA Investment in Bus Facilities(In thousands) $ 698,449 $ 633,961
2003 2002
Total Port Authority CumulativeInvested in facilities,including the above(In thousands) $19,866,282 $17,947,787
(a) International oceanborne general cargo as recorded in the New York-New JerseyCustoms District.
* Some 2002 numbers reflect revised data.
Santiago Calatrava’s proposed design for the future World Trade Center Transportation Hub
foundations
foundationsComprehensive Annual Financial Report For The Year Ended December 31, 2003
2003 Annual Report
Tina Hansen Senior Editor
Mariana Lopez, John Olberding Deputy Editors
Maximo Dela Cruz Jr. Financial Editor
Wilson Pacheco, Andrea Delmar Financial Section
Kevin Kirchman Managing Editor
Eileen Parisi Production Supervision
William Vasquez, Paul Warchol Photography
G2 Worldwide Inc. Concept and Design
Prepared by the Public Affairs and Comptroller's Departments of The Port Authority of New York and New Jersey225 Park Avenue South New York, NY 10003www.panynj.gov C
om
pre
he
nsi
ve A
nn
ua
l Fi
na
nci
al
Re
po
rt F
or
The
Ye
ar
En
de
d D
ece
mb
er
31
, 2
00
3fo
un
da
tio
ns
In 2003, important groundwork was laid for the enduring success ofboth the Port Authority and the region. Continuing our ongoingvision for the entire region,the literal frameworks and important first steps weimplemented over the last twelve months solidifyimportant progress in New York and New Jerseyand further our commitmentto the community. The workdone this year ensures a strong future for us all.