37
1 2 3 4 5 6 7 8 9 10 11 Q1 Q2

8/2/2019 Four Factors
http://slidepdf.com/reader/full/four-factors 1/37
1
2
3
4
5
6
7
8
9
10
11
Q1
Q2

8/2/2019 Four Factors
http://slidepdf.com/reader/full/four-factors 2/37
Q3
Q4
12
13
14
15
Q5
Q6

8/2/2019 Four Factors
http://slidepdf.com/reader/full/four-factors 3/37
Q7
16

8/2/2019 Four Factors
http://slidepdf.com/reader/full/four-factors 4/37
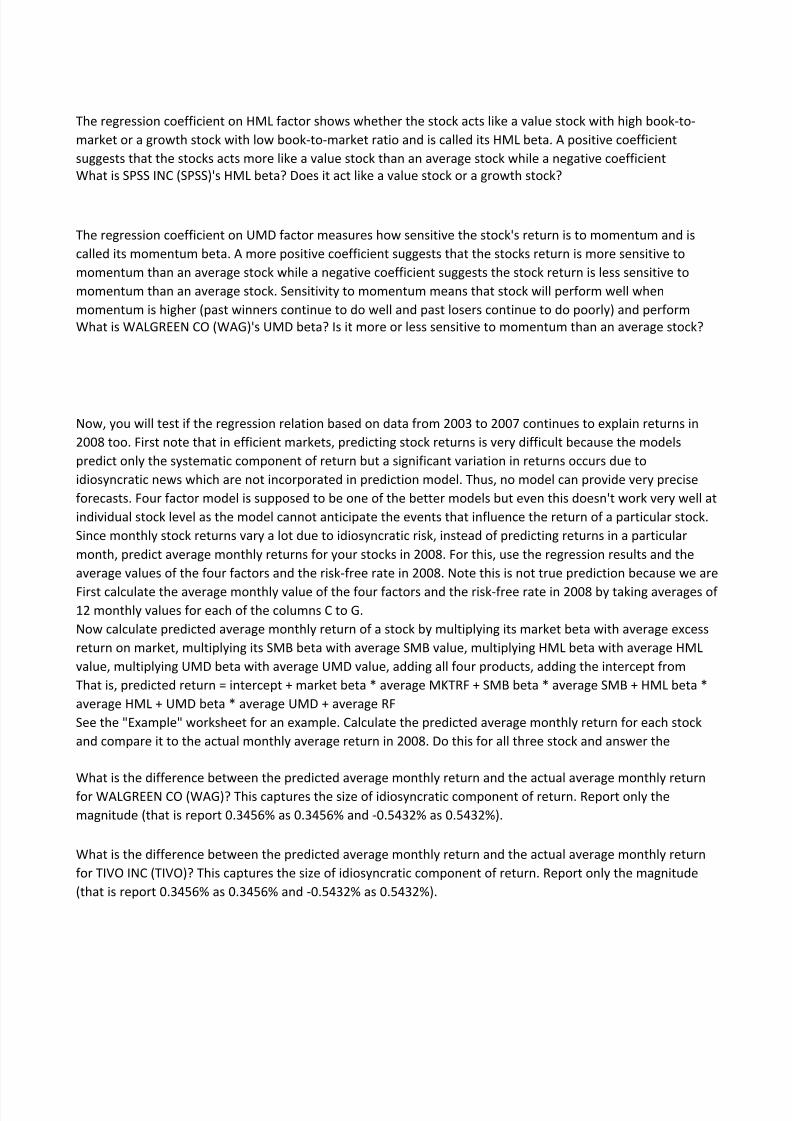
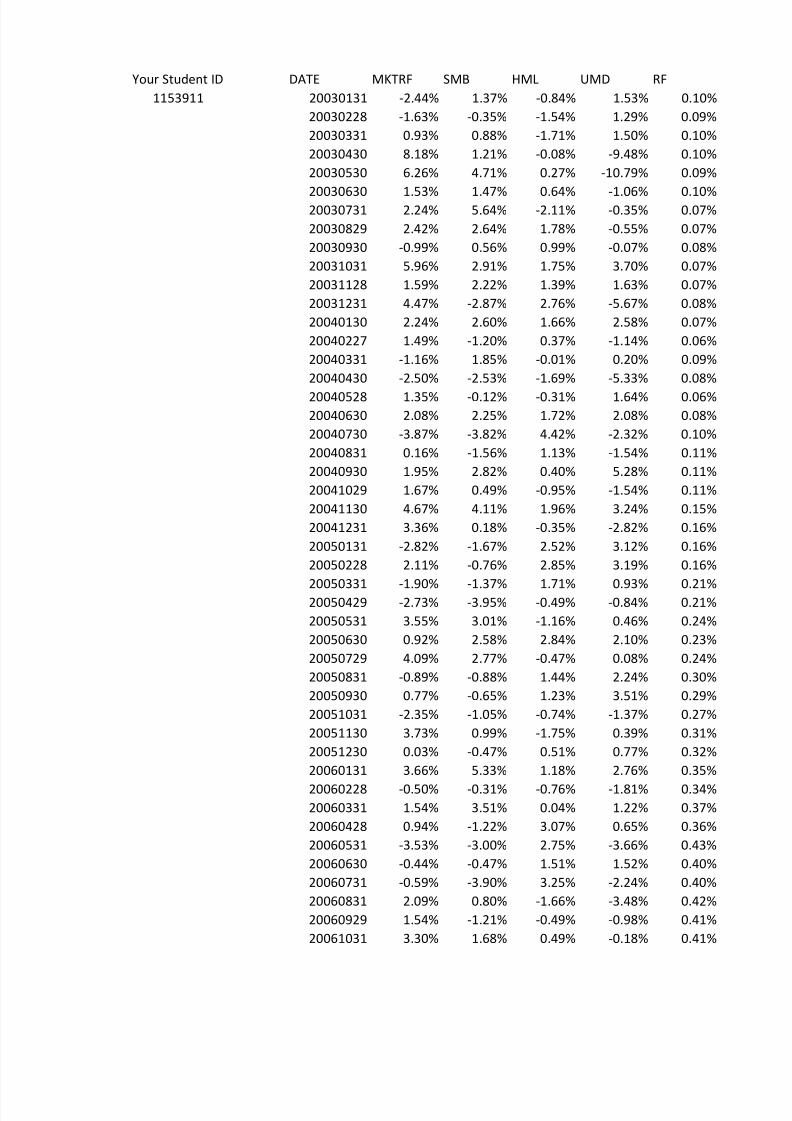
Please Enter Your Student ID Here ------>
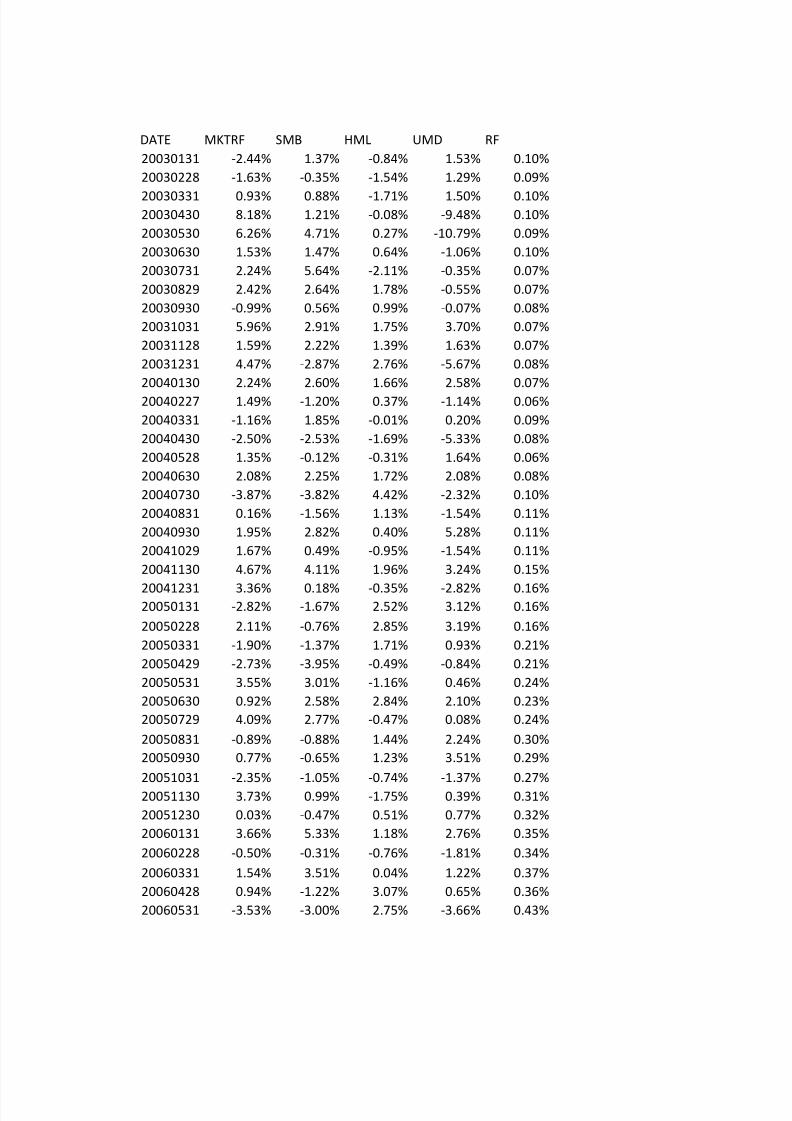
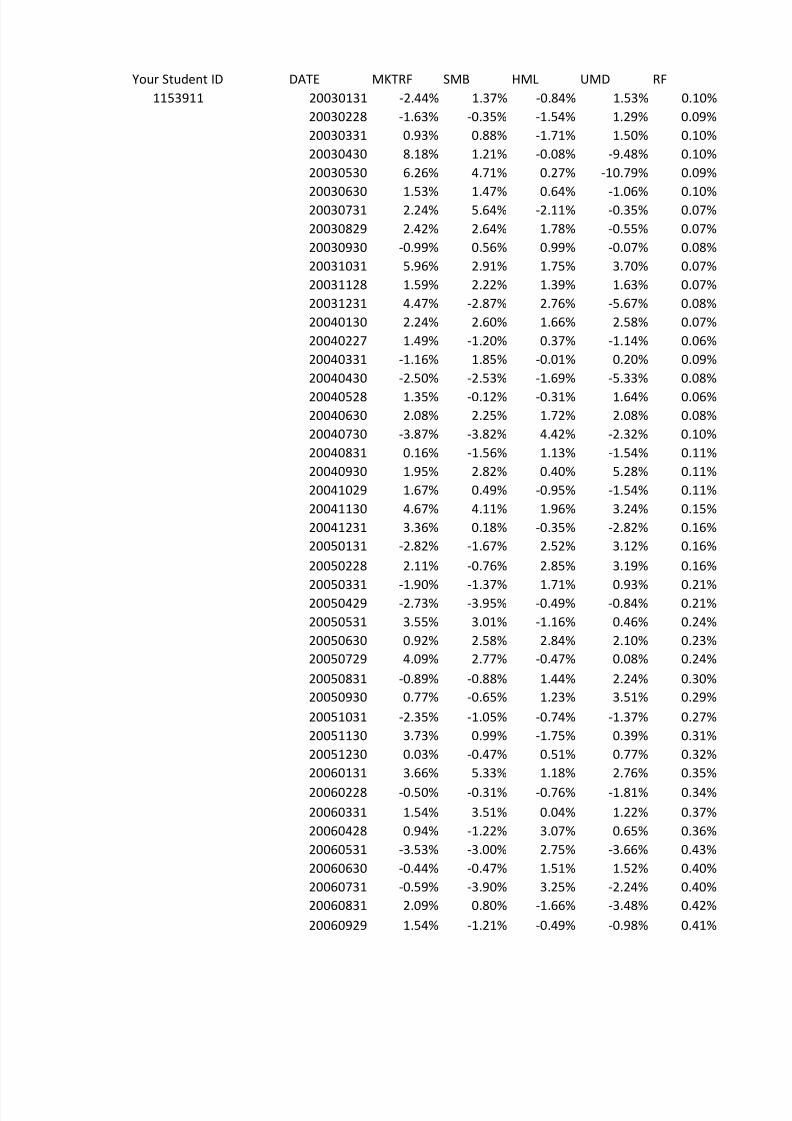
Once you have entered your student ID above, you should see data on the "Data" worksheet. The data consists
of a few monthly time series with month-end dates in column B. The series start in January 2003 and end in
December 2008. There is empty space separating year 2008 from earlier data because you will use earlier data
The first time series in column C is the excess return on the market, that is, the market return minus the risk-free rate. Next, the Fama-French factors: SMB (return on small stocks minus return on big stocks) in column D
and HML (return on high book-to-market stocks minus return on low book-to-market stocks) in column E.
Column F consists of the momentum factor UMD (return on up stocks up in the past minus return on stocks
down in the past. Column G provides the risk-free return in each month.
Columns I to K provide monthly returns for three stocks. You can use any blank area of that worksheet for your
calculations. You can also create and edit other worksheets in this spreadsheet or copy the data to another
spreadsheet for your calcuations. Or if you are comfortable with some other statistical page, you can copy the
First you need to determine the characteristics of your stocks based on the data from 2003-2007. That is, you
have to estimate how does the excess return on each stock return varies with the excess return on the market,
the Fama-French factors, and the momentum factor. Here are the steps:
Calculate in some blank column the excess return on your stock by subtracting the risk-free rate (column G)
from your stock's return (column I, J, or K).
Next perform a regression of the excess return on the 4 factors: excess return on market, SMB, HML, and
UMD. For this, you can use Excel's Data Analysis feature.
There are two ways of running regression in Excel. You can use linest function after reading its description in
help. Or you can use data analysis tool. If you use Excel 2007, please go to data tab and look at the rightmost
column for data analysis. If you don't see that, click the Microsoft Office Button (at top left), and then click
Excel Options. Click Add-Ins, and then in the Manage box, select Excel Add-ins. Click Go. In the Add-Ins available
box, select the Analysis ToolPak check box, and then click OK. After you load the Analysis ToolPak, the Data
Analysis command is available in the Analysis group on the Data tab. If you use a version of Excel earlier thanExcel 2007, please go to tools menu to find "Data Analysis." If you don't see data analysis, please choose "Add-
Do not force constant (intercept) term to be zero. You may specify the regression output to be in the same
worksheet or in a new worksheet.
See the "Example" tab for an example of such a regression. You will need to perform three regressions, one for
each stock. Now answer the following questions:
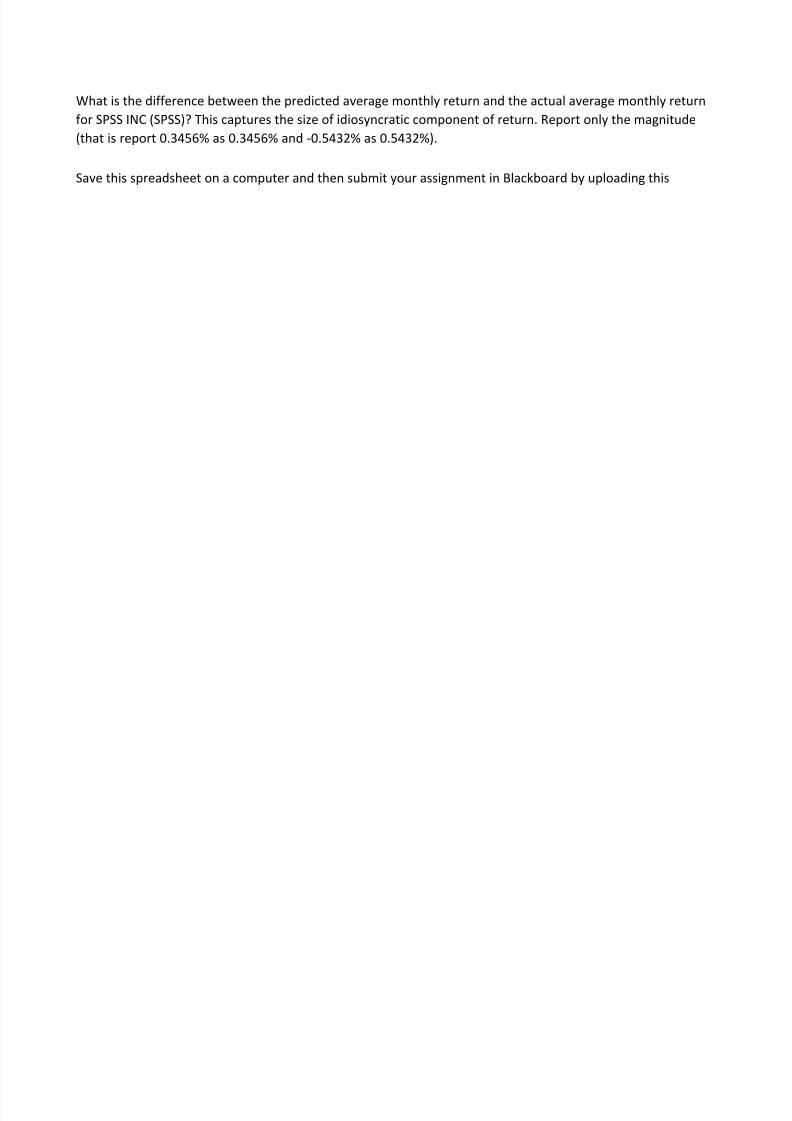
What is WALGREEN CO (WAG)'s market beta? Does it have more market risk or less market risk than an
average stock?
The regression coefficient on SMB factor shows whether the stock acts like a small stock or a big stock and is
called its SMB beta. A positive coefficient suggests that the stock acts more like a small stock than an average
stock while a negative coefficient suggests that the stock acts more like a big stock than an average stock.
What is TIVO INC (TIVO)'s SMB beta? Does it act like a small stock or a big stock?
8/2/2019 Four Factors
http://slidepdf.com/reader/full/four-factors 5/37
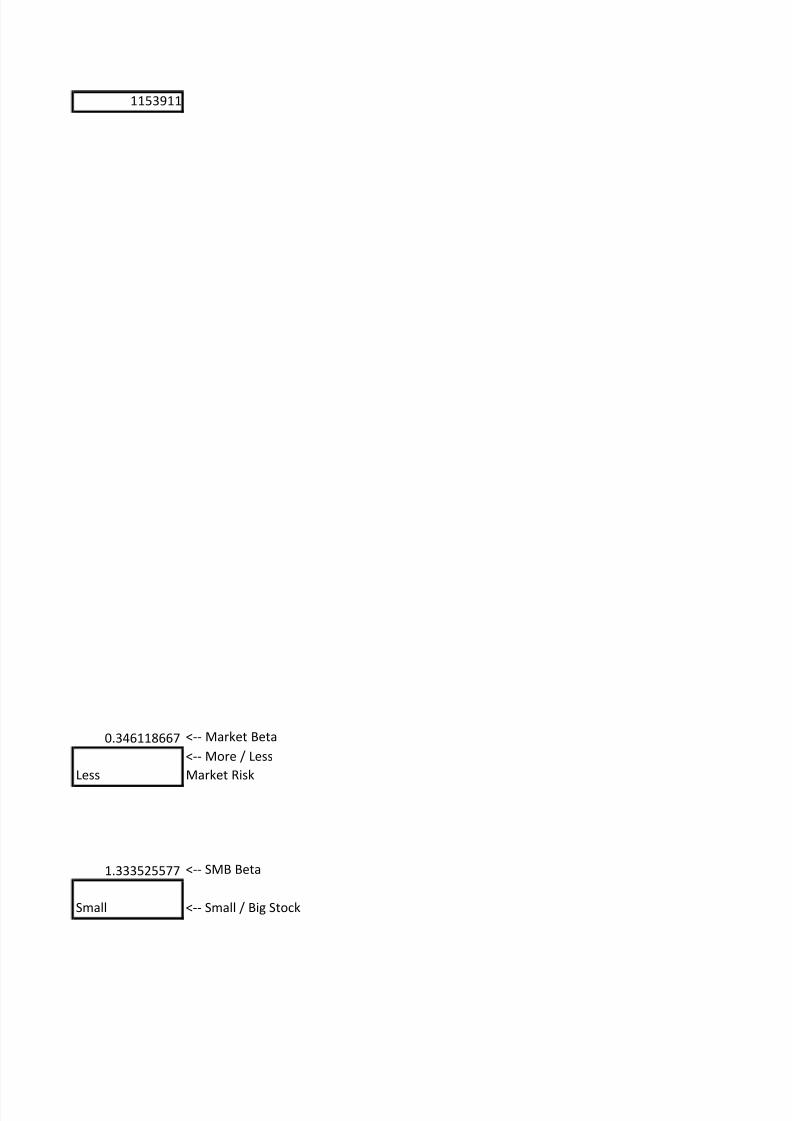
The regression coefficient on HML factor shows whether the stock acts like a value stock with high book-to-
market or a growth stock with low book-to-market ratio and is called its HML beta. A positive coefficient
suggests that the stocks acts more like a value stock than an average stock while a negative coefficient
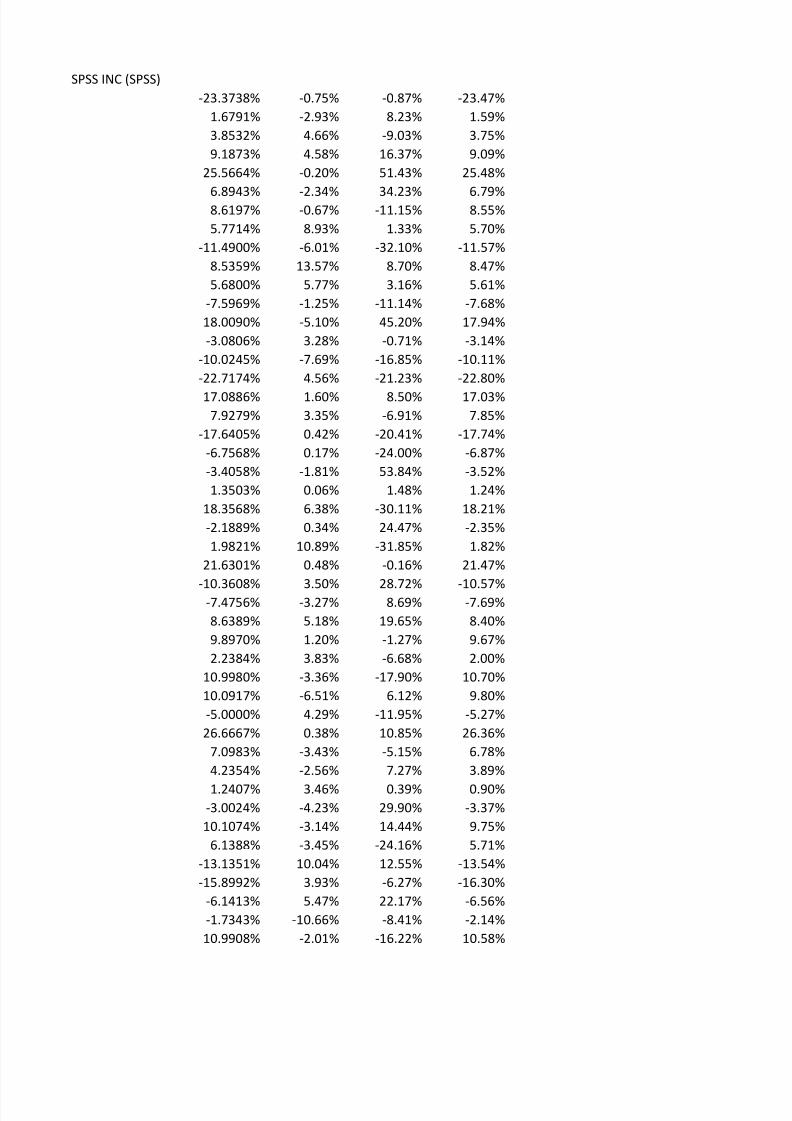
What is SPSS INC (SPSS)'s HML beta? Does it act like a value stock or a growth stock?
The regression coefficient on UMD factor measures how sensitive the stock's return is to momentum and is
called its momentum beta. A more positive coefficient suggests that the stocks return is more sensitive to
momentum than an average stock while a negative coefficient suggests the stock return is less sensitive to
momentum than an average stock. Sensitivity to momentum means that stock will perform well when
momentum is higher (past winners continue to do well and past losers continue to do poorly) and perform
What is WALGREEN CO (WAG)'s UMD beta? Is it more or less sensitive to momentum than an average stock?
Now, you will test if the regression relation based on data from 2003 to 2007 continues to explain returns in
2008 too. First note that in efficient markets, predicting stock returns is very difficult because the models
predict only the systematic component of return but a significant variation in returns occurs due to
idiosyncratic news which are not incorporated in prediction model. Thus, no model can provide very precise
forecasts. Four factor model is supposed to be one of the better models but even this doesn't work very well at
individual stock level as the model cannot anticipate the events that influence the return of a particular stock.
Since monthly stock returns vary a lot due to idiosyncratic risk, instead of predicting returns in a particular
month, predict average monthly returns for your stocks in 2008. For this, use the regression results and the
average values of the four factors and the risk-free rate in 2008. Note this is not true prediction because we are
First calculate the average monthly value of the four factors and the risk-free rate in 2008 by taking averages of 12 monthly values for each of the columns C to G.
Now calculate predicted average monthly return of a stock by multiplying its market beta with average excess
return on market, multiplying its SMB beta with average SMB value, multiplying HML beta with average HML
value, multiplying UMD beta with average UMD value, adding all four products, adding the intercept from
That is, predicted return = intercept + market beta * average MKTRF + SMB beta * average SMB + HML beta *
average HML + UMD beta * average UMD + average RF
See the "Example" worksheet for an example. Calculate the predicted average monthly return for each stock
and compare it to the actual monthly average return in 2008. Do this for all three stock and answer the
What is the difference between the predicted average monthly return and the actual average monthly return
for WALGREEN CO (WAG)? This captures the size of idiosyncratic component of return. Report only the
magnitude (that is report 0.3456% as 0.3456% and -0.5432% as 0.5432%).
What is the difference between the predicted average monthly return and the actual average monthly return
for TIVO INC (TIVO)? This captures the size of idiosyncratic component of return. Report only the magnitude
(that is report 0.3456% as 0.3456% and -0.5432% as 0.5432%).
8/2/2019 Four Factors
http://slidepdf.com/reader/full/four-factors 6/37
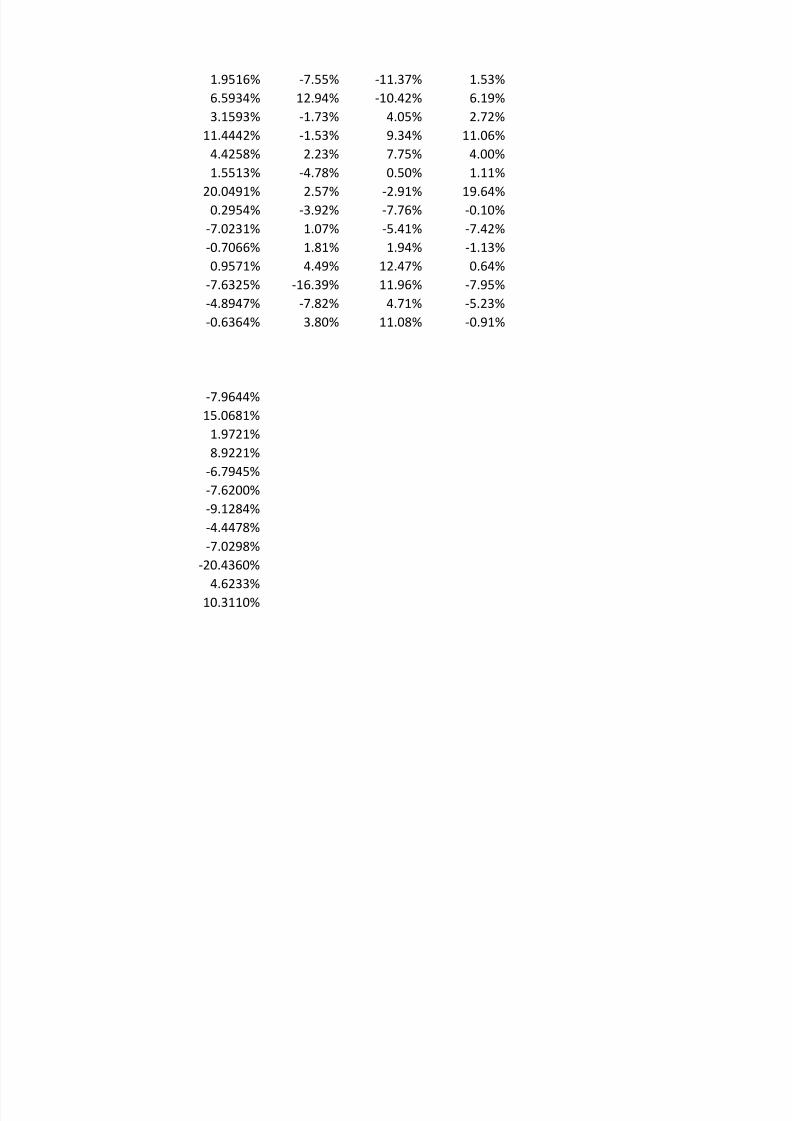
What is the difference between the predicted average monthly return and the actual average monthly return
for SPSS INC (SPSS)? This captures the size of idiosyncratic component of return. Report only the magnitude
(that is report 0.3456% as 0.3456% and -0.5432% as 0.5432%).
Save this spreadsheet on a computer and then submit your assignment in Blackboard by uploading this
8/2/2019 Four Factors
http://slidepdf.com/reader/full/four-factors 7/37
1153911
0.346118667 <-- Market Beta
Less
<-- More / Less
Market Risk
1.333525577 <-- SMB Beta
Small <-- Small / Big Stock
8/2/2019 Four Factors
http://slidepdf.com/reader/full/four-factors 8/37
0.826873977 <-- HML Beta
Value <-- Value / Growth
0.019773085 <-- UMD Beta
More
<-- More / Less
Sensitive to
Momentum
1.89994% <-- Difference
5.5958% <-- Difference

8/2/2019 Four Factors
http://slidepdf.com/reader/full/four-factors 9/37
3.90244% <-- Difference

8/2/2019 Four Factors
http://slidepdf.com/reader/full/four-factors 10/37
SUMMARY OUTPUT
Regression Statistics
Multiple R 0.25389
R Square 0.06446
Adjusted R -0.00358
Standard E 0.05528Observatio 60
ANOVA
df SS MS F gnificance F
Regression 4 0.011581 0.002895 0.947399 0.443718
Residual 55 0.168074 0.003056
Total 59 0.179655
Coefficientsandard Err t Stat P-value Lower 95%Upper 95%ower 95.0 pper 95.0%
Intercept -0.00157 0.007834 -0.19985 0.842334 -0.01726 0.014133 -0.01726 0.014133
MKTRF 0.346119 0.332153 1.042047 0.301949 -0.31953 1.011767 -0.31953 1.011767
SMB -0.01862 0.395802 -0.04705 0.962645 -0.81183 0.774583 -0.81183 0.774583
HML 0.667663 0.441315 1.512896 0.136032 -0.21675 1.552078 -0.21675 1.552078
UMD 0.019773 0.243763 0.081116 0.935644 -0.46874 0.508286 -0.46874 0.508286

8/2/2019 Four Factors
http://slidepdf.com/reader/full/four-factors 11/37
SUMMARY OUTPUT
Regression Statistics
Multiple R 0.398899
R Square 0.159121
Adjusted R 0.097966
Standard E 0.176261Observatio 60
ANOVA
df SS MS F gnificance F
Regression 4 0.323347 0.080837 2.601928 0.045774
Residual 55 1.708741 0.031068
Total 59 2.032088
Coefficientsandard Err t Stat P-value Lower 95%Upper 95%ower 95.0 pper 95.0%
Intercept 0.006313 0.024978 0.252733 0.801417 -0.04374 0.056369 -0.04374 0.056369
MKTRF 1.721172 1.059071 1.625172 0.109843 -0.40125 3.843599 -0.40125 3.843599
SMB 1.333526 1.262017 1.056662 0.295285 -1.19561 3.862664 -1.19561 3.862664
HML -1.61552 1.407136 -1.14809 0.2559 -4.43549 1.204442 -4.43549 1.204442
UMD 0.138822 0.777242 0.178609 0.858901 -1.41881 1.69645 -1.41881 1.69645

8/2/2019 Four Factors
http://slidepdf.com/reader/full/four-factors 12/37
SUMMARY OUTPUT
Regression Statistics
Multiple R 0.591405
R Square 0.34976
Adjusted R 0.30247
Standard E 0.08975Observatio 60
ANOVA
df SS MS F gnificance F
Regression 4 0.238301 0.059575 7.396032 7.68E-05
Residual 55 0.443026 0.008055
Total 59 0.681327
Coefficientsandard Err t Stat P-value Lower 95%Upper 95%ower 95.0 pper 95.0%
Intercept -0.0044 0.012718 -0.34611 0.730582 -0.02989 0.021086 -0.02989 0.021086
MKTRF 1.77791 0.539264 3.296918 0.001716 0.6972 2.85862 0.6972 2.85862
SMB 0.98293 0.642601 1.529611 0.131845 -0.30487 2.270732 -0.30487 2.270732
HML 0.826874 0.716494 1.154055 0.253468 -0.60901 2.26276 -0.60901 2.26276
UMD 0.383464 0.395761 0.968928 0.336823 -0.40966 1.176586 -0.40966 1.176586
8/2/2019 Four Factors
http://slidepdf.com/reader/full/four-factors 13/37
Your Student ID DATE MKTRF SMB HML UMD RF
1153911 20030131 -2.44% 1.37% -0.84% 1.53% 0.10%
20030228 -1.63% -0.35% -1.54% 1.29% 0.09%
20030331 0.93% 0.88% -1.71% 1.50% 0.10%
20030430 8.18% 1.21% -0.08% -9.48% 0.10%
20030530 6.26% 4.71% 0.27% -10.79% 0.09%
20030630 1.53% 1.47% 0.64% -1.06% 0.10%20030731 2.24% 5.64% -2.11% -0.35% 0.07%
20030829 2.42% 2.64% 1.78% -0.55% 0.07%
20030930 -0.99% 0.56% 0.99% -0.07% 0.08%
20031031 5.96% 2.91% 1.75% 3.70% 0.07%
20031128 1.59% 2.22% 1.39% 1.63% 0.07%
20031231 4.47% -2.87% 2.76% -5.67% 0.08%
20040130 2.24% 2.60% 1.66% 2.58% 0.07%
20040227 1.49% -1.20% 0.37% -1.14% 0.06%
20040331 -1.16% 1.85% -0.01% 0.20% 0.09%
20040430 -2.50% -2.53% -1.69% -5.33% 0.08%
20040528 1.35% -0.12% -0.31% 1.64% 0.06%
20040630 2.08% 2.25% 1.72% 2.08% 0.08%
20040730 -3.87% -3.82% 4.42% -2.32% 0.10%
20040831 0.16% -1.56% 1.13% -1.54% 0.11%
20040930 1.95% 2.82% 0.40% 5.28% 0.11%
20041029 1.67% 0.49% -0.95% -1.54% 0.11%
20041130 4.67% 4.11% 1.96% 3.24% 0.15%
20041231 3.36% 0.18% -0.35% -2.82% 0.16%
20050131 -2.82% -1.67% 2.52% 3.12% 0.16%
20050228 2.11% -0.76% 2.85% 3.19% 0.16%
20050331 -1.90% -1.37% 1.71% 0.93% 0.21%20050429 -2.73% -3.95% -0.49% -0.84% 0.21%
20050531 3.55% 3.01% -1.16% 0.46% 0.24%
20050630 0.92% 2.58% 2.84% 2.10% 0.23%
20050729 4.09% 2.77% -0.47% 0.08% 0.24%
20050831 -0.89% -0.88% 1.44% 2.24% 0.30%
20050930 0.77% -0.65% 1.23% 3.51% 0.29%
20051031 -2.35% -1.05% -0.74% -1.37% 0.27%
20051130 3.73% 0.99% -1.75% 0.39% 0.31%
20051230 0.03% -0.47% 0.51% 0.77% 0.32%
20060131 3.66% 5.33% 1.18% 2.76% 0.35%
20060228 -0.50% -0.31% -0.76% -1.81% 0.34%
20060331 1.54% 3.51% 0.04% 1.22% 0.37%
20060428 0.94% -1.22% 3.07% 0.65% 0.36%
20060531 -3.53% -3.00% 2.75% -3.66% 0.43%
20060630 -0.44% -0.47% 1.51% 1.52% 0.40%
20060731 -0.59% -3.90% 3.25% -2.24% 0.40%
20060831 2.09% 0.80% -1.66% -3.48% 0.42%
20060929 1.54% -1.21% -0.49% -0.98% 0.41%
20061031 3.30% 1.68% 0.49% -0.18% 0.41%

8/2/2019 Four Factors
http://slidepdf.com/reader/full/four-factors 14/37
20061130 1.95% 0.70% 0.39% -1.00% 0.42%
20061229 0.68% -0.93% 2.56% 0.81% 0.40%
20070131 1.50% 0.02% 0.00% 0.22% 0.44%
20070228 -1.78% 1.38% 0.32% -1.32% 0.38%
20070330 0.86% -0.20% 0.31% 2.48% 0.43%
20070430 3.55% -2.06% -1.08% -0.14% 0.44%
20070531 3.48% -0.05% -0.23% -0.33% 0.41%20070629 -1.88% 0.69% -1.07% 0.40% 0.40%
20070731 -3.58% -2.74% -3.01% 2.80% 0.40%
20070831 0.74% -0.09% -2.42% 0.14% 0.42%
20070928 3.77% -2.47% -2.10% 4.64% 0.32%
20071031 2.26% 0.07% -1.97% 4.86% 0.32%
20071130 -5.27% -2.72% -0.88% 0.93% 0.34%
20071231 -0.70% 0.06% -0.02% 6.48% 0.27%
20080131 -6.44% -0.76% 3.13% -7.89% 0.21%
20080229 -2.33% -0.67% 0.04% 6.23% 0.13%
20080331 -1.22% 0.87% 0.26% 4.12% 0.17%
20080430 4.94% -1.60% 0.08% -0.38% 0.17%
20080530 2.21% 2.80% -0.30% 3.19% 0.17%
20080630 -8.03% 0.91% -0.93% 12.45% 0.17%
20080731 -1.46% 3.89% 3.57% -5.11% 0.15%
20080829 0.98% 3.66% 1.65% -3.82% 0.12%
20080930 -9.96% -0.20% 4.37% 0.36% 0.15%
20081031 -18.55% -2.05% -3.14% 7.91% 0.08%
20081128 -8.54% -3.46% -5.09% 7.19% 0.02%20081231 2.06% 4.04% -1.20% -5.04% 0.09%

8/2/2019 Four Factors
http://slidepdf.com/reader/full/four-factors 15/37
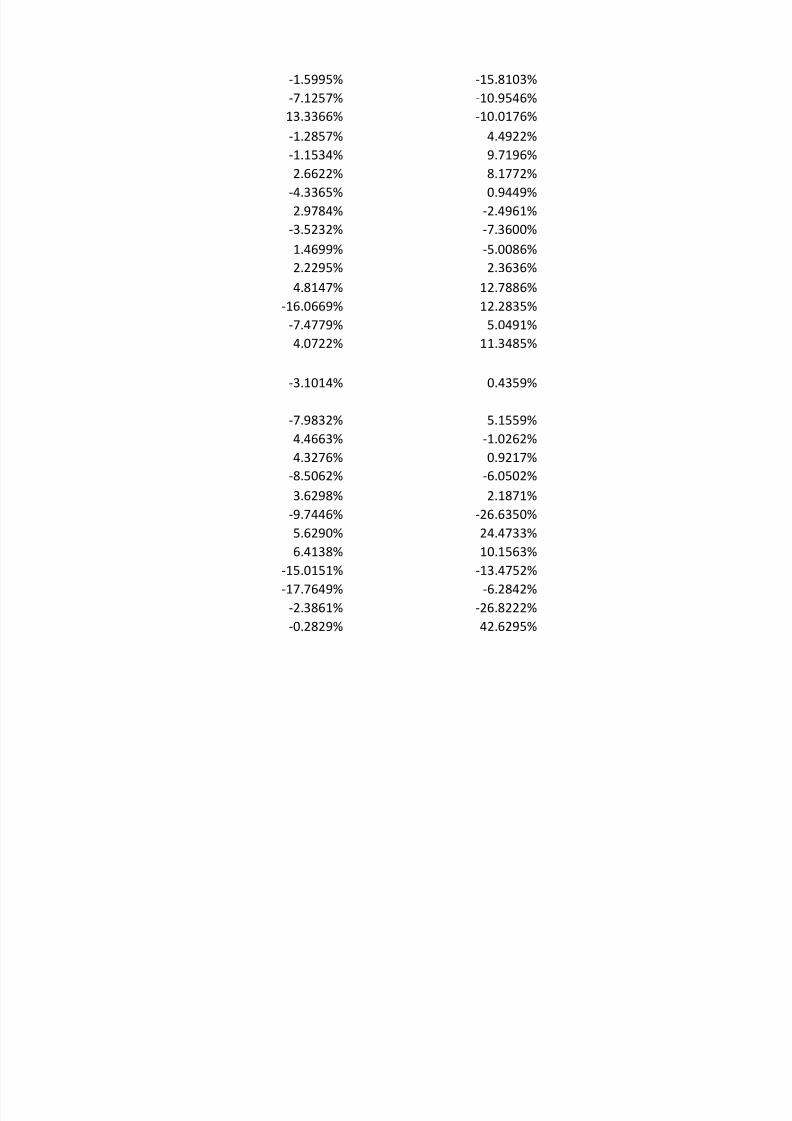
WALGREEN CO (WAG) TIVO INC (TIVO)
-0.6509% -0.7678%
-2.8362% 8.3172%
4.7619% -8.9286%
4.6811% 16.4706%
-0.1053% 51.5152%
-2.2410% 34.3333%-0.5980% -11.0835%
9.0011% 1.3953%
-5.9257% -32.0183%
13.6423% 8.7719%
5.8390% 3.2258%
-1.1682% -11.0577%
-5.0302% 45.2703%
3.3376% -0.6512%
-7.5995% -16.7603%
4.6434% -21.1474%
1.6622% 8.5592%
3.4276% -6.8331%
0.5247% -20.3103%
0.2816% -23.8938%
-1.7010% 53.9535%
0.1675% 1.5861%
6.5269% -29.9628%
0.4976% 24.6284%
11.0503% -31.6865%
0.6395% 0.0000%
3.7123% 28.9277%-3.0617% 8.8975%
5.4169% 19.8934%
1.4336% -1.0370%
4.0661% -6.4371%
-3.0610% -17.6000%
-6.2163% 6.4078%
4.5570% -11.6788%
0.6934% 11.1570%
-3.1086% -4.8327%
-2.2142% 7.6172%
3.8008% 0.7260%
-3.8564% 30.2703%
-2.7823% 14.7994%
-3.0169% -23.7349%
10.4434% 12.9542%
4.3265% -5.8741%
5.8946% 22.5854%
-10.2507% -8.0000%
-1.5995% -15.8103%

8/2/2019 Four Factors
http://slidepdf.com/reader/full/four-factors 16/37
-7.1257% -10.9546%
13.3366% -10.0176%
-1.2857% 4.4922%
-1.1534% 9.7196%
2.6622% 8.1772%
-4.3365% 0.9449%
2.9784% -2.4961%-3.5232% -7.3600%
1.4699% -5.0086%
2.2295% 2.3636%
4.8147% 12.7886%
-16.0669% 12.2835%
-7.4779% 5.0491%
4.0722% 11.3485%
-7.9832% 5.1559%
4.4663% -1.0262%
4.3276% 0.9217%
-8.5062% -6.0502%
3.6298% 2.1871%
-9.7446% -26.6350%
5.6290% 24.4733%
6.4138% 10.1563%
-15.0151% -13.4752%
-17.7649% -6.2842%
-2.3861% -26.8222%-0.2829% 42.6295%
8/2/2019 Four Factors
http://slidepdf.com/reader/full/four-factors 17/37
SPSS INC (SPSS)
-23.3738% -0.75% -0.87% -23.47%
1.6791% -2.93% 8.23% 1.59%
3.8532% 4.66% -9.03% 3.75%
9.1873% 4.58% 16.37% 9.09%
25.5664% -0.20% 51.43% 25.48%
6.8943% -2.34% 34.23% 6.79%8.6197% -0.67% -11.15% 8.55%
5.7714% 8.93% 1.33% 5.70%
-11.4900% -6.01% -32.10% -11.57%
8.5359% 13.57% 8.70% 8.47%
5.6800% 5.77% 3.16% 5.61%
-7.5969% -1.25% -11.14% -7.68%
18.0090% -5.10% 45.20% 17.94%
-3.0806% 3.28% -0.71% -3.14%
-10.0245% -7.69% -16.85% -10.11%
-22.7174% 4.56% -21.23% -22.80%
17.0886% 1.60% 8.50% 17.03%
7.9279% 3.35% -6.91% 7.85%
-17.6405% 0.42% -20.41% -17.74%
-6.7568% 0.17% -24.00% -6.87%
-3.4058% -1.81% 53.84% -3.52%
1.3503% 0.06% 1.48% 1.24%
18.3568% 6.38% -30.11% 18.21%
-2.1889% 0.34% 24.47% -2.35%
1.9821% 10.89% -31.85% 1.82%
21.6301% 0.48% -0.16% 21.47%
-10.3608% 3.50% 28.72% -10.57%-7.4756% -3.27% 8.69% -7.69%
8.6389% 5.18% 19.65% 8.40%
9.8970% 1.20% -1.27% 9.67%
2.2384% 3.83% -6.68% 2.00%
10.9980% -3.36% -17.90% 10.70%
10.0917% -6.51% 6.12% 9.80%
-5.0000% 4.29% -11.95% -5.27%
26.6667% 0.38% 10.85% 26.36%
7.0983% -3.43% -5.15% 6.78%
4.2354% -2.56% 7.27% 3.89%
1.2407% 3.46% 0.39% 0.90%
-3.0024% -4.23% 29.90% -3.37%
10.1074% -3.14% 14.44% 9.75%
6.1388% -3.45% -24.16% 5.71%
-13.1351% 10.04% 12.55% -13.54%
-15.8992% 3.93% -6.27% -16.30%
-6.1413% 5.47% 22.17% -6.56%
-1.7343% -10.66% -8.41% -2.14%
10.9908% -2.01% -16.22% 10.58%
8/2/2019 Four Factors
http://slidepdf.com/reader/full/four-factors 18/37
1.9516% -7.55% -11.37% 1.53%
6.5934% 12.94% -10.42% 6.19%
3.1593% -1.73% 4.05% 2.72%
11.4442% -1.53% 9.34% 11.06%
4.4258% 2.23% 7.75% 4.00%
1.5513% -4.78% 0.50% 1.11%
20.0491% 2.57% -2.91% 19.64%0.2954% -3.92% -7.76% -0.10%
-7.0231% 1.07% -5.41% -7.42%
-0.7066% 1.81% 1.94% -1.13%
0.9571% 4.49% 12.47% 0.64%
-7.6325% -16.39% 11.96% -7.95%
-4.8947% -7.82% 4.71% -5.23%
-0.6364% 3.80% 11.08% -0.91%
-7.9644%
15.0681%
1.9721%
8.9221%
-6.7945%
-7.6200%
-9.1284%
-4.4478%
-7.0298%
-20.4360%
4.6233%10.3110%
8/2/2019 Four Factors
http://slidepdf.com/reader/full/four-factors 19/37
DATE MKTRF SMB HML UMD RF
20030131 -2.44% 1.37% -0.84% 1.53% 0.10%
20030228 -1.63% -0.35% -1.54% 1.29% 0.09%
20030331 0.93% 0.88% -1.71% 1.50% 0.10%20030430 8.18% 1.21% -0.08% -9.48% 0.10%
20030530 6.26% 4.71% 0.27% -10.79% 0.09%
20030630 1.53% 1.47% 0.64% -1.06% 0.10%
20030731 2.24% 5.64% -2.11% -0.35% 0.07%
20030829 2.42% 2.64% 1.78% -0.55% 0.07%
20030930 -0.99% 0.56% 0.99% -0.07% 0.08%
20031031 5.96% 2.91% 1.75% 3.70% 0.07%
20031128 1.59% 2.22% 1.39% 1.63% 0.07%
20031231 4.47% -2.87% 2.76% -5.67% 0.08%
20040130 2.24% 2.60% 1.66% 2.58% 0.07%
20040227 1.49% -1.20% 0.37% -1.14% 0.06%
20040331 -1.16% 1.85% -0.01% 0.20% 0.09%
20040430 -2.50% -2.53% -1.69% -5.33% 0.08%
20040528 1.35% -0.12% -0.31% 1.64% 0.06%
20040630 2.08% 2.25% 1.72% 2.08% 0.08%
20040730 -3.87% -3.82% 4.42% -2.32% 0.10%
20040831 0.16% -1.56% 1.13% -1.54% 0.11%
20040930 1.95% 2.82% 0.40% 5.28% 0.11%
20041029 1.67% 0.49% -0.95% -1.54% 0.11%
20041130 4.67% 4.11% 1.96% 3.24% 0.15%
20041231 3.36% 0.18% -0.35% -2.82% 0.16%20050131 -2.82% -1.67% 2.52% 3.12% 0.16%
20050228 2.11% -0.76% 2.85% 3.19% 0.16%
20050331 -1.90% -1.37% 1.71% 0.93% 0.21%
20050429 -2.73% -3.95% -0.49% -0.84% 0.21%
20050531 3.55% 3.01% -1.16% 0.46% 0.24%
20050630 0.92% 2.58% 2.84% 2.10% 0.23%
20050729 4.09% 2.77% -0.47% 0.08% 0.24%
20050831 -0.89% -0.88% 1.44% 2.24% 0.30%
20050930 0.77% -0.65% 1.23% 3.51% 0.29%
20051031 -2.35% -1.05% -0.74% -1.37% 0.27%
20051130 3.73% 0.99% -1.75% 0.39% 0.31%
20051230 0.03% -0.47% 0.51% 0.77% 0.32%
20060131 3.66% 5.33% 1.18% 2.76% 0.35%
20060228 -0.50% -0.31% -0.76% -1.81% 0.34%
20060331 1.54% 3.51% 0.04% 1.22% 0.37%
20060428 0.94% -1.22% 3.07% 0.65% 0.36%
20060531 -3.53% -3.00% 2.75% -3.66% 0.43%

8/2/2019 Four Factors
http://slidepdf.com/reader/full/four-factors 20/37
20060630 -0.44% -0.47% 1.51% 1.52% 0.40%
20060731 -0.59% -3.90% 3.25% -2.24% 0.40%
20060831 2.09% 0.80% -1.66% -3.48% 0.42%
20060929 1.54% -1.21% -0.49% -0.98% 0.41%
20061031 3.30% 1.68% 0.49% -0.18% 0.41%
20061130 1.95% 0.70% 0.39% -1.00% 0.42%20061229 0.68% -0.93% 2.56% 0.81% 0.40%
20070131 1.50% 0.02% 0.00% 0.22% 0.44%
20070228 -1.78% 1.38% 0.32% -1.32% 0.38%
20070330 0.86% -0.20% 0.31% 2.48% 0.43%
20070430 3.55% -2.06% -1.08% -0.14% 0.44%
20070531 3.48% -0.05% -0.23% -0.33% 0.41%
20070629 -1.88% 0.69% -1.07% 0.40% 0.40%
20070731 -3.58% -2.74% -3.01% 2.80% 0.40%
20070831 0.74% -0.09% -2.42% 0.14% 0.42%
20070928 3.77% -2.47% -2.10% 4.64% 0.32%
20071031 2.26% 0.07% -1.97% 4.86% 0.32%
20071130 -5.27% -2.72% -0.88% 0.93% 0.34%
20071231 -0.70% 0.06% -0.02% 6.48% 0.27%
-3.86% 0.62% 0.20% 1.60% 0.14%
20080131 -6.44% -0.76% 3.13% -7.89% 0.21%
20080229 -2.33% -0.67% 0.04% 6.23% 0.13%
20080331 -1.22% 0.87% 0.26% 4.12% 0.17%
20080430 4.94% -1.60% 0.08% -0.38% 0.17%
20080530 2.21% 2.80% -0.30% 3.19% 0.17%20080630 -8.03% 0.91% -0.93% 12.45% 0.17%
20080731 -1.46% 3.89% 3.57% -5.11% 0.15%
20080829 0.98% 3.66% 1.65% -3.82% 0.12%
20080930 -9.96% -0.20% 4.37% 0.36% 0.15%
20081031 -18.55% -2.05% -3.14% 7.91% 0.08%
20081128 -8.54% -3.46% -5.09% 7.19% 0.02%
20081231 2.06% 4.04% -1.20% -5.04% 0.09%
8/2/2019 Four Factors
http://slidepdf.com/reader/full/four-factors 21/37
EASTMAN KODAK CO
(EK)
EASTMAN KODAK CO
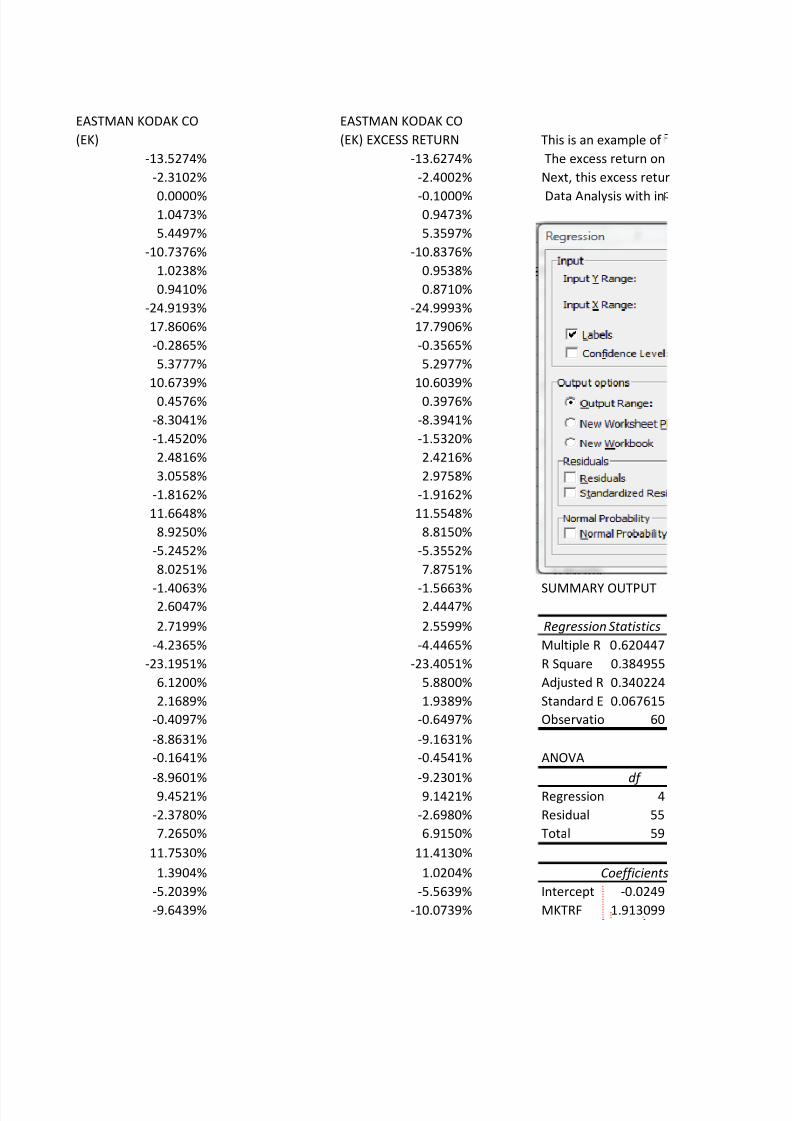
(EK) EXCESS RETURN This is an example of
-13.5274% -13.6274% The excess return on
-2.3102% -2.4002% Next, this excess retur
0.0000% -0.1000% Data Analysis with in1.0473% 0.9473%
5.4497% 5.3597%
-10.7376% -10.8376%
1.0238% 0.9538%
0.9410% 0.8710%
-24.9193% -24.9993%
17.8606% 17.7906%
-0.2865% -0.3565%
5.3777% 5.2977%
10.6739% 10.6039%
0.4576% 0.3976%
-8.3041% -8.3941%
-1.4520% -1.5320%
2.4816% 2.4216%
3.0558% 2.9758%
-1.8162% -1.9162%
11.6648% 11.5548%
8.9250% 8.8150%
-5.2452% -5.3552%
8.0251% 7.8751%
-1.4063% -1.5663% SUMMARY OUTPUT2.6047% 2.4447%
2.7199% 2.5599% Regression Statistics
-4.2365% -4.4465% Multiple R 0.620447
-23.1951% -23.4051% R Square 0.384955
6.1200% 5.8800% Adjusted R 0.340224
2.1689% 1.9389% Standard E 0.067615
-0.4097% -0.6497% Observatio 60
-8.8631% -9.1631%
-0.1641% -0.4541% ANOVA
-8.9601% -9.2301% df
9.4521% 9.1421% Regression 4
-2.3780% -2.6980% Residual 55
7.2650% 6.9150% Total 59
11.7530% 11.4130%
1.3904% 1.0204% Coefficients
-5.2039% -5.5639% Intercept -0.0249
-9.6439% -10.0739% MKTRF 1.913099
8/2/2019 Four Factors
http://slidepdf.com/reader/full/four-factors 22/37
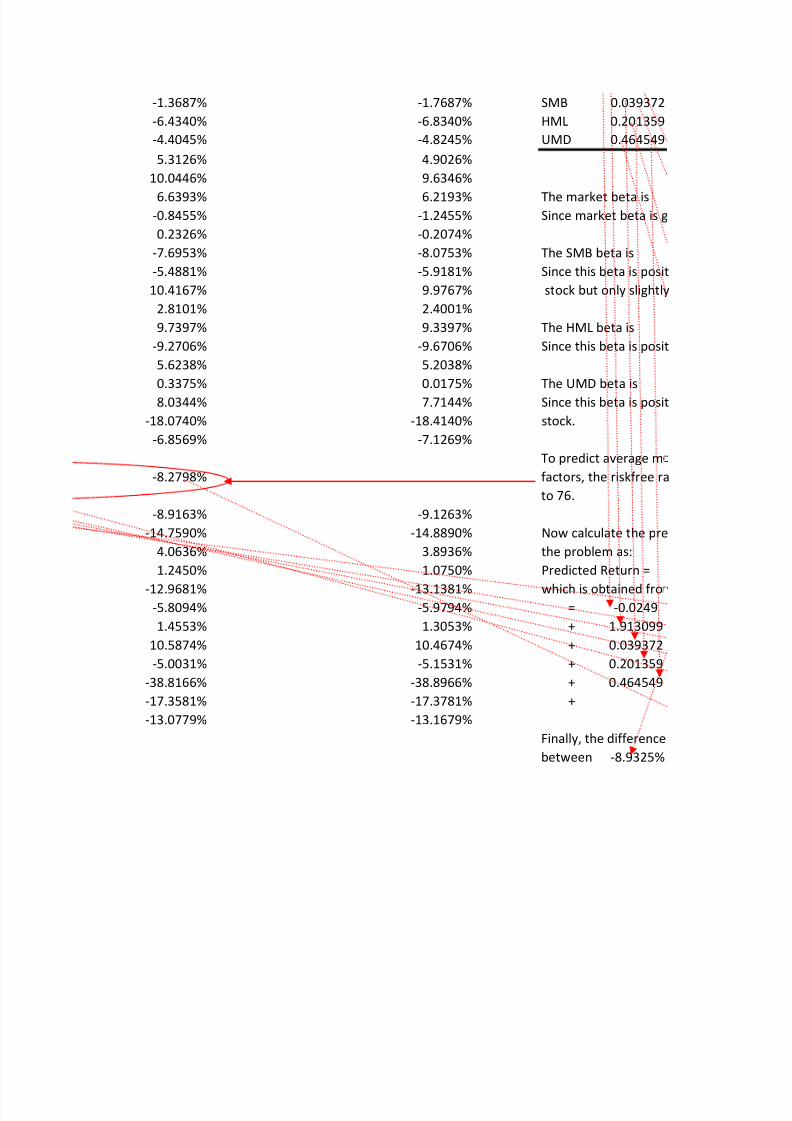
-1.3687% -1.7687% SMB 0.039372
-6.4340% -6.8340% HML 0.201359
-4.4045% -4.8245% UMD 0.464549
5.3126% 4.9026%
10.0446% 9.6346%
6.6393% 6.2193% The market beta is-0.8455% -1.2455% Since market beta is g
0.2326% -0.2074%
-7.6953% -8.0753% The SMB beta is
-5.4881% -5.9181% Since this beta is posit
10.4167% 9.9767% stock but only slightly
2.8101% 2.4001%
9.7397% 9.3397% The HML beta is
-9.2706% -9.6706% Since this beta is posit
5.6238% 5.2038%
0.3375% 0.0175% The UMD beta is
8.0344% 7.7144% Since this beta is posit
-18.0740% -18.4140% stock.
-6.8569% -7.1269%
To predict average m
-8.2798% factors, the riskfree ra
to 76.
-8.9163% -9.1263%
-14.7590% -14.8890% Now calculate the pre
4.0636% 3.8936% the problem as:
1.2450% 1.0750% Predicted Return =
-12.9681% -13.1381% which is obtained fro-5.8094% -5.9794% = -0.0249
1.4553% 1.3053% + 1.913099
10.5874% 10.4674% + 0.039372
-5.0031% -5.1531% + 0.201359
-38.8166% -38.8966% + 0.464549
-17.3581% -17.3781% +
-13.0779% -13.1679%
Finally, the difference
between -8.9325%

8/2/2019 Four Factors
http://slidepdf.com/reader/full/four-factors 23/37
our-factor analysis using Eastman Kodak stock returns.
Eastman Kodak is calculated in column L as column I minus column G.
n is regressed on the four-factors in columns C to F using
uts as shown below. Regression output follows.
SS MS F gnificance F
0.15738293 0.039346 8.606079 1.82E-05
0.25145194 0.004572
0.40883486
tandard Erro t Stat P-value Lower 95%Upper 95%ower 95.0 pper 95.0%
0.00958164 -2.5983 0.012001 -0.0441 -0.00569 -0.0441 -0.00569
0.40626981 4.708937 1.73E-05 1.098916 2.727282 1.098916 2.727282

8/2/2019 Four Factors
http://slidepdf.com/reader/full/four-factors 24/37
0.48412178 0.081327 0.935477 -0.93083 1.009574 -0.93083 1.009574
0.53979087 0.373032 0.710559 -0.88041 1.283124 -0.88041 1.283124
0.29815734 1.558068 0.124953 -0.13297 1.06207 -0.13297 1.06207
1.91309886reater than 1, this stock has more market risk than an average stock.
0.03937241
ive, the stock acts more like a small stock compared to an average
because beta is very close to 0.
0.20135916
ive, the stock acts like a value stock compared to an average stock.
0.46454932
ive, the stock return is more sensitive to momentum than an average
nthly return for 2008, calculate the average monthly values of the four
te, and the stock return. The values in row 63 are averages of rows 65
dicted average monthly return using the equation mentioned in
-8.9325%
the following calculation:
* -3.86%
* 0.62%
* 0.20%
* 1.60%
0.14%
between predicted return and the actual return is the difference
and -8.2798% which is 0.6528%
8/2/2019 Four Factors
http://slidepdf.com/reader/full/four-factors 25/37
Your Student ID DATE MKTRF SMB HML UMD RF
1153911 20030131 -2.44% 1.37% -0.84% 1.53% 0.10%
20030228 -1.63% -0.35% -1.54% 1.29% 0.09%
20030331 0.93% 0.88% -1.71% 1.50% 0.10%
20030430 8.18% 1.21% -0.08% -9.48% 0.10%
20030530 6.26% 4.71% 0.27% -10.79% 0.09%
20030630 1.53% 1.47% 0.64% -1.06% 0.10%20030731 2.24% 5.64% -2.11% -0.35% 0.07%
20030829 2.42% 2.64% 1.78% -0.55% 0.07%
20030930 -0.99% 0.56% 0.99% -0.07% 0.08%
20031031 5.96% 2.91% 1.75% 3.70% 0.07%
20031128 1.59% 2.22% 1.39% 1.63% 0.07%
20031231 4.47% -2.87% 2.76% -5.67% 0.08%
20040130 2.24% 2.60% 1.66% 2.58% 0.07%
20040227 1.49% -1.20% 0.37% -1.14% 0.06%
20040331 -1.16% 1.85% -0.01% 0.20% 0.09%
20040430 -2.50% -2.53% -1.69% -5.33% 0.08%
20040528 1.35% -0.12% -0.31% 1.64% 0.06%
20040630 2.08% 2.25% 1.72% 2.08% 0.08%
20040730 -3.87% -3.82% 4.42% -2.32% 0.10%
20040831 0.16% -1.56% 1.13% -1.54% 0.11%
20040930 1.95% 2.82% 0.40% 5.28% 0.11%
20041029 1.67% 0.49% -0.95% -1.54% 0.11%
20041130 4.67% 4.11% 1.96% 3.24% 0.15%
20041231 3.36% 0.18% -0.35% -2.82% 0.16%
20050131 -2.82% -1.67% 2.52% 3.12% 0.16%
20050228 2.11% -0.76% 2.85% 3.19% 0.16%
20050331 -1.90% -1.37% 1.71% 0.93% 0.21%20050429 -2.73% -3.95% -0.49% -0.84% 0.21%
20050531 3.55% 3.01% -1.16% 0.46% 0.24%
20050630 0.92% 2.58% 2.84% 2.10% 0.23%
20050729 4.09% 2.77% -0.47% 0.08% 0.24%
20050831 -0.89% -0.88% 1.44% 2.24% 0.30%
20050930 0.77% -0.65% 1.23% 3.51% 0.29%
20051031 -2.35% -1.05% -0.74% -1.37% 0.27%
20051130 3.73% 0.99% -1.75% 0.39% 0.31%
20051230 0.03% -0.47% 0.51% 0.77% 0.32%
20060131 3.66% 5.33% 1.18% 2.76% 0.35%
20060228 -0.50% -0.31% -0.76% -1.81% 0.34%
20060331 1.54% 3.51% 0.04% 1.22% 0.37%
20060428 0.94% -1.22% 3.07% 0.65% 0.36%
20060531 -3.53% -3.00% 2.75% -3.66% 0.43%
20060630 -0.44% -0.47% 1.51% 1.52% 0.40%
20060731 -0.59% -3.90% 3.25% -2.24% 0.40%
20060831 2.09% 0.80% -1.66% -3.48% 0.42%
20060929 1.54% -1.21% -0.49% -0.98% 0.41%

8/2/2019 Four Factors
http://slidepdf.com/reader/full/four-factors 26/37
20061031 3.30% 1.68% 0.49% -0.18% 0.41%
20061130 1.95% 0.70% 0.39% -1.00% 0.42%
20061229 0.68% -0.93% 2.56% 0.81% 0.40%
20070131 1.50% 0.02% 0.00% 0.22% 0.44%
20070228 -1.78% 1.38% 0.32% -1.32% 0.38%
20070330 0.86% -0.20% 0.31% 2.48% 0.43%
20070430 3.55% -2.06% -1.08% -0.14% 0.44%20070531 3.48% -0.05% -0.23% -0.33% 0.41%
20070629 -1.88% 0.69% -1.07% 0.40% 0.40%
20070731 -3.58% -2.74% -3.01% 2.80% 0.40%
20070831 0.74% -0.09% -2.42% 0.14% 0.42%
20070928 3.77% -2.47% -2.10% 4.64% 0.32%
20071031 2.26% 0.07% -1.97% 4.86% 0.32%
20071130 -5.27% -2.72% -0.88% 0.93% 0.34%
20071231 -0.70% 0.06% -0.02% 6.48% 0.27%
-3.86% 0.62% 0.20% 1.60% 0.14%
20080131 -6.44% -0.76% 3.13% -7.89% 0.21%
20080229 -2.33% -0.67% 0.04% 6.23% 0.13%
20080331 -1.22% 0.87% 0.26% 4.12% 0.17%
20080430 4.94% -1.60% 0.08% -0.38% 0.17%
20080530 2.21% 2.80% -0.30% 3.19% 0.17%
20080630 -8.03% 0.91% -0.93% 12.45% 0.17%
20080731 -1.46% 3.89% 3.57% -5.11% 0.15%
20080829 0.98% 3.66% 1.65% -3.82% 0.12%
20080930 -9.96% -0.20% 4.37% 0.36% 0.15%
20081031 -18.55% -2.05% -3.14% 7.91% 0.08%20081128 -8.54% -3.46% -5.09% 7.19% 0.02%
20081231 2.06% 4.04% -1.20% -5.04% 0.09%

8/2/2019 Four Factors
http://slidepdf.com/reader/full/four-factors 27/37
WALGREEN CO (WAG) TIVO INC (TIVO)
-0.6509% -0.7678%
-2.8362% 8.3172%
4.7619% -8.9286%
4.6811% 16.4706%
-0.1053% 51.5152%
-2.2410% 34.3333%-0.5980% -11.0835%
9.0011% 1.3953%
-5.9257% -32.0183%
13.6423% 8.7719%
5.8390% 3.2258%
-1.1682% -11.0577%
-5.0302% 45.2703%
3.3376% -0.6512%
-7.5995% -16.7603%
4.6434% -21.1474%
1.6622% 8.5592%
3.4276% -6.8331%
0.5247% -20.3103%
0.2816% -23.8938%
-1.7010% 53.9535%
0.1675% 1.5861%
6.5269% -29.9628%
0.4976% 24.6284%
11.0503% -31.6865%
0.6395% 0.0000%
3.7123% 28.9277%-3.0617% 8.8975%
5.4169% 19.8934%
1.4336% -1.0370%
4.0661% -6.4371%
-3.0610% -17.6000%
-6.2163% 6.4078%
4.5570% -11.6788%
0.6934% 11.1570%
-3.1086% -4.8327%
-2.2142% 7.6172%
3.8008% 0.7260%
-3.8564% 30.2703%
-2.7823% 14.7994%
-3.0169% -23.7349%
10.4434% 12.9542%
4.3265% -5.8741%
5.8946% 22.5854%
-10.2507% -8.0000%
8/2/2019 Four Factors
http://slidepdf.com/reader/full/four-factors 28/37
-1.5995% -15.8103%
-7.1257% -10.9546%
13.3366% -10.0176%
-1.2857% 4.4922%
-1.1534% 9.7196%
2.6622% 8.1772%
-4.3365% 0.9449%2.9784% -2.4961%
-3.5232% -7.3600%
1.4699% -5.0086%
2.2295% 2.3636%
4.8147% 12.7886%
-16.0669% 12.2835%
-7.4779% 5.0491%
4.0722% 11.3485%
-3.1014% 0.4359%
-7.9832% 5.1559%
4.4663% -1.0262%
4.3276% 0.9217%
-8.5062% -6.0502%
3.6298% 2.1871%
-9.7446% -26.6350%
5.6290% 24.4733%
6.4138% 10.1563%
-15.0151% -13.4752%
-17.7649% -6.2842%-2.3861% -26.8222%
-0.2829% 42.6295%

8/2/2019 Four Factors
http://slidepdf.com/reader/full/four-factors 29/37
SPSS INC (SPSS)
-23.3738% -0.75%
1.6791% -2.93%
3.8532% 4.66%
9.1873% 4.58%
25.5664% -0.20%
6.8943% -2.34%8.6197% -0.67%
5.7714% 8.93%
-11.4900% -6.01%
8.5359% 13.57%
5.6800% 5.77%
-7.5969% -1.25%
18.0090% -5.10%
-3.0806% 3.28%
-10.0245% -7.69%
-22.7174% 4.56%
17.0886% 1.60%
7.9279% 3.35%
-17.6405% 0.42%
-6.7568% 0.17%
-3.4058% -1.81%
1.3503% 0.06%
18.3568% 6.38%
-2.1889% 0.34% SUMMARY OUTPUT
1.9821% 10.89%
21.6301% 0.48% Regression Statistics
-10.3608% 3.50% Multiple R 0.253890413-7.4756% -3.27% R Square 0.064460342
8.6389% 5.18% Adjusted R Square -0.003578906
9.8970% 1.20% Standard Error 0.055280151
2.2384% 3.83% Observations 60
10.9980% -3.36%
10.0917% -6.51% ANOVA
-5.0000% 4.29% df
26.6667% 0.38% Regression 4
7.0983% -3.43% Residual 55
4.2354% -2.56% Total 59
1.2407% 3.46%
-3.0024% -4.23% Coefficients
10.1074% -3.14% Intercept -0.001565559
6.1388% -3.45% MKTRF 0.346118667
-13.1351% 10.04% SMB -0.01862182
-15.8992% 3.93% HML 0.667663422
-6.1413% 5.47% UMD 0.019773085
-1.7343% -10.66%

8/2/2019 Four Factors
http://slidepdf.com/reader/full/four-factors 30/37
10.9908% -2.01%
1.9516% -7.55%
6.5934% 12.94%
3.1593% -1.73%
11.4442% -1.53%
4.4258% 2.23%
1.5513% -4.78%20.0491% 2.57%
0.2954% -3.92%
-7.0231% 1.07%
-0.7066% 1.81%
0.9571% 4.49%
-7.6325% -16.39%
-4.8947% -7.82%
-0.6364% 3.80%
-1.8770%
WAG
-7.9644% Predicted return -1.20144%
15.0681% Difference -1.89994%
1.9721%
8.9221% TIVO
-6.7945% Predicted return -5.16008%
-7.6200% Difference 5.59598%
-9.1284%
-4.4478% SPSS
-7.0298% Predicted return -5.77946%
-20.4360% Difference 3.90244%4.6233%
10.3110%
8/2/2019 Four Factors
http://slidepdf.com/reader/full/four-factors 31/37
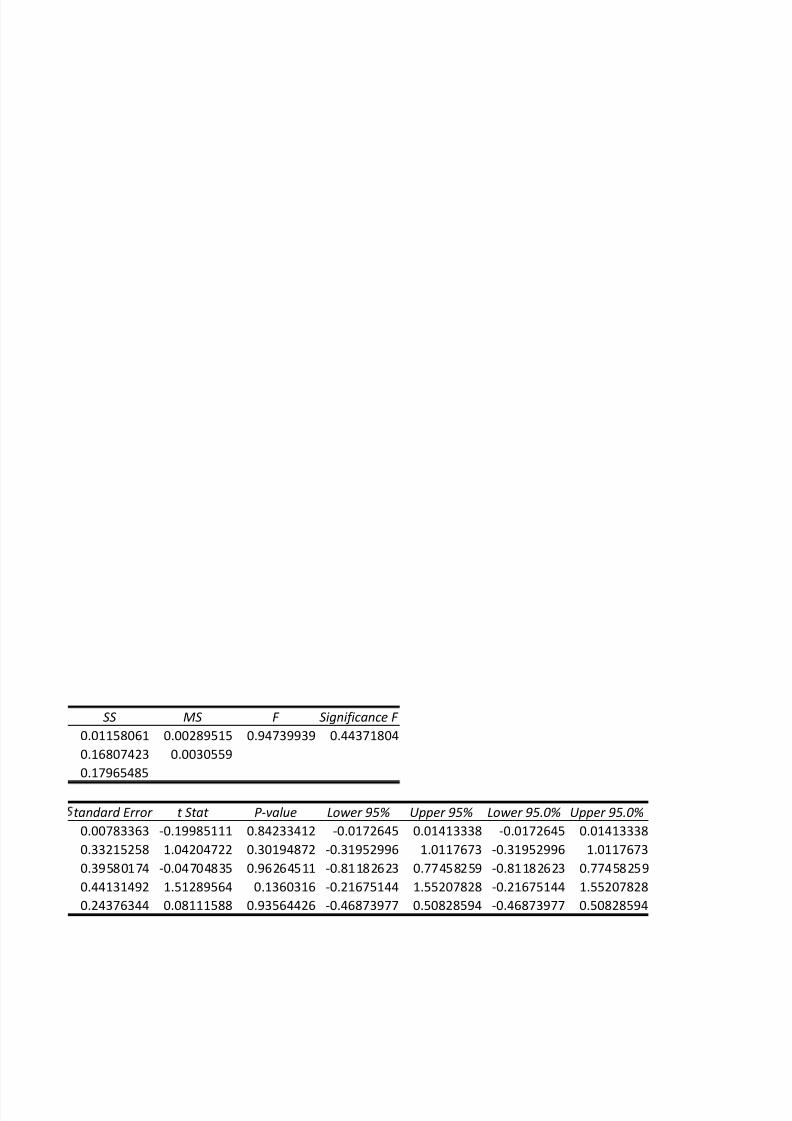
SS MS F Significance F
0.01158061 0.00289515 0.94739939 0.44371804
0.16807423 0.0030559
0.17965485
tandard Error t Stat P-value Lower 95% Upper 95% Lower 95.0% Upper 95.0%
0.00783363 -0.19985111 0.84233412 -0.0172645 0.01413338 -0.0172645 0.01413338
0.33215258 1.04204722 0.30194872 -0.31952996 1.0117673 -0.31952996 1.0117673
0.39580174 -0.04704835 0.96264511 -0.81182623 0.77458259 -0.81182623 0.77458259
0.44131492 1.51289564 0.1360316 -0.21675144 1.55207828 -0.21675144 1.55207828
0.24376344 0.08111588 0.93564426 -0.46873977 0.50828594 -0.46873977 0.50828594

8/2/2019 Four Factors
http://slidepdf.com/reader/full/four-factors 32/37

8/2/2019 Four Factors
http://slidepdf.com/reader/full/four-factors 33/37
SUMMARY OUTPUT
Regression Statistics
Multiple R 0.3988992R Square 0.15912057
Adjusted R Sq 0.0979657
Standard Erro 0.17626122
Observations 60
ANOVA
df SS MS F Significance F
Regression 4 0.32334699 0.08083675 2.60192815 0.04577432
Residual 55 1.70874095 0.03106802
Total 59 2.03208795
Coefficients tandard Error t Stat P-value Lower 95%
Intercept 0.00631267 0.02497759 0.25273327 0.80141654 -0.04374354
MKTRF 1.72117246 1.05907123 1.62517158 0.1098434 -0.4012537
SMB 1.33352558 1.26201711 1.05666204 0.29528515 -1.19561322
HML -1.61552234 1.40713627 -1.14809232 0.25589962 -4.43548643
UMD 0.13882223 0.77724175 0.17860882 0.85890117 -1.41880504

8/2/2019 Four Factors
http://slidepdf.com/reader/full/four-factors 34/37
SUMMARY OUTPUT
Regression Statistics
Multiple R 0.59140495
R Square 0.34975982
Adjusted R Sq 0.30246962Standard Erro 0.08974975
Observations 60
ANOVA
df SS MS F Significance F
Regression 4 0.23830068 0.05957517 7.39603242 7.684E-05
Residual 55 0.44302596 0.00805502
Total 59 0.68132664
Coefficients tandard Error t Stat P-value Lower 95%
Intercept -0.00440189 0.01271824 -0.34610842 0.73058176 -0.02988981
MKTRF 1.77791001 0.53926427 3.29691789 0.00171636 0.69720028
SMB 0.98293003 0.64260148 1.5296106 0.13184473 -0.3048721
HML 0.82687398 0.71649412 1.15405549 0.25346757 -0.60901233
UMD 0.38346361 0.39576064 0.96892811 0.33682278 -0.40965843
8/2/2019 Four Factors
http://slidepdf.com/reader/full/four-factors 35/37
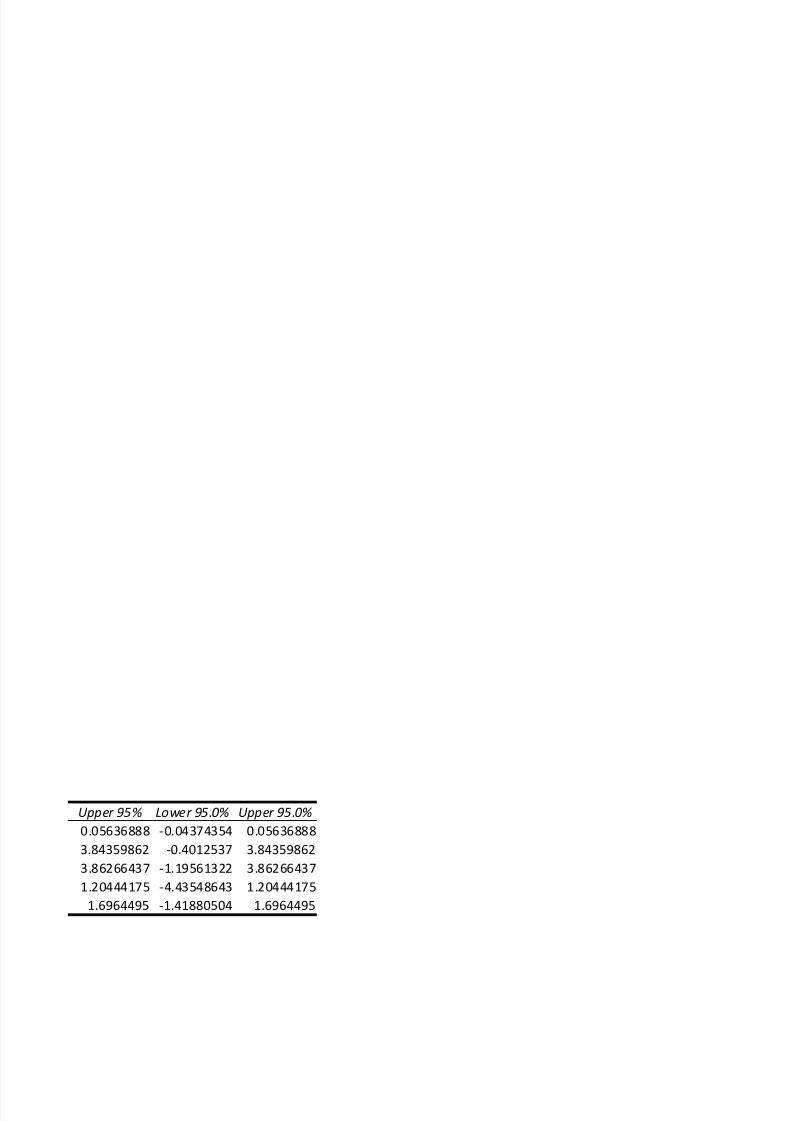
Upper 95% Lower 95.0% Upper 95.0%
0.05636888 -0.04374354 0.05636888
3.84359862 -0.4012537 3.84359862
3.86266437 -1.19561322 3.86266437
1.20444175 -4.43548643 1.20444175
1.6964495 -1.41880504 1.6964495

8/2/2019 Four Factors
http://slidepdf.com/reader/full/four-factors 36/37
Upper 95% Lower 95.0% Upper 95.0%
0.02108603 -0.02988981 0.02108603
2.85861975 0.69720028 2.85861975
2.27073216 -0.3048721 2.27073216
2.26276028 -0.60901233 2.26276028
1.17658564 -0.40965843 1.17658564
8/2/2019 Four Factors
http://slidepdf.com/reader/full/four-factors 37/37
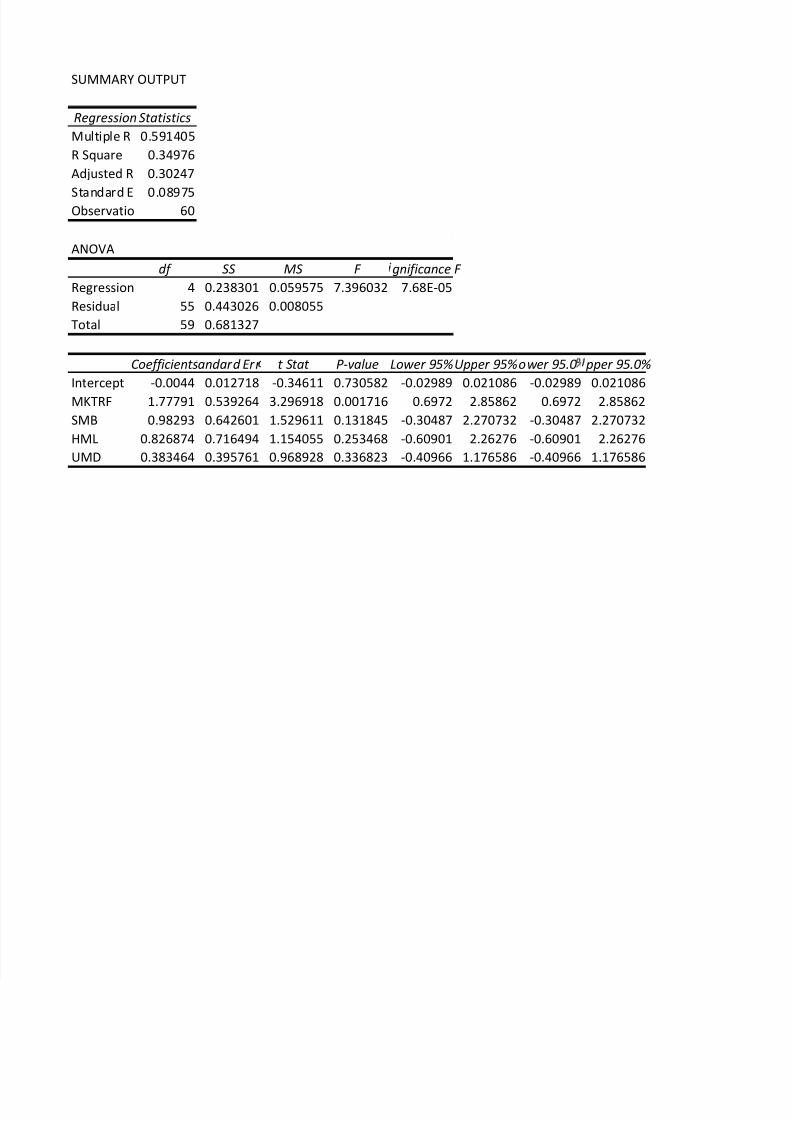
SUMMARY OUTPUT
Regression Statistics
Multiple R 0.591405
R Square 0.34976
Adjusted R 0.30247
Standard E 0.08975Observatio 60
ANOVA
df SS MS F gnificance F
Regression 4 0.238301 0.059575 7.396032 7.68E-05
Residual 55 0.443026 0.008055
Total 59 0.681327
Coefficientsandard Err t Stat P-value Lower 95%Upper 95%ower 95.0 pper 95.0%
Intercept -0.0044 0.012718 -0.34611 0.730582 -0.02989 0.021086 -0.02989 0.021086
MKTRF 1.77791 0.539264 3.296918 0.001716 0.6972 2.85862 0.6972 2.85862
SMB 0.98293 0.642601 1.529611 0.131845 -0.30487 2.270732 -0.30487 2.270732
HML 0.826874 0.716494 1.154055 0.253468 -0.60901 2.26276 -0.60901 2.26276
UMD 0.383464 0.395761 0.968928 0.336823 -0.40966 1.176586 -0.40966 1.176586


