32
HEALTHCARE ANALYTICS Four ways data is improving healthcare operations
| Date post: | 10-Apr-2017 |
| Category: |
Healthcare |
| Upload: | tableau-software |
| View: | 648 times |
| Download: | 1 times |
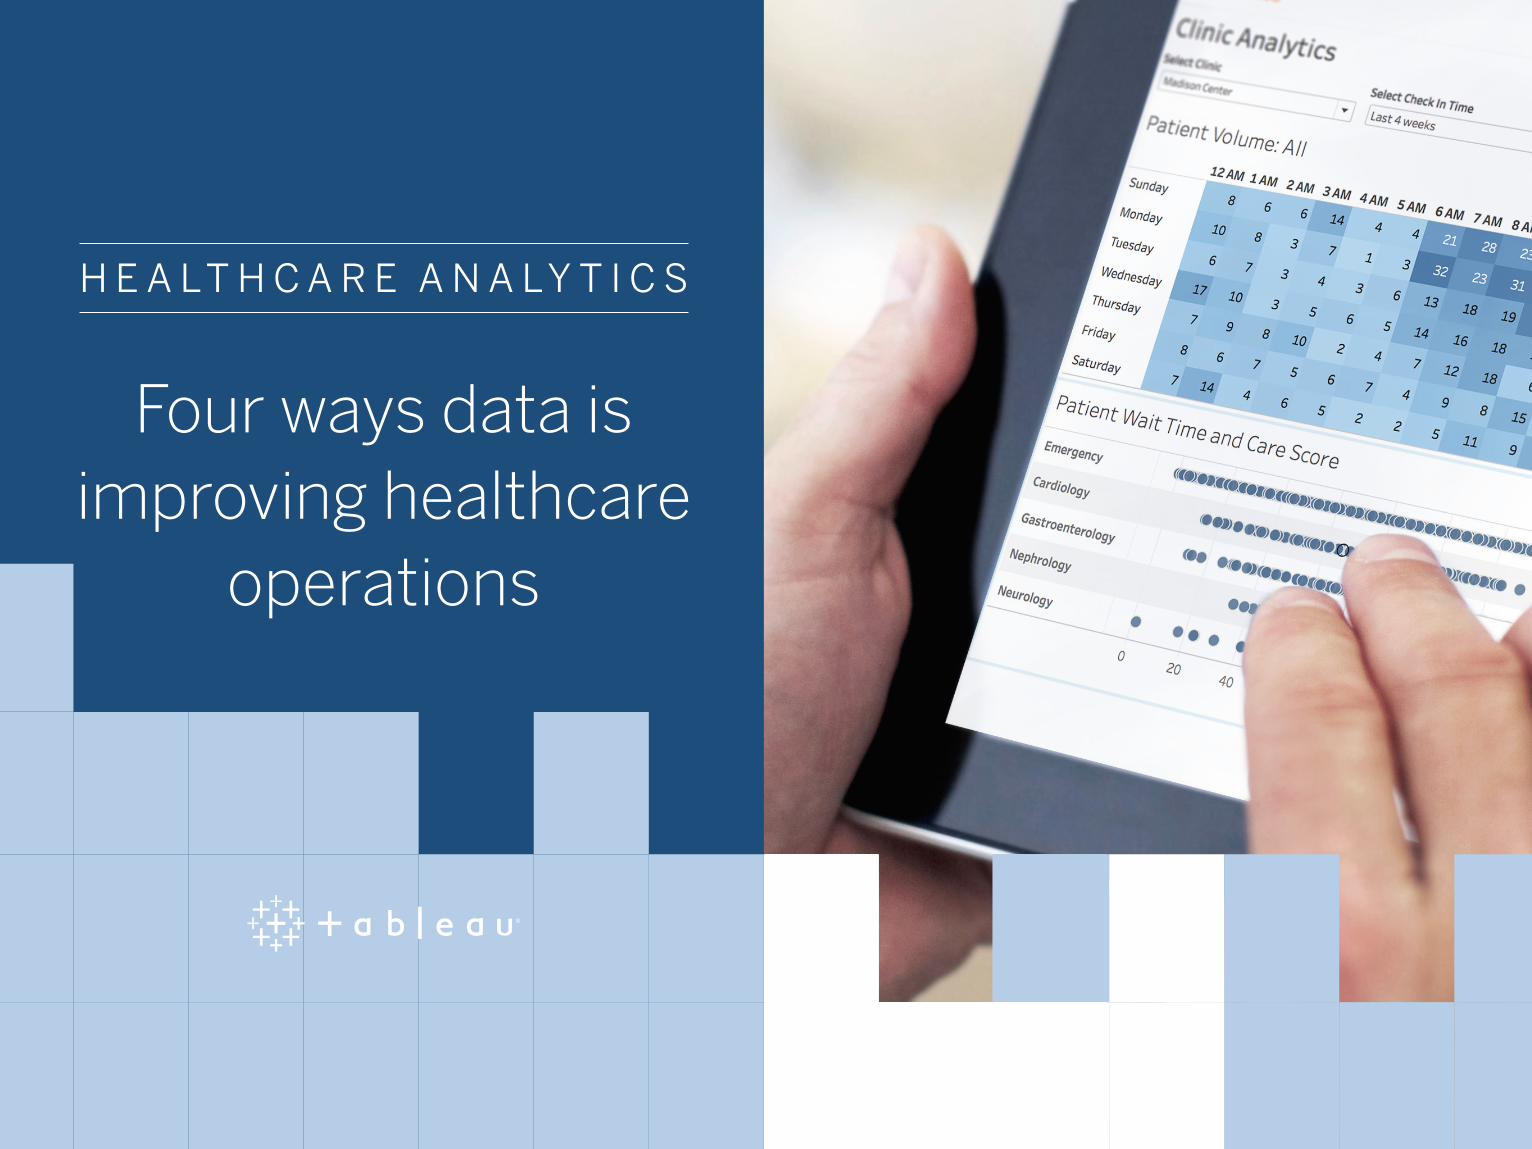
H E A LT H C A R E A N A LY T I C S
Four ways data is improving healthcare
operations

Lower cost, better careMore than ever, the healthcare industry is challenged with corralling and
understanding massive amounts of data to drive operational efficiencies,
and better patient outcomes.
As healthcare providers adopt new practices to align with the value-based
care paradigm and enterprise business objectives alike, they are critically
challenged with implementing repeatable processes to improve supply
chain efficiency, revenue cycle management, and clinical productivity.

H E A LT H C A R E A N A LY T I C S
Four ways data is improving healthcare
operations
1 Enabling population health management
with self-service analytics
2 Increasing productivity with real-time
analytics
3 Aggregating and blending data to
uncover inefficiencies in the supply chain
4 Automating ad hoc visual analysis for
better revenue cycle management

Enabling population health management with self-service analytics
Self-service analytics empowers individual
healthcare employees, and the enterprise alike, to
see and understand data across every system—
operational, financial, and clinical.
With direct access and the ability to explore
population-risk stratification data, any healthcare
worker can monitor, measure, and understand
the risk and financial implications of his or her
treatment protocols and decisions on a per-
patient basis.
1

The biggest problem is not: How do we get more data? It’s: How do we take the data that we have, and be able to simplify it to a point at which someone that’s nontechnical—like a lot of the physicians, or executives, or hospital managers—can easily understand where they are, and move in a common direction? We have about a thousand users a day on average, and it’s saved us a lot of money in analysts, time, and resources.
- David Delafield, CFO of Swedish Medical Group, Swedish Medical Center
Providence Health, a 34-hospital network, has tons of data, hundreds of
disconnected systems, and thousands of disjointed reports. In order to
successfully move to new value-based model standards, Providence needed
to simultaneously streamline operational reporting and improve clinical
productivity.
Providence integrated an enterprise self-service analytics platform,
internally named Vantage, to allow anyone in the organization to monitor,
analyze, and improve any related clinical outcome with data.

Vantage empowers people to find insights and track financial and clinical
KPIs. People can track each region’s quality of care and spending at both
the provider level as well as on a physician scorecard.
More than 26,000 Providence employees adopted Vantage in the very first
year, and the results are actually saving lives.

For example, Swedish Medical Group, an acquisition of Providence Health,
drove a massive cancer screening effort with Vantage. Using interactive
dashboards, clinic employees could quickly identify the patients overdue
for their screenings, then, send patients reminders without leaving the
platform.
This effort alone has increased the colon, colorectal, and breast cancer
screening composite metric for this population from 30% to 62%.

Here are examples of cancer-screening data visualizations. The data is segmented to identify patients at risk for specific kinds of cancer within a certain population, and it is used to monitor the need for proactive intervention.

The cancer screening metric and our patient detail reporting has enabled better patience care. We are really saving lives with our data.
- Kim Womack, Clinic Administrator, Swedish Medical Group

Increasing productivity with real-time analytics
Responding to fire drills is a fact of life for
healthcare workers. Whether data is from this
year, this week, or a few minutes ago, there’s no
doubt about it, reliable data that is within the
right timeline for a hospital’s needs, will elevate
operational efficiency.
In order to drive decisions at the speed of
business, data must be current. Proactive
healthcare organizations are turning to right-
time data feeds to improve decision-making, and
track costs and outcomes as they go.
2

We had more than 100 physicians and mid-level extenders, and we needed to reorganize their entire day. We had them basically spread out doing many different things, creating some inefficiencies.
- Mark Jackson, Piedmont Healthcare

Piedmont Healthcare, a five-hospital nonprofit
healthcare system with more than 1,600 medical
employees and affiliate physicians, lacked a
productive scheduling system and struggled
with declining labor productivity
Accessing right-time data has helped Piedmont
Healthcare reorganize schedules and pivot.
Watch this video to learn what Piedmont Healthcare is doing to improve operations with data.

“We were able to cut out a third-party physician-consulting service and
some additional third-party work that was being done on the weekends.
That, in total, saved us a little over $2 million a year,” Jackson says.
Standardization of staffing with real-time data allowed physicians to focus
their attention on one patient-centered activity at a time. Piedmont has
seen a 50-percent improvement in its variance from benchmark lengths of
stay, and a 10 percent reduction in readmissions.

This labor productivity dashboard at Piedmont Healthcare tracks productivity, the FTE variance, and agency spend across hospitals and departments.

Aggregating and blending data to uncover inefficiencies in the supply chain
Healthcare organizations accumulate massive
amounts of data that’s stored in silos across the
entire enterprise. These silos make it difficult
to spot savings opportunities in the thousands
of daily supply chains. Connecting these
islands of information is key to understanding
the big picture and making smarter buying
decisions. The ability to aggregate and blend
data on a common field is key.
3

We’ve drastically reduced the annual total number of rushed special orders, and our fill rates—inventory fulfilled or available against orders—are in excess of 98 percent with zero excess, expired, or obsolete supplies.
- Jason Klein, Supply Chain Analyst, Seattle Children’s Hospital

From drugs and medical devices to equipment and business assets,
hospitals have huge inventories to manage. With data disjointed, and
supply and demand for thousands of different items always in flux,
decision-makers are prone to wild and inefficient purchasing (known as
maverick-buying) outside of the standard processes.
Dashboards created with data from multiple sources will generate more
truthful visuals and offer 360-degree assessments of supply chains in
specific areas like operating rooms and emergency departments.
After connecting to all of the supply chain data—strategic sourcing, spend,
procurement, and inventory—healthcare providers can easily spot outliers,
surpluses, expired drugs, and potential stockouts without second-guessing
their decisions or wasting money.
Barnes-Jewish Healthcare (BJC), an 11- hospital network with more than
1,300 beds, lacked visibility into its own inventory supply chain strategy.
BJC had one single employee performing supply-chain analysis in Excel.
Without a fast and easy way to identify cost savings opportunities, the
approach was costing BJC millions in time and money.

By aggregating and visualizing all of the data, BJC reduced supply-chain
spending by more than $200 million over four years. By identifying rogue-
buying patterns, BJC found $1.9 million annual savings across five major
spine-supply vendors, and $560,000 annual reduction in medical-device
costs for cardiac supplies.

This spend summary identifies opportunities for rationalizing suppliers at the SKU level to enable strategic sourcing and minimize maverick buying for hospitals and departments.
BJC uses a centralized dashboard to monitor, track and improve performance
against targeted supply chain cost savings annually.

Every one-percent reduction in supply spending is equal to hiring 500 full-time equivalent caregivers. With our Supply Plus Initiative and data visualization, BJC Healthcare has saved $212 million on supply chain spending over the past four years.
- Lynn Kersting, Strategic Supply Chain Manager

Automating ad hoc visual analysis for better revenue cycle management
Spreadsheets are the wrong tool for ad hoc
financial reporting in healthcare. Too often,
mistakes are made at the expense of efficiency,
accuracy, and even thousands of hours of lost
time.
Augmenting financial analysis with automated
data visualization can take a four- hour process
involving many tools and high-level expertise
and turn it into a four- second query.
4

Personally, I can say I’ve increased my efficiency probably 80 to 90 percent—and that’s just time to initial insight. And I can fully automate that insight going forward.
- Mark Jackson, Piedmont Healthcare
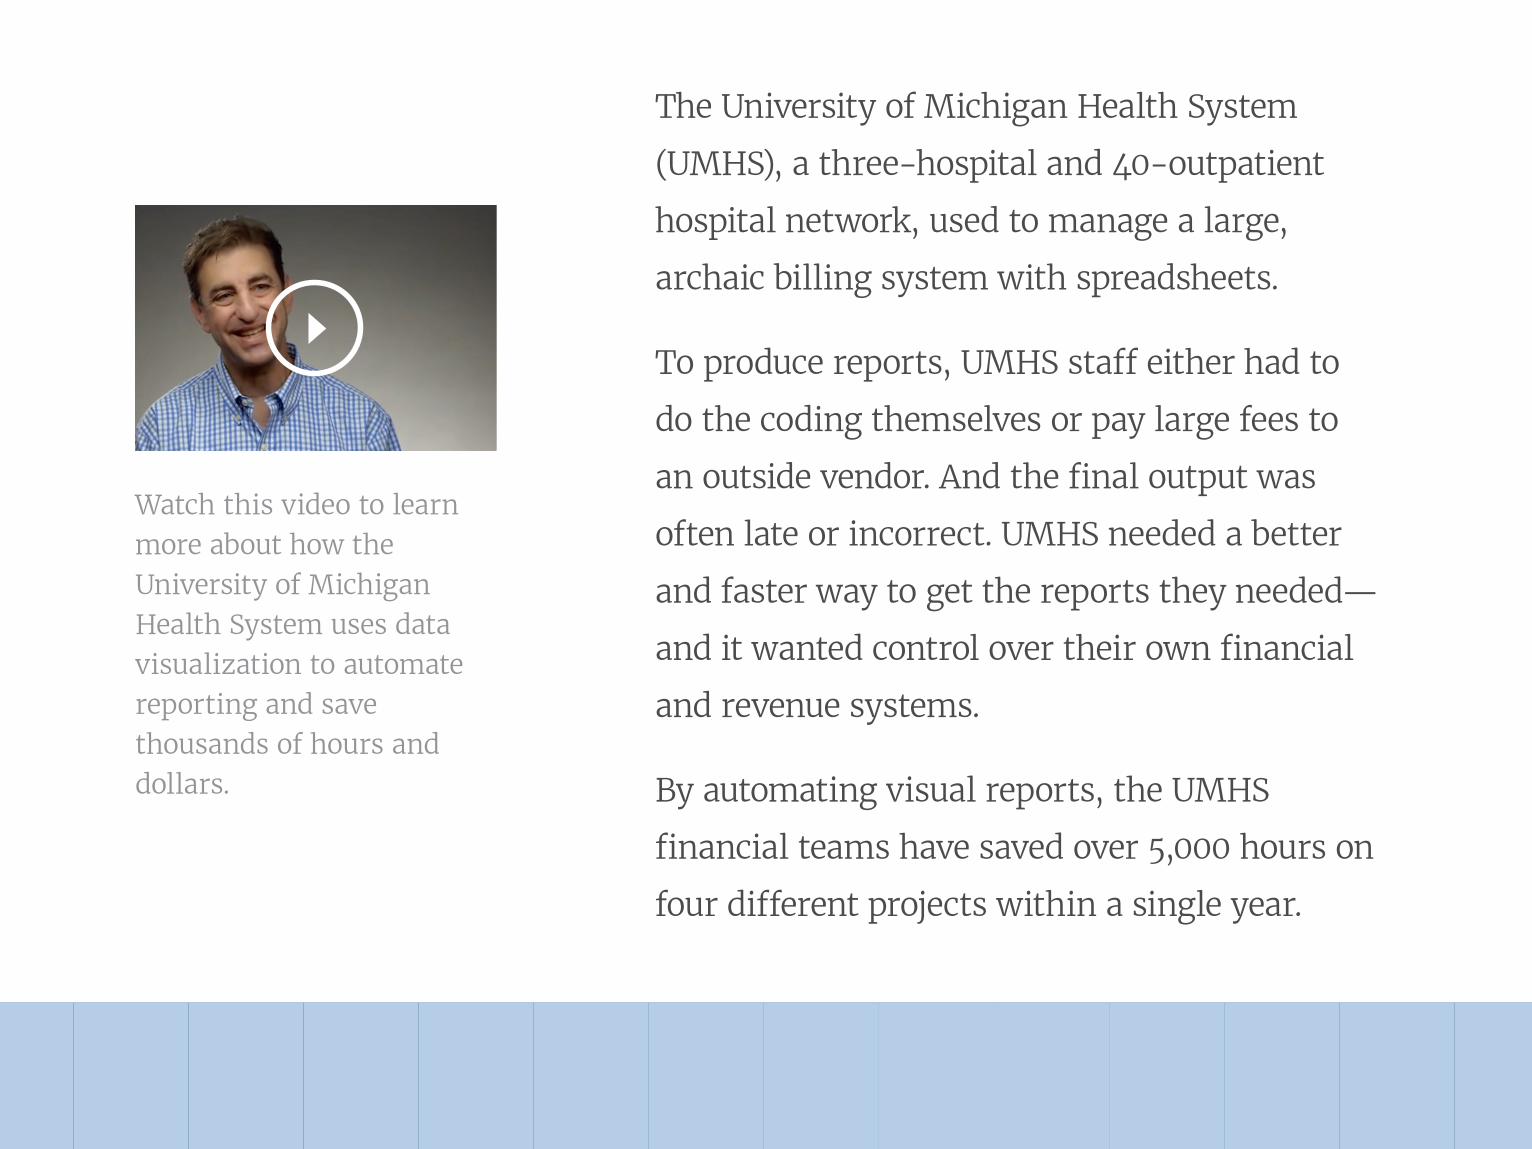
The University of Michigan Health System
(UMHS), a three-hospital and 40-outpatient
hospital network, used to manage a large,
archaic billing system with spreadsheets.
To produce reports, UMHS staff either had to
do the coding themselves or pay large fees to
an outside vendor. And the final output was
often late or incorrect. UMHS needed a better
and faster way to get the reports they needed—
and it wanted control over their own financial
and revenue systems.
By automating visual reports, the UMHS
financial teams have saved over 5,000 hours on
four different projects within a single year.
Watch this video to learn more about how the University of Michigan Health System uses data visualization to automate reporting and save thousands of hours and dollars.

Data visualization allows us to quickly automate processes that used to take thousands, literally thousands of hours, into seconds.
- Jonathan Greenberg, IT Director, UMHS

Successfully adopting the Accountable Care Organizations (ACO) model,
complying with new healthcare-industry mandates, and maximizing
reimbursements all requires operational excellence.
Monitoring, measuring, and analyzing data to improve patient safety, care
quality, operational costs, and compliance is easier than you think. And
integrating self-service data visualization into your healthcare operations
and processes is even easier.

Overall, Tableau has helped us capture efficiencies and process improvements that we estimate to be valued at tens of millions of dollars.
- David Delafield, CFO of Swedish Medical Group

About Tableau
Tableau helps people see and understand their healthcare data no matter
how big it is, or how many systems it is stored in. Quickly connect to
any data, analyze, and share insights to reveal hidden opportunities
that impact each patient, and your entire organization. With a seamless
experience from the PC to the iPad, ask and answer deeper operational
questions with expressive, interactive dashboards—no programming skills
required. Start your free trial today.
TABLEAU.COM/TRIAL

The way Tableau approaches data, and visualizing data, is the way my mind works. What it lets me do is really move at the speed that I can think about things.
- Jonathan Drummey, Quality Management Data Analyst, Southern Maine Medical Center

About the author
Andy Dé is the industry strategist
and solutions leader for healthcare
and life sciences at Tableau. He has
more than 20 years of enterprise
software innovation strategy, portfolio
management and go-to-market
strategy, planning and execution
experience at GE Healthcare, SAP
Health-Sciences and i2.
Andy Dé
Global Industry Director, Healthcare and Life Sciences, Tableau


