1 FOURIER TRANSFORM MASS SPECTROMETRY https://goo.gl/Vx3oGW FT-ICR Theory – Ion Cyclotron Motion • Inward directed Lorentz force causes ions to move in circular orbits about the magnetic field axis Alan G. Marshall, Christopher L. Hendrickson, and George S. Jackson Encyclopedia of Analytical Chemistry, R.A. Meyers (Ed.), John Wiley & Sons Ltd, Chichester, 2000, pp. 11694–11728
Transcript
1
FOURIER TRANSFORM MASS SPECTROMETRY
https://goo.gl/Vx3oGW
FT-ICR Theory – Ion Cyclotron Motion
• Inward directed Lorentz force causes ions to move in circular orbits about the magnetic field axis
Alan G. Marshall, Christopher L. Hendrickson, and George S. Jackson Encyclopedia of Analytical Chemistry, R.A. Meyers (Ed.), John Wiley & Sons Ltd, Chichester, 2000, pp. 11694–11728
2
Ion cyclotron motion. Ions rotate in a plane perpendicular to the direction of a spatially uniform magnetic field,
Note that positive and negative ions orbit in opposite senses.
FT-ICR Theory – Ion Cyclotron Motion
X
Y
Z
c=qBm
FT-ICR TheoryFT-ICR Theory – Ion Cyclotron Motion
3
Once we make an ion, we move it into the center of the Magnet.
Then, we trap it before it can escape.
ION+
Electrostatic Barrier
From Primer 1998 Marshall.
Once we make an ion, we move it into the center of the Magnet.
Then, we trap it before it can escape.
ION+
Electrostatic Barrier
Ion sees barrierand is turned back
From Primer 1998 Marshall.
4
Once we make an ion, we move it into the center of the Magnet.
Then, we trap it before it can escape.
ION+
Electrostatic Barrier
“Gate” shut before the ion escapes
From Primer 1998 Marshall.
Once we make an ion, we move it into the center of the Magnet.
Then, we trap it before it can escape.
+ION
Ion is now trapped in the magnet.
From Primer 1998 Marshall.
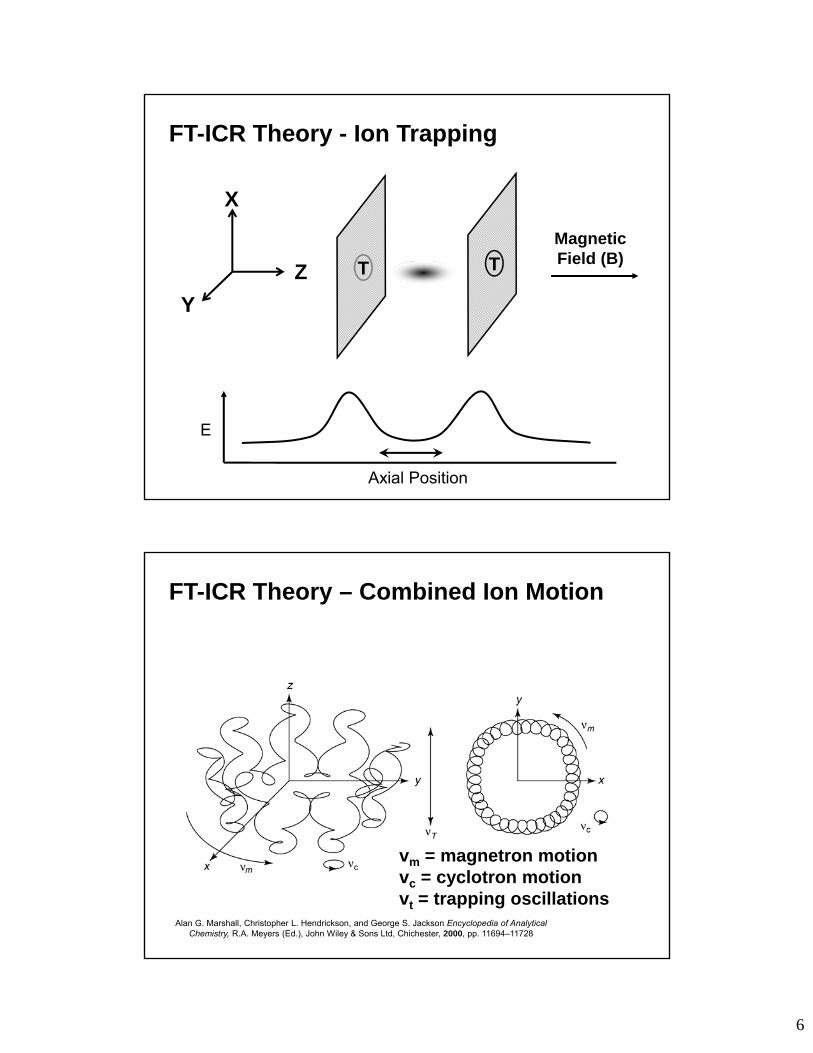
5
T T
Magnetic Field (B)
X
Y
Z
E
Axial Position
FT-ICR Theory - Ion Trapping
T T
Magnetic Field (B)
X
Y
Z
E
Axial Position
FT-ICR Theory - Ion Trapping
6
T T
Magnetic Field (B)
X
Y
Z
E
Axial Position
FT-ICR Theory - Ion Trapping
vm = magnetron motionvc = cyclotron motionvt = trapping oscillations
Alan G. Marshall, Christopher L. Hendrickson, and George S. Jackson Encyclopedia of Analytical Chemistry, R.A. Meyers (Ed.), John Wiley & Sons Ltd, Chichester, 2000, pp. 11694–11728
FT-ICR Theory – Combined Ion Motion
7
Time (ms)
8007006005004003002001000
Imag
e
0.05
0.04
0.03
0.02
0.01
0
-0.01
-0.02
-0.03
-0.04
-0.05
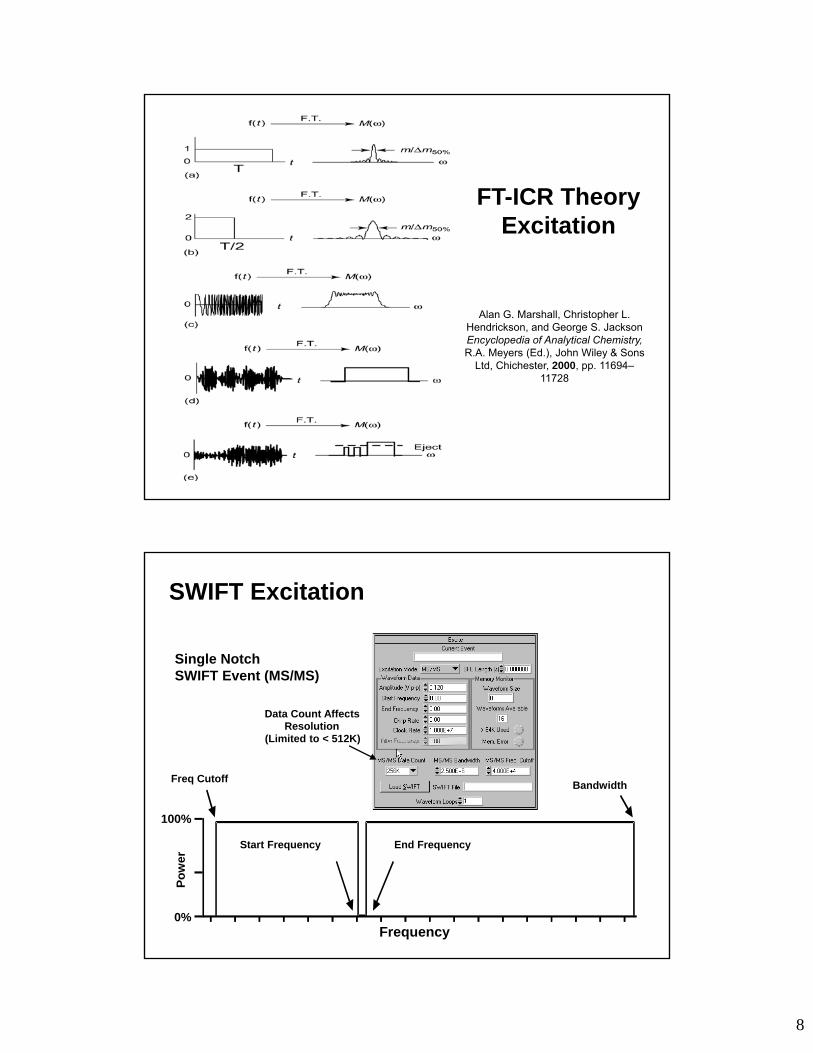
FT-ICR Theory - Excitation
FT-ICR Theory - Excitation
X
Y
Z or Bo
Time
Am
pli
tud
e
Excitation Electrodes
8
FT-ICR Theory Excitation
Alan G. Marshall, Christopher L. Hendrickson, and George S. Jackson Encyclopedia of Analytical Chemistry, R.A. Meyers (Ed.), John Wiley & Sons
Number of IonsTrapped Ion Upper Mass Limit 2D-FT Resolving PowerIon Trapping TimeIon Energy
34.7
7 9.411.5
15
25
0 5 10 15 20 25
3 4.7 7 9.411.5
15
25
Effect of Magnetic Field Strength
Field Strength (Tesla)
FT-ICR Experiment - Event Sequences
- Use a single mass analyzer but separate the mass analysis and ion isolation events in time
- Can perform many successive stages of MS (MSn)
Event Sequence
Ionization
Ion Transfer / Ion Trapping
Parent Ion Isolation
Parent Ion Fragmentation
Daughter Ion Detection
15
(m/z)max(m/z)minm/z
Peak Capacity =m50%
(m/z)max - (m/z)min
m50%
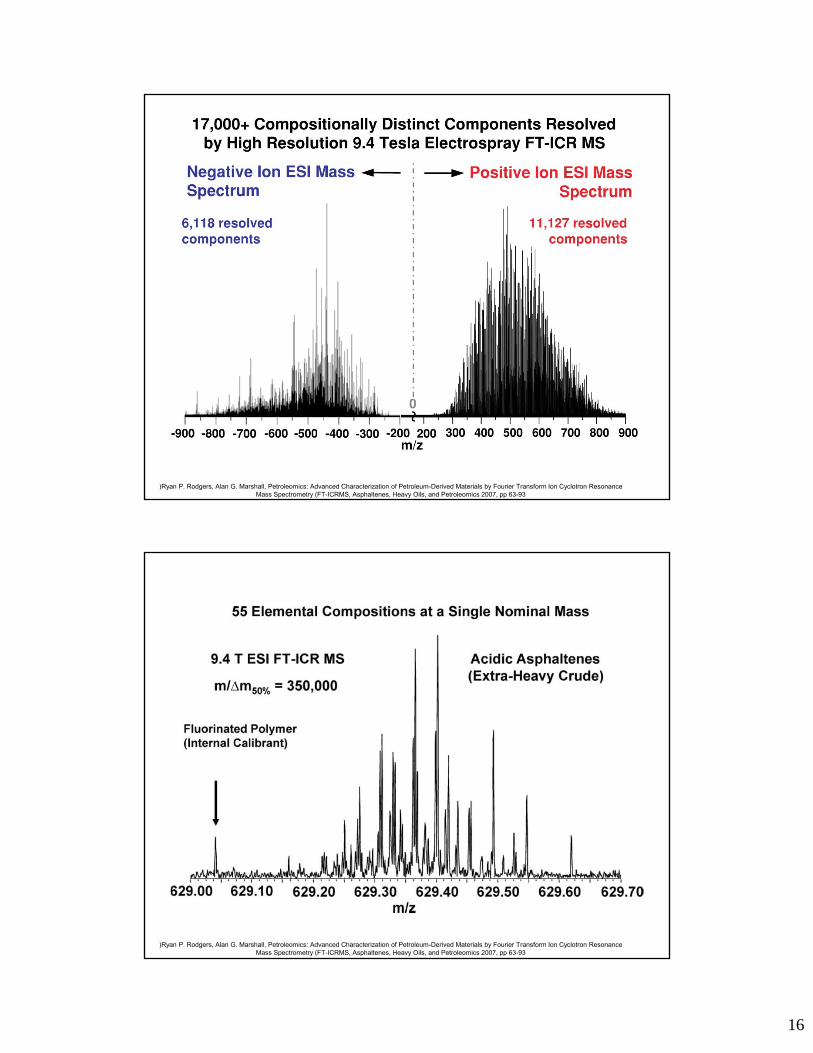
Ultra-high Resolving Power
Separation Method
Maximum # of Components
MaximumPeak Capacity
TheoreticalPlates
HP-TLC 6 25 1,000
Isocratic LC 12 100 15,000
Gradient LC 17 200 60,000
HPLC 37 1,000 1,500,000
CE 37 1,000 1,500,000
Open Tubular GC 37 1,000 1,500,000
ESI FT-ICR MS 525 200,000 60,000,000,000
m/m50% > 200,000
200 < m/z < 1,000maverage +/- 0.25 Da Skip Prior Chemical Separation
and Identify Components by MS!
16
)Ryan P. Rodgers, Alan G. Marshall, Petroleomics: Advanced Characterization of Petroleum-Derived Materials by Fourier Transform Ion Cyclotron Resonance Mass Spectrometry (FT-ICRMS, Asphaltenes, Heavy Oils, and Petroleomics 2007, pp 63-93
)Ryan P. Rodgers, Alan G. Marshall, Petroleomics: Advanced Characterization of Petroleum-Derived Materials by Fourier Transform Ion Cyclotron Resonance Mass Spectrometry (FT-ICRMS, Asphaltenes, Heavy Oils, and Petroleomics 2007, pp 63-93
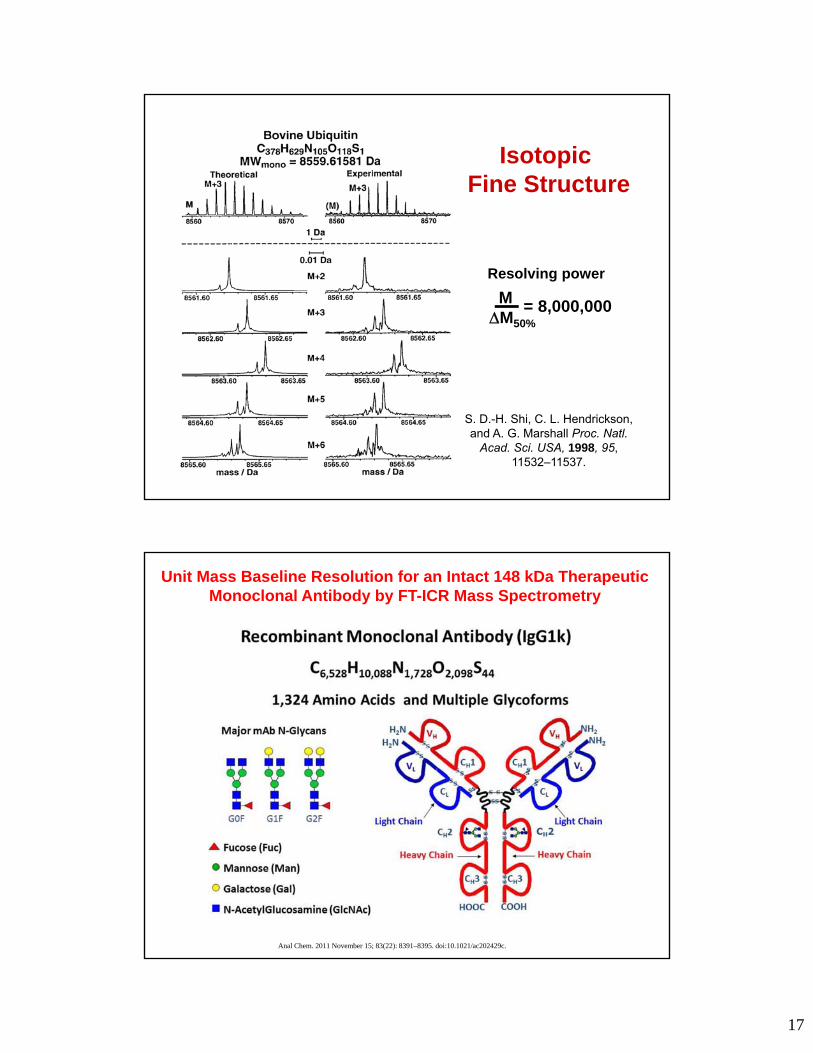
17
S. D.-H. Shi, C. L. Hendrickson, and A. G. Marshall Proc. Natl.
Acad. Sci. USA, 1998, 95, 11532–11537.
Isotopic Fine Structure
Resolving power
M M50%
= 8,000,000
Anal Chem. 2011 November 15; 83(22): 8391–8395. doi:10.1021/ac202429c.
Unit Mass Baseline Resolution for an Intact 148 kDa Therapeutic Monoclonal Antibody by FT-ICR Mass Spectrometry
18
Anal Chem. 2011 November 15; 83(22): 8391–8395. doi:10.1021/ac202429c.
Unit Mass Baseline Resolution for an Intact 148 kDa Therapeutic Monoclonal Antibody by FT-ICR Mass Spectrometry
Anal Chem. 2011 November 15; 83(22): 8391–8395. doi:10.1021/ac202429c.
Unit Mass Baseline Resolution for an Intact 148 kDa Therapeutic Monoclonal Antibody by FT-ICR Mass Spectrometry
19
J. Am. Soc. Mass Spectrom. (2015) 26:1626Y1632
Single-scan electrospray FT-ICR mass spectrum of the isolated 48+ charge state of bovine serum albumin
Principle of Trapping in the Orbitrap
Orbital trapsKingdon (1923)
• The Orbitrap is an ion trap – but there are no RF or magnet fields!
• Moving ions are trapped around an electrode
- Electrostatic attraction is compensated by centrifugal force arising from the initial tangential velocity
• Potential barriers created by end-electrodes confine the ions axially
• One can control the frequencies of oscillations (especially the axial ones) by shaping the electrodes appropriately
• Thus we arrive at …
20
Orbitrap - Electrostatic Field Based Mass Analyser
• Only an axial frequency does not depend on initial energy, angle, and position of ions, so it can be used for mass analysis
• The axial oscillation frequency follows the formula
zm
k
/
Ion Motion in Orbitrap
21
Ions of Different m/z in Orbitrap
• Large ion capacity -stacking the rings
• Fourier transform needed to obtain individual frequencies of ions of different m/z
How Big Is the Orbitrap?
22
Getting Ions into the Orbitrap
• The “ideal Kingdon” field has been known since 1950’s, but not used in MS. Why?There is a catch
– how to get ions into it ?
• Ions coming from the outside into a static electric field will zoom past, like a comet from the outer space flies through a solar system
• The catch: The field must not be static when ions come in!
– A potential barrier stopping the ions before they reach an electrode can be created by lowering the central electrode voltage while ions are still entering
• Thus we arrive at the principle of
Electrodynamic Squeezing
A.A. Makarov, Anal. Chem. 2000, 72: 1156-1162.A.A. Makarov, US Pat. 5,886,346, 1999.A.A. Makarov et al., US Pat. 6,872,938, 2005.
Curved Linear Trap (C-trap) for ‘Fast’ Injection
Push
Trap
Pull
Lenses
Orbitrap
Gate
Deflector
• Ions are stored and cooled in the RF-only C-trap
• After trapping the RF is ramped down and DC voltages are applied to the rods, creating a field across the trap that ejects along lines converging to the pole of curvature (which coincides with the orbitrap entrance). As ions enter the orbitrap, they are picked up and squeezed by its electric field
• As the result, ions stay concentrated (within 1 mm3) only for a very short time, so space charge effects do not have time to develop
• Now we can interface the orbitrap to whatever we want!
A.A. Makarov et al., US Pat. 6,872,938, 2005.A. Kholomeev et al., WO05/124821, 2005.
23
Dependence of resolving power on m/z for the following analyzers (all data are shown for a 0.76 s scan): (i) standard trap (magnitude mode, 3.5 kV on central electrode), (ii) compact high-field trap (eFT, 3.5 kV on central electrode), (iii) FTICR (magnitude mode, 15 T), (iv) FTICR (absorption mode, 15 T).
Comparison of Resolving Power as a function of mass for Orbitrap and ICR
Anal. Chem. 2013, 85, 5288−5296
Hybrid Orbitrap XL
24
Hybrid Orbitrap Elite
Hybrid Orbitrap Fusion
25
Highly Parallel Data Acquisition
ControlB3a #4869 RT: 41.56 AV: 1 NL: 7.39E6T: FTMS + p NSI Full ms [465.00-1600.00]
Parallel Detection in Orbitrap and Linear Ion Trap
• Total cycle is 2.4 seconds• 1 High resolution scan • 5 ion trap MS/MS in parallel
RT: 41.56High resolutionFull scan # 4869
ControlB3a #4870 RT: 41.57 AV: 1 NL: 7.16E3T: ITMS + c NSI d Full ms2 [email protected] [150.00-1810.00]
200 400 600 800 1000 1200 1400 1600 1800
m/z
0
5
10
15
20
25
30
35
40
45
50
55
60
65
70
75
80
85
90
95
100
Re
lativ
e A
bu
nd
an
ce
437.9462
542.7487
590.2733
983.4816
776.4982
623.5060
301.24471084.6279
1171.8290
RT: 41.57MS/MS of m/z 598.6Scan # 4870
ControlB3a #4873 RT: 41.59 AV: 1 NL: 1.54E3T: ITMS + c NSI d Full ms2 [email protected] [255.00-1960.00]
400 600 800 1000 1200 1400 1600 1800m/z
0
5
10
15
20
25
30
35
40
45
50
55
60
65
70
75
80
85
90
95
100
Rel
ativ
e A
bu
ndan
ce
1092.6033
1409.7291
856.3868
539.2245
1294.7877965.7724
1223.7373
654.2495 757.5266 1801.9797
1513.5245436.2499
1674.7556393.1896
ControlB3a #4871 RT: 41.58 AV: 1 NL: 4.17E3T: ITMS + c NSI d Full ms2 [email protected] [140.00-1655.00]
200 400 600 800 1000 1200 1400 1600
m/z
0
5
10
15
20
25
30
35
40
45
50
55
60
65
70
75
80
85
90
95
100
Re
lativ
e A
bu
nd
an
ce
535.5252
690.1100
490.3550
575.8568
450.8616361.2963
747.4839
330.2767262.1056
900.6165 1022.6853234.2242
1088.7388
RT: 41.58MS/MS of m/z 547.3Scan # 4871
RT: 41.58MS/MS of m/z 777.4Scan # 4872
RT: 41.59MS/MS of m/z 974.9Scan # 4873
RT: 41.60MS/MS of m/z 1116.5Scan # 4874
ControlB3a #4872 RT: 41.58 AV: 1 NL: 3.27E3T: ITMS + c NSI d Full ms2 [email protected] [200.00-790.00]
200 250 300 350 400 450 500 550 600 650 700 750
m/z
0
5
10
15
20
25
30
35
40
45
50
55
60
65
70
75
80
85
90
95
100
Re
lativ
e A
bu
nd
an
ce
701.4880
592.5975
400.3238
729.5197
767.4117
654.3235
354.2529 683.1174371.1810
309.1429 547.4052512.5754469.5364252.0748
ControlB3a #4873 RT: 41.59 AV: 1 NL: 1.54E3T: ITMS + c NSI d Full ms2 [email protected] [255.00-1960.00]
400 600 800 1000 1200 1400 1600 1800m/z
0
5
10
15
20
25
30
35
40
45
50
55
60
65
70
75
80
85
90
95
100
Rel
ativ
e A
bu
ndan
ce
1092.6033
1409.7291
856.3868
539.2245
1294.7877965.7724
1223.7373
654.2495 757.5266 1801.9797
1513.5245436.2499
1674.7556393.1896
26
January 1, 2014 Molecular & Cellular Proteomics, 13, 339-347.
January 1, 2014 Molecular & Cellular Proteomics, 13, 339-347.
27
Rate of protein identifications as a function of mass spectrometer scan rate forselected large-scale yeast proteome analyses over the past decade. Each data point isannotated with the year, corresponding author, type of MS system used, and referencenumber.
January 1, 2014 Molecular & Cellular Proteomics, 13, 339-347.