30
fourth QUARTER 2017 Jan 31, 2018
fourth QUARTER 2017
Jan 31, 2018

Peter Nyquist Vice President Investor Relations

fourth QUARTER 2017
Jan 31, 2018
This presentation contains forward-looking statements. Such statements are based on our current expectations and are subject to certain risks and uncertainties that could negatively affect our business. Please read our earnings reports and our most recent annual report for a better understanding of these risks and uncertainties.

Börje Ekholm President and CEO

© Telefonaktiebolaget LM Ericsson 2018 | FOURTH QUARTER REPORT 2017 | JAN 31, 2018 | Page 5
Business environment
› Increasing traction for 5G – Radio and Core
› Operator digitalization accelerating
› RAN equipment market outlook reconfirmed – 2018: -2%
– 5 year CAGR 2017-2022: +2%
› Positive momentum in North America – Tax reforms, FirstNet deployment
– Initial 5G deployments
› Lower LTE deployments in Mainland China – Focusing investments on NB IoT
› USD weakened
Ericsson Market
› Good traction for 4G portfolio and 5G
momentum – Supports operator 4G to 5G transition
– Deutsche Telecom, Verizon
– Market share gain in Mainland China
› New Digital Services products delivered – BSS and Telecom Core
› Growth in Managed Services IT – Driven by digitalization
› Momentum in Emerging Business – iconectiv solution on track for launch in North America
– Strong traction in UDN and IoT
This slide contains forward-looking statements. Actual result may be materially different.

© Telefonaktiebolaget LM Ericsson 2018 | FOURTH QUARTER REPORT 2017 | JAN 31, 2018 | Page 6
› Challenging year – executing on our focused
strategy
› Strengthening R&D while reducing cost
› Reduced risk – commercial and balance
sheet
› Sales declined -10%, FX adjusted
› Solid earnings in Networks, significant losses
in Digital Services
› Free cash flow improved – with a more even
profile
› RAN market decline, estimated to -8% FY17
› Increasing traction for 5G – intensified
customer collaboration
Full Year 2017
SEK b. 2017 2016
Net sales 201.3 222.6
Operating income -38.1 6.3
Free cash flow 5.1 0.3
Number of employees
100,735 111,464

© Telefonaktiebolaget LM Ericsson 2018 | FOURTH QUARTER REPORT 2017 | JAN 31, 2018 | Page 7
› Increased stability in product roadmaps
and challenging projects in Digital Services
› Strategic review of Media completed
› Continued review of Managed Services
contracts – 23 of 42 completed
› Net reduction of ~17,000 employees and
external workforce in 2017
› Increased LTE market shares in Mainland
China, UK, Germany to position for 5G
› Ericsson Radio System share at 61%, FY17
Strategy execution progress
2017 Target 2020
Adj.
operating
margin 1%
>10%
Group Targets 2020
Net sales SEK 190-200 b.
Gross margin 37-39%
Operating margin >10%
Free Cash Flow Positive
STABILIZE
&
SIMPLIFY
INVEST
& GROW
This slide contains forward-looking statements. Actual result may be materially different.

© Telefonaktiebolaget LM Ericsson 2018 | FOURTH QUARTER REPORT 2017 | JAN 31, 2018 | Page 8
› Business Area Emerging Business created to
strengthen focus on innovation and new
business development
– Åsa Tamsons appointed head of unit and member of
the Ericsson Executive Team
› Simplified Group Function structure
– Current GF Technology and Emerging Business and
GF Sustainability and Public Affairs combined into
other units
› Business Area Digital Services accelerates
strategy execution
– Jan Karlsson acting head of unit. Search for a new
head of unit initiated
Changes to executive team and organization

© Telefonaktiebolaget LM Ericsson 2018 | FOURTH QUARTER REPORT 2017 | JAN 31, 2018 | Page 9
› Sales adjusted for FX -7% YoY
› Adjusted gross margin improved YoY
– Strong performance in Networks
– Decline in Digital Services
› Adjusted operating income declined YoY
– Negative capitalization impact YoY SEK 2.2 b.
– Increased R&D, reduced SG&A
› Strong cash flow performance
› The Board to propose a dividend of SEK 1.00
Q4 2017
SEK b. 17Q4 16Q4 17Q3
Net sales 57.3 65.2 47.7
Gross margin 29.9% 29.4% 30.0%
Operating income 0.4 4.4 0.0
Operating margin 0.7% 6.7% -0.1%
Free cash flow 10.1 14.3 -0.5
Adjusted for restructuring charges and certain other items affecting comparability.

© Telefonaktiebolaget LM Ericsson 2018 | FOURTH QUARTER REPORT 2017 | JAN 31, 2018 | Page 10
Market area sales Q4, YoY
› North East Asia
– Reduced LTE investments in Mainland China
– Market share gain in Mainland China
– Operators awaiting spectrum allocations
› South East Asia & India
– Lower Networks sales in Vietnam, India and Indonesia
– Exit from Managed Services contract in India
› Europe & Latin America
– Decline in Mexico (timing of projects), growth in Brazil
– Continued capex pressure in most of Europe
› Middle East & Africa
– Continued weak macroeconomic environment
› North America
– Network expansions
16Q4 NorthEast Asia
SE AsiaOceania& India
Europe &Latin
America
MiddleEast &Africa
NorthAmerica
17Q4
-25%
-5% 10%
-15%
Reported: 2% -8% -21% -30%
-10%
FX adjusted1
1Calculated FX impact. Market Area Other excluded
-16%

© Telefonaktiebolaget LM Ericsson 2018 | FOURTH QUARTER REPORT 2017 | JAN 31, 2018 | Page 11
› Sales adjusted for FX -9% YoY
– Lower LTE investments in Mainland China
– Strong Q4 2016 – large projects completed
› Gross margin
– Higher share of software, increased hardware and
services margins
– Negative impact from market share gain in China
› Operating margin
– QoQ sales growth offset by increased expenses
– Capitalization impact QoQ SEK 0.1 b., YoY SEK -0.9 b.
› Increased R&D investments
› Strong Ericsson Radio System deliveries, 71%
in the quarter
networks Adjusted for restructuring charges and certain other items affecting comparability.
SEK b. 17Q4 16Q4 17Q3
Net sales 36.3 42.1 30.4
Gross margin 35.9% 31.6% 35.9%
Operating income 4.2 5.6 4.2
Operating margin 11.5% 13.3% 13.9%
Capitalization impact -0.6 0.3 -0.7
Operating
margin
2017 Target 2020
13%
15-17%
SEK 17.2 b.
This slide contains forward-looking statements. Actual result may be materially different.

© Telefonaktiebolaget LM Ericsson 2018 | FOURTH QUARTER REPORT 2017 | JAN 31, 2018 | Page 12
Digital services Adjusted for restructuring charges and certain other items affecting comparability.
Target 2020
-23%
Low single digit
SEK b. 17Q4 16Q4 17Q3
Net sales 12.9 14.1 9.3
Gross margin 24.8% 37.6% 29.6%
Operating income -2.7 -0.2 -2.8
Operating margin -21.0% -1.3% -29.9%
Capitalization impact -0.7 0.4 -0.7
› Sales adjusted for FX -3% YoY
– Decline in legacy products and services
– Strong sequential growth, +35% FX adj.
› Gross margin
– Reduced services margins YoY
– QoQ decline due to lower software margins
› Operating margin
– Capitalization impact flat QoQ, YoY SEK -1.1 b.
– Operating expenses, excl. capitalization impact,
declined SEK 0.9 b. YoY
› Increased stability in product roadmaps
› 45 critical or non-strategic customer contracts
identified
– 2 contracts completed or exited in Q417
– Approx. 50% to be finalized during 2018
Operating
margin 2017
SEK -9.6 b.
This slide contains forward-looking statements. Actual result may be materially different.

© Telefonaktiebolaget LM Ericsson 2018 | FOURTH QUARTER REPORT 2017 | JAN 31, 2018 | Page 13
Managed services Adjusted for restructuring charges and certain other items affecting comparability.
Operating
margin
Target 2020
-4%
4-6%
2017
SEK b. 17Q4 16Q4 17Q3
Net sales 6.2 6.7 5.9
Gross margin 3.7% 2.0% 3.3%
Operating income -0.3 -0.2 -0.1
Operating margin -4.6% -3.7% -2.4%
› Sales adjusted for FX -3% YoY
– Contract reviews and reduced variable sales
– Good growth in Managed Services IT
› Gross margin
– Positive results of efficiency measures and contract
reviews
› Operating margin
– Negative impact from temporary costs in operating
expenses
› Continued contract review – 23 of 42
completed
– Annualized profit improvement ~SEK 0.5 b. going
forward
SEK -1.0 b.
This slide contains forward-looking statements. Actual result may be materially different.
© Telefonaktiebolaget LM Ericsson 2018 | FOURTH QUARTER REPORT 2017 | JAN 31, 2018 | Page 14
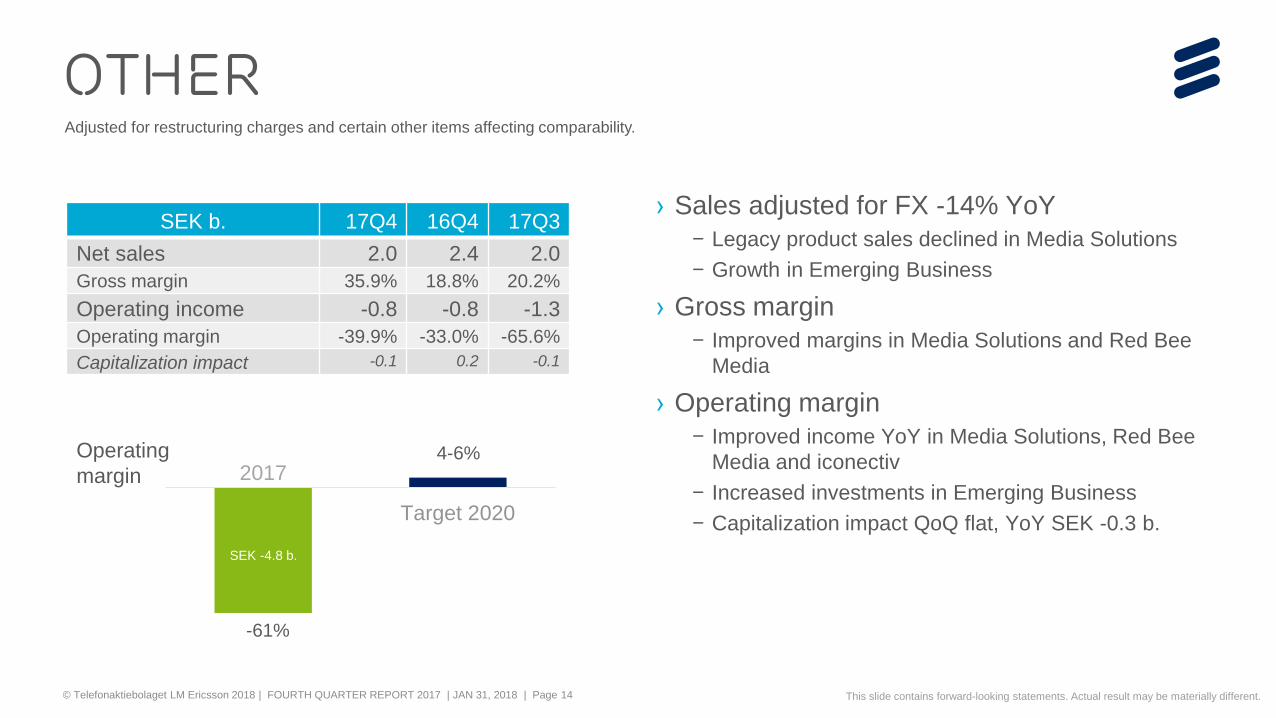
other Adjusted for restructuring charges and certain other items affecting comparability.
Target 2020
-61%
4-6%
SEK b. 17Q4 16Q4 17Q3
Net sales 2.0 2.4 2.0
Gross margin 35.9% 18.8% 20.2%
Operating income -0.8 -0.8 -1.3
Operating margin -39.9% -33.0% -65.6%
Capitalization impact -0.1 0.2 -0.1
› Sales adjusted for FX -14% YoY
– Legacy product sales declined in Media Solutions
– Growth in Emerging Business
› Gross margin
– Improved margins in Media Solutions and Red Bee
Media
› Operating margin
– Improved income YoY in Media Solutions, Red Bee
Media and iconectiv
– Increased investments in Emerging Business
– Capitalization impact QoQ flat, YoY SEK -0.3 b.
Operating
margin 2017
SEK -4.8 b.
This slide contains forward-looking statements. Actual result may be materially different.

© Telefonaktiebolaget LM Ericsson 2018 | FOURTH QUARTER REPORT 2017 | JAN 31, 2018 | Page 15
› One Equity Partners - new majority owner in
Media Solutions. Ericsson will retain 49% of
the shares
› Media Solutions assets and staff to transfer to
independent company upon closing, expected
Q3 2018
› Continued in-house development of Red Bee
Media (former Broadcast and Media services)
– Bids received did not reflect the value of the business
› Performance improvement programs showing
significant progress in both Media Solutions
and Red Bee Media
Media solutions and red bee media
Carl Mellander Chief Financial Officer
© Telefonaktiebolaget LM Ericsson 2018 | FOURTH QUARTER REPORT 2017 | JAN 31, 2018 | Page 17
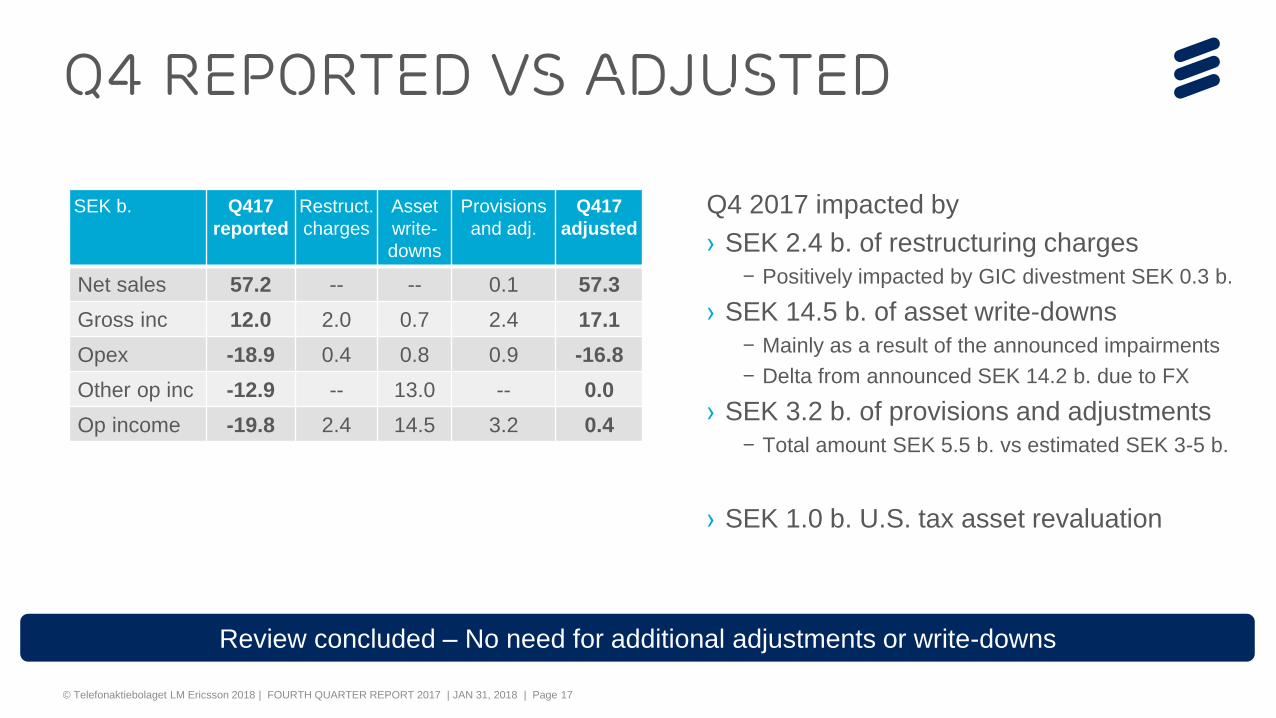
Q4 2017 impacted by
› SEK 2.4 b. of restructuring charges
– Positively impacted by GIC divestment SEK 0.3 b.
› SEK 14.5 b. of asset write-downs
– Mainly as a result of the announced impairments
– Delta from announced SEK 14.2 b. due to FX
› SEK 3.2 b. of provisions and adjustments
– Total amount SEK 5.5 b. vs estimated SEK 3-5 b.
› SEK 1.0 b. U.S. tax asset revaluation
Q4 Reported vs adjusted
SEK b. Q417
reported
Restruct.
charges
Asset
write-
downs
Provisions
and adj.
Q417
adjusted
Net sales 57.2 -- -- 0.1 57.3
Gross inc 12.0 2.0 0.7 2.4 17.1
Opex -18.9 0.4 0.8 0.9 -16.8
Other op inc -12.9 -- 13.0 -- 0.0
Op income -19.8 2.4 14.5 3.2 0.4
Review concluded – No need for additional adjustments or write-downs

© Telefonaktiebolaget LM Ericsson 2018 | FOURTH QUARTER REPORT 2017 | JAN 31, 2018 | Page 18
Gross margin Q4, YoY
› GM improved YoY
– Improvements in Networks offset by decline in
Digital Services
› GM stable QoQ
– Improvements in segment Other offset by decline in
Digital Services
› Capitalization impact
– SEK -0.6 b. YoY – equal to ~1 percentage point
– Stable sequentially
Gross margin far below 2020 target level
Adjusted for restructuring charges and certain other items affecting comparability.
34% 33%
29% 29%
31% 30% 30% 30%
25%
30%
35%
Q12016
Q2 Q3 Q4 Q12017
Q2 Q3 Q4
29.4% 29.9%
Q416adjusted
Networks DigitalServices
ManagedServices
Other Q417adjusted

© Telefonaktiebolaget LM Ericsson 2018 | FOURTH QUARTER REPORT 2017 | JAN 31, 2018 | Page 19
4.4
0.4
Q416adjusted
Nonoperationalcosts andexpenses
Volume Grossmargin
underlying
R&D SG&A Other Q417adjusted
Operating income Q4, YoY
2020 target >10%
› Lower sales and capitalization impact – main
reasons for OI decline YoY
› Capitalization impact
– SEK -2.2 b. YoY
– Stable sequentially
› R&D, excl. capitalization effects, increased in
Networks and Emerging Business
› SG&A reduction from cost program
› OI improved QoQ – increased sales partly
offset by increased operating expenses
Adjusted for restructuring charges and certain other items affecting comparability.
7% SEK b.
1%
8% 7%
3%
7%
2%
1% 1%
0%
2%
4%
6%
8%
10%
Q12016
Q2 Q3 Q4 Q12017
Q2 Q3 Q4
Op marg.

© Telefonaktiebolaget LM Ericsson 2018 | FOURTH QUARTER REPORT 2017 | JAN 31, 2018 | Page 20
16Q4 FX Intangibleassets
Realizedsavings
Various 17Q4
R&D and SG&A Q4, YoY
R&D SG&A
16Q4 Intangibleassets
CapitalizedR&D
Ref. DigitalServices
Networks Emergingbusiness
ManagedServices
17Q4
Adjusted for restructuring charges and certain other items affecting comparability.
7.4
8.9
9.3
0.2
1.7 0.3
0.7 0.1 0.0 7.8
0.1
0.1
0.4
0.2
7.4
SEK b. SEK b.
Increased R&D in Networks Savings in SG&A

© Telefonaktiebolaget LM Ericsson 2018 | FOURTH QUARTER REPORT 2017 | JAN 31, 2018 | Page 21
Cost-out target Annual run rate
Cost of sales G&A
Target and progress
SEK 10 b. Cost-out target for MID-2018
7.2
2.0
This slide contains forward-looking statements. Actual result may be materially different.
~SEK 6 b.
Target SEK
10 b.
› G&A employees net: -0.6k 2H 2017 (-7%)
› Annual run rate reduction end of quarter: ~SEK 1.5 b.
› Adj. SG&A exp. structurally down by SEK 0.4 b. in Q417 YoY
› Service employees net: -6.5k in 2H 2017 (-12%)
› External workforce net: -6.5k in 2H 2017 (-34%)
› Supply and sourcing employees net: -0.7k 2H 2017 (-11%)
› Annual run rate reduction end of quarter: ~SEK 4.5 b.
› Timing difference between cost-out and P&L impact
› GM improvements in Networks and Managed Services
Achievements
G&A
Cost of sales
Workforce net reduction in selected areas 14,300 in 2H 2017
30%
70%

© Telefonaktiebolaget LM Ericsson 2018 | FOURTH QUARTER REPORT 2017 | JAN 31, 2018 | Page 22
Change in Gross cash, Q4
Free cash flow SEK 10.1 (14.3) b.
55.1
-4.5 +16.8
-1.2 -1.1 +0.1 +2.1
-0.0 +0.4
67.7
Gross cash1709A
Net Incomereconciled to
cash
Change Netoperating
assets
Restructuring CAPEX net Acquisitions,divestments &
Other
Other financingactivities
Dividend FX on cashand other
Gross cash1712A
Change in gross cash SEK +12.6 b.
Investing1
-1.0 b.
Financing
+2.1 b.
Operating Cash Flow
+11.2 b.
FX and other2
+0.4 b.
Change in net cash SEK +10.6 b. 1Excluding Interest-bearing securities 2Related to Interest-bearing securities
CAPEX

© Telefonaktiebolaget LM Ericsson 2018 | FOURTH QUARTER REPORT 2017 | JAN 31, 2018 | Page 23
Free cash flow
Solid balance sheet – Net cash improved to SEK 34.7 (31.2) b. YoY
Debt maturity profile SEK b. SEK b. Q417 Q416 2017 2016
Net Income reconciled to cash -4.5 1.6 -16.5 8.0
Change operating Net Assets 15.6 17.9 26.1 6.0
Cash flow from Operations 11.2 19.4 9.6 14.0
CAPEX -1.1 -1.7 -3.9 -6.1
M&A -0.1 -0.1 0.3 -0.6
Other 0.2 -3.4 -0.9 -7.0
Free cash flow 10.1 14.3 5.1 0.3
Net Cash end of period 34.7 31.2 34.7 31.2
Gross Cash end of period 67.7 57.9 67.7 57.9
This slide contains forward-looking statements. Actual result may be materially different.

© Telefonaktiebolaget LM Ericsson 2018 | FOURTH QUARTER REPORT 2017 | JAN 31, 2018 | Page 24
Currency risks
› ~45% sales exposure to USD on net sales
› USD to SEK movements has a direct impact
on reported sales and income
› For historical FX rates, see ericsson.com
sales and income exposed to USD
Sales exposure 2017
-10% weaker USD to SEK results in ~ -5% impact on sales and ~ -1 pp on OM
USD 45%
EUR
CNY
INR
JPY
Other
© Telefonaktiebolaget LM Ericsson 2018 | FOURTH QUARTER REPORT 2017 | JAN 31, 2018 | Page 25
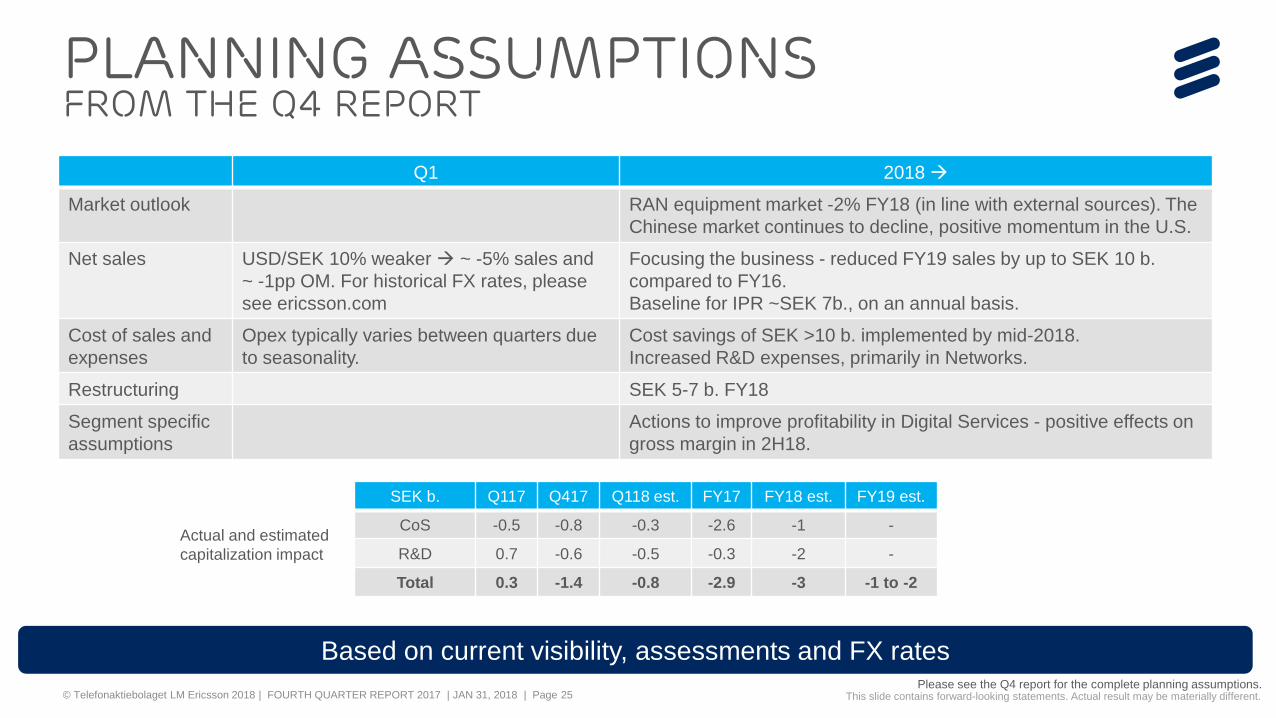
Planning assumptions From the Q4 report
Please see the Q4 report for the complete planning assumptions.
Q1 2018
Market outlook RAN equipment market -2% FY18 (in line with external sources). The
Chinese market continues to decline, positive momentum in the U.S.
Net sales USD/SEK 10% weaker ~ -5% sales and
~ -1pp OM. For historical FX rates, please
see ericsson.com
Focusing the business - reduced FY19 sales by up to SEK 10 b.
compared to FY16.
Baseline for IPR ~SEK 7b., on an annual basis.
Cost of sales and
expenses
Opex typically varies between quarters due
to seasonality.
Cost savings of SEK >10 b. implemented by mid-2018.
Increased R&D expenses, primarily in Networks.
Restructuring SEK 5-7 b. FY18
Segment specific
assumptions
Actions to improve profitability in Digital Services - positive effects on
gross margin in 2H18.
This slide contains forward-looking statements. Actual result may be materially different.
Based on current visibility, assessments and FX rates
SEK b. Q117 Q417 Q118 est. FY17 FY18 est. FY19 est.
CoS -0.5 -0.8 -0.3 -2.6 -1 -
R&D 0.7 -0.6 -0.5 -0.3 -2 -
Total 0.3 -1.4 -0.8 -2.9 -3 -1 to -2
Actual and estimated
capitalization impact
Börje Ekholm President and CEO

© Telefonaktiebolaget LM Ericsson 2018 | FOURTH QUARTER REPORT 2017 | JAN 31, 2018 | Page 27
› Balance sheet and commercial risk review
completed – No need for additional adjustments and write-downs
› Strong free cash flow – Covering dividend first time in 5 years
– Improved resilience and financial flexibility
› Continued solid performance in Networks – Gross margin improved significantly YoY
– Increased R&D to safeguard leading portfolio and
improve profitability
› Continued high losses in Digital Services – Expected but not acceptable
– Focus remains on turnaround – gross margin
improvement in 2H 2018
CLOSING REMARKS
Laid a solid foundation for achieving our financial targets

© Telefonaktiebolaget LM Ericsson 2018 | FOURTH QUARTER REPORT 2017 | JAN 31, 2018 | Page 28


fourth QUARTER 2017
Jan 31, 2018
This presentation contains forward-looking statements. Such statements are based on our current expectations and are subject to certain risks and uncertainties that could negatively affect our business. Please read our earnings reports and our most recent annual report for a better understanding of these risks and uncertainties.


