59
INSTITUTIONAL INVESTOR PRESENTATION FOURTH QUARTER 2020

INSTITUTIONAL INVESTOR PRESENTATIONFOURTH QUARTER 2020
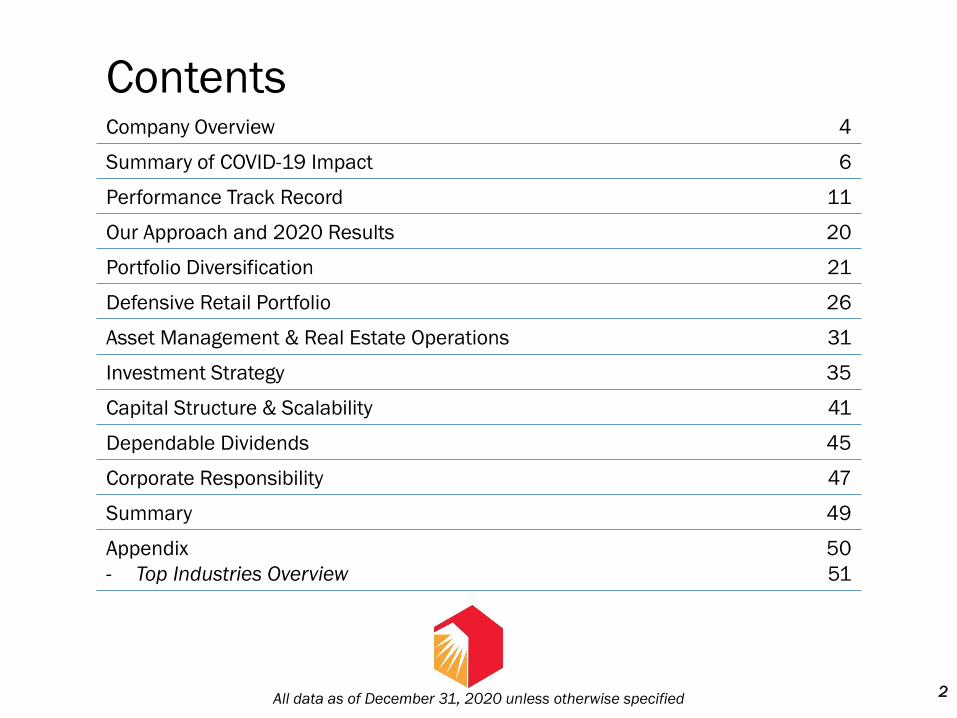
ContentsCompany Overview 4
Summary of COVID-19 Impact 6
Performance Track Record 11
Our Approach and 2020 Results 20
Portfolio Diversification 21
Defensive Retail Portfolio 26
Asset Management & Real Estate Operations 31
Investment Strategy 35
Capital Structure & Scalability 41
Dependable Dividends 45
Corporate Responsibility 47
Summary 49
Appendix
- Top Industries Overview
50
51
All data as of December 31, 2020 unless otherwise specified 2
Safe Harbor For Forward-Looking Statements
Statements in this investor presentation that are not strictly historical are “forward-looking”statements. Forward-looking statements involve known and unknown risks, which may cause thecompany’s actual future results to differ materially from expected results. These risks include,among others, general economic conditions, domestic and foreign real estate conditions, clientfinancial health, the availability of capital to finance planned growth, volatility and uncertainty inthe credit markets and broader financial markets, changes in foreign currency exchange rates,property acquisitions and the timing of these acquisitions, charges for property impairments, theeffects of the COVID-19 pandemic and the measures taken to limit its impact, the effects ofpandemics or global outbreaks of contagious diseases or fear of such outbreaks, our clients' abilityto adequately manage its properties and fulfill their respective lease obligations to us, and theoutcome of any legal proceedings to which the company is a party, as described in the company’sfilings with the Securities and Exchange Commission. Consequently, forward-looking statementsshould be regarded solely as reflections of the company’s current operating plans and estimates.Actual operating results may differ materially from what is expressed or forecast in this pressrelease. The company undertakes no obligation to publicly release the results of any revisions tothese forward-looking statements that may be made to reflect events or circumstances after thedate these statements were made.
3
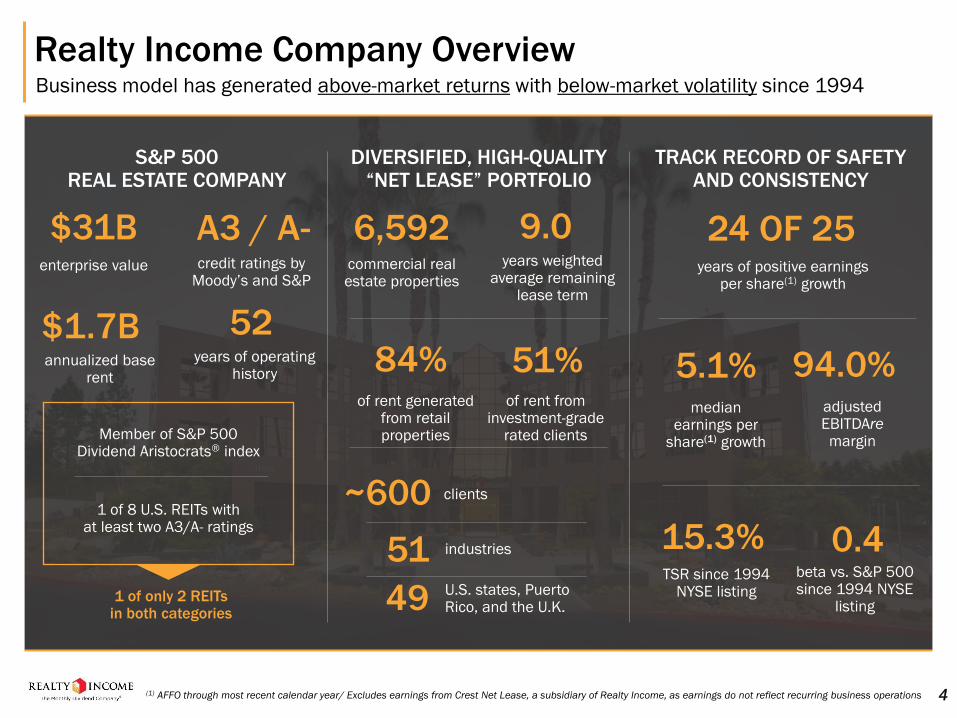
Realty Income Company Overview
4
S&P 500 REAL ESTATE COMPANY
DIVERSIFIED, HIGH-QUALITY“NET LEASE” PORTFOLIO
TRACK RECORD OF SAFETY AND CONSISTENCY
$31B enterprise value
1 of only 2 REITs in both categories
Member of S&P 500 Dividend Aristocrats® index
1 of 8 U.S. REITs with at least two A3/A- ratings
6,592commercial real estate properties
84%of rent generated
from retail properties
~600 clients
51 industries
49 U.S. states, Puerto Rico, and the U.K.
A3 / A-
(1) AFFO through most recent calendar year/ Excludes earnings from Crest Net Lease, a subsidiary of Realty Income, as earnings do not reflect recurring business operations
15.3%TSR since 1994
NYSE listing
$1.7B annualized base
rent
52years of operating
history
credit ratings by Moody’s and S&P
24 OF 25years of positive earnings
per share(1) growth
9.0years weighted
average remaining lease term
0.4beta vs. S&P 500 since 1994 NYSE
listing
5.1%median
earnings per share(1) growth
51%of rent from
investment-grade rated clients
94.0%adjusted EBITDAremargin
Business model has generated above-market returns with below-market volatility since 1994
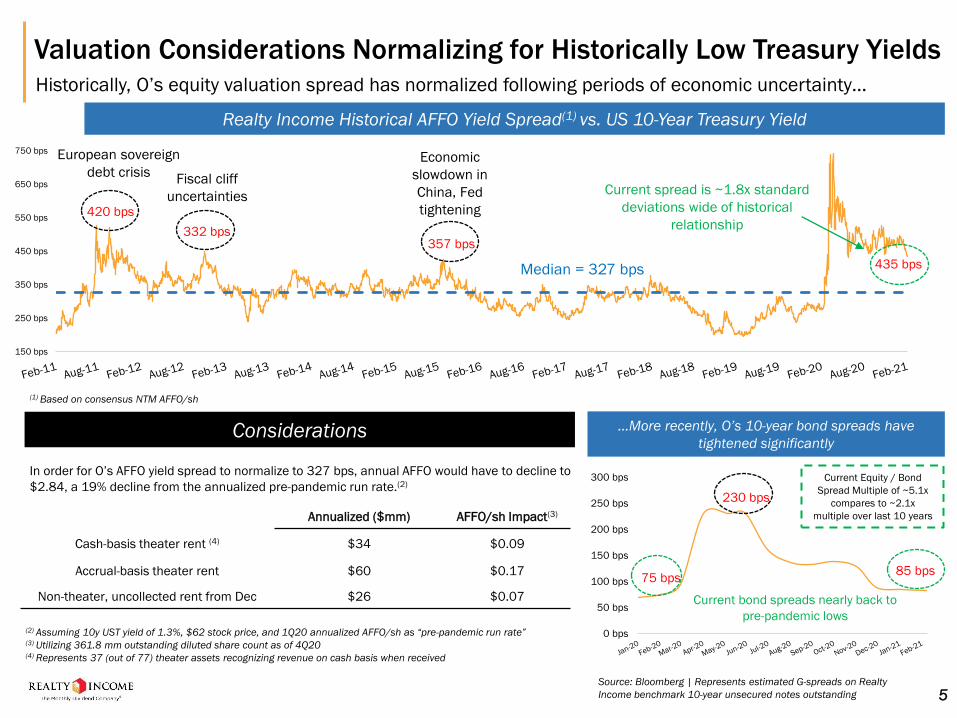
Annualized ($mm) AFFO/sh Impact(3)
Cash-basis theater rent (4) $34 $0.09
Accrual-basis theater rent $60 $0.17
Non-theater, uncollected rent from Dec $26 $0.07
5
Valuation Considerations Normalizing for Historically Low Treasury YieldsHistorically, O’s equity valuation spread has normalized following periods of economic uncertainty…
420 bps
332 bps357 bps
435 bpsMedian = 327 bps
150 bps
250 bps
350 bps
450 bps
550 bps
650 bps
750 bpsEconomic
slowdown in
China, Fed
tightening
European sovereign
debt crisisFiscal cliff
uncertaintiesCurrent spread is ~1.8x standard
deviations wide of historical
relationship
…More recently, O’s 10-year bond spreads have
tightened significantly
75 bps
230 bps
85 bps
0 bps
50 bps
100 bps
150 bps
200 bps
250 bps
300 bps Current Equity / Bond
Spread Multiple of ~5.1x
compares to ~2.1x
multiple over last 10 years
Considerations
Current bond spreads nearly back to
pre-pandemic lows
Source: Bloomberg | Represents estimated G-spreads on Realty
Income benchmark 10-year unsecured notes outstanding
In order for O’s AFFO yield spread to normalize to 327 bps, annual AFFO would have to decline to
$2.84, a 19% decline from the annualized pre-pandemic run rate.(2)
(2) Assuming 10y UST yield of 1.3%, $62 stock price, and 1Q20 annualized AFFO/sh as “pre-pandemic run rate”(3) Utilizing 361.8 mm outstanding diluted share count as of 4Q20(4) Represents 37 (out of 77) theater assets recognizing revenue on cash basis when received
Realty Income Historical AFFO Yield Spread(1) vs. US 10-Year Treasury Yield
(1) Based on consensus NTM AFFO/sh
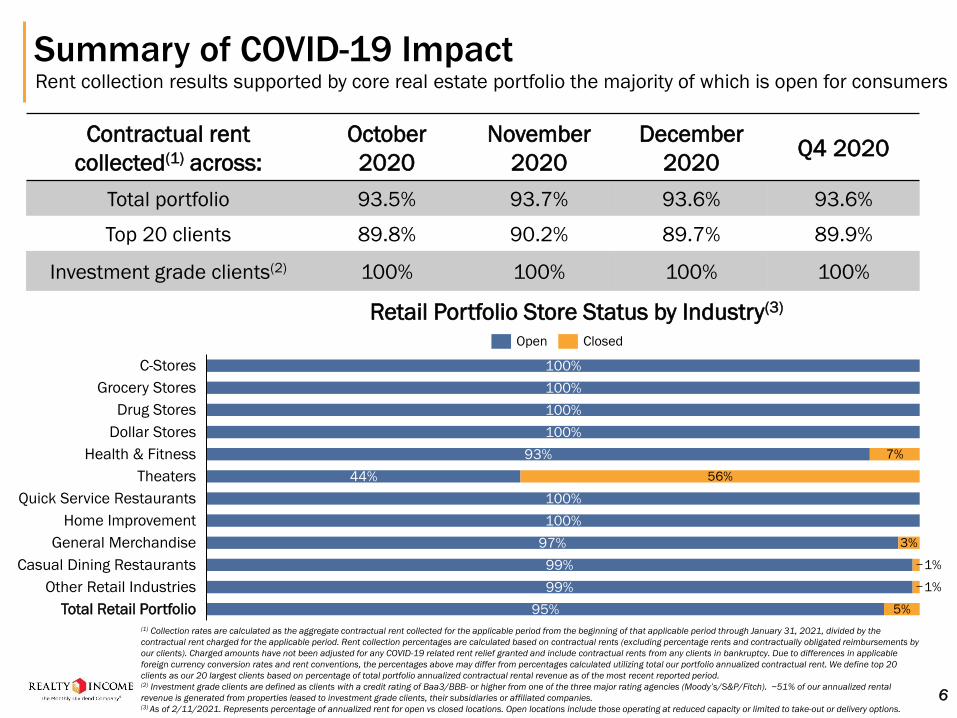
Summary of COVID-19 ImpactRent collection results supported by core real estate portfolio the majority of which is open for consumers
6
(1) Collection rates are calculated as the aggregate contractual rent collected for the applicable period from the beginning of that applicable period through January 31, 2021, divided by the
contractual rent charged for the applicable period. Rent collection percentages are calculated based on contractual rents (excluding percentage rents and contractually obligated reimbursements by
our clients). Charged amounts have not been adjusted for any COVID-19 related rent relief granted and include contractual rents from any clients in bankruptcy. Due to differences in applicable
foreign currency conversion rates and rent conventions, the percentages above may differ from percentages calculated utilizing total our portfolio annualized contractual rent. We define top 20
clients as our 20 largest clients based on percentage of total portfolio annualized contractual rental revenue as of the most recent reported period.(2) Investment grade clients are defined as clients with a credit rating of Baa3/BBB- or higher from one of the three major rating agencies (Moody’s/S&P/Fitch). ~51% of our annualized rental
revenue is generated from properties leased to investment grade clients, their subsidiaries or affiliated companies.(3) As of 2/11/2021. Represents percentage of annualized rent for open vs closed locations. Open locations include those operating at reduced capacity or limited to take-out or delivery options.
Contractual rent
collected(1) across:
October
2020
November
2020
December
2020Q4 2020
Total portfolio 93.5% 93.7% 93.6% 93.6%
Top 20 clients 89.8% 90.2% 89.7% 89.9%
Investment grade clients(2) 100% 100% 100% 100%
Retail Portfolio Store Status by Industry(3)
100%
100%
100%
100%
93%
44%
100%
100%
97%
99%
99%
95%
7%
56%
3%
1%
1%
5%
Dollar Stores
C-Stores
Total Retail Portfolio
Quick Service Restaurants
Grocery Stores
Casual Dining Restaurants
Drug Stores
Theaters
Home Improvement
Health & Fitness
General Merchandise
Other Retail Industries
Open Closed
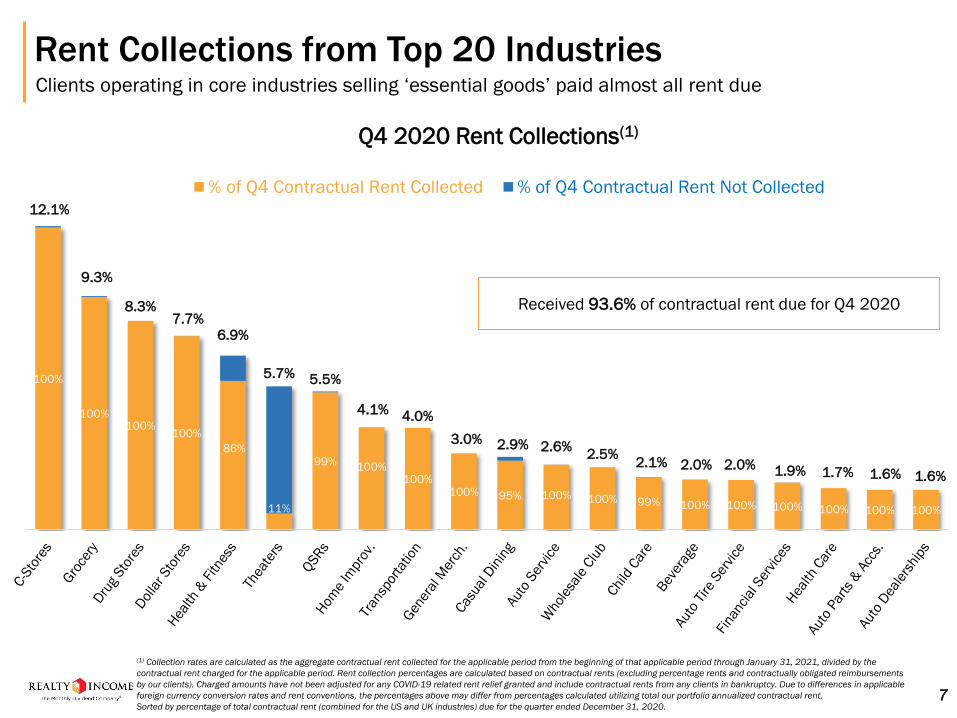
Rent Collections from Top 20 IndustriesClients operating in core industries selling ‘essential goods’ paid almost all rent due
7
100%
100%100%
100%
86%
11%
99% 100%100%
100% 95% 100% 100% 99% 100% 100% 100% 100% 100% 100%
12.1%
9.3%
8.3%7.7%
6.9%
5.7% 5.5%
4.1%4.0%
3.0% 2.9% 2.6%2.5%
2.1% 2.0% 2.0% 1.9% 1.7% 1.6% 1.6%
Q4 2020 Rent Collections(1)
% of Q4 Contractual Rent Collected % of Q4 Contractual Rent Not Collected
Received 93.6% of contractual rent due for Q4 2020
(1) Collection rates are calculated as the aggregate contractual rent collected for the applicable period from the beginning of that applicable period through January 31, 2021, divided by the
contractual rent charged for the applicable period. Rent collection percentages are calculated based on contractual rents (excluding percentage rents and contractually obligated reimbursements
by our clients). Charged amounts have not been adjusted for any COVID-19 related rent relief granted and include contractual rents from any clients in bankruptcy. Due to differences in applicable
foreign currency conversion rates and rent conventions, the percentages above may differ from percentages calculated utilizing total our portfolio annualized contractual rent.
Sorted by percentage of total contractual rent (combined for the US and UK industries) due for the quarter ended December 31, 2020.
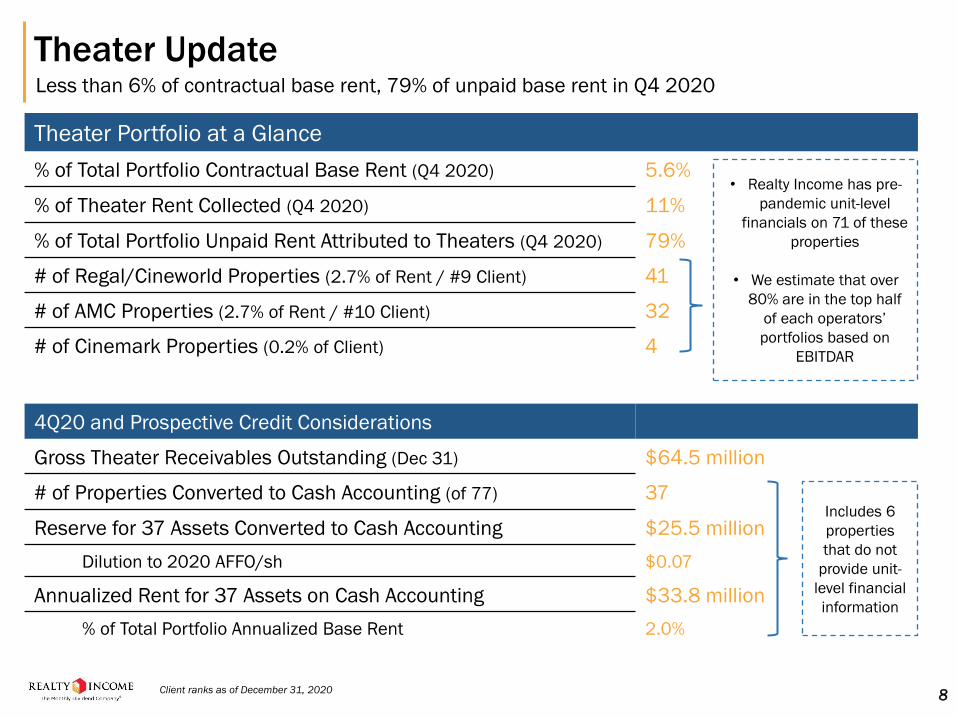
Theater UpdateLess than 6% of contractual base rent, 79% of unpaid base rent in Q4 2020
8
Theater Portfolio at a Glance
% of Total Portfolio Contractual Base Rent (Q4 2020) 5.6%
% of Theater Rent Collected (Q4 2020) 11%
% of Total Portfolio Unpaid Rent Attributed to Theaters (Q4 2020) 79%
# of Regal/Cineworld Properties (2.7% of Rent / #9 Client) 41
# of AMC Properties (2.7% of Rent / #10 Client) 32
# of Cinemark Properties (0.2% of Client) 4
4Q20 and Prospective Credit Considerations
Gross Theater Receivables Outstanding (Dec 31) $64.5 million
# of Properties Converted to Cash Accounting (of 77) 37
Reserve for 37 Assets Converted to Cash Accounting $25.5 million
Dilution to 2020 AFFO/sh $0.07
Annualized Rent for 37 Assets on Cash Accounting $33.8 million
% of Total Portfolio Annualized Base Rent 2.0%
• Realty Income has pre-
pandemic unit-level
financials on 71 of these
properties
• We estimate that over
80% are in the top half
of each operators’
portfolios based on
EBITDAR
Includes 6
properties
that do not
provide unit-
level financial
information
Client ranks as of December 31, 2020
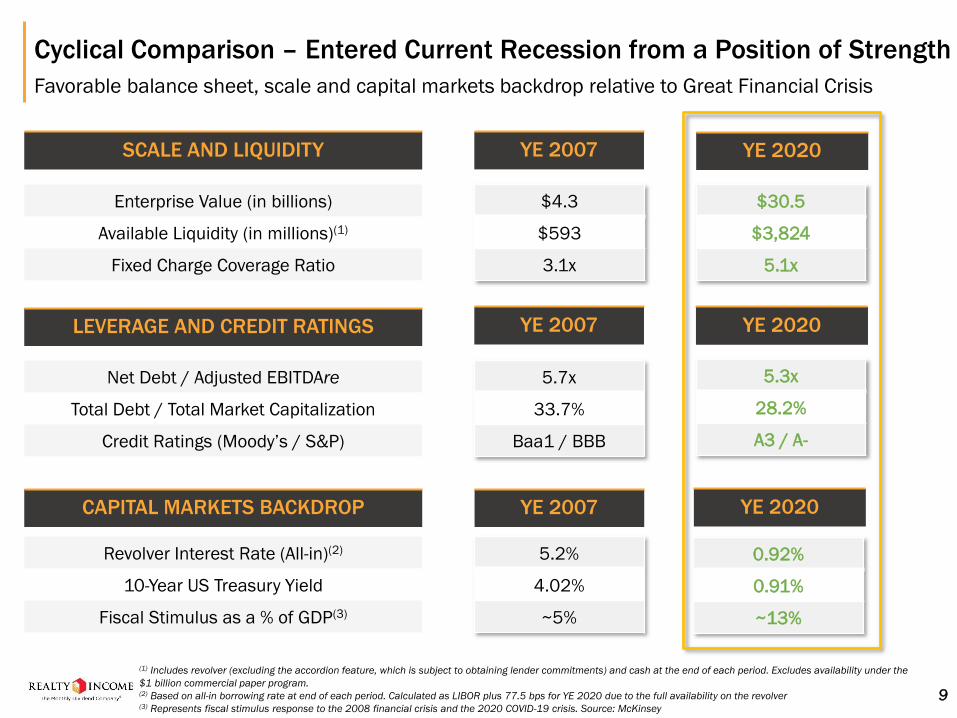
Cyclical Comparison – Entered Current Recession from a Position of Strength
Favorable balance sheet, scale and capital markets backdrop relative to Great Financial Crisis
9
(1) Includes revolver (excluding the accordion feature, which is subject to obtaining lender commitments) and cash at the end of each period. Excludes availability under the
$1 billion commercial paper program.(2) Based on all-in borrowing rate at end of each period. Calculated as LIBOR plus 77.5 bps for YE 2020 due to the full availability on the revolver(3) Represents fiscal stimulus response to the 2008 financial crisis and the 2020 COVID-19 crisis. Source: McKinsey
Net Debt / Adjusted EBITDAre
Total Debt / Total Market Capitalization
Credit Ratings (Moody’s / S&P)
5.3x
28.2%
A3 / A-
5.7x
33.7%
Baa1 / BBB
SCALE AND LIQUIDITY YE 2007 YE 2020
LEVERAGE AND CREDIT RATINGS
CAPITAL MARKETS BACKDROP
Revolver Interest Rate (All-in)(2)
10-Year US Treasury Yield
Fiscal Stimulus as a % of GDP(3)
5.2%
4.02%
~5%
0.92%
0.91%
~13%
Enterprise Value (in billions)
Available Liquidity (in millions)(1)
Fixed Charge Coverage Ratio
$4.3
$593
3.1x
$30.5
$3,824
5.1x
YE 2007 YE 2020
YE 2007 YE 2020
10
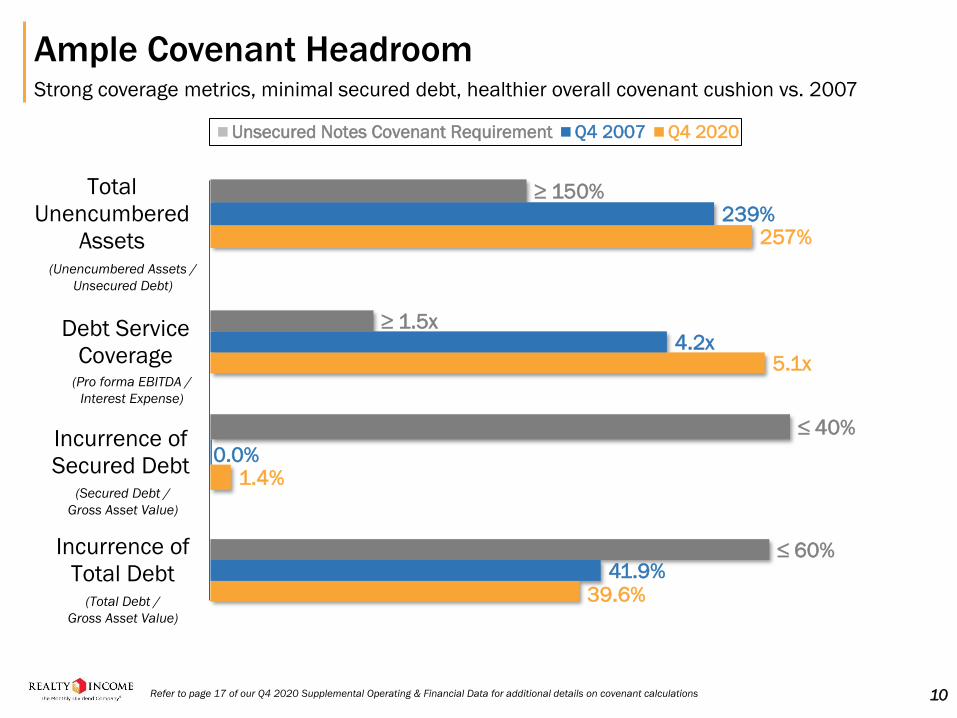
Ample Covenant HeadroomStrong coverage metrics, minimal secured debt, healthier overall covenant cushion vs. 2007
257%239%
≥ 150%Total
Unencumbered
Assets
Unsecured Notes Covenant Requirement Q4 2007 Q4 2020
5.1x4.2x
≥ 1.5xDebt Service
Coverage
1.4%
≤ 40%Incurrence of
Secured Debt
39.6%41.9%
≤ 60%Incurrence of
Total Debt
0.0%
(Unencumbered Assets /
Unsecured Debt)
(Pro forma EBITDA /
Interest Expense)
(Secured Debt /
Gross Asset Value)
(Total Debt /
Gross Asset Value)
Refer to page 17 of our Q4 2020 Supplemental Operating & Financial Data for additional details on covenant calculations
PERFORMANCE TRACK RECORD
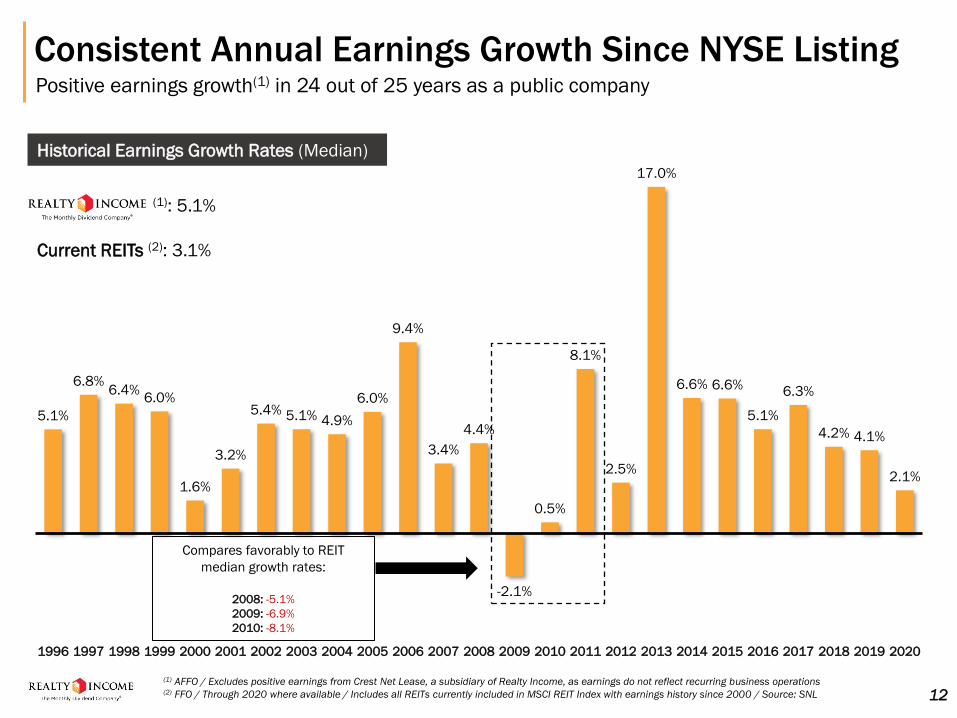
Consistent Annual Earnings Growth Since NYSE ListingPositive earnings growth(1) in 24 out of 25 years as a public company
5.1%
6.8%6.4%
6.0%
1.6%
3.2%
5.4% 5.1% 4.9%
6.0%
9.4%
3.4%
4.4%
-2.1%
0.5%
8.1%
2.5%
17.0%
6.6% 6.6%
5.1%
6.3%
4.2% 4.1%
2.1%
1996 1997 1998 1999 2000 2001 2002 2003 2004 2005 2006 2007 2008 2009 2010 2011 2012 2013 2014 2015 2016 2017 2018 2019 2020
(1) AFFO / Excludes positive earnings from Crest Net Lease, a subsidiary of Realty Income, as earnings do not reflect recurring business operations(2) FFO / Through 2020 where available / Includes all REITs currently included in MSCI REIT Index with earnings history since 2000 / Source: SNL
Historical Earnings Growth Rates (Median)
Realty Income (1): 5.1%
Current REITs (2): 3.1%
Compares favorably to REIT
median growth rates:
2008: -5.1%
2009: -6.9%
2010: -8.1%
12

13
Low Earnings Volatility Supports Low Share Price VolatilitySince 1994 NYSE listing, “O” annual TSR downside volatility is one of the lowest in the S&P 500
0%
5%
10%
15%
20%
25%
S&P 500
Deciles:
1st Decile 2nd Decile 3rd Decile 4th Decile 5th Decile 6th Decile 7th Decile 8th Decile 9th Decile 10th Decile
Annual Total Shareholder Return Among S&P 500 Companies:
Downside Volatility Since 1994(1)
Source: Bloomberg(1) “Downside volatility” calculated as the standard deviation of annual total shareholder returns where positive values are assigned “0” value(2) n=263 S&P 500 constituents with trading histories dating to Realty Income’s 1994 NYSE listing
Realty Income’s TSR Downside Volatility Since 1994
NYSE Listing is 3.5%, the 6th lowest of all S&P 500
constituents(2)
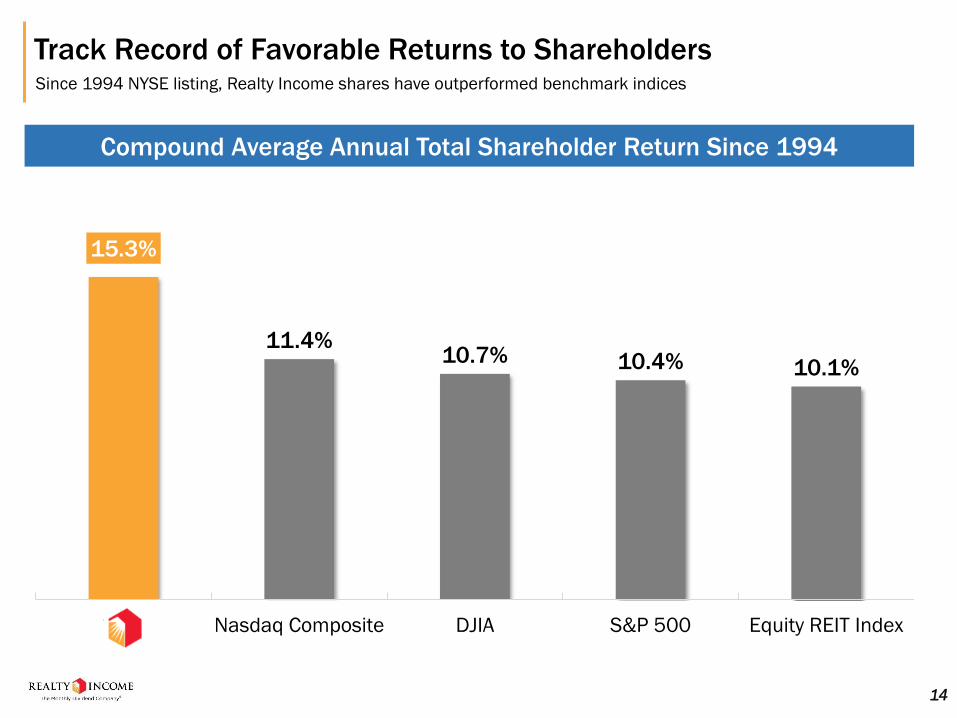
Track Record of Favorable Returns to Shareholders Since 1994 NYSE listing, Realty Income shares have outperformed benchmark indices
15.3%
11.4%10.7% 10.4% 10.1%
O Nasdaq Composite DJIA S&P 500 Equity REIT Index
Compound Average Annual Total Shareholder Return Since 1994
14
-10%
-5%
0%
5%
10%
15%
20%
25%
30%
35%
0.00.30.50.81.01.31.51.82.0
Tota
l R
etu
rn C
AG
R
Beta
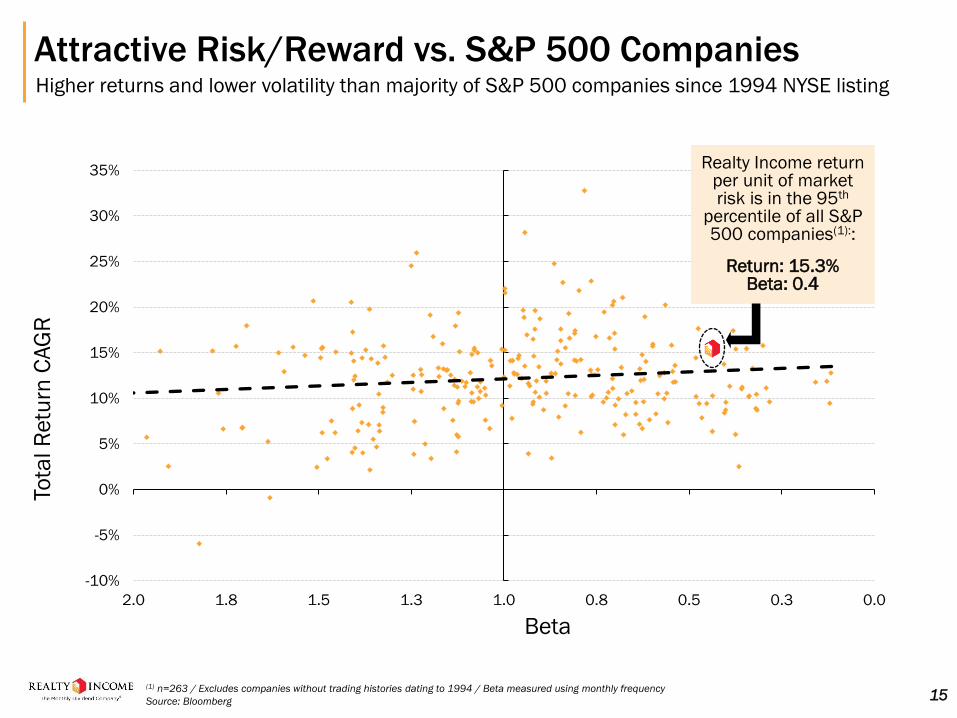
Attractive Risk/Reward vs. S&P 500 CompaniesHigher returns and lower volatility than majority of S&P 500 companies since 1994 NYSE listing
Realty Income return per
unit of market risk in the
98th percentile of all S&P
500 companies(1):
Beta: 0.39
Return: 16.4%
(1) n=263 / Excludes companies without trading histories dating to 1994 / Beta measured using monthly frequency
Source: Bloomberg
Realty Income return per unit of market risk is in the 95th
percentile of all S&P 500 companies(1)::
Return: 15.3%Beta: 0.4
15
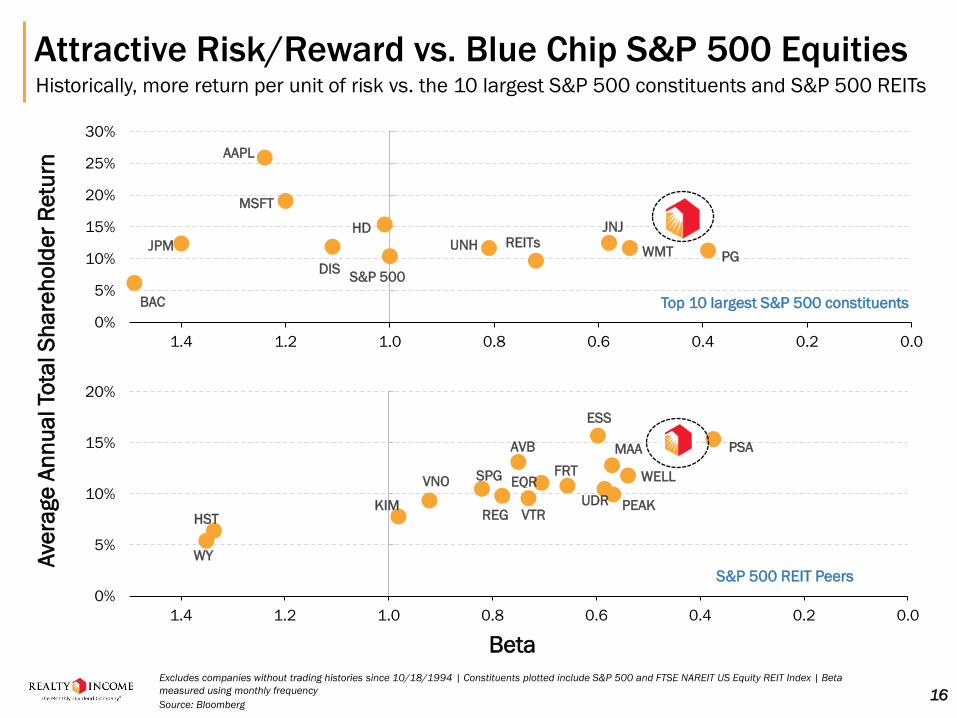
O
PSA
ESS
WELLFRTSPG
AVB
VTR
EQR
PEAKREG
VNO
KIM
WY
HST
UDR
MAA
0%
5%
10%
15%
20%
0.00.20.40.60.81.01.21.4
Beta
O
JNJ
WMT
BAC
AAPL
PG
HDREITs
MSFT
UNH
S&P 500
JPM
DIS
0%
5%
10%
15%
20%
25%
30%
0.00.20.40.60.81.01.21.4
Attractive Risk/Reward vs. Blue Chip S&P 500 Equities
Excludes companies without trading histories since 10/18/1994 | Constituents plotted include S&P 500 and FTSE NAREIT US Equity REIT Index | Beta
measured using monthly frequency
Source: Bloomberg
Historically, more return per unit of risk vs. the 10 largest S&P 500 constituents and S&P 500 REITs
16
Ave
rage
An
nu
al To
tal S
ha
reh
old
er
Re
turn
Top 10 largest S&P 500 constituents
S&P 500 REIT Peers
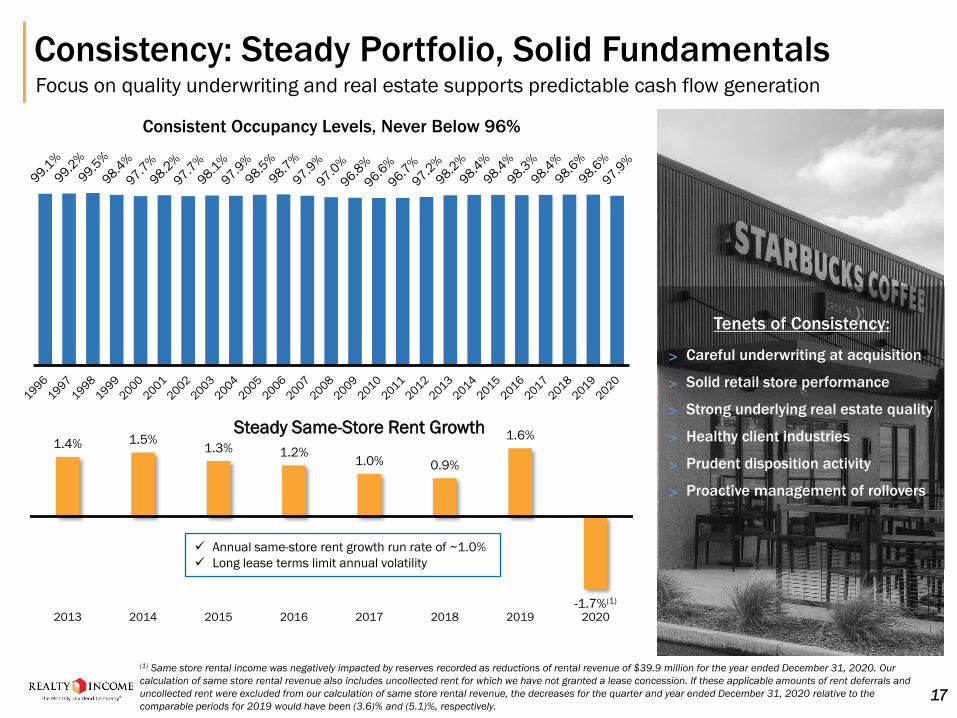
1.4% 1.5%1.3% 1.2%
1.0% 0.9%
1.6%
-1.7%(1)
2013 2014 2015 2016 2017 2018 2019 2020
Steady Same-Store Rent Growth
✓ Annual same-store rent growth run rate of ~1.0%
✓ Long lease terms limit annual volatility
Consistency: Steady Portfolio, Solid FundamentalsFocus on quality underwriting and real estate supports predictable cash flow generation
Consistent Occupancy Levels, Never Below 96%
˃ Careful underwriting at acquisition
˃ Solid retail store performance
˃ Strong underlying real estate quality
˃ Healthy client industries
˃ Prudent disposition activity
˃ Proactive management of rollovers
Tenets of Consistency:
17
(1) Same store rental income was negatively impacted by reserves recorded as reductions of rental revenue of $39.9 million for the year ended December 31, 2020. Our
calculation of same store rental revenue also includes uncollected rent for which we have not granted a lease concession. If these applicable amounts of rent deferrals and
uncollected rent were excluded from our calculation of same store rental revenue, the decreases for the quarter and year ended December 31, 2020 relative to the
comparable periods for 2019 would have been (3.6)% and (5.1)%, respectively.
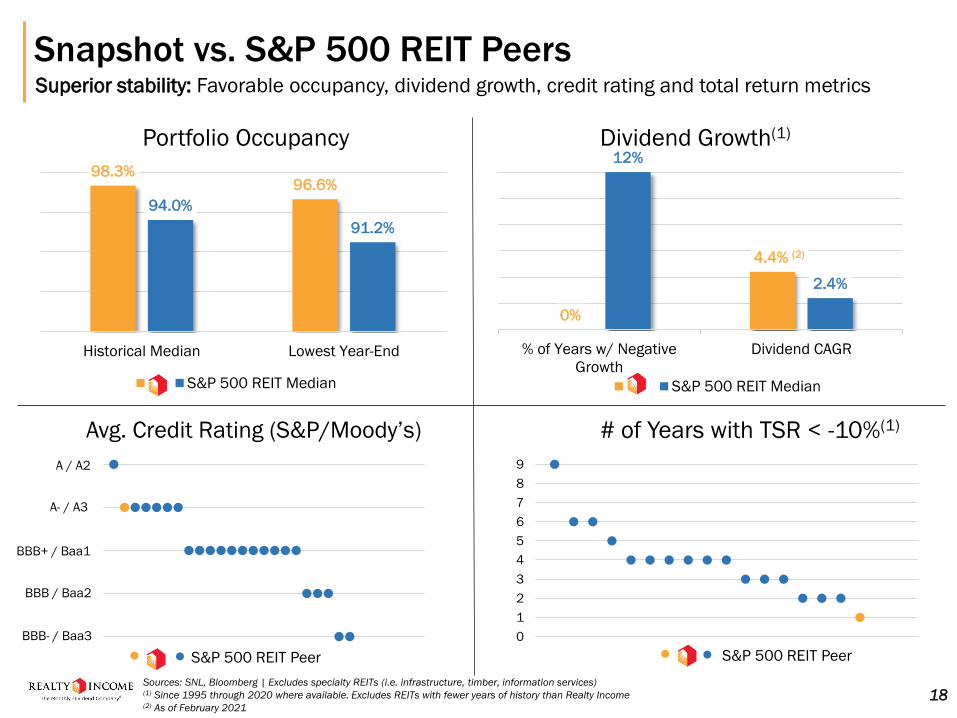
Snapshot vs. S&P 500 REIT Peers
Tenets of Consistency:
Superior stability: Favorable occupancy, dividend growth, credit rating and total return metrics
98.3%96.6%
94.0%
91.2%
Historical Median Lowest Year-End
Portfolio Occupancy
O S&P 500 REIT Median
0%
4.4% (2)
12%
2.4%
% of Years w/ Negative
Growth
Dividend CAGR
Dividend Growth(1)
O S&P 500 REIT Median
100%
200%
300%
400%
500%
0 10 20 30
Avg. Credit Rating (S&P/Moody’s)
BBB- / Baa3
BBB / Baa2
BBB+ / Baa1
A- / A3
A / A2
● ● S&P 500 REIT Peer
0
1
2
3
4
5
6
7
8
9
# of Years with TSR < -10%(1)
S&P 500 REIT Peer●●
Sources: SNL, Bloomberg | Excludes specialty REITs (i.e. infrastructure, timber, information services)(1) Since 1995 through 2020 where available. Excludes REITs with fewer years of history than Realty Income(2) As of February 2021
18

19
Superior Relative Volatility Metrics vs. A-Rated REITs During Recession2007 – 2009 relative rankings
0.3% 0.3% 0.4%
7.4%
0.1x 0%
0.2%0.7%
3.1%
3.7%
4.0%
4.2%
9.7%
0.5%
1.1%
1.4%
1.7%
1.7%
9.4%
0.6%
0.6%
3.8%
4.3%
5.7%
9.7%
31.9%
0.8%
1.3%
2.0%
2.2%
20.3%
0.3x
0.5x
2.2x
1.5x
2.2x
3.3x
2.2%
2.0%
1.2%
1.5%
2.8%
4.9%
0.3%
0.3%
0.7%
0.1%
3.4%
N/A(3)
Rental Revenue(1) Gross Margin(1) EBITDA(1) EBITDA Margin(1) Debt/EBITDA(2) Unsecured/Total Debt(1) Occupancy Rate(1)
Mo
re V
ola
tile
L
ess V
ola
tile 1
2
3
4
5
6
7
Realty Income; Other colored ovals represent REITs that currently have at least two A-/A3 credit ratings or better
(1) Downside Volatility calculated as the standard deviation around zero of quarterly percentage changes in each metric shown, where positive changes are replaced with zero(2) Upside Volatility calculated as the standard deviation around zero of quarterly percentage changes, where negative changes are replaced with zero(3) Company did not report consolidated quarterly portfolio occupancy during 2007-2009
Source: SNL
Rank
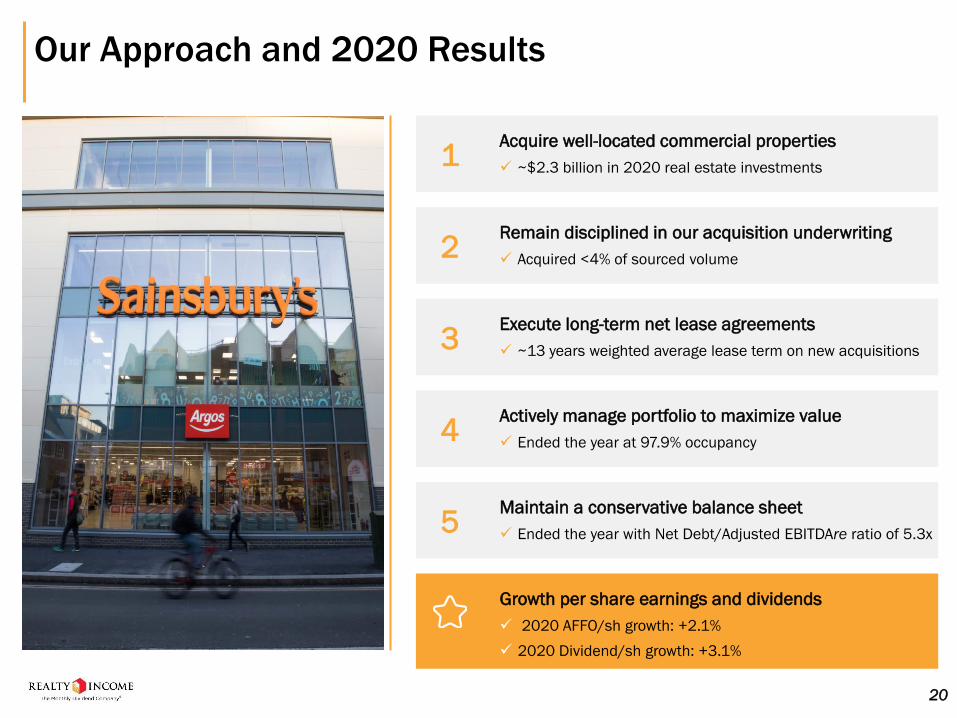
Our Approach and 2020 Results
20
Acquire well-located commercial properties
✓ ~$2.3 billion in 2020 real estate investments1
Remain disciplined in our acquisition underwriting
✓ Acquired <4% of sourced volume2
Execute long-term net lease agreements
✓ ~13 years weighted average lease term on new acquisitions3
Actively manage portfolio to maximize value
✓ Ended the year at 97.9% occupancy4
Maintain a conservative balance sheet
✓ Ended the year with Net Debt/Adjusted EBITDAre ratio of 5.3x5
Growth per share earnings and dividends
✓ 2020 AFFO/sh growth: +2.1%
✓ 2020 Dividend/sh growth: +3.1%
PORTFOLIO DIVERSIFICATION
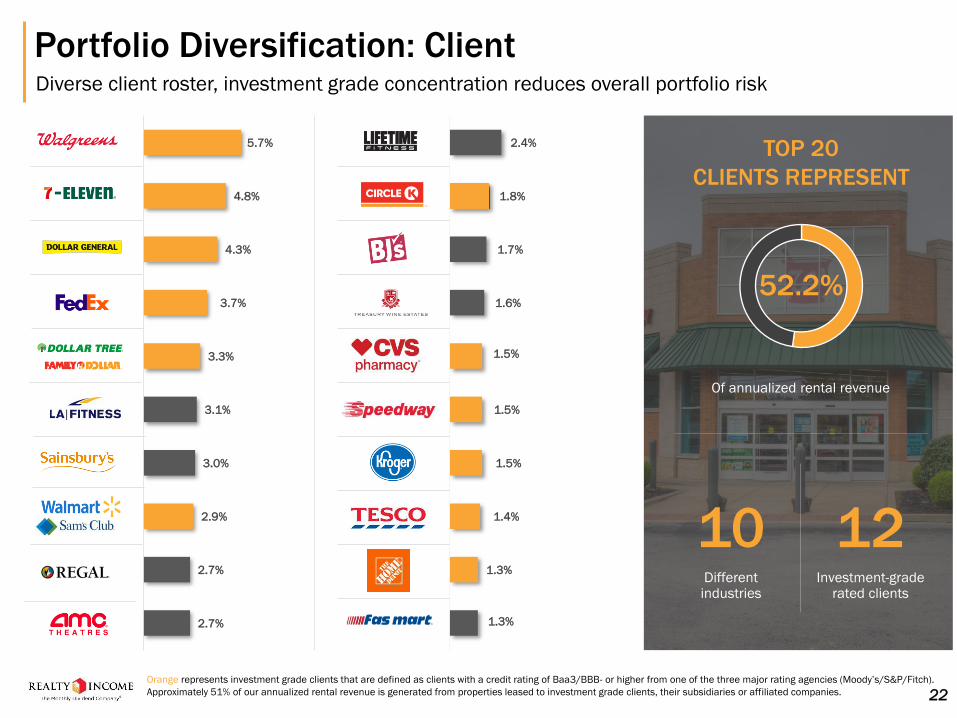
Portfolio Diversification: ClientDiverse client roster, investment grade concentration reduces overall portfolio risk
22Orange represents investment grade clients that are defined as clients with a credit rating of Baa3/BBB- or higher from one of the three major rating agencies (Moody’s/S&P/Fitch).
Approximately 51% of our annualized rental revenue is generated from properties leased to investment grade clients, their subsidiaries or affiliated companies.
TOP 20
CLIENTS REPRESENT
52.2%
Of annualized rental revenue
10Different industries
Investment-grade rated clients
5.7%
4.8%
4.3%
3.7%
3.3%
3.1%
3.0%
2.9%
2.7%
2.7%
2.4%
1.8%
1.7%
1.6%
1.5%
1.5%
1.5%
1.4%
1.3%
1.3%
12
Service-Oriented
Non-Discretionary
N/A (Non-Retail Exposure
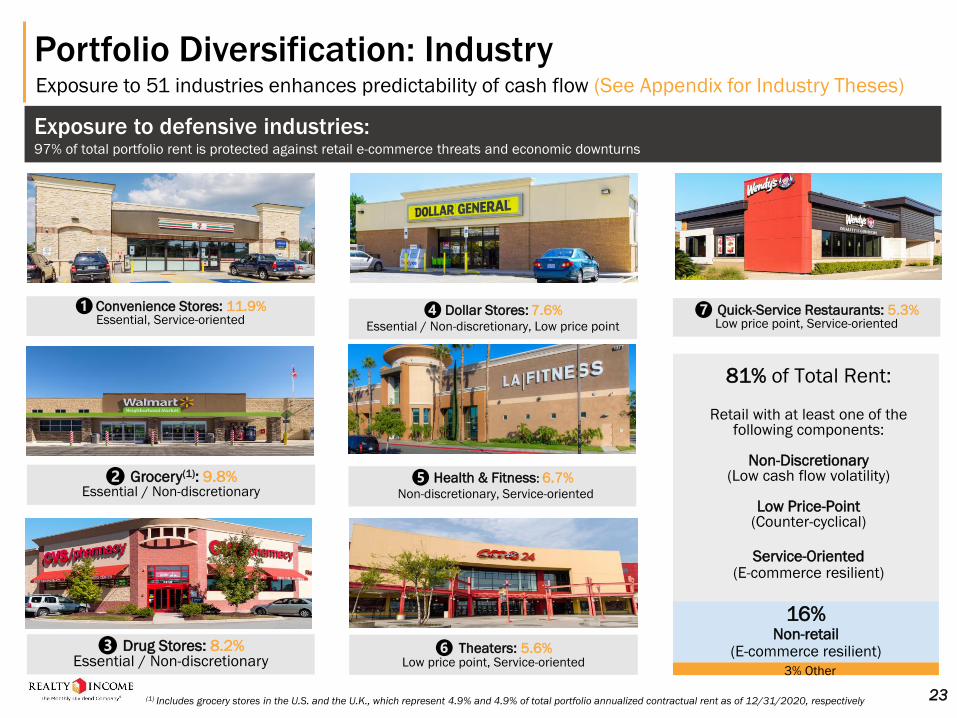
Portfolio Diversification: IndustryExposure to 51 industries enhances predictability of cash flow (See Appendix for Industry Theses)
Exposure to defensive industries:97% of total portfolio rent is protected against retail e-commerce threats and economic downturns
Non-Discretionary
Service-Oriented
Non-Discretionary, Low Price Point
Low Price Point
❶Convenience Stores: 11.9%Essential, Service-oriented
❸ Drug Stores: 8.2%Essential / Non-discretionary
❹Dollar Stores: 7.6%Essential / Non-discretionary, Low price point
❷ Grocery(1): 9.8%Essential / Non-discretionary
❼ Quick-Service Restaurants: 5.3%Low price point, Service-oriented
❻ Theaters: 5.6%Low price point, Service-oriented
❺ Health & Fitness: 6.7%Non-discretionary, Service-oriented
23
81% of Total Rent:
Retail with at least one of the following components:
Non-Discretionary(Low cash flow volatility)
Low Price-Point(Counter-cyclical)
Service-Oriented(E-commerce resilient)
16%Non-retail
(E-commerce resilient)
3% Other
(1) Includes grocery stores in the U.S. and the U.K., which represent 4.9% and 4.9% of total portfolio annualized contractual rent as of 12/31/2020, respectively
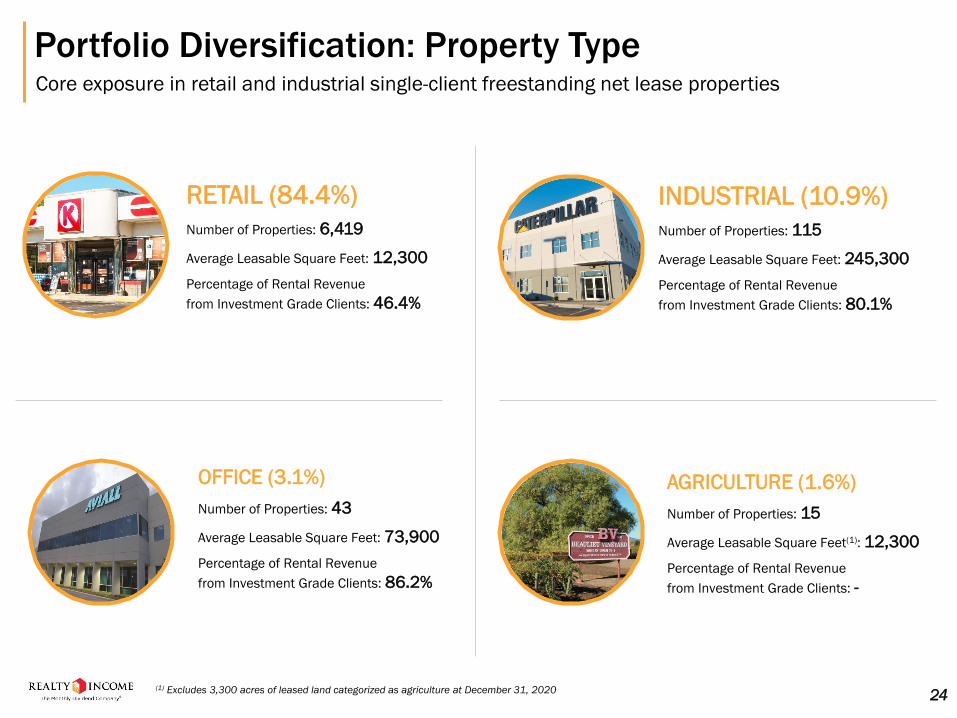
Portfolio Diversification: Property TypeCore exposure in retail and industrial single-client freestanding net lease properties
24
RETAIL (84.4%)
Number of Properties: 6,419
Average Leasable Square Feet: 12,300
Percentage of Rental Revenue
from Investment Grade Clients: 46.4%
OFFICE (3.1%)
Number of Properties: 43
Average Leasable Square Feet: 73,900
Percentage of Rental Revenue
from Investment Grade Clients: 86.2%
INDUSTRIAL (10.9%)
Number of Properties: 115
Average Leasable Square Feet: 245,300
Percentage of Rental Revenue
from Investment Grade Clients: 80.1%
AGRICULTURE (1.6%)
Number of Properties: 15
Average Leasable Square Feet(1): 12,300
Percentage of Rental Revenue
from Investment Grade Clients: -
(1) Excludes 3,300 acres of leased land categorized as agriculture at December 31, 2020
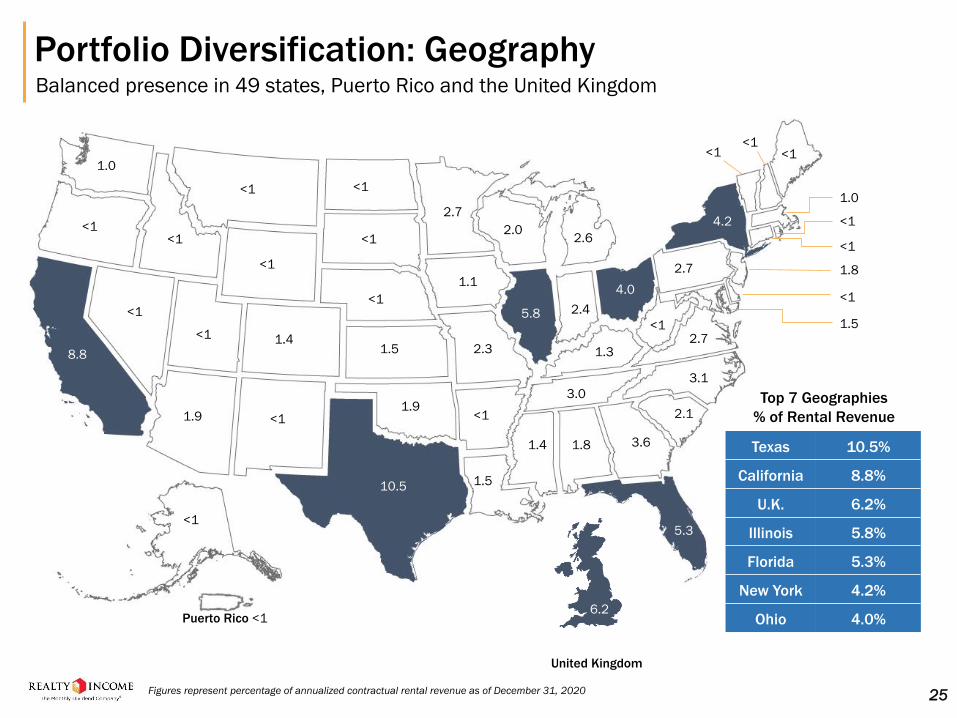
Portfolio Diversification: GeographyBalanced presence in 49 states, Puerto Rico and the United Kingdom
<1
1.0
<1
<1
<1
<1
<1
1.9
<1
1.4
<1
<1
<1
1.5
1.9
2.7
1.1
2.3
<1
1.5
1.4 1.8 3.6
2.1
3.1
3.0
2.02.6
2.4
1.3
2.7
<12.7
<1
Puerto Rico <1
<1<1<1
1.0
<1
<1
1.8
<1
1.5
8.8
10.5
5.8
4.0
4.2
5.3
Texas 10.5%
California 8.8%
U.K. 6.2%
Illinois 5.8%
Florida 5.3%
New York 4.2%
Ohio 4.0%
Top 7 Geographies
% of Rental Revenue
Figures represent percentage of annualized contractual rental revenue as of December 31, 2020 25
United Kingdom
6.2
DEFENSIVE RETAIL PORTFOLIO
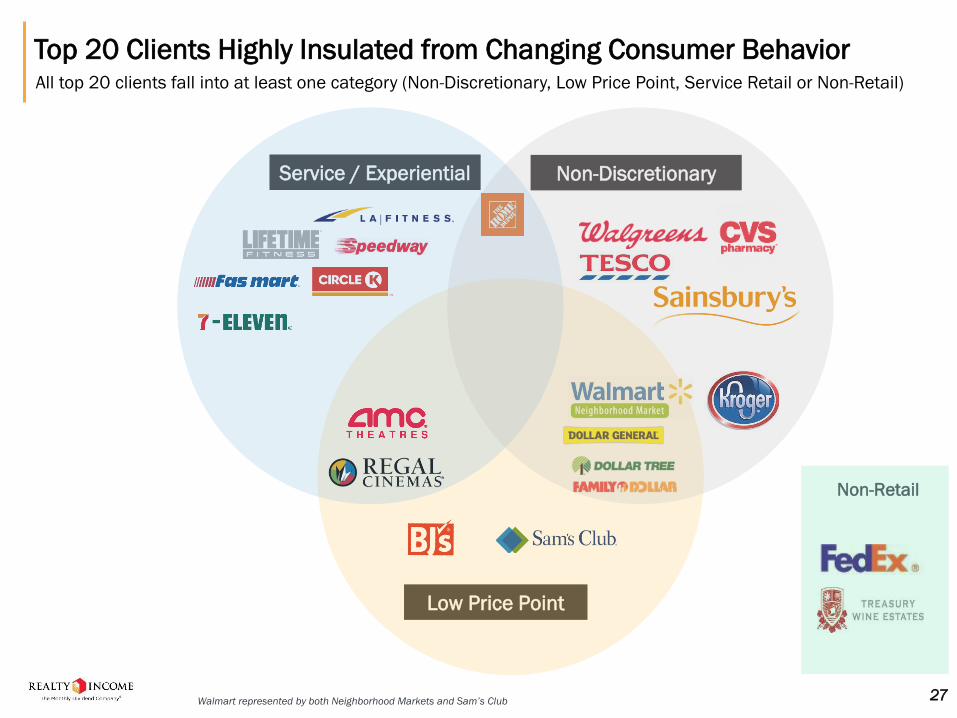
Low Price Point
Service / Experiential
Top 20 Clients Highly Insulated from Changing Consumer BehaviorAll top 20 clients fall into at least one category (Non-Discretionary, Low Price Point, Service Retail or Non-Retail)
Non-Retail
Walmart represented by both Neighborhood Markets and Sam’s Club 27
Non-Discretionary
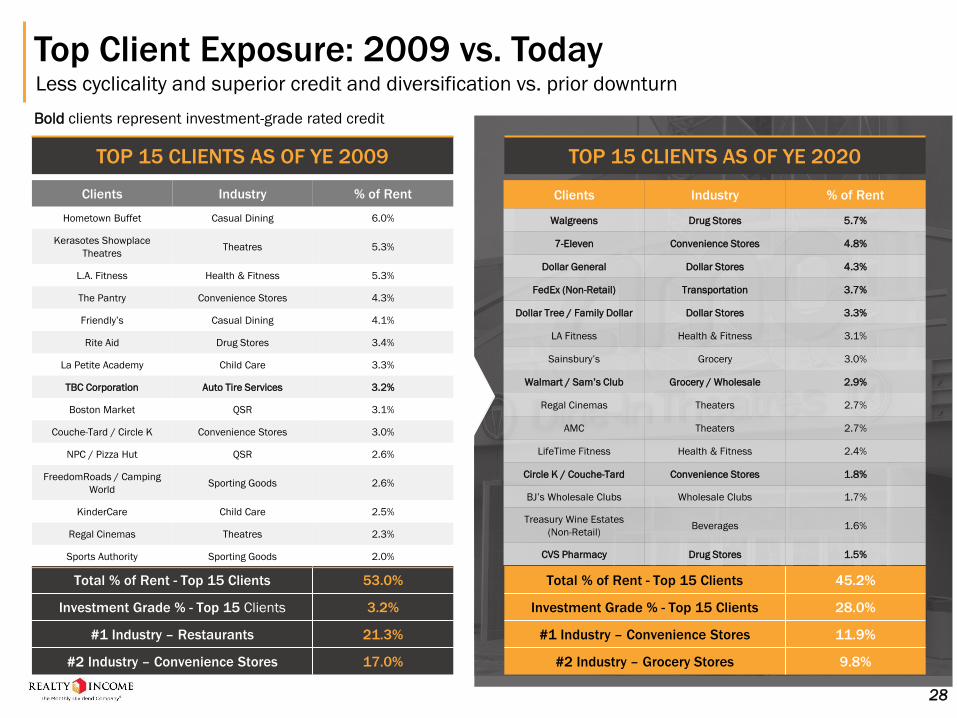
Total % of Rent - Top 15 Clients 45.2%
Investment Grade % - Top 15 Clients 28.0%
#1 Industry – Convenience Stores 11.9%
#2 Industry – Grocery Stores 9.8%
Total % of Rent - Top 15 Clients 53.0%
Investment Grade % - Top 15 Clients 3.2%
#1 Industry – Restaurants 21.3%
#2 Industry – Convenience Stores 17.0%
Top Client Exposure: 2009 vs. TodayLess cyclicality and superior credit and diversification vs. prior downturn
28
TOP 15 CLIENTS AS OF YE 2009 TOP 15 CLIENTS AS OF YE 2020
Clients Industry % of Rent
Hometown Buffet Casual Dining 6.0%
Kerasotes Showplace
TheatresTheatres 5.3%
L.A. Fitness Health & Fitness 5.3%
The Pantry Convenience Stores 4.3%
Friendly’s Casual Dining 4.1%
Rite Aid Drug Stores 3.4%
La Petite Academy Child Care 3.3%
TBC Corporation Auto Tire Services 3.2%
Boston Market QSR 3.1%
Couche-Tard / Circle K Convenience Stores 3.0%
NPC / Pizza Hut QSR 2.6%
FreedomRoads / Camping
WorldSporting Goods 2.6%
KinderCare Child Care 2.5%
Regal Cinemas Theatres 2.3%
Sports Authority Sporting Goods 2.0%
Clients Industry % of Rent
Walgreens Drug Stores 5.7%
7-Eleven Convenience Stores 4.8%
Dollar General Dollar Stores 4.3%
FedEx (Non-Retail) Transportation 3.7%
Dollar Tree / Family Dollar Dollar Stores 3.3%
LA Fitness Health & Fitness 3.1%
Sainsbury’s Grocery 3.0%
Walmart / Sam’s Club Grocery / Wholesale 2.9%
Regal Cinemas Theaters 2.7%
AMC Theaters 2.7%
LifeTime Fitness Health & Fitness 2.4%
Circle K / Couche-Tard Convenience Stores 1.8%
BJ’s Wholesale Clubs Wholesale Clubs 1.7%
Treasury Wine Estates
(Non-Retail)Beverages 1.6%
CVS Pharmacy Drug Stores 1.5%
Bold clients represent investment-grade rated credit
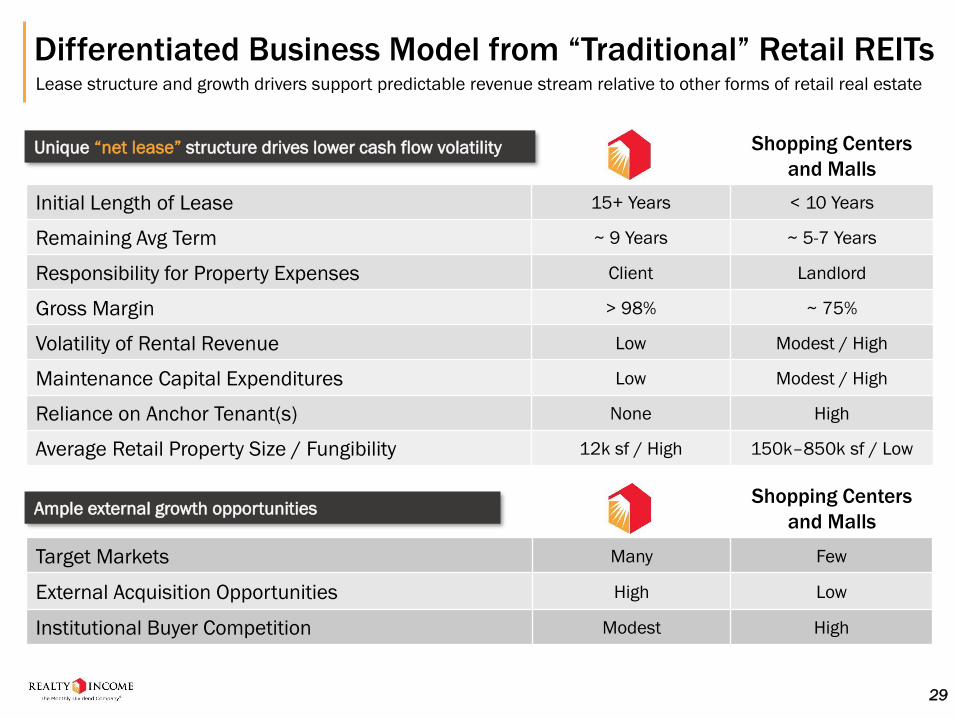
Differentiated Business Model from “Traditional” Retail REITsLease structure and growth drivers support predictable revenue stream relative to other forms of retail real estate
Initial Length of Lease 15+ Years < 10 Years
Remaining Avg Term ~ 9 Years ~ 5-7 Years
Responsibility for Property Expenses Client Landlord
Gross Margin > 98% ~ 75%
Volatility of Rental Revenue Low Modest / High
Maintenance Capital Expenditures Low Modest / High
Reliance on Anchor Tenant(s) None High
Average Retail Property Size / Fungibility 12k sf / High 150k–850k sf / Low
Target Markets Many Few
External Acquisition Opportunities High Low
Institutional Buyer Competition Modest High
Ample external growth opportunities
Unique “net lease” structure drives lower cash flow volatility Shopping Centers
and Malls
Shopping Centers
and Malls
29

Realty Income Not Materially Impacted by Recent Retailer Bankruptcies
Retail Industry# of
BKRetailer Bankruptcy
RI
Exposure
Apparel 34
True Religion| Wet Seal| BCBG Max Azria| Limited Stores| Rue21| Gymboree| Vanity Shop| Papaya Clothing|
Alfredo Angelo| Styles for Less | A’gaci | David’s Bridal | Full Beauty | Charlotte Russe | Diesel | Dressbarn |
Avenue Stores | Bon Worth | Forever 21 | Destination Maternity | Mosaic Fashions | Bluestem Brands |
Nygard Stores | J.C. Penney | J.Crew | Centric Brands | Ascena |RTW | Lucky Brand | Brooks Brothers |
Tailored Brands | Men’s Wearhouse | Francesca’s | Christopher & Banks
< 1%
Specialty 18Perfumania| Vitamin World | Kiko | Brookstone | Mattress Firm| Beauty Brands | Innovative Mattress
Solutions | Things Remembered| Z Gallerie | Charming Charlie | Barney’s | Sugarfina | Papyrus | Creative
Hairdressers | GNC | The Paper Store | Guitar Center | L’Occitane< 1%
Shoe Stores 8Aerosoles | Charlotte Olympia | The Walking Company | Nine West | Rockport | Aldo | Payless ShoeSource |
LK Bennett < 1%
General Merchandise 15Gordmans | Bon-Ton | Sears | Shopko | Fallas | Fred’s | Pier 1 | Art Van | Stage Stores | Tuesday Morning |
Sur La Table | Lord & Taylor | Stein Mart | Furniture Factory Ultimate | Love’s Furniture < 1%
Sporting Goods 6Eastern Outfitters / Bob’s Stores| Gander Mountain| MC Sports| Remington Outdoor | Advanced Sports |
Modell’s Sporting Goods < 1%
Grocery 8Tops Market | Marsh Supermarkets | Southeastern Grocers | Seasons | Lucky’s | Fairway Group Holdings|
Earth Fare | KB US Holdings < 1%
Restaurants 30
Macaroni Grill | Bertucci’s | RMH Franchise | Taco Bueno| Kona Grill | RUI HLD | Perkins & Marie Callender’s
| Star Chain | Houlihan’s | Capital Rest. Group | Krystal | American Blue Ribbon | BL Rest. HLD | SD Rest.
Group | Cosi | CraftWorks| FoodFirst | Le Pain Quotidien | Garden Fresh Rest. | Sustainable Restaurant HLD |
CFRA HLD | Chuck E. Cheese | NPC | KG IM | CPK | Ruby Tuesday | 1069 Restaurant Group| Rubios |
Friendly’s | CiCi’s Holdings
~ 1%
Entertainment 4 Goodrich Quality Theatres | TZEW Holdco (Apex Parks) | Cinemex | New Vision Cinemas < 1%
Jewelry / Accessories 3 Charming Charlie| Claire’s | Samuels Jewelers 0%
Consumer Electronics 2 RadioShack | hhgregg 0%
Other 8Toys ‘R’ Us | Gold’s Gym | Hertz | 24 Hour Fitness | Town Sports International| Benevis | YouFit Health Club |
In-Shape < 1%
Total Realty Income Exposure (% of Rent) : ~ 3%
100 of 136 U.S. retailer bankruptcies since 2017 associated with companies lacking a non-discretionary, low price point, and / or service-oriented component to their business
Red retailers represent businesses lacking either a non-discretionary, low price point, and / or service-oriented component 30

ASSET MANAGEMENT &
REAL ESTATE OPERATIONS
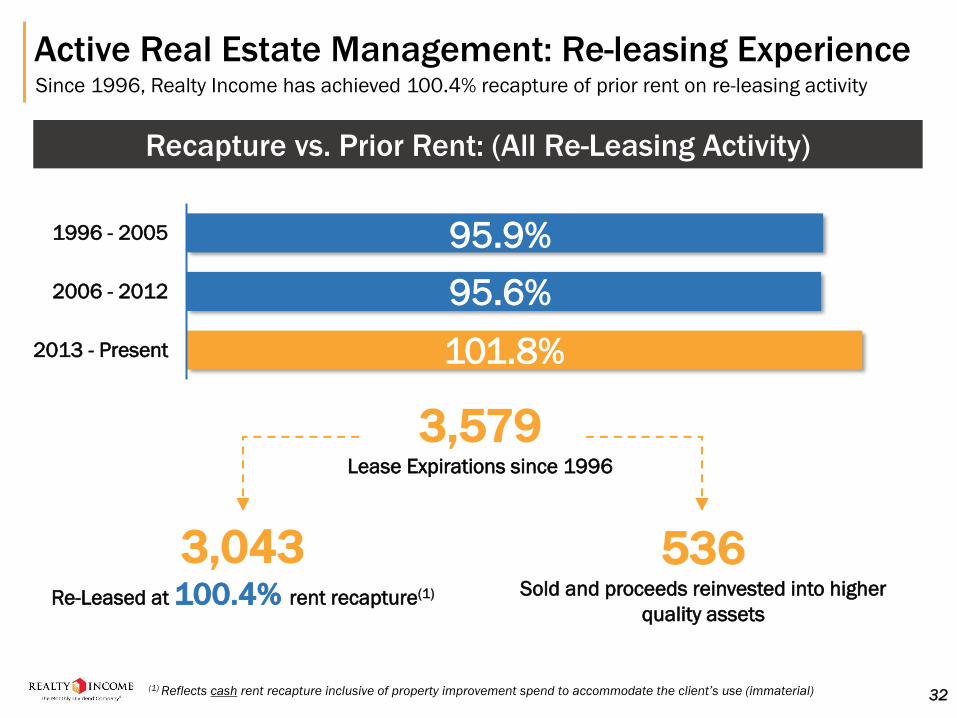
Active Real Estate Management: Re-leasing ExperienceSince 1996, Realty Income has achieved 100.4% recapture of prior rent on re-leasing activity
Recapture vs. Prior Rent: (All Re-Leasing Activity)
101.8%
95.6%
95.9%
2013 - Present
2006 - 2012
1996 - 2005
3,579Lease Expirations since 1996
3,043Re-Leased at 100.4% rent recapture(1)
536Sold and proceeds reinvested into higher
quality assets
(1) Reflects cash rent recapture inclusive of property improvement spend to accommodate the client’s use (immaterial) 32
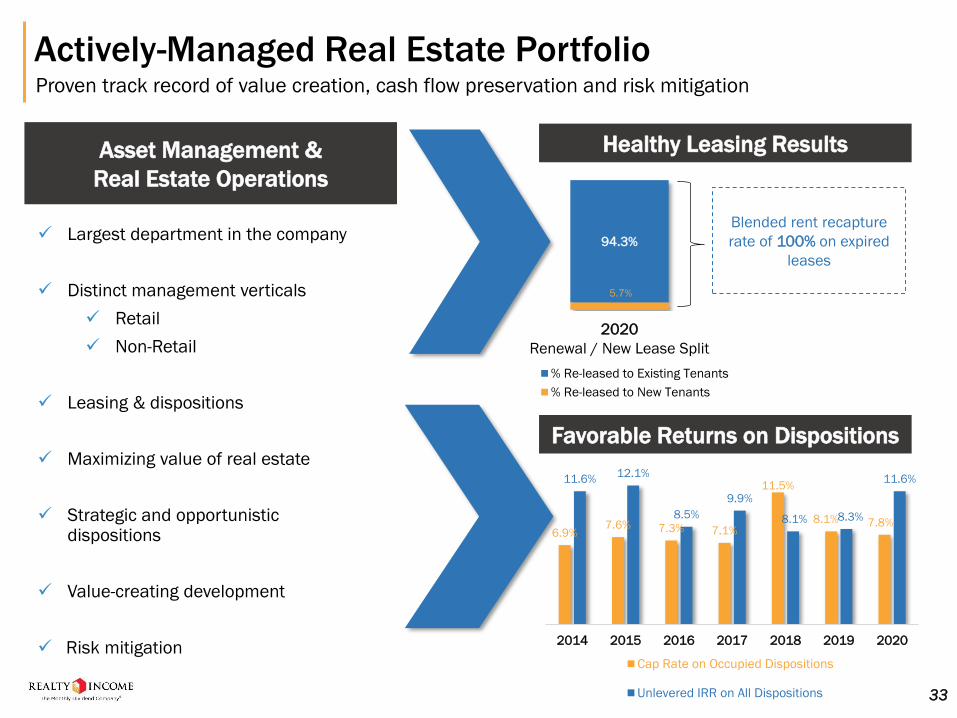
Actively-Managed Real Estate PortfolioProven track record of value creation, cash flow preservation and risk mitigation
✓ Largest department in the company
✓ Distinct management verticals
✓ Retail
✓ Non-Retail
✓ Leasing & dispositions
✓ Maximizing value of real estate
✓ Strategic and opportunistic dispositions
✓ Value-creating development
✓ Risk mitigation
Healthy Leasing Results
6.9%7.6% 7.3% 7.1%
11.5%
8.1% 7.8%
11.6%12.1%
8.5%
9.9%
8.1% 8.3%
11.6%
2014 2015 2016 2017 2018 2019 2020
Cap Rate on Occupied Dispositions
Unlevered IRR on All Dispositions 33
5.7%
94.3%
% Re-leased to Existing Tenants
% Re-leased to New Tenants
Blended rent recapture
rate of 100% on expired
leases
2020
Renewal / New Lease Split
Favorable Returns on Dispositions
Asset Management &
Real Estate Operations
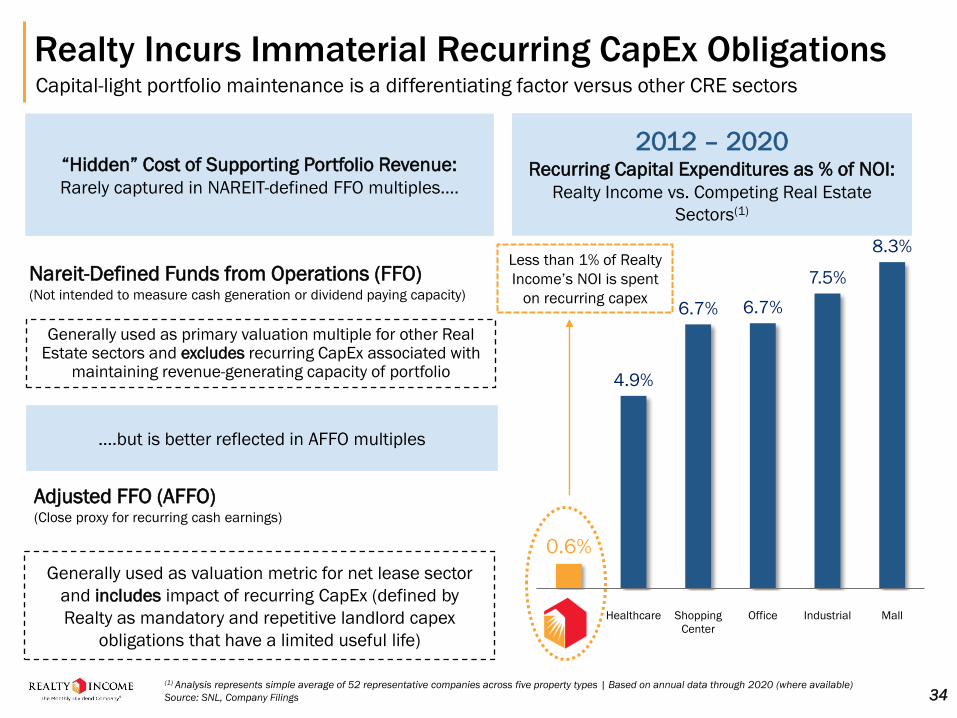
0.6%
4.9%
6.7% 6.7%
7.5%
8.3%
O Healthcare Shopping
Center
Office Industrial Mall
Realty Incurs Immaterial Recurring CapEx ObligationsCapital-light portfolio maintenance is a differentiating factor versus other CRE sectors
34
Less than 1% of Realty
Income’s NOI is spent
on recurring capex
Adjusted FFO (AFFO)(Close proxy for recurring cash earnings)
Nareit-Defined Funds from Operations (FFO)(Not intended to measure cash generation or dividend paying capacity)
Generally used as primary valuation multiple for other Real Estate sectors and excludes recurring CapEx associated with
maintaining revenue-generating capacity of portfolio
Generally used as valuation metric for net lease sector
and includes impact of recurring CapEx (defined by
Realty as mandatory and repetitive landlord capex
obligations that have a limited useful life)
2012 – 2020 Recurring Capital Expenditures as % of NOI:
Realty Income vs. Competing Real Estate
Sectors(1)
“Hidden” Cost of Supporting Portfolio Revenue:
Rarely captured in NAREIT-defined FFO multiples….
….but is better reflected in AFFO multiples
(1) Analysis represents simple average of 52 representative companies across five property types | Based on annual data through 2020 (where available)
Source: SNL, Company Filings

INVESTMENT STRATEGY

Investment Strategy: Key ConsiderationsCost of capital advantage, size, track record represent competitive advantage
36
COMPETITIVE ADVANTAGES VS. NET LEASE PEERS
Supports investment selectivity
Drives faster earnings growth (wider margins)
Critical in industry reliant on external growth
Ability to buy “wholesale” (at a discount) without creating client concentration issues
Access to liquidity ($3 billion multi-currency revolver, with $1 billion accordion feature, which is subject to obtaining lender commitments)
Relationships developed since 1969
1
2
3
1
2
3
SIZE AND TRACK RECORDLOW COST OF CAPITAL
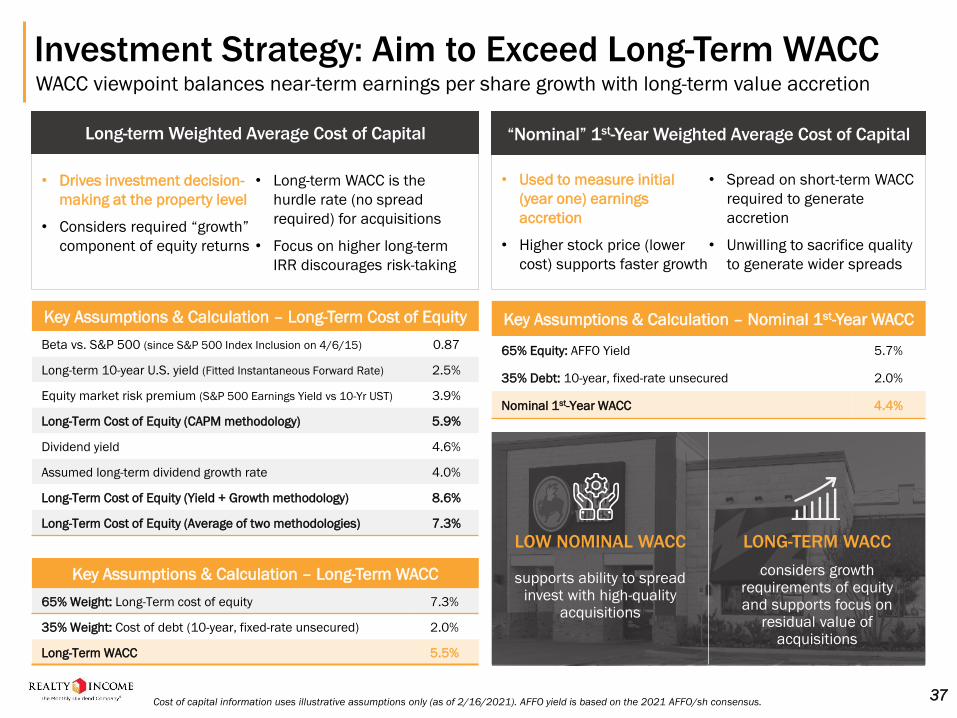
Investment Strategy: Aim to Exceed Long-Term WACCWACC viewpoint balances near-term earnings per share growth with long-term value accretion
37Cost of capital information uses illustrative assumptions only (as of 2/16/2021). AFFO yield is based on the 2021 AFFO/sh consensus.
Long-term Weighted Average Cost of Capital “Nominal” 1st-Year Weighted Average Cost of Capital
• Drives investment decision-
making at the property level
• Considers required “growth”
component of equity returns
• Long-term WACC is the
hurdle rate (no spread
required) for acquisitions
• Focus on higher long-term
IRR discourages risk-taking
• Used to measure initial
(year one) earnings
accretion
• Higher stock price (lower
cost) supports faster growth
• Spread on short-term WACC
required to generate
accretion
• Unwilling to sacrifice quality
to generate wider spreads
Key Assumptions & Calculation – Nominal 1st-Year WACC
65% Equity: AFFO Yield 5.7%
35% Debt: 10-year, fixed-rate unsecured 2.0%
Nominal 1st-Year WACC 4.4%
Key Assumptions & Calculation – Long-Term Cost of Equity
Beta vs. S&P 500 (since S&P 500 Index Inclusion on 4/6/15) 0.87
Long-term 10-year U.S. yield (Fitted Instantaneous Forward Rate) 2.5%
Equity market risk premium (S&P 500 Earnings Yield vs 10-Yr UST) 3.9%
Long-Term Cost of Equity (CAPM methodology) 5.9%
Dividend yield 4.6%
Assumed long-term dividend growth rate 4.0%
Long-Term Cost of Equity (Yield + Growth methodology) 8.6%
Long-Term Cost of Equity (Average of two methodologies) 7.3%
Key Assumptions & Calculation – Long-Term WACC
65% Weight: Long-Term cost of equity 7.3%
35% Weight: Cost of debt (10-year, fixed-rate unsecured) 2.0%
Long-Term WACC 5.5%
LOW NOMINAL WACC LONG-TERM WACC
supports ability to spread invest with high-quality
acquisitions
considers growth requirements of equity and supports focus on
residual value of acquisitions
5.0%
5.5%
6.0%
6.5%
7.0%
7.5%
8.0%
4.0
0%
4.2
5%
4.5
0%
4.7
5%
5.0
0%
5.2
5%
5.5
0%
5.7
5%
6.0
0%
6.2
5%
Acq
uis
itio
n C
ap
Ra
te t
o A
ch
ieve
15
0 b
ps S
pre
ad
s
Nominal 1st-Year WACC
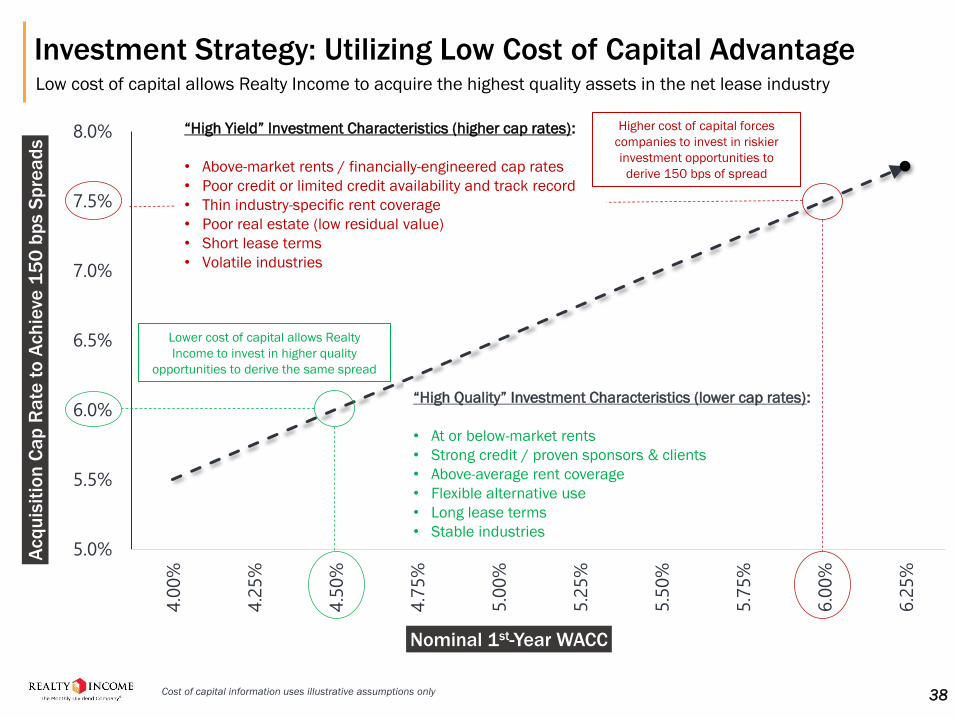
“High Quality” Investment Characteristics (lower cap rates):
• At or below-market rents
• Strong credit / proven sponsors & clients
• Above-average rent coverage
• Flexible alternative use
• Long lease terms
• Stable industries
Lower cost of capital allows Realty
Income to invest in higher quality
opportunities to derive the same spread
Investment Strategy: Utilizing Low Cost of Capital AdvantageLow cost of capital allows Realty Income to acquire the highest quality assets in the net lease industry
Cost of capital information uses illustrative assumptions only 38
“High Yield” Investment Characteristics (higher cap rates):
• Above-market rents / financially-engineered cap rates
• Poor credit or limited credit availability and track record
• Thin industry-specific rent coverage
• Poor real estate (low residual value)
• Short lease terms
• Volatile industries
Higher cost of capital forces
companies to invest in riskier
investment opportunities to
derive 150 bps of spread
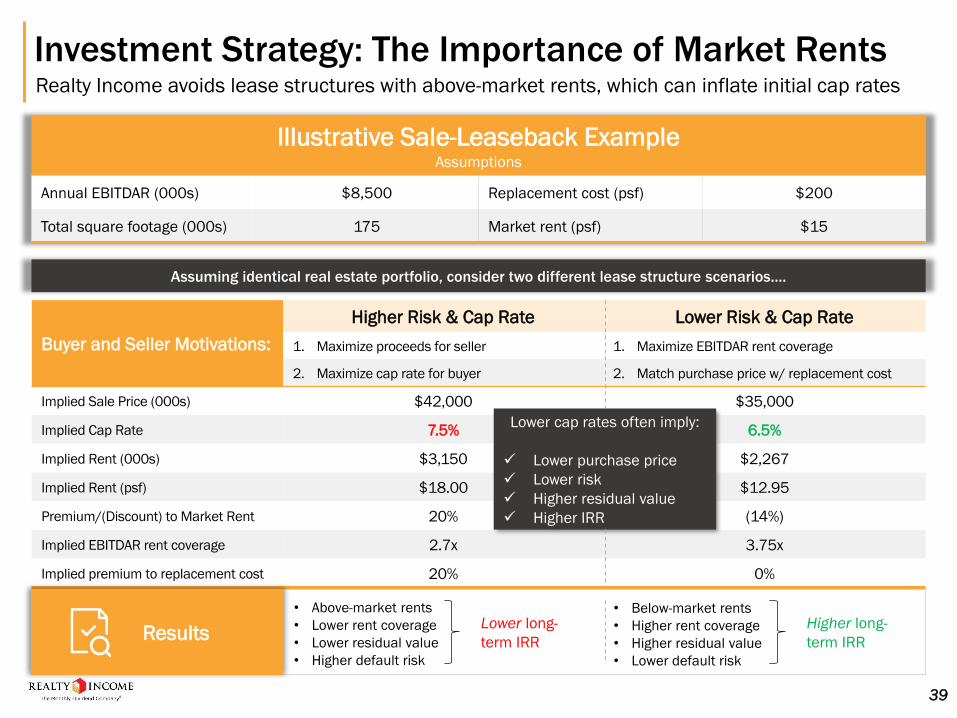
Investment Strategy: The Importance of Market RentsRealty Income avoids lease structures with above-market rents, which can inflate initial cap rates
39
Illustrative Sale-Leaseback ExampleAssumptions
Annual EBITDAR (000s) $8,500 Replacement cost (psf) $200
Total square footage (000s) 175 Market rent (psf) $15
Assuming identical real estate portfolio, consider two different lease structure scenarios….
Buyer and Seller Motivations:
Higher Risk & Cap Rate Lower Risk & Cap Rate
1. Maximize proceeds for seller 1. Maximize EBITDAR rent coverage
2. Maximize cap rate for buyer 2. Match purchase price w/ replacement cost
Implied Sale Price (000s) $42,000 $35,000
Implied Cap Rate 7.5% 6.5%
Implied Rent (000s) $3,150 $2,267
Implied Rent (psf) $18.00 $12.95
Premium/(Discount) to Market Rent 20% (14%)
Implied EBITDAR rent coverage 2.7x 3.75x
Implied premium to replacement cost 20% 0%
Lower cap rates often imply:
✓ Lower purchase price
✓ Lower risk
✓ Higher residual value
✓ Higher IRR
• Above-market rents
• Lower rent coverage
• Lower residual value
• Higher default risk
• Below-market rents
• Higher rent coverage
• Higher residual value
• Lower default risk
ResultsLower long-
term IRR
Higher long-
term IRR
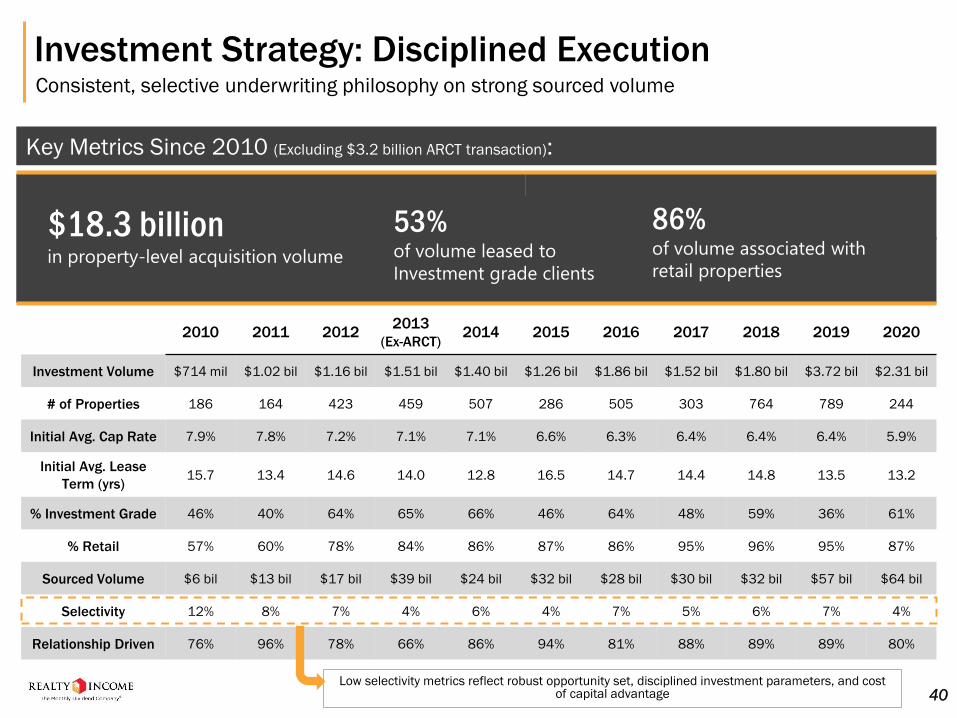
$18.3 billionin property-level acquisition volume
86%of volume associated with
retail properties
53%of volume leased to
Investment grade clients
Investment Strategy: Disciplined ExecutionConsistent, selective underwriting philosophy on strong sourced volume
2010 2011 20122013
(Ex-ARCT)2014 2015 2016 2017 2018 2019 2020
Investment Volume $714 mil $1.02 bil $1.16 bil $1.51 bil $1.40 bil $1.26 bil $1.86 bil $1.52 bil $1.80 bil $3.72 bil $2.31 bil
# of Properties 186 164 423 459 507 286 505 303 764 789 244
Initial Avg. Cap Rate 7.9% 7.8% 7.2% 7.1% 7.1% 6.6% 6.3% 6.4% 6.4% 6.4% 5.9%
Initial Avg. Lease
Term (yrs)15.7 13.4 14.6 14.0 12.8 16.5 14.7 14.4 14.8 13.5 13.2
% Investment Grade 46% 40% 64% 65% 66% 46% 64% 48% 59% 36% 61%
% Retail 57% 60% 78% 84% 86% 87% 86% 95% 96% 95% 87%
Sourced Volume $6 bil $13 bil $17 bil $39 bil $24 bil $32 bil $28 bil $30 bil $32 bil $57 bil $64 bil
Selectivity 12% 8% 7% 4% 6% 4% 7% 5% 6% 7% 4%
Relationship Driven 76% 96% 78% 66% 86% 94% 81% 88% 89% 89% 80%
Key Metrics Since 2010 (Excluding $3.2 billion ARCT transaction):
40Low selectivity metrics reflect robust opportunity set, disciplined investment parameters, and cost
of capital advantage

CAPITAL STRUCTURE &SCALABILITY

25%
1%
1%
Common Stock,
72%
Debt,
28%
Unsecured Notes: $8.30 billion
Revolving Credit Facility: $0 balance
Mortgages: $300 million
Unsecured Term Loan: $250 million
Equity Market Cap: $22.5 billion
Conservative Capital StructureModest leverage, low cost of capital, ample liquidity provides financial flexibility
Unsecured Debt Ratings: Moody’s A3 | S&P A-
42
Debt amounts reflect principal value / Numbers may not foot due to rounding(1) Includes the principal balance (in U.S. dollars) of the Sterling-denominated note offering and Sterling-denominated private placement of £400 million and £315 million, respectively, which approximates $546.8 million and $430.6 million, respectively, converted at the applicable exchange rates as of 12/31/2020.(2) In January 2021, we completed the early redemption on all $950.0 million in principal amount of our outstanding 3.250% notes due October 2022, plus accrued and unpaid interest.(3) The revolver has a $1 billion accordion feature, which is subject to obtaining lender commitments.
Total Enterprise Value: $30.5 billion
(3)
(1)(2)
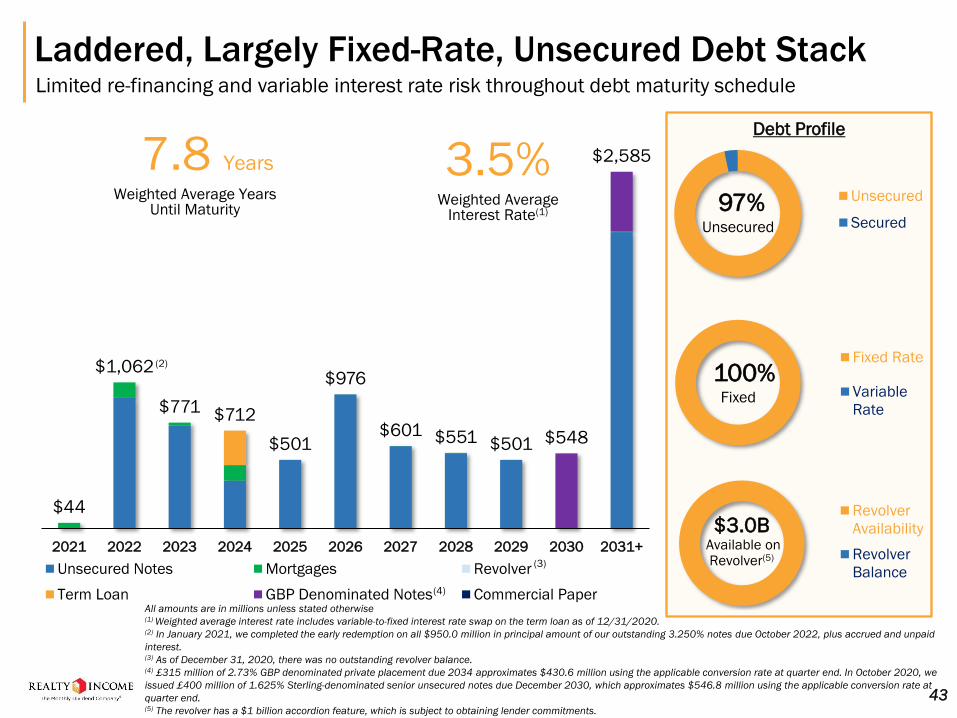
$44
$1,062
$771 $712
$501
$976
$601 $551 $501 $548
$2,585
2021 2022 2023 2024 2025 2026 2027 2028 2029 2030 2031+
Unsecured Notes Mortgages Revolver
Term Loan GBP Denominated Notes Commercial Paper
7.8 Years
Weighted Average Years Until Maturity
3.5%Weighted Average
Interest Rate(1)
Debt Profile
Laddered, Largely Fixed-Rate, Unsecured Debt StackLimited re-financing and variable interest rate risk throughout debt maturity schedule
All amounts are in millions unless stated otherwise(1) Weighted average interest rate includes variable-to-fixed interest rate swap on the term loan as of 12/31/2020.(2) In January 2021, we completed the early redemption on all $950.0 million in principal amount of our outstanding 3.250% notes due October 2022, plus accrued and unpaid
interest.(3) As of December 31, 2020, there was no outstanding revolver balance.(4) £315 million of 2.73% GBP denominated private placement due 2034 approximates $430.6 million using the applicable conversion rate at quarter end. In October 2020, we
issued £400 million of 1.625% Sterling-denominated senior unsecured notes due December 2030, which approximates $546.8 million using the applicable conversion rate at
quarter end.(5) The revolver has a $1 billion accordion feature, which is subject to obtaining lender commitments.
43
Unsecured
Secured
Fixed Rate
Variable
Rate
Revolver
Availability
Revolver
Balance
97%Unsecured
100%Fixed
$3.0BAvailable on Revolver(5)
(3)
(4)
(2)

Scalability as a Competitive AdvantageLeaders in the net lease industry in efficiency and ability to buy in bulk
5.8%
4.4%
G&A as % of Rental Revenue(1)
(1) 2018 G&A excludes $18.7 million severance to former CEO paid in 4Q18 | 2020 G&A excludes $3.5 million severance to former CFO paid in 1Q20 | percentage of rental
revenue calculation excludes contractually obligated reimbursements by our clients(2) Assumes 6.0% cap rate
64 bps
33 bps
G&A as % of Gross RE Book Value (bps)
92.4%94.0%
Adjusted EBITDAre Margin
Larger Size Drives Superior Overhead Efficiency
44
Larger Size Provides Growth Optionality
$100 $200 $300 $400 $500 $1,000
$200 3% 6% 8% 11% 13% 23%
$400 1% 3% 4% 6% 7% 13%
$600 1% 2% 3% 4% 5% 9%
$800 1% 1% 2% 3% 4% 7%
$1,000 1% 1% 2% 2% 3% 6%
$1,700 <1% <1% 1% <2% <2% 3%
Transaction Size & Impact(2) to Rent Concentration
Current
Rent
Size allows Realty Income to pursue large sale-
leaseback transactions without compromising prudent
client and industry diversification metrics
in millions
Current Net Lease Peer Median: 8.4%
Current Net Lease Peer Median: 88.4%
Current Net Lease Peer Median: 67 bps

DEPENDABLE DIVIDENDS
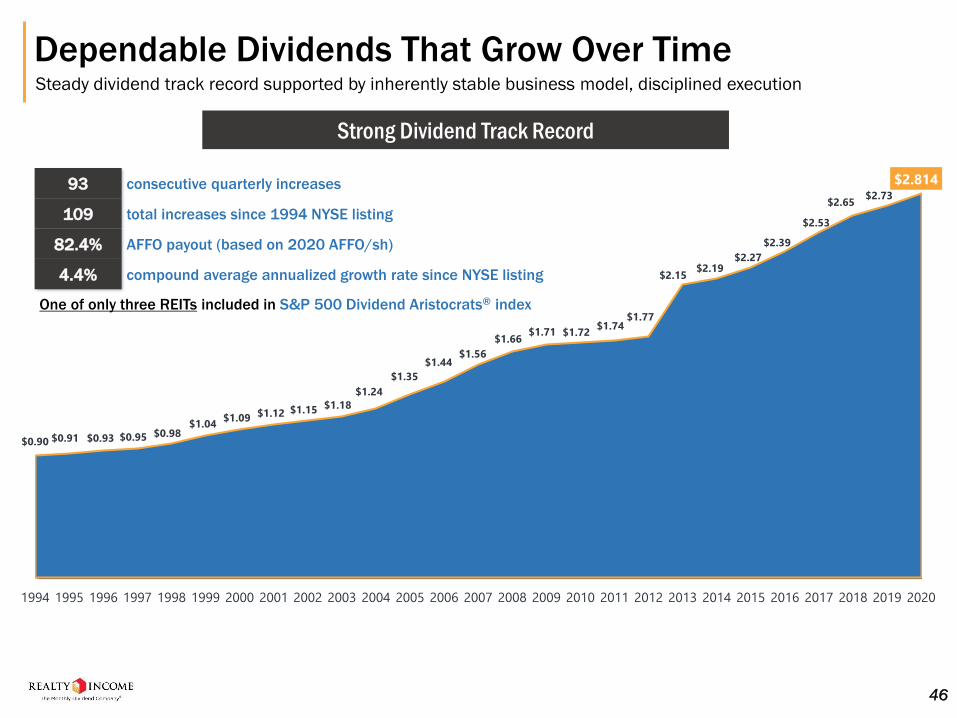
Dependable Dividends That Grow Over TimeSteady dividend track record supported by inherently stable business model, disciplined execution
$0.90 $0.91 $0.93 $0.95 $0.98 $1.04
$1.09 $1.12 $1.15 $1.18
$1.24
$1.35
$1.44 $1.56
$1.66 $1.71 $1.72
$1.74 $1.77
$2.15 $2.19
$2.27
$2.39
$2.53
$2.65 $2.73
$2.814
1994 1995 1996 1997 1998 1999 2000 2001 2002 2003 2004 2005 2006 2007 2008 2009 2010 2011 2012 2013 2014 2015 2016 2017 2018 2019 2020
Strong Dividend Track Record
93 consecutive quarterly increases
109 total increases since 1994 NYSE listing
82.4% AFFO payout (based on 2020 AFFO/sh)
4.4% compound average annualized growth rate since NYSE listing
One of only three REITs included in S&P 500 Dividend Aristocrats® index
46
CORPORATE RESPONSIBILITY
VALUES
Environmental
Responsibility
SocialResponsibility
Corporate
Governance
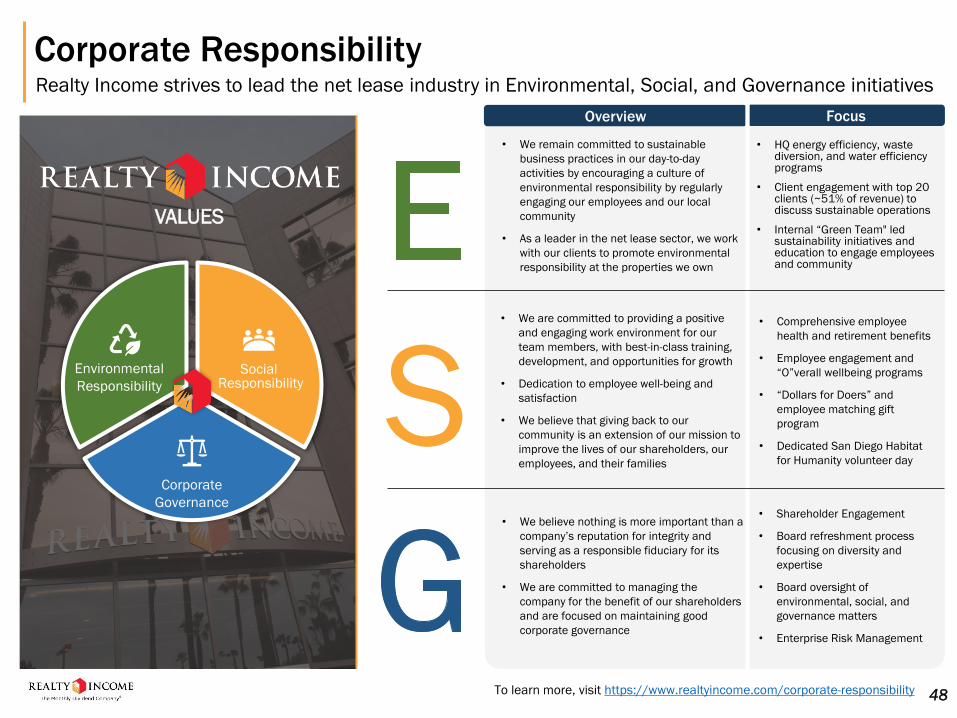
• We remain committed to sustainable
business practices in our day-to-day
activities by encouraging a culture of
environmental responsibility by regularly
engaging our employees and our local
community
• As a leader in the net lease sector, we work
with our clients to promote environmental
responsibility at the properties we own
• HQ energy efficiency, waste diversion, and water efficiency programs
• Client engagement with top 20 clients (~51% of revenue) to discuss sustainable operations
• Internal “Green Team" led sustainability initiatives and education to engage employees and community
S• We are committed to providing a positive
and engaging work environment for our
team members, with best-in-class training,
development, and opportunities for growth
• Dedication to employee well-being and
satisfaction
• We believe that giving back to our
community is an extension of our mission to
improve the lives of our shareholders, our
employees, and their families
• Comprehensive employee
health and retirement benefits
• Employee engagement and
“O”verall wellbeing programs
• “Dollars for Doers” and
employee matching gift
program
• Dedicated San Diego Habitat
for Humanity volunteer day
• We believe nothing is more important than a
company’s reputation for integrity and
serving as a responsible fiduciary for its
shareholders
• We are committed to managing the
company for the benefit of our shareholders
and are focused on maintaining good
corporate governance
• Shareholder Engagement
• Board refreshment process
focusing on diversity and
expertise
• Board oversight of
environmental, social, and
governance matters
• Enterprise Risk Management
Overview Focus
Corporate ResponsibilityRealty Income strives to lead the net lease industry in Environmental, Social, and Governance initiatives
To learn more, visit https://www.realtyincome.com/corporate-responsibility 48
Summary
˃ Long term-focused business strategy
˃ Diversified and actively managed portfolio
˃ Proven and disciplined relationship-driven acquisition strategy
˃ Conservative capital structure able to withstand economic volatility
˃ Precedent of outperforming S&P 500 and REITs since 1994 listing
˃ Attractive risk/reward vs. other REITs and blue chip equities
˃ Dependable monthly dividends with long track record of growth
49
APPENDIX
50
TOP INDUSTRIES OVERVIEW
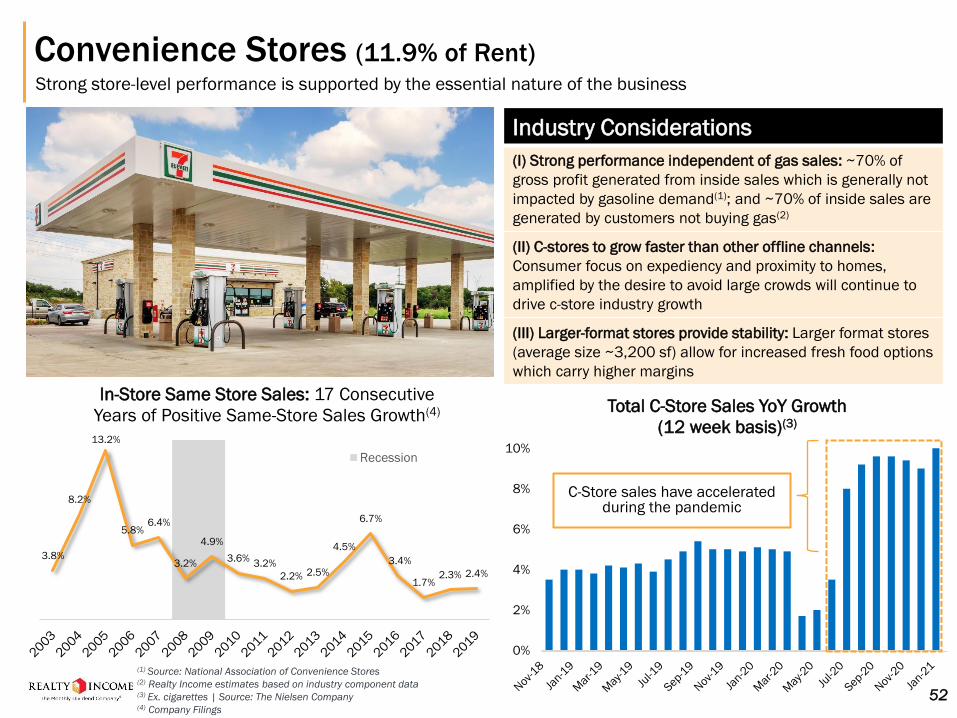
Convenience Stores (11.9% of Rent)Strong store-level performance is supported by the essential nature of the business
Industry Considerations
(I) Strong performance independent of gas sales: ~70% of
gross profit generated from inside sales which is generally not
impacted by gasoline demand(1); and ~70% of inside sales are
generated by customers not buying gas(2)
(II) C-stores to grow faster than other offline channels:
Consumer focus on expediency and proximity to homes,
amplified by the desire to avoid large crowds will continue to
drive c-store industry growth
(III) Larger-format stores provide stability: Larger format stores
(average size ~3,200 sf) allow for increased fresh food options
which carry higher margins
(1) Source: National Association of Convenience Stores(2) Realty Income estimates based on industry component data(3) Ex. cigarettes | Source: The Nielsen Company(4) Company Filings
52
3.8%
8.2%
13.2%
5.8%6.4%
3.2%
4.9%
3.6%3.2%
2.2% 2.5%
4.5%
6.7%
3.4%
1.7%2.3% 2.4%
In-Store Same Store Sales: 17 Consecutive
Years of Positive Same-Store Sales Growth(4)
Recession
Total C-Store Sales YoY Growth
(12 week basis)(3)
0%
2%
4%
6%
8%
10%
C-Store sales have accelerated during the pandemic
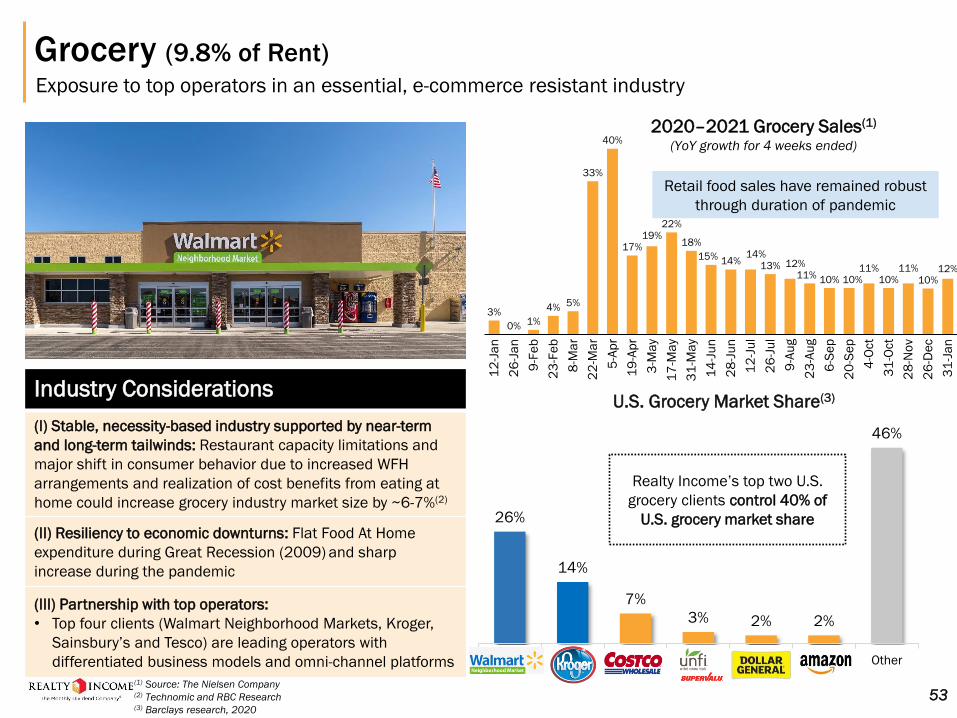
Grocery (9.8% of Rent)
Exposure to top operators in an essential, e-commerce resistant industry
Industry Considerations
(I) Stable, necessity-based industry supported by near-term
and long-term tailwinds: Restaurant capacity limitations and
major shift in consumer behavior due to increased WFH
arrangements and realization of cost benefits from eating at
home could increase grocery industry market size by ~6-7%(2)
(II) Resiliency to economic downturns: Flat Food At Home
expenditure during Great Recession (2009) and sharp
increase during the pandemic
(III) Partnership with top operators:
• Top four clients (Walmart Neighborhood Markets, Kroger,
Sainsbury’s and Tesco) are leading operators with
differentiated business models and omni-channel platforms
26%
14%
7%
3% 2% 2%
46%
Walmart Kroger Costco UNFI Dollar
General
Amazon Other
U.S. Grocery Market Share(3)
Realty Income’s top two U.S.
grocery clients control 40% of
U.S. grocery market share
(1) Source: The Nielsen Company(2) Technomic and RBC Research(3) Barclays research, 2020
53
Retail food sales have remained robust
through duration of pandemic
3%1%
4% 5%
33%
40%
17%19%
22%
18%
15% 14%14%
13% 12%11% 10% 10%
11%10%
11%
10%12%
9-A
ug
12
-Ja
n
26
-Ja
n
19
-Ap
r
22
-Ma
r
9-F
eb
23
-Fe
b
8-M
ar
28
-No
v
5-A
pr
3-M
ay
17
-Ma
y
31
-Ma
y
14
-Ju
n
28
-Ju
n
23
-Au
g
12
-Ju
l
26
-Ju
l
6-S
ep
31
-Ja
n
20
-Se
p
4-O
ct
0%
31
-Oct
26
-De
c
2020–2021 Grocery Sales(1)
(YoY growth for 4 weeks ended)

68%(3)
16%9%
5% 2%
U.K. Grocery Market Share(2)
Big 4 Discounters Convenience Premium "Pure play" online
Grocery: Overview of the U.K. Grocery IndustryTraditional grocery retailers remain the core distribution channel and dominate online sales
Industry Considerations
(I) Defensive, non-discretionary industry: U.K. grocery store sales
have been growing consistently over the past 15 years
(~3% CAGR) and are expected to grow by 10% by 2022(1)
(II) Partnership with top operators:
• Sainsbury’s and Tesco are the top two grocery operators in the
UK with strong balance sheets and omni-channel platforms
• Quality product, excellent locations and differentiated
assortment continue to drive consumer loyalty
(III) Threat from discounters and e-commerce is mitigated:
• Discounters have less margin to maneuver on lowering prices,
while Tesco and Sainsbury’s have significant financial flexibility
to continue to focus on price investment and expanding their
omni-channel capabilities
(1) Source: IGD estimates(2) Source: Kantar World Panel | Market share for 12 weeks ending 1/24/2021(3) Big 4 market share includes all formats (supermarkets, hypermarkets, c-stores and online)
54
0.8% 1.5%
20.6%
5.6%
17.1%18.9%
14.6%
9.7%8.0%
10.6%9.4%
13.9%
11.4% 12.2%
17
-Ma
y
26
-Ja
n
23
-Fe
b
14
-Ju
n
19
-Ap
r
22
-Ma
r
9-A
ug
12
-Ju
l
29
-No
v
6-S
ep
4-O
ct
1-N
ov
27
-De
c
24
-Ja
n
2020–2021 UK Grocery Sales(2)
(YoY growth for 4 weeks ended)
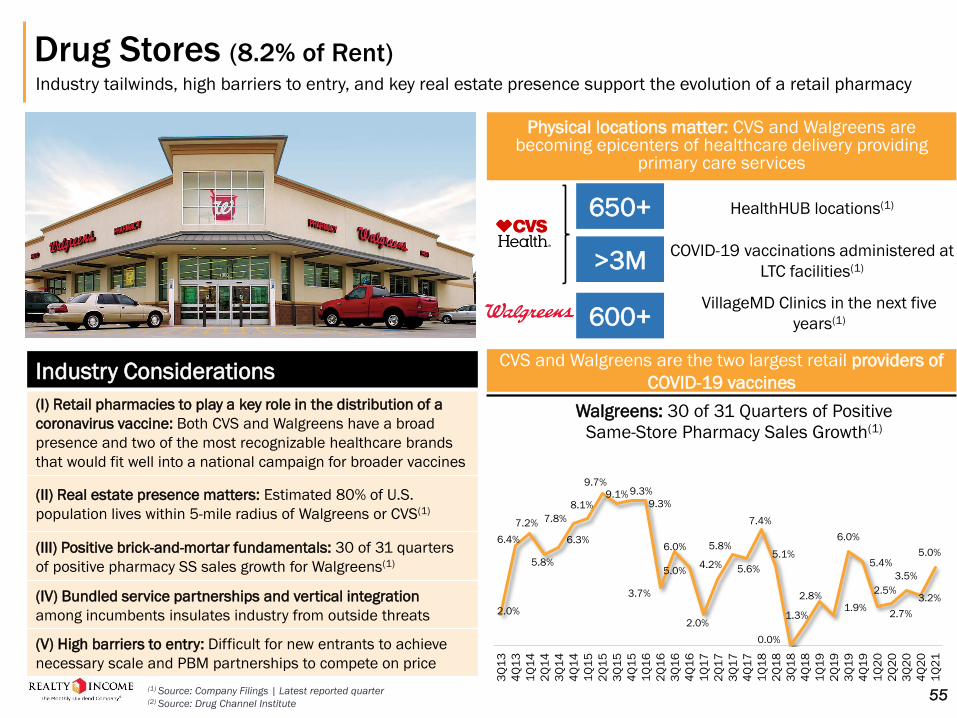
Drug Stores (8.2% of Rent)Industry tailwinds, high barriers to entry, and key real estate presence support the evolution of a retail pharmacy
Industry Considerations
(I) Retail pharmacies to play a key role in the distribution of a
coronavirus vaccine: Both CVS and Walgreens have a broad
presence and two of the most recognizable healthcare brands
that would fit well into a national campaign for broader vaccines
(II) Real estate presence matters: Estimated 80% of U.S.
population lives within 5-mile radius of Walgreens or CVS(1)
(III) Positive brick-and-mortar fundamentals: 30 of 31 quarters
of positive pharmacy SS sales growth for Walgreens(1)
(IV) Bundled service partnerships and vertical integration
among incumbents insulates industry from outside threats
(V) High barriers to entry: Difficult for new entrants to achieve
necessary scale and PBM partnerships to compete on price
(1) Source: Company Filings | Latest reported quarter(2) Source: Drug Channel Institute
2.0%
6.4%
7.2%
5.8%
6.3%
7.8%
8.1%
9.7%
9.1% 9.3%
9.3%
3.7%
6.0%
5.0%
2.0%
4.2%
5.8%
5.6%
7.4%
5.1%
0.0%
1.3%
2.8%1.9%
6.0%
5.4%
2.5%
2.7%
3.5%
3.2%
5.0%
3Q
13
4Q
13
1Q
14
2Q
14
3Q
14
4Q
14
1Q
15
2Q
15
3Q
15
4Q
15
1Q
16
2Q
16
3Q
16
4Q
16
1Q
17
2Q
17
3Q
17
4Q
17
1Q
18
2Q
18
3Q
18
4Q
18
1Q
19
2Q
19
3Q
19
4Q
19
1Q
20
2Q
20
3Q
20
4Q
20
1Q
21
Walgreens: 30 of 31 Quarters of Positive
Same-Store Pharmacy Sales Growth(1)
55
650+ HealthHUB locations(1)
COVID-19 vaccinations administered at
LTC facilities(1)
VillageMD Clinics in the next five
years(1)
CVS and Walgreens are the two largest retail providers of
COVID-19 vaccines
>3M
600+
Physical locations matter: CVS and Walgreens are becoming epicenters of healthcare delivery providing
primary care services
0.9%
7.3%
2.0%
9.5%
4.9%
0.9%
3.2%
3.9%
5.7%
0.1%
-0.8%
4.6%
7.2%
2.4%
4.3%
1.7%
1.8%
20
00
20
01
20
02
20
03
20
04
20
05
20
06
20
07
20
08
20
09
20
10
20
11
20
12
20
13
20
14
20
15
20
16
20
17
20
18
20
19
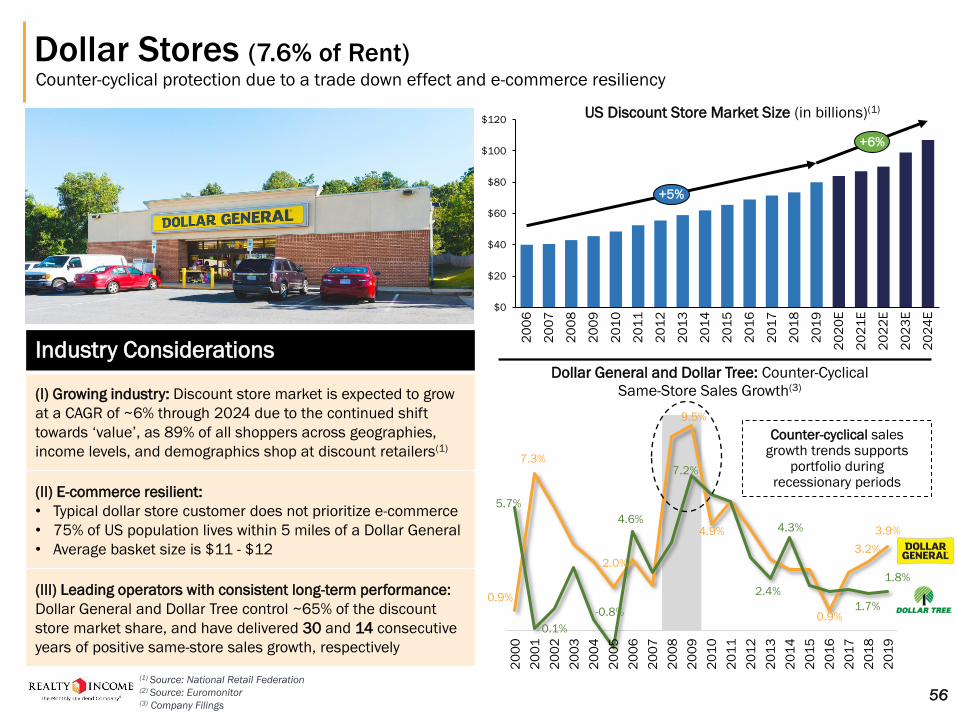
Dollar General and Dollar Tree: Counter-Cyclical
Same-Store Sales Growth(3)
Dollar Stores (7.6% of Rent)Counter-cyclical protection due to a trade down effect and e-commerce resiliency
Industry Considerations
(I) Growing industry: Discount store market is expected to grow
at a CAGR of ~6% through 2024 due to the continued shift
towards ‘value’, as 89% of all shoppers across geographies,
income levels, and demographics shop at discount retailers(1)
(II) E-commerce resilient:
• Typical dollar store customer does not prioritize e-commerce
• 75% of US population lives within 5 miles of a Dollar General
• Average basket size is $11 - $12
(III) Leading operators with consistent long-term performance:
Dollar General and Dollar Tree control ~65% of the discount
store market share, and have delivered 30 and 14 consecutive
years of positive same-store sales growth, respectively
Counter-cyclical sales growth trends supports
portfolio during recessionary periods
(1) Source: National Retail Federation(2) Source: Euromonitor(3) Company Filings
56
$0
$20
$40
$60
$80
$100
$120
20
09
20
15
20
06
20
08
20
07
20
10
20
11
20
12
20
13
20
24
E
20
14
20
16
20
17
20
18
20
19
20
20
E
20
21
E
20
22
E
20
23
E
+5%
+6%
US Discount Store Market Size (in billions)(1)
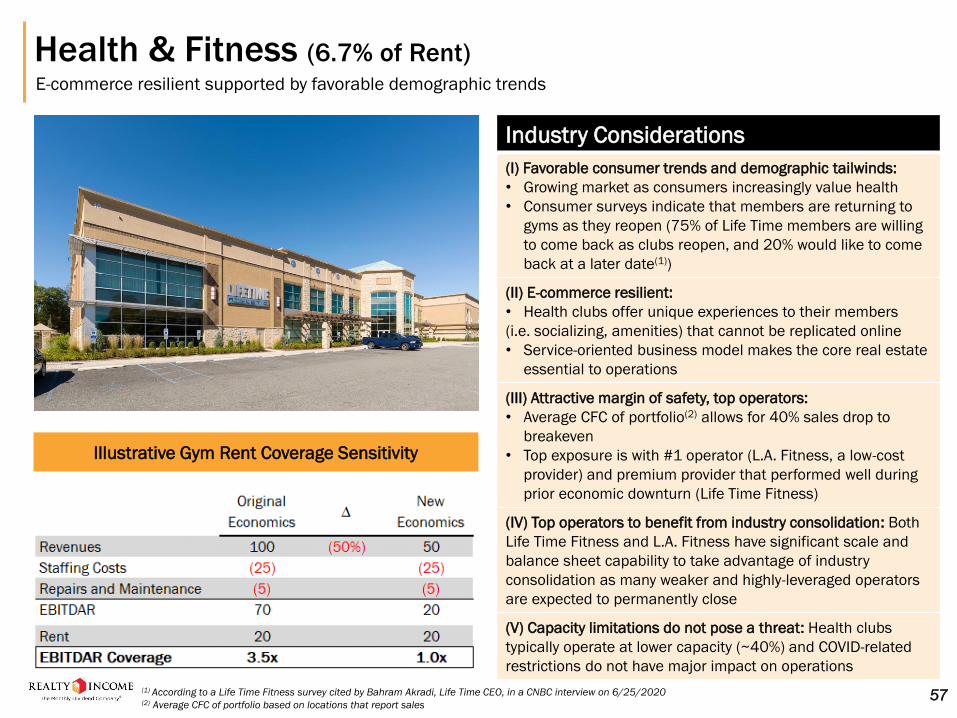
Health & Fitness (6.7% of Rent)E-commerce resilient supported by favorable demographic trends
Industry Considerations
(I) Favorable consumer trends and demographic tailwinds:
• Growing market as consumers increasingly value health
• Consumer surveys indicate that members are returning to
gyms as they reopen (75% of Life Time members are willing
to come back as clubs reopen, and 20% would like to come
back at a later date(1))
(II) E-commerce resilient:
• Health clubs offer unique experiences to their members
(i.e. socializing, amenities) that cannot be replicated online
• Service-oriented business model makes the core real estate
essential to operations
(III) Attractive margin of safety, top operators:
• Average CFC of portfolio(2) allows for 40% sales drop to
breakeven
• Top exposure is with #1 operator (L.A. Fitness, a low-cost
provider) and premium provider that performed well during
prior economic downturn (Life Time Fitness)
(IV) Top operators to benefit from industry consolidation: Both
Life Time Fitness and L.A. Fitness have significant scale and
balance sheet capability to take advantage of industry
consolidation as many weaker and highly-leveraged operators
are expected to permanently close
(V) Capacity limitations do not pose a threat: Health clubs
typically operate at lower capacity (~40%) and COVID-related
restrictions do not have major impact on operations
Illustrative Gym Rent Coverage Sensitivity
57(1) According to a Life Time Fitness survey cited by Bahram Akradi, Life Time CEO, in a CNBC interview on 6/25/2020(2) Average CFC of portfolio based on locations that report sales

Theaters (5.6% of Rent)Short-term disruptions do not obstruct long-term industry viability
Industry Considerations
(I) Theatrical releases are significant revenue generators for
studios: Hollywood studios receive 55%-60% of theater ticket
sales, incentivizing them to distribute through the theater
channel
(II) Direct-to-consumer platform revenue is limited:
• Consumers are only willing to spend ~$6 for a title on
streaming platforms, which is insufficient to cover costs of
production of major blockbusters
• Disney’s Mulan generated an estimated ~$34 million
during its opening weekend(1), well below its ~$200 million
production budget
• A blockbuster film that generated $750 million in box
office revenue would need to have 30 million PVOD buys to
generate the same profit via a streaming platform(2)
(III) Content-driven industry: Studios pushed major
blockbuster releases into 2021, creating pent-up demand
(IV) Premium video on demand (PVOD) threat is mitigated:
• 75%-90% of box office revenue generated within 17 days
(first three weekends) of a theatrical release(3)
• Studios have been postponing major blockbuster releases
(James Bond, Black Widow) rather than releasing them
direct-to-consider, underlying the importance of the theater
circuit as a distribution channel
• PVOD offering lacks experiential component of theaters
(1) Source: SambaTV (2) Source: Morgan Stanley Research(3) Based on top 20 movies in 2019(4) Source: Screen Engine Survey, Wall Street Research
58
Theatrical Releases are Significant Revenue Generators for Studios
Opening Weekend
Box Office
Est. Disney’s Profit $100M+
~$191M ~$34M
~$34M
In 2020, 71% of PVOD
viewers would have
preferred to see the
movie in the theater when
it is safe/normal(4)
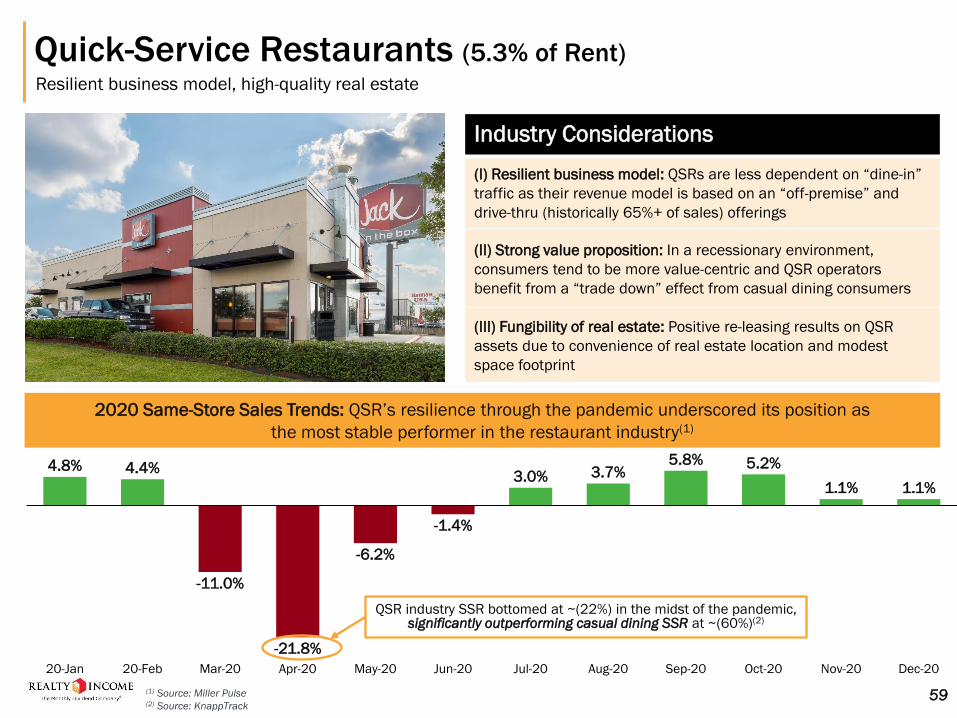
Quick-Service Restaurants (5.3% of Rent)Resilient business model, high-quality real estate
Industry Considerations
(I) Resilient business model: QSRs are less dependent on “dine-in”
traffic as their revenue model is based on an “off-premise” and
drive-thru (historically 65%+ of sales) offerings
(II) Strong value proposition: In a recessionary environment,
consumers tend to be more value-centric and QSR operators
benefit from a “trade down” effect from casual dining consumers
(III) Fungibility of real estate: Positive re-leasing results on QSR
assets due to convenience of real estate location and modest
space footprint
2020 Same-Store Sales Trends: QSR’s resilience through the pandemic underscored its position as
the most stable performer in the restaurant industry(1)
(1) Source: Miller Pulse(2) Source: KnappTrack
59
4.8% 4.4%
-11.0%
-21.8%
-6.2%
-1.4%
3.0% 3.7%5.8% 5.2%
1.1% 1.1%
Jul-2020-Jan Aug-20 Oct-2020-Feb Mar-20 Apr-20 May-20 Jun-20 Sep-20 Nov-20 Dec-20
QSR industry SSR bottomed at ~(22%) in the midst of the pandemic, significantly outperforming casual dining SSR at ~(60%)(2)


![Institutional Investor meeting [Company Update]](https://static.documents.pub/doc/80x56/577c985b1a28ab163a8b58e9/institutional-investor-meeting-company-update.jpg)


