23
Fourth Quarter & Fiscal Year 2012 Earnings Results Conference Call Presentation

Fourth Quarter & Fiscal Year 2012 Earnings Results
Conference Call Presentation
This presentation is based on audited financial statements and may include statements that could constitute forward-lookingstatements, including, but not limited to, the Company’s expectations for its future performance, revenues, income, earnings pershare, capital expenditures, dividends, liquidity and capital structure; the impact of the emergency laws enacted by the Argentinegovernment; and the impact of rate changes and competition on the Company’s future financial performance. Forward-lookingstatements may be identified by words such as “believes”, “expects”, “anticipates”, “projects”, “intends”, “should”, “seeks”,“estimates”, “future” or other similar expressions. Forward-looking statements involve risks and uncertainties that could significantlyaffect the Company’s expected results. The risks and uncertainties include, but are not limited to, uncertainties concerning theimpact of the emergency laws enacted by the Argentine government which have resulted in the repeal of Argentina’s convertibilitylaw, the devaluation of the peso, restrictions on the ability to exchange pesos into foreign currencies, the adoption of a restrictivecurrency transfer policy, the “pesification” of tariffs charged for public services, the elimination of indexes to adjust rates charged forpublic services and the executive branch announcement to renegotiate the terms of the concessions granted to public service
Disclaimer
1
public services and the executive branch announcement to renegotiate the terms of the concessions granted to public serviceproviders, including Telecom. Due to extensive and rapid changes in laws and economic and business conditions in Argentina, it isdifficult to predict the impact of these changes on the Company’s financial condition. Other factors may include, but are not limitedto, the evolution of the economy in Argentina, growing inflationary pressure and reduction in consumer spending and the outcome ofcertain legal proceedings. Readers are cautioned not to place undue reliance on forward-looking statements, which speak only asthe date of this document. The Company undertakes no obligation to release publicly the results of any revisions to forward-lookingstatements which may be made to reflect events and circumstances after the date of this presentation, including, without limitation,changes in the Company’s business or to reflect the occurrence of unanticipated events. Information included in this presentation isunaudited and may not coincide with that included in the financial statements of the Company, due to rounding, reclassificationmatters, and other reasons. Readers are encouraged to consult the Company’s Annual Report and Form 20-F as well as periodicfilings made on Form 6-K, which are filed with or furnished to the United States Securities and Exchange Commission and theArgentine Comisión Nacional de Valores.

• Market Overview
• Business Highlights
• Financials
Agenda
2
• Financials
• Guidance for 2013
• Q&A Session

Market Overview: Rebound expected after 2012 slowdown
Billion USD, at current prices – Last 12 months∆ YoY - constant prices
Trade Balance (Billion USD) Last 12 monthsFiscal Balance as % of GDP Last 12 months*
Real GDP* Trade & Fiscal BalanceConsumption & Wages
179 211249 266
16,911,4 10,0
12,7
1,5% 1,7% 0,3%-0,2%
National Wages - ∆ % YoY
16,7%
26,3%29,4%
24,5%
Billion USD, at current prices – Last 12 months
307368
442 465
0,9%
9,2% 8,9%
1,9%
3
Source: MECON, INDEC and Company Estimates•Official GDP YoY variation, constant prices. •Fiscal Balance represents primarily fiscal surplus
• International commerce declined in 2012, dueto a reduction in exports and imports of 3%and 7% respectively, reaching a trade surplusof 12,7 billion dollars.
• Weak performance in the fiscal accountsincreased flows from the Central Bank andNational Pension Funds.
• Improved agricultural production and Brazilianeconomy picking-up, could help to easeexternal constraints and to sustain a morefavorable context for 2013.
• After a hard landing in 2012, an improvedeconomic scenario for 2013 is expected. Theagricultural production will probably recoverstrength and the Brazilian economy may helpindustrial exports.
• Weak economic conditions reduced growth to1,9% in 2012 down from 8,9%.
• Sectors like agriculture and constructionsuffered the most, while banking and someother services outperformed the rest of theeconomy.
• Private consumption was the main driver ofgrowth in 2012, as deteriorated investmentlevels suffered from tighter FX and importsconditions.
• The continued increases in nominal wagesand the low real interest rates encouragedconsumption over savings.
• Inflation remained at high levels, althoughin general, wages negotiation concluded atlower levels from last year.
179
2009 2010 2011 2012e 2009 2010 2011 2012e2009 2010 2011 2012e

• Market Overview
• Business Highlights
• Financials
Agenda
4
• Financials
• Guidance for 2013
• Q&A Session

Business Highlights
#1 in Revenue Share; Service Revenues up +21% YoY in 4Q12
Postpaid leadership confirmed by high quality of port-ins & net adds
Investing in mobile access to sustain VAS growth
Wireline BB and Data services sustain revenue expansion
MOBILE
5
Wireline BB and Data services sustain revenue expansion
Wireline Broadband ARPU rose +22% YoY in 4Q12
Increasing ICT orders backlog
FINANCIALS
FIXED
Strong cash flow generation in 4Q12 – ARS1.406 MM in 2012
Margins expanded QoQ; controlled SAC/SRC and cost efficiency
Revenues and OIBDA double digit growth Target Reached

TEO Group: 2012 Targets
Guidance FY12 2012 Results
Revenues
2011 2012
+Positive Double Digit YoY trend
+Positive Double Digit YoY trend
+20% vs 2011+20% vs. FY11
IFRS, Billion of ARS
OIBDA
Capex
2011 2012
3,2 4,0
17% 18%
2011 2012
Digit YoY trend
+10% vs. FY11 +11% vs. FY11**Excluding non-recurring cost
Capex as % of Revenues
+2% vs. FY11ARS 3,3 Billion
�Delays in logistics for equipment imports affected target
6
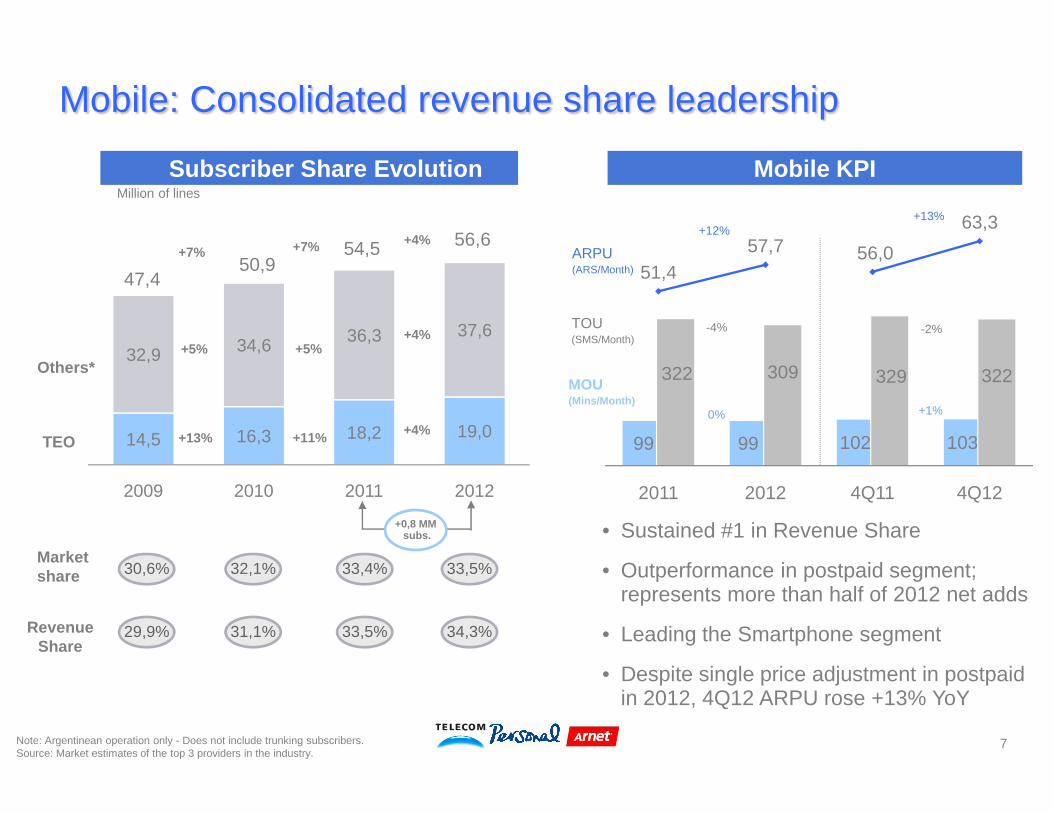
32,9 34,6 36,3 37,6
Mobile: Consolidated revenue share leadership
Subscriber Share EvolutionMillion of lines
Others*
54,550,9
+5%
+7% 56,6
+4%
+4%
322 309 329 322
51,457,7 56,0
63,3
TOU (SMS/Month)
MOU (Mins/Month)
ARPU (ARS/Month)
+12%
-4%
Mobile KPI
+13%
-2%
+1%
+5%
+7%
47,4
14,5 16,3 18,2 19,0
2009 2010 2011 2012
7Note: Argentinean operation only - Does not include trunking subscribers.Source: Market estimates of the top 3 providers in the industry.
• Sustained #1 in Revenue Share
• Outperformance in postpaid segment; represents more than half of 2012 net adds
• Leading the Smartphone segment
• Despite single price adjustment in postpaid in 2012, 4Q12 ARPU rose +13% YoY
Market share
TEO
+0,8 MMsubs.
+11%
31,1%
33,5%32,1% 33,4%
+4%99 99 102 103
2011 2012 4Q11 4Q12
0% +1%
+13%
30,6%
Revenue Share
33,5%29,9% 34,3%

5,8%3,8% 5,2% 3,9% 2,0%
8,6%
9,0% 9,0%9,4%
8,9%
4.507 5.095 5.727 6.299
2.1502.997
4.4825.765
173
391
7741.248
Mobile: SAC & SRC under control in MNP success
Million ARS – Argentine Market
Internet Services
Data (SMS)
as % of Argentine Service Revenues -Before capitalization of SAC & SRC
Service Revenue Breakdown SAC & SRC
+98%
+50%
+12%Handset subsidies
Agent Commissions
13.312
Retail & Wholesale
8.483
10.983+29%
16,2%17,3%16,4%
SAC & SRC
+126%
+39%
+13%
+24%6.830
+61%
+29%
+10%
+21%
14,2%
19,7%
5,3% 3,6% 3,1% 2,9% 3,3%
3,9% 2,0%
4Q11 1Q12 2Q12 3Q12 4Q12
4.507
2009 2010 2011 2012
8
VAS as % of Service Revenues
• Consolidated leadership in high-end market appealed by VAS & customer experience
• Successful mobile internet adoption in prepaid segment thanks to innovative daily flat offer (“internet por $1”)
Advertising
53%48%
Wholesale Voice
40%34%
• Continued rationalization of SAC & SRC after successful MNP implementation
• Promoting handsets upgrade to 3G & smartphones to encourage data usage and improve spectrum efficiency

385466
714
867
132 158
264331
1.806 1.8782.149 2.301
Paraguayan Market: Sustained value generationSubscribers
Thousand of lines (includes 3G modems)
+14%+7%
OIBDA
REVENUES +53%
+67%
FinancialsIFRS Million of ARS
+4%
+21%
+25%
+21%
+20%
2009 2010 2011 20122009 2010 2011 2012
91 Postpaid includes 3G modems but excludes WIMAX
• Revenues in ARS rose +21% YoY in 4Q12
• Sustained value generation and contribution tothe Telecom Argentina Group
OIBDA
Margin 34% 37% 38%
• LTE launch positioned our Brand as leaderin innovation in the mobile internet business
• Great postpaid momentum; customers1 rose+21% YoY
• Leadership in mobile internet boostedinternet service revenues
34%
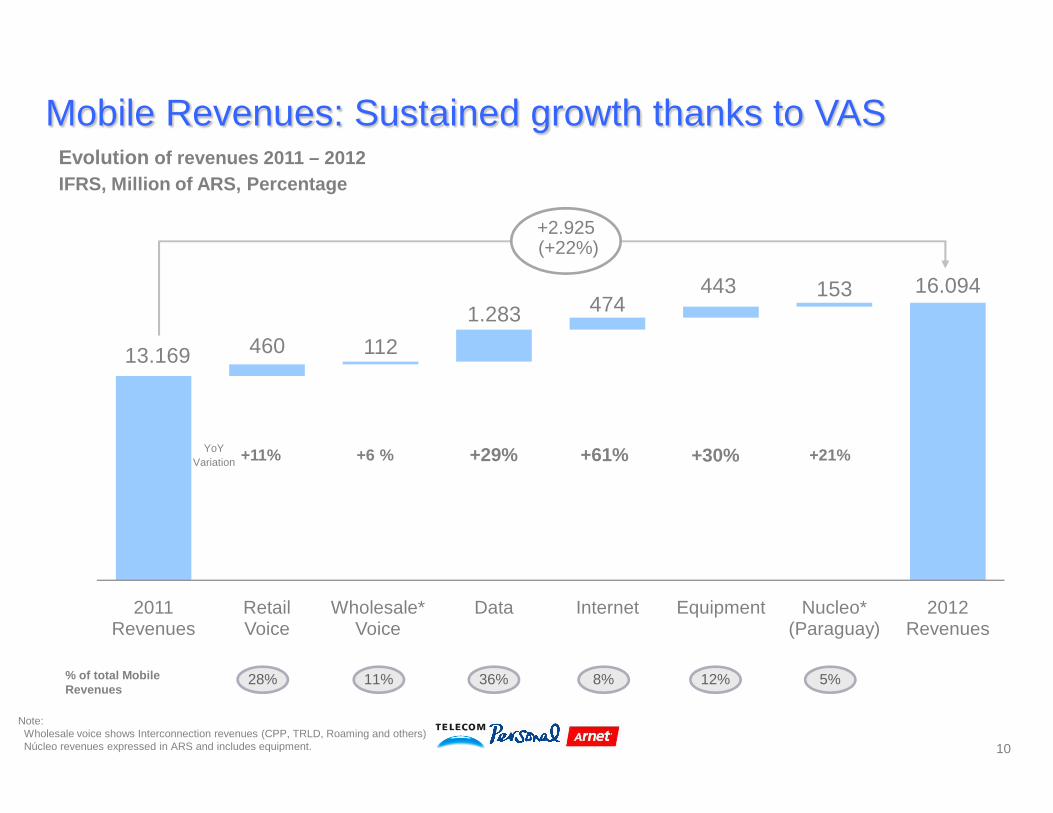
13.169 460 112
1.283 474443 153 16.094
+2.925(+22%)
IFRS, Million of ARS, Percentage
Mobile Revenues: Sustained growth thanks to VAS Evolution of revenues 2011 – 2012
2011 Revenues
Retail Voice
Wholesale* Voice
Data Internet Equipment Nucleo* (Paraguay)
2012 Revenues
10
+11% +6 % +29% +21%+30%
Note: Wholesale voice shows Interconnection revenues (CPP, TRLD, Roaming and others)Núcleo revenues expressed in ARS and includes equipment.
36%11% 8%28% 12%% of total MobileRevenues
5%
+61%YoY Variation
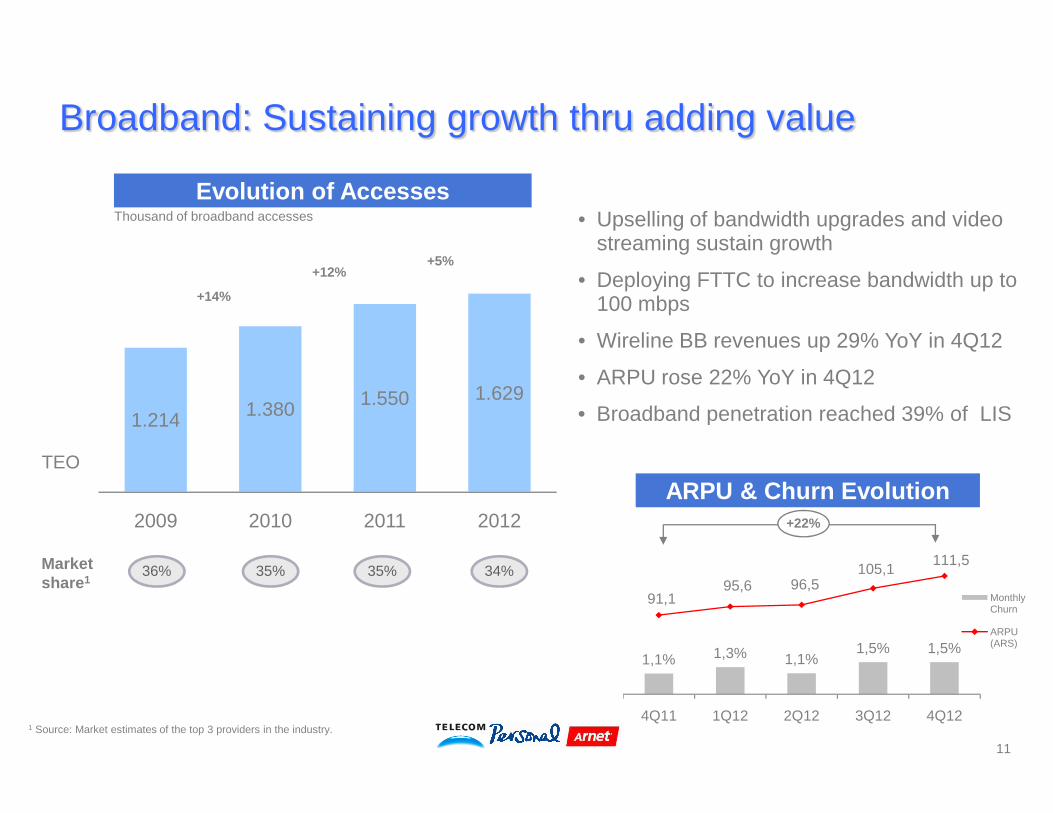
1.380 1.550 1.629
Broadband: Sustaining growth thru adding value
• Upselling of bandwidth upgrades and video streaming sustain growth
• Deploying FTTC to increase bandwidth up to 100 mbps
• Wireline BB revenues up 29% YoY in 4Q12
• ARPU rose 22% YoY in 4Q12
• Broadband penetration reached 39% of LIS
Thousand of broadband accesses
Evolution of Accesses
+5%+12%
+14%
1.214 1.380 1.550
2009 2010 2011 2012
Market share1
1,1% 1,3% 1,1%1,5% 1,5%
91,195,6 96,5
105,1111,5
4Q11 1Q12 2Q12 3Q12 4Q12
Monthly Churn
ARPU (ARS)
11
1 Source: Market estimates of the top 3 providers in the industry.
35%
TEO
+22%
• Broadband penetration reached 39% of LIS
35%
ARPU & Churn Evolution
34%36%
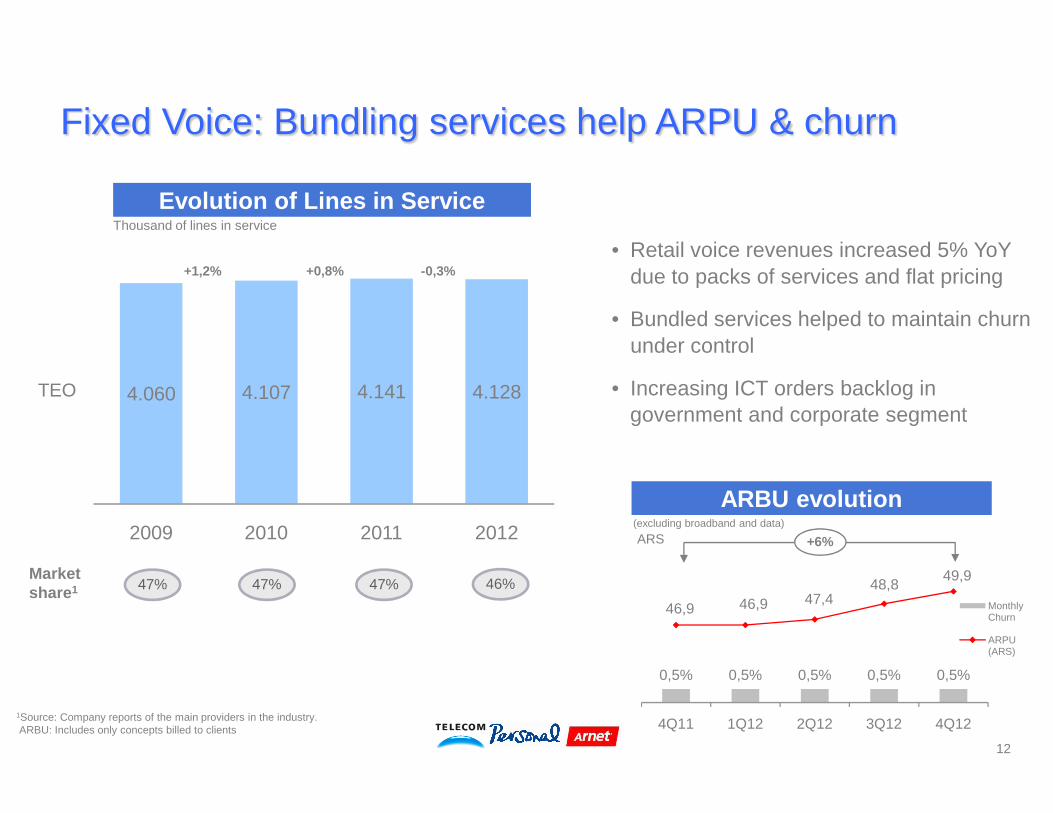
4.060 4.107 4.141 4.128
Fixed Voice: Bundling services help ARPU & churn
• Retail voice revenues increased 5% YoY due to packs of services and flat pricing
• Bundled services helped to maintain churn under control
• Increasing ICT orders backlog in government and corporate segment
-0,3%+0,8%
Thousand of lines in service
Evolution of Lines in Service
TEO
+1,2%
2009 2010 2011 2012
12
1Source: Company reports of the main providers in the industry.ARBU: Includes only concepts billed to clients
ARS
government and corporate segment
+6%(excluding broadband and data)
ARBU evolution
Market share1 47% 47% 46%47%
0,5% 0,5% 0,5% 0,5% 0,5%
46,9 46,9 47,448,8
49,9
4Q11 1Q12 2Q12 3Q12 4Q12
Monthly Churn
ARPU (ARS)

5.329 118 -8152 440
-8 6.023
+694(+13%)
IFRS, Million of ARS, Percentage
Fixed Services: Wireline BB + ICT services key drivers
36%
Regulated
Evolution of revenues 2011 – 2012
Regulated
Revenues 2011
Retail Voice Wholesale Voice
Data Internet Equipment Revenues 2012
13
YoY Variation
-9%+5%
Note: Does not include intercompany revenues.Graph not in scale
-1%
12% 33%42% 12%% of total Fixed Revenues
64%
41%
59%
Regulated
Non Regulated
1%
+26%
Non Regulated
+28%
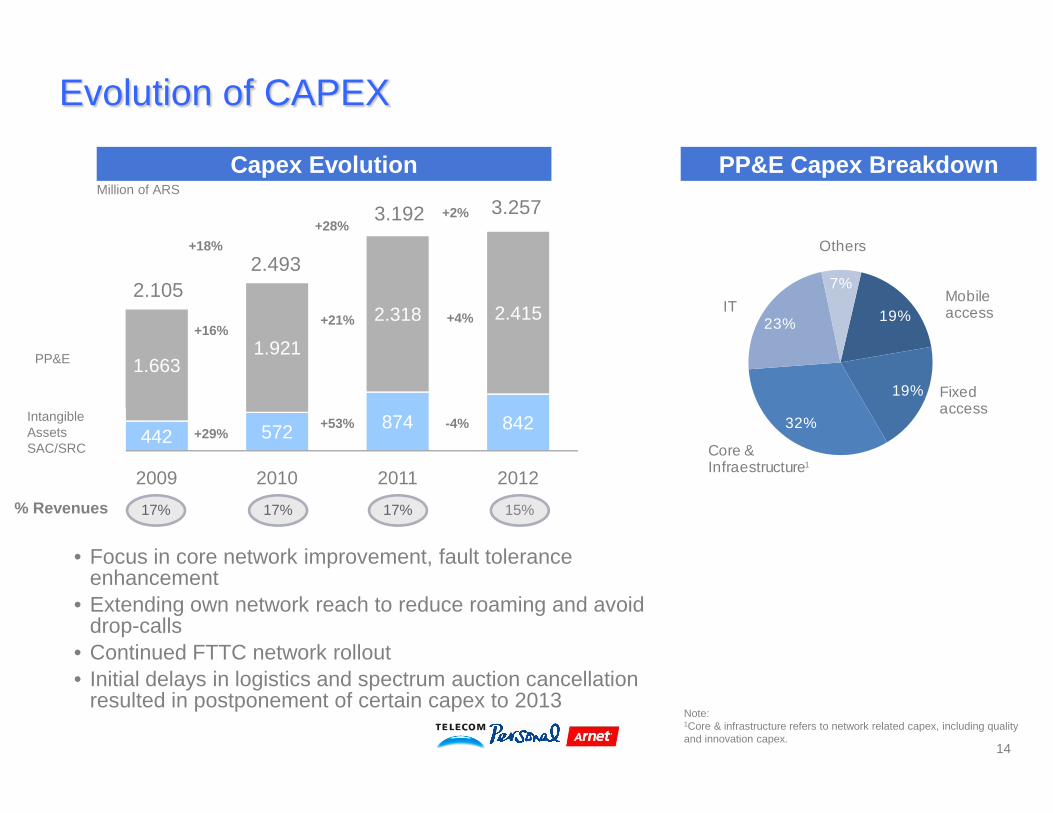
19%
19%
23%
7%
Others
ITMobile access
Fixed access
1.6631.921
2.318 2.415
Evolution of CAPEX
Million of ARS
PP&E Capex BreakdownCapex Evolution
+2%+28%
3.192
+21%
PP&E
+4%
2.493
3.257
2.105
+18%
+16%
32%access
Core & Infraestructure1
442 572 874 842
2009 2010 2011 2012
14
Note: 1Core & infrastructure refers to network related capex, including quality and innovation capex.
% Revenues 17% 17% 15%
• Focus in core network improvement, fault tolerance enhancement
• Extending own network reach to reduce roaming and avoid drop-calls
• Continued FTTC network rollout• Initial delays in logistics and spectrum auction cancellation
resulted in postponement of certain capex to 2013
17%
+53%Intangible AssetsSAC/SRC
-4%+29%

• Market Overview
• Business Highlights
• Financials
Agenda
15
• Financials
• Guidance for 2013
• Q&A Session

4.775
5.645
5.139
6.092
1.5921.844 4Q
TEO Group: Consolidated Results
+23%
IFRS, Million of ARS, Percentage
Revenues OIBDA*IFRS, Million of ARS,
22.117
5.9936.570
+26%18.498
14.627
4.161+18%
3Q
+20%
+10%+19%
4Q
+20%
12.170+16%4.867+17%
4.134 5.126
4.4505.254
4.775
2009 2010 2011 2012
1.431 1.647
1.474 1.492
1.496 1.587
2009 2010 2011 2012
2Q
1Q
3Q
16
OIBDA Margin
34% 33% 32% 30%Regulated Revenues 16% 14%
+18%
+6%
4.161
12% 10%
+24%
+1%
+15%
2Q
1Q
*Operating Income Before Depreciation & Amortization.
• Before ARS90 MM one-time restructuringcharge, OIBDA would have been ARS6.660,increasing +11% YoY
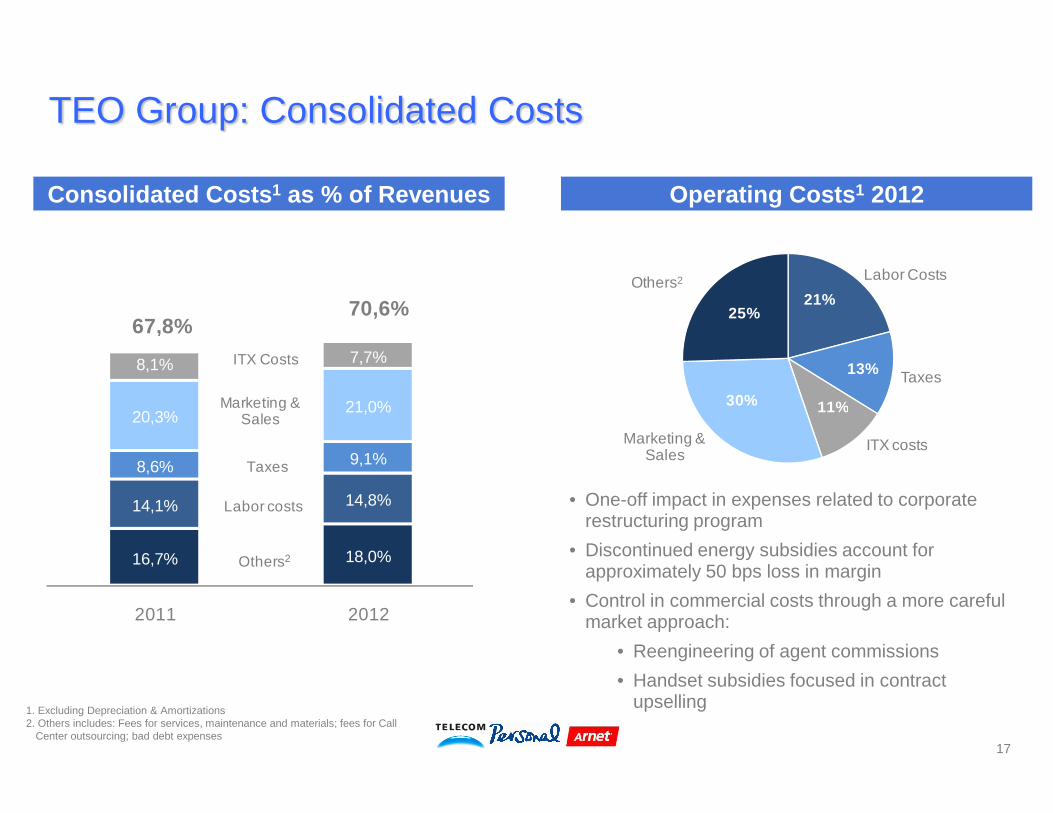
TEO Group: Consolidated Costs
Consolidated Costs 1 as % of Revenues Operating Costs 1 2012
21,0%
8,1% 7,7%
Marketing &
ITX Costs
70,6%67,8%
Labor Costs
Taxes
Others2
21%
13%
11%30%
25%
17
1. Excluding Depreciation & Amortizations2. Others includes: Fees for services, maintenance and materials; fees for Call
Center outsourcing; bad debt expenses
• One-off impact in expenses related to corporate restructuring program
• Discontinued energy subsidies account for approximately 50 bps loss in margin
• Control in commercial costs through a more careful market approach:
• Reengineering of agent commissions
• Handset subsidies focused in contract upselling
16,7% 18,0%
14,1% 14,8%
8,6% 9,1%
20,3%21,0%
2011 2012
Others2
Marketing & Sales
Taxes
Labor costs
ITX costsMarketing & Sales
11%30%

794
2.685994 1.163
TEO Group: Consolidated Results
IFRS, Million of ARS, Percentage
Operating Income Net Income attributable to Telecom
3.857
3.162
+22%
+30%
+23%
+3%
2.513
IFRS, Million of ARS, Percentage
3.966
+17% 4Q +7%
4Q
D&A 2011 2012 ∆%PP&E 1.538 1.792 17%SAC and Connection costs 602 797 32%Other intangible assets 18 23 28%
Total 2.158 2.612 21%
2.616
+21%
634 698
627 577
609 616
643 794
2009 2010 2011 2012
958 1.033
971 849
934 921
2009 2010 2011 2012
18
O. Income Margin 21% 22% 12% 13%21% 18% 14% 12%
-8%
-13%
+10%+8%
+23%
2Q
1Q
2Q
1Q
1.935-1% 3Q
+1% 3Q
4Q
1.405
+38%

3.053
1.647
297 92 831
IFRS, Million of ARS - Last 12 months
TEO Group: FCF and Net Financial Position
6.570 3.257
260
OIBDA Capex ∆ WK & others
Operating Free Cash Flow
2.6843.648
19
Note:(1) Includes Telecom USA(2) Includes Springville(3) OFCF: Operating Free Cash Flow before Taxes.(4) $807 TA, $24 Nucleo
Net Financial Position
4Q11(Cash)
Net Financial Position
4Q12(Cash)
Net Interest
FX Variations
Operating Free Cash
Flow3
Taxes Dividend Payments4
Free Cash Flow = 1.406
Telecom Argentina 1.454(1)
Telecom Personal 2.295 (2)
Nucleo (Paraguay) (101)
Net Financial Position

• Market Overview
• Business Highlights
• Financials
Agenda
20
• Financials
• Guidance for 2013
• Q&A Session

15%17%
TEO Group: 2013 Guidance
Revenues
+Positive Double Digit YoY trend
+Positive Double Digit YoY trend
Capex / Revenues growing trend
OIBDA Capex
2012 2013 2012 2013
3,34,7
2012 2013 2015
• Improve customer experience
• Promote mobile data
• Increase broadband wireline penetration
• Improve QoS and customer experience to control opex
• Leverage on mobile leadership to control SAC & SRC
• Streamline overhead expenses
• Focus on delivering network service quality
• Extend reach and capacity of mobile access
• Deploy FTTC
21

• Market Overview
• Business Highlights
• Financials
Agenda
22
• Financials
• Guidance for 2013
• Q&A Session


