20
| Date post: | 06-Dec-2015 |
| Category: |
Documents |
| Upload: | pranav-iwe |
| View: | 81 times |
| Download: | 23 times |

1. Introduction…………………………………………………………….(3).
2. Candlestick Time zones……………………………………...…...….(4).
3. Wave Confirmation pattern…………………………………………..(5).
4. Volume Traded Analysis…...………………………………………...(6).
5. Candlesticks Analysis……...………………………………………...(9).
6. Fox Wave Trading…………………..………………………………..(10).
7. Charts…………………………………………………………………..(12).
8. Targets and Stop loss limits…………………………...…………..(14).
9. Fox Wave Golden Time……………………………………..………(15).
Contents
Hello folks, past of 7 years ago I have been developing Trading systems &
creating new strategies for Financial Markets especially Forex Market.
Today, I would like to introduce to you my fifth system “FOX Wave”.
I focused this time to make it based only Chart Candlesticks & Volume
traded. We will use only a naked chart without any drawings or indicators
used. That’s will make our system simple for trading from anywhere and
will be easy for Onway traders & Mobile trading.
Most of my previous systems was based on Time Zones (we will get
through it again) for analyzing charts and had a Specific Time for enter
Trades. This time our Times Zones will be Candle sticks and no specific
time for trading. You can trade at any available time for you just after a
complete pattern for wave is done, also our entry exit will be known for us
whether entry target or expiration of wave Life Time any of them occurred
first.
Our wave will be based on 9 Candle Sticks as its Life Time ended with a
specific pattern to confirm the wave and start of our entry. We will pass
through wave part by part then we will know how to use it in trading and
identifying targets and stops. Wave analysis will be based on two main
types of analysis: Candle sticks analysis & Volume traded analysis,
both have to confirm each other to confirm an entry.
1. Introduction

In my previous Trading systems I used Time Zones as group of
consecutive Candlesticks to form its period. Usually we did this by
pressing Ctrl + y keys in MT4 platform. If we are on H4 charts, it will divide
the chart into weeks and on H1 charts, it will divide it into Days. We used to
take 3 previous Time Zones before Trading Zone to be the forth one.
In Fox Wave, our Time Zones will be candlesticks of the Time Frame we
are trading on (i.e. if we are on H4 time frame time zones will be H4
candles and on H1 time frame will be H1 candles).
We will divide Fox Wave into 3 Sub Waves each consists of 3 Time Zones
(3 Candlesticks) that will give us a complete wave consists of 9 candlesticks
before Trading Candle.
We can name these 3 sub waves as follow: 1.Start, 2.Confirmation 3.Entry.
The most important sub wave will be the last ONE (3.Entry), that’s we will
have to focus on it. We will wait to a specific pattern to occur in it and our Fox
Wave will be valid only when this pattern is made by third sub wave. After a
complete valid wave is done just before Trading candle we will apply two types
of analysis: Volume Traded analysis on each sub wave and Candlesticks
analysis on the whole wave.
2. Candlestick Time Zones

Fox Wave will be valid only if this specific pattern is made by third sub wave,
thus this confirmation pattern can be recognized as the end of the wave and the
start of our trade entry. We shall put our trade after wave confirmation and
analysis.
Confirmation pattern consists of 3 Candlesticks/Time Zones in third sub
wave and it’s made by any Two same consecutive candle sticks followed
by last Opposite one to them and this last one will confirm pattern
direction. (i.e. for Bearish confirmation pattern, we should have two
Bullish candles followed by Bearish one to confirm a Bearish Fox Wave
and vice versa for Bullish pattern we should have two Bearish candles
followed by Bullish one to confirm Bullish Fox Wave).
Regardless of size/volume of any candle in pattern, we will search/wait
for any of two types of this pattern and once found we will have a Valid Fox
Wave and we will back test the remaining two sub waves to apply our
analysis.
3. Wave Confirmation Pattern

After we have a valid Fox Wave confirmed by third sub waves, we can
start applying our two types of analysis and we have to focus on them
because this is what will confirm our entry and our trades will be
determined by it.
Starting by first one Volume Traded analysis that we will apply on each of
the three sub waves of Fox Wave and what I mean by Volume Traded is
the type of the Final/Net volume done in each sub wave. From the start
(open) to the end (close) of each sub wave, whether it’s Bearish Volume
(Open higher than Close) or Bullish one (open lower than close) and that
will determine if each sub wave is Bearish or Bullish one.
We will focus on the open of sub wave (open of first candle of the sub
wave) and close of sub wave (close of last third candle of sub wave),
Counting the pips between the open rate & close rate of sub wave we will
determine which is higher or lower and by time this can be done just by our
naked eye and we can pass on a quick analysis for Volume Traded to
determine each type of sub wave. This one of main purposes I focused in
this system to be easy & simple, no need of drawings or indicators and can
be done on any platform even from Mobile platform just with a naked chart.
4. Volume Traded analysis
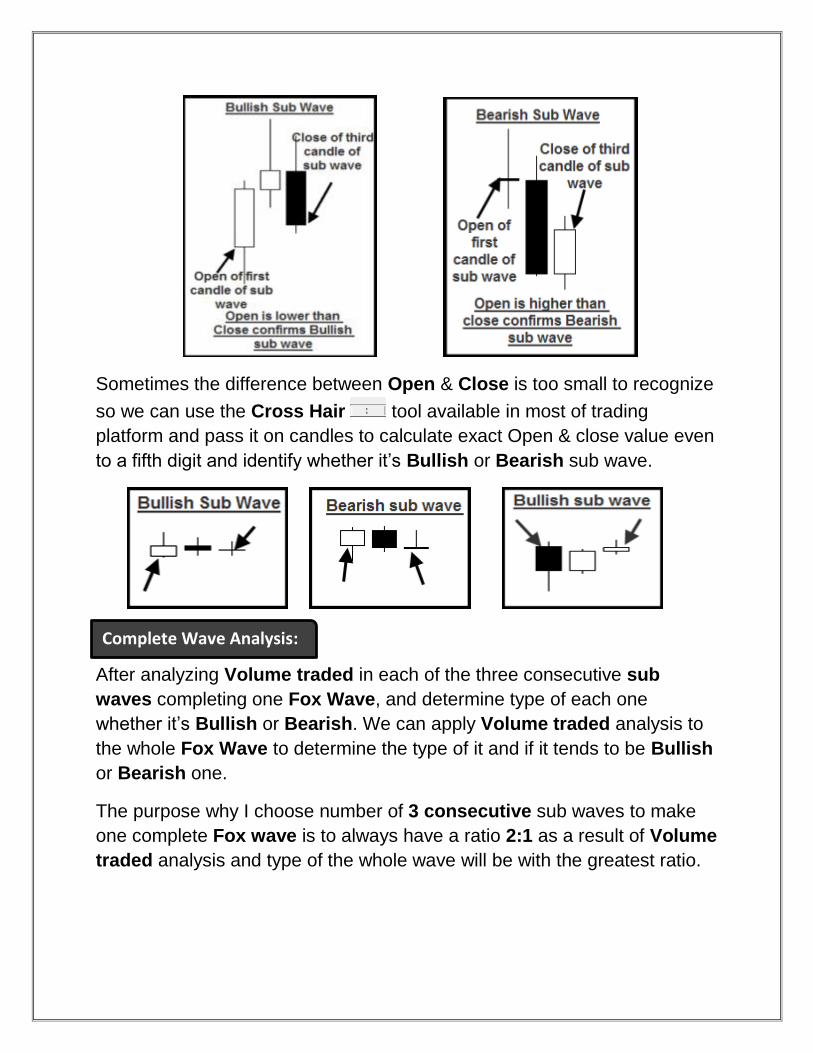
Sometimes the difference between Open & Close is too small to recognize
so we can use the Cross Hair tool available in most of trading
platform and pass it on candles to calculate exact Open & close value even
to a fifth digit and identify whether it’s Bullish or Bearish sub wave.
After analyzing Volume traded in each of the three consecutive sub
waves completing one Fox Wave, and determine type of each one
whether it’s Bullish or Bearish. We can apply Volume traded analysis to
the whole Fox Wave to determine the type of it and if it tends to be Bullish
or Bearish one.
The purpose why I choose number of 3 consecutive sub waves to make
one complete Fox wave is to always have a ratio 2:1 as a result of Volume
traded analysis and type of the whole wave will be with the greatest ratio.
Complete Wave Analysis:

Thus, if we have two Bullish sub waves and one Bearish sub wave, Fox
wave will be a Bullish one and vice versa if we have two Bearish sub
waves and one Bullish sub wave Fox wave will be a Bearish one.
In previous cases, we passed through 2:1 ratio cases where we had two of
same kind sub waves and one of opposite kind sub wave. But if we have
3 pair of a kind case means if we have 3 Bullish sub waves or 3 Bearish
sub waves, I called this case Full Volume traded where we have over
bought or over sold volume and all analysis will go to opposite side.
(i.e. if we have 3 consecutive Bullish sub waves, Fox wave will be
considered as Bearish wave and vice versa if we have 3 consecutive
Bearish sub waves, Fox wave will considered as Bullish wave).
Full Volume Traded:

After we completed first type of analysis volume traded analysis, we will
pass through the second type we will use on our Fox wave and later I will
explain how to combine these two types of analysis so we can use in our
trading with Fox wave. I would recommend understanding these two types
very well as our trading will depend on most of them.
We will apply Candlesticks on the whole Fox wave not on every sub
wave as we do in volume traded. We will measure the ratio of types of
candlesticks in Fox wave to each other, like how many Bullish candles
we have in the whole Fox wave to Bearish candles. This will give us a
ratio to which type is greater than the other and the greater one will
confirms our analysis.
As Fox wave consists of 9 candlesticks, we will start counting from Five
candlesticks to be the greater ratio of its type means if we have from five
to nine of same type of candlesticks this type will confirms our analysis.
(i.e. if we have 5,6,7,8 or 9 Bullish candlesticks in the whole Fox wave,
the no of Bullish candlesticks will be greater than Bearish ones, thus the
Candlesticks analysis will confirms Bullish side and vice versa if we have
5,6,7,8 or 9 Bearish candlesticks the no of Bearish candlesticks will be
greater than Bullish ones and the Candlesticks analysis will confirms
Bearish side.)
5. Candlesticks Analysis

After we passed through the two types of analysis we will apply on our
wave for trading. We will learn how to combine both analyses together for
wave direction confirmation. Both two types of analysis must confirm each
other to be a valid entry to trade and if one of them fails entry will be invalid
and we will be in No Trade. So I would recommend again reading both
types carefully and understanding them well.
Our wave analysis will be step by step, First we will search for valid &
confirmed Fox wave by searching for any confirmation pattern in third sub
wave and determine whether it’s Bullish or Bearish wave, once we found
a valid wave we will secondly apply Volume Traded analysis on each
sub wave then we will identify whether the whole Fox Wave is Bearish or
Bullish wave.
I have to mention if the type of wave isn’t of side of confirmation pattern
entry will be canceled and we will not trade on this wave. (i.e. if we have
Bullish Fox wave and the confirmation pattern is Bearish one entry will
be canceled and vice versa if we have Bearish Fox wave and
confirmation pattern is Bullish one, there will be no trade).
After we have determined the type of Fox wave, then we will apply the
Candlesticks analysis and see also whether it’s Bullish or Bearish. But in
Full Volume Traded cases for candlesticks analysis where we have three
consecutive sub waves of same kind. We will count each candlestick as
the opposite type of it.
(i.e. if we have 5 Bullish candlesticks & 4 Bearish candlesticks and we
have Full Volume Traded case, we will count them as 4 Bullish
candlesticks & 5 Bearish candlesticks).
Entries in Full Volume Traded cases are best trade to take as price has
reached its over Bought or over Sold and is ready to reverse its side and
we enter at the beginning of the swing.
6. Fox Wave Trading

After we apply candlesticks analysis to our wave and determine its type
Bearish or Bullish, we will see if it’s in same side of Volume traded
analysis or not and as I said a valid entry will be only when the two type of
analysis are in the same side.
Backward to all steps above, if we have a Bullish confirmation pattern
and after we applied Volume traded analysis we found that we have a
Bullish Fox wave confirms the side of confirmation pattern then we will
apply the Candlesticks analysis and if we found that it’s also Bullish one,
Then we have a valid Bullish entry.
Vice versa, if we have a Bearish confirmation pattern and after we
applied Volume traded analysis we found that we have a Bearish Fox
wave confirms the side of confirmation pattern then we will apply the
Candlesticks analysis and if we found that it’s also a Bearish one, Then
we have a valid Bearish entry.

7. Charts


Targets and Stop loss limits will be as follows: For high time frames we
can use Risk/Reward Ratio of 1:2 and for low time frames due to high
volatility we can use 1:1 ratio.
Stop loss limits in 1:2 ratios can be taken as half pips of the length of Fox
wave, means we measure the wave from its High to low and take the half
no. of its length pips as our stop loss and inn 1:1 ratios Stop loss will be
the no. of pips of whole wave.
Targets will be in two ways and we will let each occurred first to close the
trade. We can use whether the no. of length pips of wave also as our target
in both 1:2 & 1:1 ratios or we can use the wave Life time method as we
leave the trade opened for 9 candles of same time frame we trade on and if
it didn’t reach its target nor hit its stop loss we close it
(i.e. we are trading on high time frame like Daily time frame and we will use
1:2 R/R ratio, we will measure Fox wave and take half no. of pips of its
length as our Stop loss limit and our target will be the Total no. of pips of
its length. We will leave the trade open for 9 days candlesticks as it’s the
wave life time, whether it reached its target first before the end of 9 days
or we will close it at the end of its life time on the ninth day.)
8. Targets and Stop loss limits

After I have finished Fox Wave, I wanted to develop something to be more
efficient for low time frames and Intraday Trading. I made the Golden
Time edition to be with Fox wave, each can work as a standalone system
but I would recommend first reading the original Fox wave carefully and
understand it very well, so we can use the Golden Time edition in the best
way.
I have used Golden Time on H1 time frame, it can be used on many low
time frames with same concept theory but best result I saw was on this
time frame. Also I always preferred H1 time frame for Day trading as it has
all price movement done during the day with a clear view. Golden Time
has my old chart method in dividing chart into Time Zones and trade on
specific time. we usually used to do this by pressing ctrl+y keys if we are
using MT4 platform and if we are on H1 time frame it will divide the chart
into days each has 24 candlesticks.
Due to “Low Time frames always have short memory and High
volatility” we will make our analysis into the same day of trading, no
previous trading days. We will search for our entry into trading day and also
we will be out into the same day. As our Fox wave consists of 9 Time
zones/Candlesticks and if we are using H1 time frame it will be 9 hours
candlesticks. Start counting these 9 candlesticks at the beginning of
each day and we can trade after the ninth candlestick is closed.
As low time frames have fast movement, I changed some concepts we
were depending on them in the original Fox Wave. In Golden Time we
don’t need the confirmation pattern to occur in third sub wave to confirm
our wave, just after the 9 candlesticks is done we will start applying our
analysis. Also both types of confirmation pattern (Bullish or Bearish) will
work in both sides, any type will be out start to enter our trade.
In Golden Time we won’t apply two type of analysis on our wave to confirm
our entry as we do in original Fox wave, I tried to combine both types of
analysis we used to do in one type with a new way I called it “Golden
Analysis” we will apply it on the 9 candlesticks we will use in our wave.
9. Fox Wave Golden Time
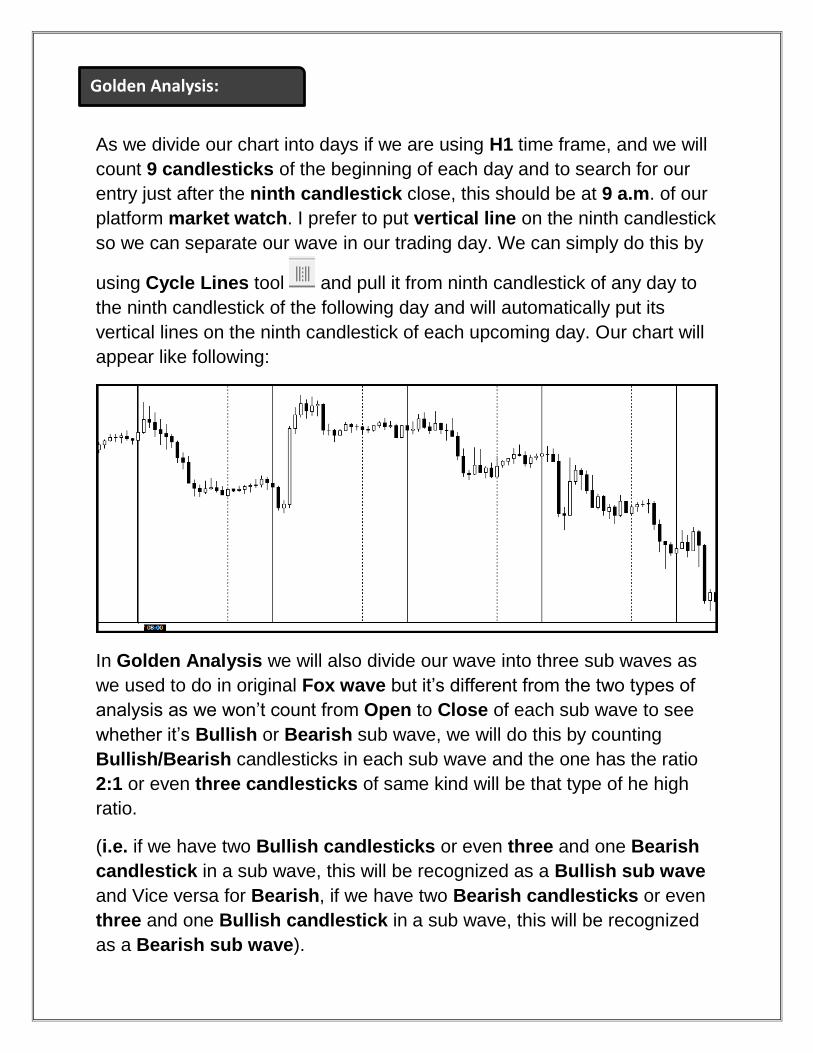
As we divide our chart into days if we are using H1 time frame, and we will
count 9 candlesticks of the beginning of each day and to search for our
entry just after the ninth candlestick close, this should be at 9 a.m. of our
platform market watch. I prefer to put vertical line on the ninth candlestick
so we can separate our wave in our trading day. We can simply do this by
using Cycle Lines tool and pull it from ninth candlestick of any day to
the ninth candlestick of the following day and will automatically put its
vertical lines on the ninth candlestick of each upcoming day. Our chart will
appear like following:
In Golden Analysis we will also divide our wave into three sub waves as
we used to do in original Fox wave but it’s different from the two types of
analysis as we won’t count from Open to Close of each sub wave to see
whether it’s Bullish or Bearish sub wave, we will do this by counting
Bullish/Bearish candlesticks in each sub wave and the one has the ratio
2:1 or even three candlesticks of same kind will be that type of he high
ratio.
(i.e. if we have two Bullish candlesticks or even three and one Bearish
candlestick in a sub wave, this will be recognized as a Bullish sub wave
and Vice versa for Bearish, if we have two Bearish candlesticks or even
three and one Bullish candlestick in a sub wave, this will be recognized
as a Bearish sub wave).
Golden Analysis:

I recommend using Cross hair tool as we are on low time frames, we will
have candlesticks that nearly have a body to recognize whether it’s Bullish
or Bearish candlestick. We will look to its open & close of the candlestick
to determine exactly its type and we can count to the fifth digit as
sometimes open & close are away just by 0.01 pip and candlestick that has
the same open & close till the fifth digit and type of sub wave is depending
on it as it may occur between one Bullish and one Bearish candlesticks.
We won’t consider it and we will have No Trade in this day.
After we determine the type of our Golden wave whether it’s Bullish or
Bearish and this should be after the Close of the ninth candle, we will
wait for any confirmation pattern we used in original Fox wave to occur
any type of it will be our entry. As we are one H1 time frame, we will check
the chart after the close of every H1 candlestick to see pattern formation
and after an entry is valid we can open the trade and put our Targets and
Limits and leave the chart you can set your alarm to remind you every
hour to check the chart instead of waiting in front of chat waiting pattern
formation.
Golden Trading:

Trade will be opened according and with the direction of Golden Fox Wave
and will be closed by the end of each day if it didn’t reach Targets or hit its
limits and I will use also the concept of Full Volume Traded as in original
Fox Wave if we have three sub wave of same kind, Golden wave will be to
the opposite type. I will use 1:1 risk/reward ratio in Trading as I believe
1:1 ratio is fair enough for day trading as high volatility, so we aren’t using
big target to reach and not too small stop loss limit easily hit. Targets will
be the same as in original Fox wave in case of 1:1 ratio will be the total no.
of pips of length of the nine candlesticks from high to low and Stop Loss
will be the same.
Charts :

Sometimes confirmation pattern is formed with the help of ninth
candlestick, I called this candlestick Donor candle case where I count the
ninth candlestick only to form the confirmation pattern with no previous
other candlesticks of the Golden wave. I take this as a valid entry to get
the movement of price from the beginning.
………………………………………………………………………………………
At last I hope this work will be helpful for you all, with the effort of days and
nights I tried to put this system in its best situation and I didn’t hesitate to
share it with you. As I usually say I would be happy if this system work with
anyone even by 1% but I will be very glad if someone continue from where
I stopped and start to develop it to come with total new something. I
provided charts as much I can to make it simple to understand and I will
also be glad to answer all of your questions about this system. You can
contact me directly at my facebook page (fb.com/am.fxt). I would like to be
thankful to reason of all effort presented here to someone I appreciate #N.
Sincerely,
Ahmed Maher
Egypt, 2015


