1 FRAGILITY ASSESSMENT OF PRE-SEISMIC CODE BUILDINGS AND EMERGENCY FACILITIES IN THE UAE Anas ISSA 1 and Aman MWAFY 2 ABSTRACT High levels of investments and population densities are represented in the building inventory in the UAE. The number of buildings in the existing inventory that may be at risk because of the inefficient seismic design provisions at the time they were constructed cannot be underestimated. Moreover, a crucial role in the recovery period following an earthquake is played by emergency facilities. Hence, this study focuses on the seismic fragility assessment of buildings representing substandard and emergency structures when subjected to potential earthquake scenarios in the UAE. Nine reference buildings representing the building inventory in a highly populated seismically active area in the UAE are selected based on an on-ground survey. Detailed structural design and fibre-based modelling are carried out for the reference structures, and forty earthquake records are selected to represent potential earthquake scenarios in the study area. A wide range of local and global response parameters are monitored from static pushover and incremental dynamic analyses. Previous studies are reviewed and compared with the performance criteria obtained from the present study. Fragility relationships and damage state probabilities are generated for the nine reference structures under the effect of two seismic scenarios for the direct implementation in a loss estimation system for the UAE. While the results reflect the acceptable performance of emergency facilities, particularly under near-field events, they reveal the need for implementing mitigation measures for pre-code structures to reduce seismic losses. INTRODUCTION The United Arab Emirates (UAE) was known to be a region of low seismicity even though being in close proximity to high seismic zones. Recent earthquakes recorded within the region have emphasized the significance of investigating the impacts of anticipated seismic scenarios on different types of structures. Due to the rapid development of the construction industry in the UAE, significant attention has been drawn to the risk posed by earthquakes to the buildings and infrastructure. More importantly, since pre-seismic code buildings were constructed when the knowledge regarding the seismicity and seismic code regulations was limited, they may be vulnerable. This knowledge has advanced since then and reflected on the improved seismic performance of modern code-design structures. The poor performance of pre-seismic code buildings will prevent such structures from reaching the desired seismic performance objectives (ATC, 1996; Buratti et al., 2010). In addition, serious attention should be paid to the emergency facilities to assess their performance as they play a crucial role in the earthquake recovery period and should be fully functioning. A great attention has been paid to the emergency facilities around the world. For instance, the State of California has taken steps in that 1 Graduate Teaching Assistant, United Arab Emirates University, Al Ain, UAE, [email protected]2 Associate Professor, United Arab Emirates University, Al Ain, UAE, [email protected]also Professor of Structural Engineering, Zagazig University, Egypt (on leave)
Transcript
1
FRAGILITY ASSESSMENT OF PRE-SEISMIC CODE BUILDINGS AND
EMERGENCY FACILITIES IN THE UAE
Anas ISSA1 and Aman MWAFY2
ABSTRACT
High levels of investments and population densities are represented in the building inventory in the
UAE. The number of buildings in the existing inventory that may be at risk because of the inefficient
seismic design provisions at the time they were constructed cannot be underestimated. Moreover, a
crucial role in the recovery period following an earthquake is played by emergency facilities. Hence,
this study focuses on the seismic fragility assessment of buildings representing substandard and
emergency structures when subjected to potential earthquake scenarios in the UAE. Nine reference
buildings representing the building inventory in a highly populated seismically active area in the UAE
are selected based on an on-ground survey. Detailed structural design and fibre-based modelling are
carried out for the reference structures, and forty earthquake records are selected to represent potential
earthquake scenarios in the study area. A wide range of local and global response parameters are
monitored from static pushover and incremental dynamic analyses. Previous studies are reviewed and
compared with the performance criteria obtained from the present study. Fragility relationships and
damage state probabilities are generated for the nine reference structures under the effect of two seismic
scenarios for the direct implementation in a loss estimation system for the UAE. While the results reflect
the acceptable performance of emergency facilities, particularly under near-field events, they reveal the
need for implementing mitigation measures for pre-code structures to reduce seismic losses.
INTRODUCTION
The United Arab Emirates (UAE) was known to be a region of low seismicity even though being in
close proximity to high seismic zones. Recent earthquakes recorded within the region have emphasized
the significance of investigating the impacts of anticipated seismic scenarios on different types of
structures. Due to the rapid development of the construction industry in the UAE, significant attention
has been drawn to the risk posed by earthquakes to the buildings and infrastructure. More importantly,
since pre-seismic code buildings were constructed when the knowledge regarding the seismicity and
seismic code regulations was limited, they may be vulnerable. This knowledge has advanced since then
and reflected on the improved seismic performance of modern code-design structures. The poor
performance of pre-seismic code buildings will prevent such structures from reaching the desired
seismic performance objectives (ATC, 1996; Buratti et al., 2010). In addition, serious attention should
be paid to the emergency facilities to assess their performance as they play a crucial role in the
earthquake recovery period and should be fully functioning. A great attention has been paid to the
emergency facilities around the world. For instance, the State of California has taken steps in that
1 Graduate Teaching Assistant, United Arab Emirates University, Al Ain, UAE, [email protected] 2 Associate Professor, United Arab Emirates University, Al Ain, UAE, [email protected]
also Professor of Structural Engineering, Zagazig University, Egypt (on leave)
2
direction by enacting a decree to retrofit emergency facilities by 2030 to allow them to be fully
operational subsequent an earthquake (Bruneau and Reinhorn, 2007).
Catastrophic consequences are expected if the seismic risk of the building stock is neglected,
particularly for substandard and emergency facilities. The repeated reports of seismic activities in the
UAE and the devastating social and economic impacts of strong seismic events that have been recorded
in neighbouring territories emphasize the significance of adopting reliable loss estimation and hazard
mitigation strategies for the built environment in this region. This study thus focuses on the probabilistic
seismic vulnerability assessment of buildings representing pre-seismic code and emergency structures,
which enables the direct implementation of a wide range of fragility relationships representing different
structures and earthquake scenarios in a loss estimation and mitigation system for the UAE.
REFERENCE STRUCTURES AND GROUND MOTIONS
Selection of Earthquake Records based on Possible Seismic Scenarios:
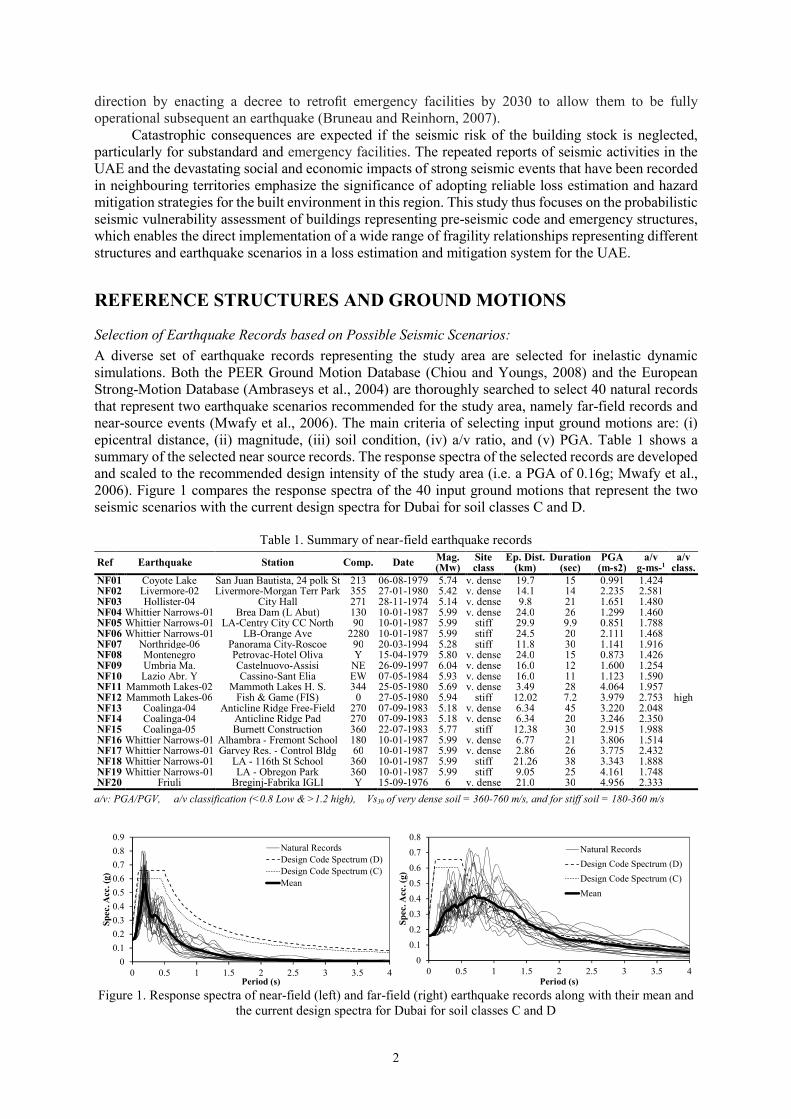
A diverse set of earthquake records representing the study area are selected for inelastic dynamic
simulations. Both the PEER Ground Motion Database (Chiou and Youngs, 2008) and the European
Strong-Motion Database (Ambraseys et al., 2004) are thoroughly searched to select 40 natural records
that represent two earthquake scenarios recommended for the study area, namely far-field records and
near-source events (Mwafy et al., 2006). The main criteria of selecting input ground motions are: (i)
epicentral distance, (ii) magnitude, (iii) soil condition, (iv) a/v ratio, and (v) PGA. Table 1 shows a
summary of the selected near source records. The response spectra of the selected records are developed
and scaled to the recommended design intensity of the study area (i.e. a PGA of 0.16g; Mwafy et al.,
2006). Figure 1 compares the response spectra of the 40 input ground motions that represent the two
seismic scenarios with the current design spectra for Dubai for soil classes C and D.
Table 1. Summary of near-field earthquake records
Ref Earthquake Station Comp. Date Mag. (Mw)
Site class
Ep. Dist. (km)
Duration (sec)
PGA (m-s2)
a/v g-ms-1
a/v class.
NF01 Coyote Lake San Juan Bautista, 24 polk St 213 06-08-1979 5.74 v. dense 19.7 15 0.991 1.424 NF02 Livermore-02 Livermore-Morgan Terr Park 355 27-01-1980 5.42 v. dense 14.1 14 2.235 2.581 NF03 Hollister-04 City Hall 271 28-11-1974 5.14 v. dense 9.8 21 1.651 1.480 NF04 Whittier Narrows-01 Brea Dam (L Abut) 130 10-01-1987 5.99 v. dense 24.0 26 1.299 1.460 NF05 Whittier Narrows-01 LA-Centry City CC North 90 10-01-1987 5.99 stiff 29.9 9.9 0.851 1.788 NF06 Whittier Narrows-01 LB-Orange Ave 2280 10-01-1987 5.99 stiff 24.5 20 2.111 1.468 NF07 Northridge-06 Panorama City-Roscoe 90 20-03-1994 5.28 stiff 11.8 30 1.141 1.916 NF08 Montenegro Petrovac-Hotel Oliva Y 15-04-1979 5.80 v. dense 24.0 15 0.873 1.426 NF09 Umbria Ma. Castelnuovo-Assisi NE 26-09-1997 6.04 v. dense 16.0 12 1.600 1.254 NF10 Lazio Abr. Y Cassino-Sant Elia EW 07-05-1984 5.93 v. dense 16.0 11 1.123 1.590 NF11 Mammoth Lakes-02 Mammoth Lakes H. S. 344 25-05-1980 5.69 v. dense 3.49 28 4.064 1.957 NF12 Mammoth Lakes-06 Fish & Game (FIS) 0 27-05-1980 5.94 stiff 12.02 7.2 3.979 2.753 high NF13 Coalinga-04 Anticline Ridge Free-Field 270 07-09-1983 5.18 v. dense 6.34 45 3.220 2.048 NF14 Coalinga-04 Anticline Ridge Pad 270 07-09-1983 5.18 v. dense 6.34 20 3.246 2.350 NF15 Coalinga-05 Burnett Construction 360 22-07-1983 5.77 stiff 12.38 30 2.915 1.988 NF16 Whittier Narrows-01 Alhambra - Fremont School 180 10-01-1987 5.99 v. dense 6.77 21 3.806 1.514 NF17 Whittier Narrows-01 Garvey Res. - Control Bldg 60 10-01-1987 5.99 v. dense 2.86 26 3.775 2.432 NF18 Whittier Narrows-01 LA - 116th St School 360 10-01-1987 5.99 stiff 21.26 38 3.343 1.888 NF19 Whittier Narrows-01 LA - Obregon Park 360 10-01-1987 5.99 stiff 9.05 25 4.161 1.748 NF20 Friuli Breginj-Fabrika IGLI Y 15-09-1976 6 v. dense 21.0 30 4.956 2.333
a/v: PGA/PGV, a/v classification (<0.8 Low & >1.2 high), Vs30 of very dense soil = 360-760 m/s, and for stiff soil = 180-360 m/s
0
0.1
0.2
0.3
0.4
0.5
0.6
0.7
0.8
0.9
0 0.5 1 1.5 2 2.5 3 3.5 4
Spec. Acc. (g)
Period (s)
Natural Records
Design Code Spectrum (D)
Design Code Spectrum (C)
Mean
0
0.1
0.2
0.3
0.4
0.5
0.6
0.7
0.8
0 0.5 1 1.5 2 2.5 3 3.5 4
Spec. A
cc. (g)
Period (s)
Natural Records
Design Code Spectrum (D)
Design Code Spectrum (C)
Mean
Figure 1. Response spectra of near-field (left) and far-field (right) earthquake records along with their mean and
the current design spectra for Dubai for soil classes C and D
A.Issa and A.Mwafy 3
Selection of Pre-seismic Code and Emergency Structures:
A fundamental step in this study is selecting representative structures for the study area. On-ground
surveying was carried out with several site visits for Dubai, Sharjah and Ajman, which is a highly
populated and seismically active area in the UAE (Figure 2), to select a set of nine reference structures
representing the pre-seismic code buildings and emergency facilities (Mwafy, 2012). Table 2 shows a
summary of the selected representative buildings. Three-dimensional (3D) finite element (FE) models
are developed for the investigated buildings using the structural analysis and design program ETABS
(CSI, 2011). Figure 3 depicts the layouts and 3D models for the set of the reference buildings. For the
pre-code wall structures, the height of all stories is 3.2 m except for the ground storey, which is 4.5 m.
For the pre-code frame structures, the height of all stories is 3.5 m except for the ground storey, which
is 5.0 m. The total heights of the nine reference buildings are shown in Table 2.
Point North East
A
B
C
D
E
F
G
H
Dubai
Ajman
Sharjah A 25o 04’ 17’’55o 07’ 30’’
B 25o 03’ 40’’55o 08’ 15’’
C 25o 05’ 48’’55o 10’ 57’’
D 25o 04’ 35’’55o 12’ 43’’
E 25o 12’ 25’’55o 18’ 57’’
F 25o 13’ 47’’55o 17’ 26’’
G 25o 17’ 23’’55o 21’ 33’’
H 25o 25’ 41’’55o 31’ 14’’
Figure 2. Study area
Table 2. Summary of the selected buildings
Category
Number Buildings description Building Reference Building Height (m)
Selection according to construction date
1
Pre-seismic code structures
BO-02 8
2 BO-08 28.5
3 BO-18 58.9
4 BO-26 84.5
5 BO-40 129.3
Selection according to function
6 Fire station FS 9.5
7 Police station PS 9
8 School SC 13
9 Hospital HO 24.5
Pre
-code
Str
uct
ure
s
BO-02, 2 story BO-08, 8 story BO-18 & BO-26,18 & 26 story BO-40, 40 story
Em
ergem
cy
FS, Fire Station PS, Police Station SC, School HO, Hospital
P
CORE
Figure 3. Three-dimensional design models
4
Design of Reference Buildings:
The five pre-seismic code reference buildings are designed and detailed specifically for the purpose of
the current study according to the building codes that were implemented at the construction time
(BS8110, 1986). Pre-seismic code buildings are defined in this study as those built in the study area
before 1990 when seismic design provisions might be disregarded. It is worth noting that the Uniform
Building Code (UBC, 1997) recommended the use of Seismic Zone ‘0’ for the cities of Abu Dhabi and
Dubai, UAE. Revised seismic design criteria have been adopted in the UAE after the recommendations
of recent seismic hazard studies (e.g. Abdalla and Al-Homoud, 2004; Mwafy et al., 2006). Therefore,
wind loads are the only lateral loads considered in design to represent the real situation before 1990.
The permanent loads used in design include the self-weight and a superimposed dead load of 4.0 kN/m2.
The live load is 2.0 kN/m2 except for stairs and exit ways, which is 4.8 kN/m2. Wind loads are calculated
based on a basic wind speed of 45 m/s (BS-6399-2, 1998). The design is carried out for each building
carefully to obtain the optimum cross sections for different structural elements. Table 3 shows sample
design results for the 26-story building. To accurately represent the pre-code structures, the material
properties that were utilized at the time of construction are considered. The concrete strength ranges
between 20 and 40 MPa, while mild steel is used with a yield strength of 240 MPa. Pre-code buildings
with such material properties are likely to be more vulnerable to earthquake loads due to the large cross
sections, heavy mass and inadequate detailing as compared to modern code-designed structures.
The four emergency buildings are designed and detailed in the current study according to modern
building codes (ACI-318, 2011; ASCE-7, 2010). Wind loads are estimated using ASCE-7 (2010) based
on a basic wind speed of 45 m/s and an exposure category C. The seismic loads are also estimated using
ASCE-7 (2010) with a soil class C, as per the recommendations of recent hazard assessment studies and
design provisions for the UAE. The adopted live load is 3.80 kN/m2, while the permanent loads used in
design include the self-weight of structural members in addition to a uniformly distributed load on slab
of 4.0 kN/m2, which is intended to account for superimposed dead loads. Taking into consideration the
moderate seismicity of the UAE, intermediate moment resisting frames are employed in the design of
such buildings. The design information is used in the numerical modelling phase, as explained below.
Table 3: Design summary of the vertical structural members of the 26-story building
Pier P
Location of section Foundation Floor no. 3 Floor no. 8 Floor no. 12 Floor no. 17
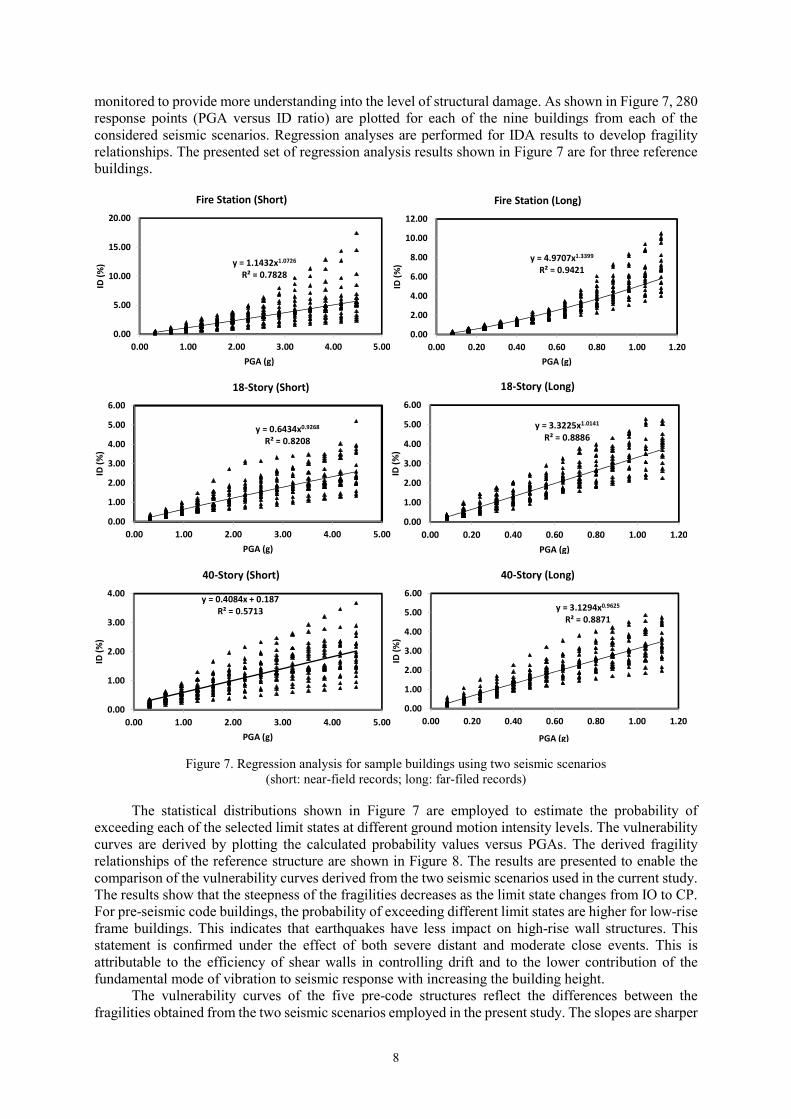
The statistical distributions shown in Figure 7 are employed to estimate the probability of
exceeding each of the selected limit states at different ground motion intensity levels. The vulnerability
curves are derived by plotting the calculated probability values versus PGAs. The derived fragility
relationships of the reference structure are shown in Figure 8. The results are presented to enable the
comparison of the vulnerability curves derived from the two seismic scenarios used in the current study.
The results show that the steepness of the fragilities decreases as the limit state changes from IO to CP.
For pre-seismic code buildings, the probability of exceeding different limit states are higher for low-rise
frame buildings. This indicates that earthquakes have less impact on high-rise wall structures. This
statement is confirmed under the effect of both severe distant and moderate close events. This is
attributable to the efficiency of shear walls in controlling drift and to the lower contribution of the
fundamental mode of vibration to seismic response with increasing the building height.
The vulnerability curves of the five pre-code structures reflect the differences between the
fragilities obtained from the two seismic scenarios employed in the present study. The slopes are sharper
A.Issa and A.Mwafy 9
and the probability of exceeding various limit states is much higher under the effect of the far-field
ground motions compared with near-source events. The seismic response of the pre-code high-rise
buildings (i.e. 18, 26 and 40 storeys) is acceptable at the design PGA when subjected to the near-source
records. The results confirm that the earthquake magnitude and distance have a significant influence on
the seismic risk of multi-story buildings. The findings support the observations discussed above about
the vulnerability of the pre-code buildings to severe distant earthquakes compared with moderate close
events. The low impacts of short-period records on seismic performance is noticeable and it follows the
findings of previous analytical studies (Mwafy, 2012).
The four emergency facilities show satisfactory seismic performance under the two seismic
scenarios considered herein. As discussed above in pre-code structures, far-field records have the highest
impact on emergency facilities. In spite of the good performance of modern code designed emergency
buildings, and taking into consideration their important role during and after an earthquake, it is
preferable to perform a precautionary retrofit for such facilities to minimize seismic losses.
0
0.2
0.4
0.6
0.8
1
0 0.5 1 1.5
P(L
imit State|G
MI)
PGA (g)
IO-Long
LS-Long
CP-Long
IO-Short
LS-Short
CP-Short
0
0.2
0.4
0.6
0.8
1
0 0.5 1 1.5
P(L
imit State|G
MI)
PGA (g)
IO-Long
LS-Long
CP-Long
IO-Short
LS-Short
CP-Short
0
0.2
0.4
0.6
0.8
1
0 0.5 1 1.5
P(L
imit State|G
MI)
PGA (g)
IO-Long
LS-Long
CP-Long
IO-Short
LS-Short
CP-Short
BO-02, 2-storey BO-08, 8-storey BO-18, 18-storey
0
0.2
0.4
0.6
0.8
1
0 0.5 1 1.5
P(L
imit State|G
MI)
PGA (g)
IO-Long
LS-Long
CP-Long
IO-Short
LS-Short
CP-Short
0
0.2
0.4
0.6
0.8
1
0 0.5 1 1.5
P(L
imit State|G
MI)
PGA (g)
IO-Long
LS-Long
CP-Long
IO-Short
LS-Short
CP-Short
0
0.2
0.4
0.6
0.8
1
0 0.5 1 1.5
P(L
imit State|G
MI)
PGA (g)
IO-Long
LS-Long
CP-Long
IO-Short
LS-Short
CP-Short
BO-26, 26-storey BO-40, 40-storey FS, Fire Station
0
0.2
0.4
0.6
0.8
1
0 0.5 1 1.5
P(L
imit State|G
MI)
PGA (g)
IO-Long
LS-Long
CP-Long
IO_Short
LS-Short
CP-Short
0
0.2
0.4
0.6
0.8
1
0 0.5 1 1.5
P(L
imit State|G
MI)
PGA (g)
IO-Long
LS-Long
CP-Long
IO-Short
LS-Short
CP-Short
0
0.2
0.4
0.6
0.8
1
0 0.5 1 1.5
P(L
imit State|G
MI)
PGA (g)
IO-Long
LS-Long
CP-Long
IO-Short
LS-Short
CP-Short
PS, Police Station SC, School HO, Hospital
Figure 8. Fragility curves of nine reference structures using two seismic scenarios (short: near-field records;
long: far-filed records)
To provide more representative results from the derived fragility curves, limit states probabilities
are estimated at the design and twice the design PGAs for far-field records, twice and four times the
design for near-source records (Figure 9). Two main observations are evident; the first observation is
that pre-code structures are significantly more vulnerable compared with emergency facilities. The
second observation is that far-field records have much higher impact on the reference structures over
the near-source records. The large increase in the probabilities of various limit states is also clear when
the buildings are subjected to twice and four times the design intensities for far-field and short-period
records, respectively.
10
0
0.2
0.4
0.6
0.8
1
BO-02
(1D)
BO-02
(2D)
BO-08
(1D)
BO-08
(2D)
BO-18
(1D)
BO-18
(2D)
BO-26
(1D)
BO-26
(2D)
BO-40
(1D)
BO-40
(2D)
Pro
ba
bil
ity
(%
)
Building
IO LS CP
0
0.2
0.4
0.6
0.8
1
BO-02
(2D)
BO-02
(4D)
BO-08
(2D)
BO-08
(4D)
BO-18
(2D)
BO-18
(4D)
BO-26
(2D)
BO-26
(4D)
BO-40
(2D)
BO-40
(4D)
Pro
ba
bil
ity
(%
)
Building
IO LS CP
Pre-code buildings,
Far-field records at the design (1D) and at twice the design
(2D)
Pre-code buildings,
Near-source records at twice the design (2D) and at four times
the design (4D)
0
0.2
0.4
0.6
0.8
1
FS (1D) FS (2D) PS (1D) PS (2D) S (1D) S (2D) H (1D) H (2D)
Pro
ba
bil
ity
(%
)
Building
IO LS CP
0
0.2
0.4
0.6
0.8
1
FS (2D) FS (4D) PS (2D) PS (4D) S (2D) S (4D) H (2D) H (4D)
Pro
ba
bil
ity
(%
)
Building
IO LS CP
Emergency facilities,
Far-field records at the design (1D) and at twice the design
(2D)
Emergency facilities,
Near-source records at twice the design (2D) and at four times
the design (4D)
Figure 9. Limit state probabilities of the nine reference buildings
CONCLUSIONS
Pre-code structures and emergency facilities are of high significance in the potential consequences from
natural hazard events since they represent high levels of vulnerability and readiness of service,
respectively. Due to the significance of such structures along with increasing the frequency of seismic
activities, a detailed vulnerability assessment of seismic risk in the earthquake prone areas of the UAE
is necessary in order to effectively estimate and mitigate earthquake losses. This comprehensive study
enabled the derivation of a wide range of dynamic response simulation-based fragility relationships for
pre-seismic code buildings and emergency facilities. The study included the selection, structural design
and developing verified fibre-based simulation models for nine reference structures representing a wide
range of the pre-code structures and emergency facilities in the UAE. The selection and scaling of 40
input ground motions representing the near-field and far-field earthquake scenarios anticipated in a
highly populated seismically prone area of the UAE were briefly discussed. The limit state criteria
employed for deriving fragility curves were selected based on the mapping of local and global response
parameters from inelastic pushover analyses (IPAs) and incremental dynamic analyses (IDAs) as well
as from previous studies. The measured seismic response from a large number of IDAs was related to
ground motion intensity to derive the fragility relationships of the nine reference structures.
The probability of exceeding limit states was much higher and the slopes were sharper under the
effect of the far-field earthquake scenario compared with the near-source counterpart. The latter seismic
scenario had low impacts on the seismic response of the reference buildings, especially the emergency
facilities at the design and twice the design intensity. The high impacts of the far-field seismic scenario
are attributed to the higher spectral amplifications and effective durations of the long period input ground
motions. At the design intensity, the seismic response of the pre-seismic code wall structures and
emergency facilities was acceptable under the near-field seismic scenario. On the other hand, the
presented study confirmed the vulnerability of a wide range of pre-code buildings to the far-field seismic
A.Issa and A.Mwafy 11
scenario anticipated in the earthquake-prone areas of the UAE. It also showed the lower vulnerability of
emergency buildings due to the adoption of modern code provisions in the design of such facilities. The
results support implementing a mitigation strategy for reducing the seismic risk of pre-code structures
by means of various rehabilitation techniques. Such measures include but not limited to, reinforced
concrete jacketing, fibre-reinforced polymers (FRP) wrapping, and buckling-restrained braces (BRB). In spite of the acceptable performance of modern code designed emergency buildings under near-field
events, and taking into consideration their crucial role following an earthquake, it is recommended to
perform a precautionary retrofit for such facilities to minimize seismic losses, particularly under the
effect of the far-field seismic scenario. The developed fragility functions in this study are an essential
component for the estimation of possible earthquake losses in the UAE. The outcomes of the present
study motivates interdisciplinary research activities in future to develop a comprehensive earthquake
loss assessment and mitigation system to preserve the large investments in the construction industry in
this region.
AKCNOWLEDGEMENT
This work was supported by the United Arab Emirates University under research grants no. 31N132 and
31N007.
REFERENCES
Abdalla J A, and Al-Homoud A S (2004) "Seismic hazard assessment of United Arab Emirates and its
surroundings," Journal of Earthquake Engineering, 8(6): 817-837
ACI-318 (2011) "Building Code Requirements for Structural Concrete and Commentary (318-11)." American
Concrete Institute, Detroit, Michigan,
Ambraseys N, Smit P, Douglas J, Margaris B, Sigbjörnsson R, Olafsson S, Suhadolc P, and Costa G (2004)
"Internet site for European strong-motion data," Bollettino di Geofisica Teorica ed Applicata, 45(3): 113-
129
ASCE-7 (2010) "Minimum design loads for buildings and other structures, ASCE Standard ASCE/SEI 7-10."
American Society of Civil Engineers, Reston, VA,
ASCE-41 (2007) "Seismic Rehabilitation of Existing Buildings (ASCE/SEI 41-06)." American Society of Civil
Engineers, Reston, VA
Ashri A, and Mwafy A M "3D vulnerability functions for contemporary buildings with varying structural systems
and heights", Proceedings, Second European Conference on Earthquake Engineering and Seismology
(2ECEES)
ATC (1996) Seismic evaluation and retrofit of concrete buildings, Applied Technology Council, report ATC-40.
Redwood City
Bruneau M, and Reinhorn A (2007) "Exploring the concept of seismic resilience for acute care facilities,"
Earthquake Spectra, 23(1): 41-62
BS8110 (1986) "Structural use of concrete." BS8110, British Standard Institution, London,
BS-6399-2 (1998) "6399-2. Loading for buildings, Part 2: Code of practice for wind loads." British Standard
Institution, London,
Buratti N, Ferracuti B, and Savoia M (2010) "Response surface with random factors for seismic fragility of