THE Jonzeinr. OF BIO~.OGICAL CHEMISTRY Vol. 239, No. 5, May 1964 Printed in U.S.A. Fragmentation of Bovine Serum Albumin by Pepsin I. THE ORIGIN OF THE ACID EXPANSION OF THE ALBU&IIN MOLECULE GREGORIO WEBER AND LORNA B. YOUNG From the Biochemistry Division, Department of Chemistry and Chemical Engineering, Unive&ty of Illinois, Urbana, Illinois (Received for publication, August 15, 1963) A long series of studies has shown that serum albumin changes very markedly, though reversibly, certain of its physicochemical properties over the pH range 4 to 2 (1). The sedimentation constant (I), translational diffusion coefficient (2), rotational relaxation time (3, 4), and specific viscosity and specific optical rotation (5) all show changes of considerable magnitude. To this list low angle x-ray scattering has been added recently (6). From the data of sedimentation and diffusion, as well as light scattering (2), the molecular weight at neutral pH of 68,000 is known to remain unchanged in acid solution. Inspection of the values of Table I with this fact in mind shows that, whereas the frictional coefficient for the translation increases in acid solution -as revealed by a decrease of both s and D-the average fric- tional coefficient for the rotation calculated from the mean rota- tional relaxation time, ph, decreases by a factor of 2. A model that would account for such changes is one in which the protein is composed of globular parts linked by flexible peptide chain segments. The addition of acid is supposed to produce, through electrostatic repulsion, a spatial separation of the globular parts, allowed in this protein because of the flexible links between them. A similar change would be expected to occur in alkaline solution and has indeed been experimentally demonstrated (3). An over-all swelling of the molecule would give rise to the ob- served decrease in s and D but should lead to an increase in ph, as observed by Churchich (7) in reduced bovine serum albumin and by Wahl (8) in synthetic ra.ndom coil polymers. A model of globular and flexible parts, or one closely equivalent, has been proposed by Luzzatti, Witz, and Nicolaieff (6) from observations of low angle x-ray scattering alone. An almost inescapable consequence of this model is that a protease acting in acid solution should preferentially act upon the peptide bonds of the linking segments, thus liberating a small number of globular units. This paper describes experiments that show that a short di- gestion with pepsin produces the appearance of a small number of fragments with high molecular weight, the supposed compact units present in the molecule, and describes the properties of such digestion mixtures with respect to sedimentation, rotational diffusion, and binding of the polycyclic anion, anilinonaphtha- lenesulfonic acid. In the following paper, the properties of the isolated fragments of digestion are described. EXPERIMENTAL PROCEDURE Crystalline bovine serum albumin (Armour and Company) was used throughout. Crystalline pepsin (Worthington Biochemical Corporation) was used. An absorbance of 1 liter g-l cm-l at 280 rnp was used in calculating the amount of pepsin in solution. The magnesium salt of I-anilinonaphthalene-8-sulfonic acid was recrystallized several times from water after filtration of the hot solutions successively through charcoal and talc. The original material was Eastman Kodak l-anilinonaphthalene-8- sulfonic acid. The green crystals of the magnesium salt were dried at 120” for several hours. Their molar absorption coeffi- cient was observed to be independent of concentration in the range 5 X 1O-3 to 5 X IO+ M. It was 4.95 f 0.1 X IO3 M-~ cm-l at 350 rnp. The measurements of fluorescence polarization were done in the apparatus described by Weber (9). Relative fluorescence efficiencies were determined by measuring the photocurrents with a sensitive galvanometer. In either case the fluorescence was excited by the 365-rnp line isolated from a high pressure mercury arc by a filter (Corning Glass 7-60). The fluorescent light was filtered through a 2-mm layer of a molar solution of NaNOz and a 3-71 Corning glass filter. The light detectors were EM1 9558 photomultipliers. The measurements were done at 25”. To increase the vis- cosity of the solutions, sucrose in known amount was added, and the viscosity at 25” was obtained by interpolation based on the values of Bingham and Jackson (10). RESULTS I. Experiments with Conjugates of Bovine serum Albumin with Dimethylaminonaphthalenesulfochloride The changes in rotational relaxation time obtained in acid solutions of bovine serum albumin may be conveniently followed by the decrease in the polarization of the fluorescence of con- jugates of albumin with dimet,hylaminonaphthalenesulfochloride. With the experimental technique utilized (lo), the polarization of the fluorescence of 1OV M solutions of conjugates with 2 moles of naphthyl residue per mole of albumin can be measured in a few minutes with a precision of ~1%. The conjugates em- ployed contained 1.5 to 2 naphthyl residues per mole of BSA.’ They were prepared, and the absence of free dimethylamino- naphthalenesulfonic acid was ascertained, as already described (3, 11). To follow the digestion of DES-BSA by pepsin, samples of the incubation mixture were withdrawn at intervals and rapidly 1 The abbreviations used are: DNS-BSA, conjugate of bovine serum albumin with 1-dimethvlaminonanhthalene-5-sulfochlo- ride; BSA, bovine serum albumin; and ANS, l-anilinonaphtha- lene-8-sulfonic acid. One nanosecond (I nsec), lo-” second. 1415 by guest on June 19, 2018 http://www.jbc.org/ Downloaded from
Transcript
THE Jonzeinr. OF BIO~.OGICAL CHEMISTRY Vol. 239, No. 5, May 1964
Printed in U.S.A.
Fragmentation of Bovine Serum Albumin by Pepsin
I. THE ORIGIN OF THE ACID EXPANSION OF THE ALBU&IIN MOLECULE
GREGORIO WEBER AND LORNA B. YOUNG
From the Biochemistry Division, Department of Chemistry and Chemical Engineering, Unive&ty of Illinois, Urbana, Illinois
(Received for publication, August 15, 1963)
A long series of studies has shown that serum albumin changes very markedly, though reversibly, certain of its physicochemical properties over the pH range 4 to 2 (1). The sedimentation constant (I), translational diffusion coefficient (2), rotational relaxation time (3, 4), and specific viscosity and specific optical rotation (5) all show changes of considerable magnitude. To this list low angle x-ray scattering has been added recently (6).
From the data of sedimentation and diffusion, as well as light scattering (2), the molecular weight at neutral pH of 68,000 is known to remain unchanged in acid solution. Inspection of the values of Table I with this fact in mind shows that, whereas the frictional coefficient for the translation increases in acid solution -as revealed by a decrease of both s and D-the average fric- tional coefficient for the rotation calculated from the mean rota- tional relaxation time, ph, decreases by a factor of 2. A model that would account for such changes is one in which the protein is composed of globular parts linked by flexible peptide chain segments. The addition of acid is supposed to produce, through electrostatic repulsion, a spatial separation of the globular parts, allowed in this protein because of the flexible links between them. A similar change would be expected to occur in alkaline solution and has indeed been experimentally demonstrated (3). An over-all swelling of the molecule would give rise to the ob- served decrease in s and D but should lead to an increase in ph, as observed by Churchich (7) in reduced bovine serum albumin and by Wahl (8) in synthetic ra.ndom coil polymers. A model of globular and flexible parts, or one closely equivalent, has been proposed by Luzzatti, Witz, and Nicolaieff (6) from observations of low angle x-ray scattering alone.
An almost inescapable consequence of this model is that a protease acting in acid solution should preferentially act upon the peptide bonds of the linking segments, thus liberating a small number of globular units.
This paper describes experiments that show that a short di- gestion with pepsin produces the appearance of a small number of fragments with high molecular weight, the supposed compact units present in the molecule, and describes the properties of such digestion mixtures with respect to sedimentation, rotational diffusion, and binding of the polycyclic anion, anilinonaphtha- lenesulfonic acid. In the following paper, the properties of the isolated fragments of digestion are described.
EXPERIMENTAL PROCEDURE
Crystalline bovine serum albumin (Armour and Company) was used throughout.
was used. An absorbance of 1 liter g-l cm-l at 280 rnp was used in calculating the amount of pepsin in solution.
The magnesium salt of I-anilinonaphthalene-8-sulfonic acid was recrystallized several times from water after filtration of the hot solutions successively through charcoal and talc. The original material was Eastman Kodak l-anilinonaphthalene-8- sulfonic acid. The green crystals of the magnesium salt were dried at 120” for several hours. Their molar absorption coeffi- cient was observed to be independent of concentration in the range 5 X 1O-3 to 5 X IO+ M. It was 4.95 f 0.1 X IO3 M-~
cm-l at 350 rnp. The measurements of fluorescence polarization were done in
the apparatus described by Weber (9). Relative fluorescence efficiencies were determined by measuring the photocurrents with a sensitive galvanometer. In either case the fluorescence was excited by the 365-rnp line isolated from a high pressure mercury arc by a filter (Corning Glass 7-60). The fluorescent light was filtered through a 2-mm layer of a molar solution of NaNOz and a 3-71 Corning glass filter. The light detectors were EM1 9558 photomultipliers.
The measurements were done at 25”. To increase the vis- cosity of the solutions, sucrose in known amount was added, and the viscosity at 25” was obtained by interpolation based on the values of Bingham and Jackson (10).
RESULTS
I. Experiments with Conjugates of Bovine serum Albumin with Dimethylaminonaphthalenesulfochloride
The changes in rotational relaxation time obtained in acid solutions of bovine serum albumin may be conveniently followed by the decrease in the polarization of the fluorescence of con- jugates of albumin with dimet,hylaminonaphthalenesulfochloride. With the experimental technique utilized (lo), the polarization of the fluorescence of 1OV M solutions of conjugates with 2 moles of naphthyl residue per mole of albumin can be measured in a few minutes with a precision of ~1%. The conjugates em- ployed contained 1.5 to 2 naphthyl residues per mole of BSA.’ They were prepared, and the absence of free dimethylamino- naphthalenesulfonic acid was ascertained, as already described
(3, 11). To follow the digestion of DES-BSA by pepsin, samples of
the incubation mixture were withdrawn at intervals and rapidly
1 The abbreviations used are: DNS-BSA, conjugate of bovine serum albumin with 1-dimethvlaminonanhthalene-5-sulfochlo- ride; BSA, bovine serum albumin; and ANS, l-anilinonaphtha- lene-8-sulfonic acid. One nanosecond (I nsec), lo-” second.
1416 Fragmentation of Bovine Serum Albumin by Pepsin. I Vol. 239, No. 5
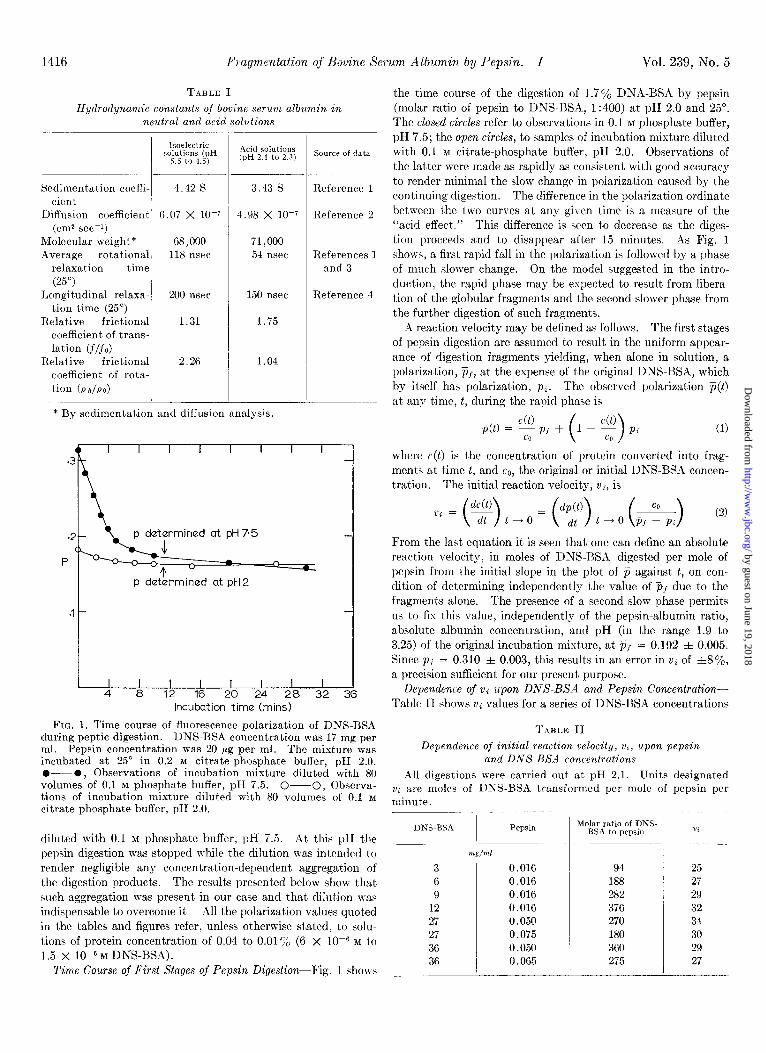
TABLE I Hydrodynamic constants of bovine serum albumin in
neutral and acid solutions
Sedimentation coeffi- cient,
Diffusion coefficient (cm* set-l)
Molecular weight* Average rotational
relaxat,ion time (250)
Longitudinal relaxa- tion time (25”)
Relative frictional coefficient of trans- lation (j/f0)
Relative frictional coefficient of rota- tion (P ~/PO)
lwelrctric solutions (pH
5.5 to 4.5)
4.42 S
6.07 x 10⁻⁷
68,000 118 nsec
200 nsec
1.31
2.26
Acid solutions (pH 2.! to 2.1) Source of data
3.43 s
4.98 x 10⁻⁷
71,000 54 nsec
150 nsec
1.75
1.04
Reference 1
Reference 2
References 1 and 3
Reference 4
* By sedimentation and diffusion analysis.
.3I
p dQtQfTiinQd at pH 75
p determined at pH2
I I I I 1 I I I I 4 8 12 16 20 24 28 32 36
Incubation time (mins)
FIG. 1. Time course of fluorescence polarization of DNS-BSA during peptic digestion. DNS-BSA concentration was 17 mg per ml. Pepsin concentration x-as 20 pg per ml. The mixture was incubated at 25” in 0.2 M citrate-phosphate buffer, pH 2.0. O--O, Observations of incubation mixture diluted with 80 volumes of 0.1 M phosphate buffer, pH 7.5. O--O, Observa- tions of incubation mixture diluted with 80 volumes of 0.1 M citrate-phosphate buffer, pH 2.0.
diluted with 0.1 M phosphate buffer, pH 7.5. At this pH the pepsin digestion was stopped while the dilution was intended to render negligible any concentration-dependent aggregation of the digestion products. The results presented below show that such aggregation was present in our case and that dilution was indispensable to overcome it All the polarization values quoted in the tables and figures refer, unless otherwise stated, to solu- tions of protein concentration of 0.04 to 0.01% (6 X 1OP M to 1.5 x 1O-6 M DNS-MA).
Time Course of First Stages of Pepsin Digestion-Fig. 1 shows
t’he time course of the digestion of 1.7G/, DNA-BSA by pepsin (molar ratio of pepsin to DNS-BSA, 1:400) at pH 2.0 and 25”. The closed circles refer to observations in 0.1 M phosphate buffer, pH 7.5; the open circles, to samples of incubation mixture diluted with 0.1 M citrate-phosphate buffer, pH 2.0. Observations of the latter were made as rapidly as consistent with good accuracy to render minimal the slow change in polarization caused by the continuing digestion. The difference in the polarization ordinate between the two curves at any given time is a measure of the “acid effect.” This difference is seen to decrease as the diges- tion proceeds and to disappear after 15 minutes. As Fig. 1 shows, a first rapid fall in the polarization is followed by a phase of much slower change. On the model suggested in the intro- duction, the rapid phase may be expected to result from libera- tion of the globular fragments and the second slower phase from the further digestion of such fragments.
A reaction velocity may be defined as follows. The first stages of pepsin digestion are assumed to result in the uniform appear- ance of digestion fragments yielding, when alone in solution, a polarization, @f, at the expense of the original DNS-WA, which by itself has polarization, pi. The observed polarization p(t) at any time, t, during the rapid phase is
p(t) = c+ p, + 1 - $ pi ( ‘> (1)
where c(t) is the concentration of protein converted into frag- ments at time t, and cO, the original or initial DNS-BSA concen- tration. The init.ial reaction velocity, Eli, is
From the last equation it is seen that one can define an absolute reaction velocity, in moles of DNS-RSA digested per mole of pepsin from the initial slope in the plot of j? against t, on con- dition of determining independently the value of pf due to the fragments alone. The presence of a second slow phase permits us to fix this value, independently of the pepsin-albumin ratio, absolute albumin concentration, and pH (in the range 1.9 to 3.25) of the original incubation mixture, at P,r = 0.192 f 0.005. Since pi = 0.310 f 0.003, this results in an error in vi of &3%, a precision sufficient for our present purpose.
Dependence of vi upon DNS-BSA and Pepsin Concentration- Table II shows vi values for a series of DNS-BSA concentrations
T:LBLE II
Dependence of initial reaction velocity, vi, upon pepsin and DNS-BSA concentrations
All digestions were carried out at pH 2.1. Units designated vi are moles of DNS-BSA transformed per mole of pepsin pei minute.
I I I I I I I I I l I I I 1 t’PF2iO 2 G 10 14 18 22 26 30 34
Tima (mins.)
FIG. 2. Effect of pH of incubation upon fluorescence polariza- tion of DNS-BSA digested by pepsin. Incubation mixtures con- tained 18 mg of DNS-BSA per ml and 20 fig of pepsin. The ob- servations refer to 80-fold dilutions of the incubation mixture with 0.1 M phosphate buffer, pH 7.5.
and molar ratios of DNS-BSA to pepsin. For concentrations of DNS-BSA ranging from 0.3 to 3.60/, and molar ratios of DKS- BSX to pepsin of 94 to 375, vi remains almost constant-at 27 to 35 moles of DNS-BSA transformed per mole of pepsin per minute-showing that under these conditions maximal velocity is reached. It will be shown in the following paper that three or four fragments appear from the first stages of digestion, so that the observed velocity corresponds to a turnover number of 60 to 100 peptide bonds broken per mole of pepsin per minute, a figure comparable to the rate of hydrolysis of synthetic pep- tides by pepsin.
Dependence of vi upon pE-l-The results are summarized in Fig. 2, which shows the time course of the polarizat,ion changes for l.Soj, DNS-BSA solutions digested by pepsin at a molar ratio of DNS-BSA to pepsin of 1:360, at various pH values from 1.9 to 4.05. The curves of pH values 1.9 to 3.25 are re- markably alike, and they yield virtually the same vi value. At pH 3.75, vi decreases to s of the low pH value, and at pH 4.05 it is only 2 x 10M3 of it.2 These effects may be understood by reference to Fig. 3, which shows the curve of pH versus polariza- tion for intact DNS-BSA (closed circles). The fact that the acid changes are only observable at pH 4 explains the “switch off” of the pepsin action at pH 4.05, if pepsin digestion is only possible in molecules that have undergone the changes observ- able at the acid pH values. The remarkable constancy of vi in the range 3.25 to 1.9 may be due to compensation of two oppos- ing influences: on the one hand, the number of molecules in the configuration required for the pepsin digestion, which increases with decreasing pH; and on the other, an intrinsic rate of hy- drolysis of the exposed peptide bonds, which, below pH 3.25, decreases with pH if its own pH optimum is about 3 or higher.
* While there was little difference in the values of zli at pH 3.5 or lower in different DNS-BSA preparations, one was observed in which digestion at pH 4.0 proceeded some 10 times faster than here indicated, although to a limited extent. This phenomenon is now under study.
Alternatively the changes in the protein structure occurring below pH 3.25 may be irrelevant with respect to the action of pepsin on DNS-BSA, although leading to observable changes in polarization.
Properties of pli 3.0 Initial Digest-This is defined as the re- sult of incubation of DNS-BSA and pepsin at 25”, in 0.2 M cit- rate-phosphate buffer, pH 3.0, for a time sufficient to bring the polarization of the fluorescence excited by 365-rnp light to 0.193, when the polarization measurements are carried out at 25”, in 0.1 M phosphate buffer at a protein concentration of 0.1 mg per ml.
Concentration Dependence of Fluorescence Polarization and Sedimentation Constant of Initial Digest-Fig. 4 shows the de- pendence of the fluorescence polarization upon the protein con- centration of the solution of digest observed. Since the polariza- tion of intact DNS-BSA shows no concentrat,ion dependence whatever and the same is true of a variety of monodisperse systems, the observed concentration dependence must result
2 3 4 PH
5 6 i FIG. 3. Effect of pH upon original DNS-BSA and DNS-BSA
digest. DNS-BSA (O---O) or DNS-BSA initial digest (O-O) (0.2 mg of DNS-BSA per ml, pH 3.0, were adjusted to the required pH with 1 N HCl).
.240-
P
-190-
log CNBAI
FIG. 4. Concentration dependence of polarization of fluores- cence of pH 3.0 initial peptic digest of DNS-BSA. [N&I] = Molar DNS-BSA concentration in original digestion mixture. Observations were made at 2” and 25” in 0.05 M phosphate buffer, pH 5.0.
1418 FragwLentation of Bovine Serum Albumin by Pepsin. I Vol. 239, No. 5
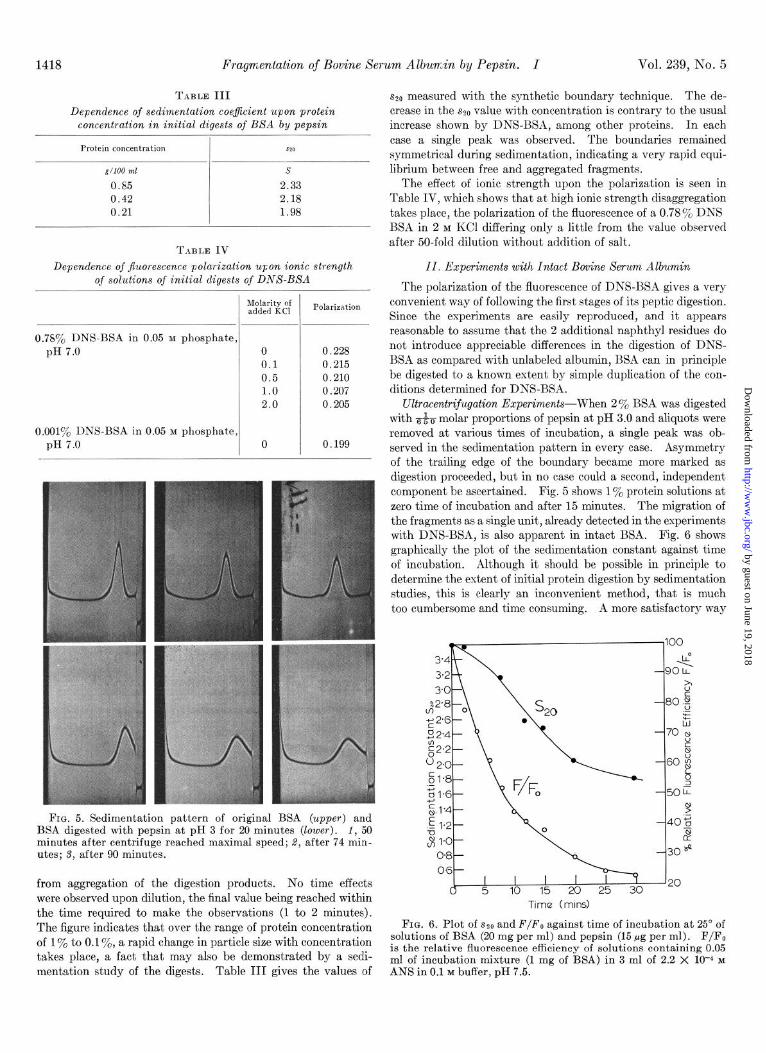
TABLE III Dependence of sedimentation coejicient upon protein,
concentration in initial digests of BSA by pepsin
Protein concentration
g/100 ml
0.85 0.42 0.21
szo
s
2.33 2.18 1.98
TABLE IV Dependence of JEuorescence polarization upon ionic strength
of solutions of initial digests of DNS-BSA
Molarity of added KC1 Polarizhtion
0.7FC% DNS-BSA in 0.05 M phosphate, pH 7.0 0 0.228
0.1 0.215 0.5 0.210 1.0 0.207 2.0 0.205
O.OOl~o DNS-BSA in 0.05 M phosphate, pH 7.0 0 0.199
FIG. 5. Sedimentation pattern of original BSA (upper) and BSA digested with pepsin at pH 3 for 20 minutes (lower). 1, 50 minutes after centrifuge reached maximal speed; 8, after 74 min- utes; 3, after 90 minutes.
from aggregation of the digestion products. No time effects were observed upon dilution, the final value being reached within the time required to make the observations (1 to 2 minutes). The figure indicates that over the range of protein concentration of 1% to 0.1 To, a rapid change in particle size with concentration takes place, a fact that may also be demonstrated by a sedi- mentation study of the digests. Table III gives the values of
~2~ measured with the synthetic boundary technique. The de- crease in the sZo value with concentration is contrary to the usual increase shown by DNS-BSA, among other proteins. In each case a single peak was observed. The boundaries remained symmetrical during sedimentation, indicating a very rapid equi- librium between free and aggregated fragments.
The effect of ionic strength upon the polarization is seen in Table IV, which shows that at high ionic strength disaggregation takes place, the polarization of the fluorescence of a 0.78yo DNS BSA in 2 M KC1 differing only a little from the value observed after 50-fold dilution without addition of salt.
II. Experiments with Intact Bovine serum Albumin
The polarization of the fluorescence of DNS-BSA gives a very convenient way of following the first stages of its peptic digestion. Since the experiments are easily reproduced, and it appears reasonable to assume that the 2 additional naphthyl residues do not introduce appreciable differences in the digestion of DNS- BSA as compared with unlabeled albumin, BSA can in principle be digested to a known extent by simple duplication of the con- ditions determined for DNS-BSA.
Ultracentrif~~gation Experiments-When 2 % BSA was digested with &~j molar proportions of pepsin at pH 3.0 and aliquots were removed at various times of incubation, a single peak was ob- served in the sedimentation pattern in every case. Asymmetry of the trailing edge of the boundary became more marked as digestion proceeded, but in no case could a second, independent component be ascertained. Fig. 5 shows 1% protein solutions at zero time of incubation and after 15 minutes. The migration of the fragments as a single unit, already detected in the experiments with DNS-BSA, is also apparent in intact BSA. Fig. 6 shows graphically the plot of the sedimentation constant against time of incubation. Although it should be possible in principle to determine the extent of initial protein digestion by sedimentation studies, this is clearly an inconvenient method, that is much too cumbersome and time consuming. A more satisfactory way
I I I I 5 10 15 20 25 30
20
Time (mins)
FIG. 6. Plot of ~20 and F/F0 against time of incubation at 25” of solutions of BSA (20 mg per ml) and pepsin (15 pg per ml). F/F0 is the relative fluorescence efficiency of solutions containing 0.05 ml of incubation mixture (1 mg of BSA) in 3 ml of 2.2 X 10-t M
of following the progressive fragmentation of the protein consists of measuring the changes in binding power towards the aromatic anion, I-anilinonaphthalene-8-sulfonate.
Experiments with ANS-Weber and Laurence (12) found that a series of dyes, including 1 -anilinonaphthalene-8-sulfonic acid (ANS), that exhibit in water solution very small quantum yields increase these dramatically upon adsorption on native serum albumin, although other proteins are virtually inactive. This property forms the basis of the method of determination of al- bumin in plasma of Fildes, Laurence, and Rees (13). ANS has a quantum yield of 0.004 in water solution, and 0.75-more than 100 times greater-when adsorbed upon BSA. Klotz (14) has shown that the adsorption of dyes on albumin may be charac- terized by the quantities n and K; n is the number of moles of dye absorbed by a mole of albumin, and K is the statistical dis- sociation constant of the dye-albumin complexes. These are related to the total protein concentration P, dye concentration, D, and fraction of dye bound, x, by the equation:
P 1 K -=- xD n ’ + (1 - x)D >
(3)
A plot of P/xD against l/(1 - x)D may be used to obtain from a single set of experiments both n and K. It is possible to get similar information> with some advantage in our case, by simple plots of x against P, while D is held constant at a value, Do. Replacing in Equation 3 l/l - x by its equivalent, 1 + x + x2 + x3. .) the adsorption isotherm may be rearranged to give,
nP -=x+ Do + K
* (2” + x3 . .) 0
(4)
For values of 2 small in comparison with unity, x2 and higher powers of 2 are negligible and the initial slope in the plot of x against P equals n/Do + I<. If a concentration, Do > K, is used, Do + K may be replaced by Do without appreciable error so that the initial slope equals n/Do. On the other hand, having thus calculated n, a value of Do of order K may be used to determine K itself. This procedure has been used with intact BSA and with BSA submitted to the first rapid stage of pepsin digestion. x = F/F0 where FO is the actual observed fluorescence efficiency when all the dye in solution has been adsorbed. F. was determined directly by adding excess BSA. F. remained constant for Do 5 lOP, when P varied from 10e5 to 5 X 10M4 M.
With initially digested BSA, Fo was determined by a reciprocal plot of l/F against l/P. The value for adsorption on the digest was 6% higher than that for intact BSA. Intact BSA gave n = 5.02 and K = 3.2 X lop6 M; initially digested BSA, n = 1.3 f 0.3 and K = 5.6 X lop5 M. The initial digestion appears to decrease both the number of molecules adsorbed and the affinity for each molecule. From Equation 4, if J: << 1,
t+)(!w)
where the subscripts i and f refer to intact and fragmented BSA respectively. For Do >> K,, since Iif >> Ki,
xi ni -=- (5) XJ nf
Xi (Ki : Do) -= (6) XJ nJ
K,
For x << 1 we also require P N Ki in the last case. Equations 5 and 6 show that it is possible to follow changes
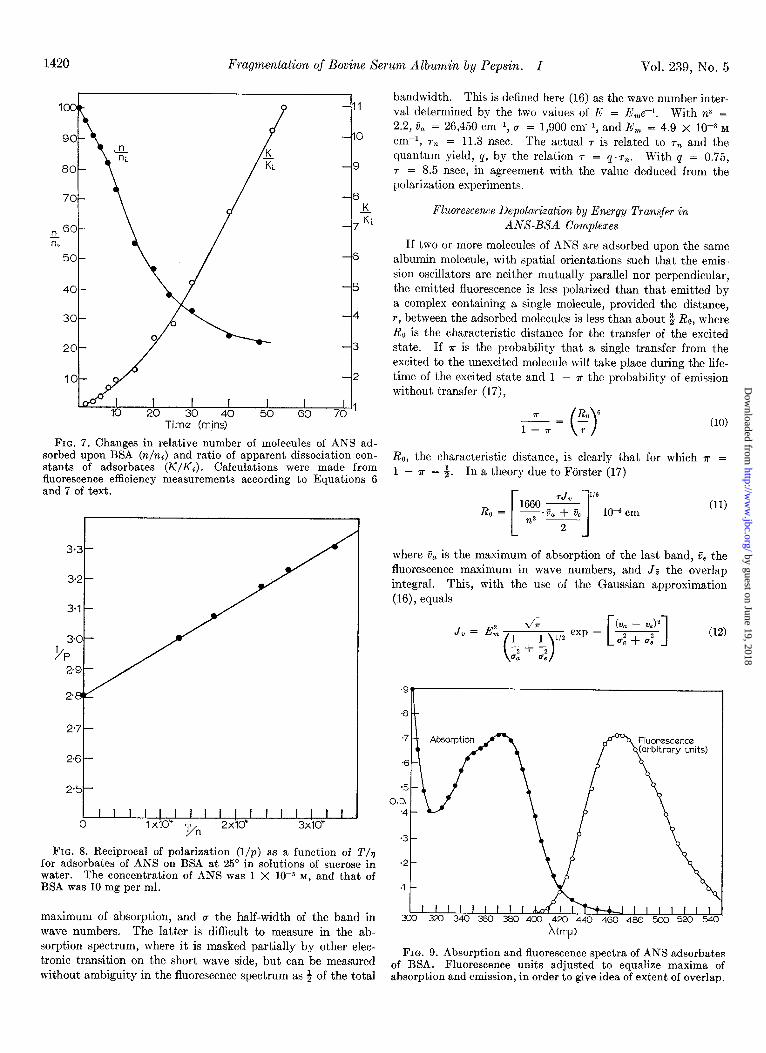
in n and K during digestion by using high (2.1 x 1O-4 M) and low (7 X 10e7 M) ANS concentrations respectively. An esperi- ment of this type is shown in Fig. 7. The figure shows that, within the rapid phase of change of n it is possible to distinguish two distinct slopes, one corresponding to the first few minutes of digestion and another, larger, in the period immediately fol- lowing. Clearly the possibility of investigating intermediate stages within the first phase of pepsin action exists, although we have not made use of it.
Fluorescence Polarization of ANS-BSA Complexes-The de- pendence of the polarization of the fluorescence, p, upon the rotational relaxation time, ph, and the lifetime of the excited state, 7, of the fluorescence is given by the equation:
(;-;)=(;-;)(I+;) The rotational relaxation time is a linear function of Q/T (T is absolute temperature, and 11 is the viscosity coefficient of the solvent) so that a plot of l/p against T/v should give a straight line with intercept l/p, at T/T = 0. Using l/p, thus calculated and the polarization, p, observed in water at 25” we have
1 I -- -
P PO T---x; 1
(7)
PO 3
from which T may be calculated if ph is known. The reciprocal of the polarization of the fluorescence emitted
by ANS adsorbates on bovine albumin as a function of T/q is shown in Fig. 8. The ratio of albumin to ANS molecules is 15:l. The observations were made at 25”, the viscosity of the solution being varied by the addition of sucrose, which even at high concentrat,ion has no influence upon the fluorescence effi- ciency of the adsorbates. With the use in Equation 7 of the value 118 nsec for the mean rotational relaxation time of albu- min at 25”, r (the lifetime of the excited state of the fluorescence of the adsorbate) is 8.0 nsec. On the other hand, r may be calculated from the spectroscopic data of Fig. 9, which shows the absorption and fluorescence spectra of the adsorbates. The l’errin-FGrster (15) equation for this purpose is
1 - = 2.88 X IO* nz 02
s E, do (8)
m
where r, is the natural lifetime of the oscillator, n the refractive index of the medium surrounding the oscillator, z?, the wave number of the absorption maximum, and EC the molar absorp~ tion coefficient that is to be integrated over the absorpt,ion band. For the latter integration the Gaussian approximation (16)
s E,do = uE,& (9)
has been used. E, is the molar absorption coefficient at the
1420 Fragmentation of Bovine Serum Albumin by Pepsin. I Vol. 239. No. 5
1 -411
-8
-,?i
G
-5
30- -4
-3
-2
I I IO 20 30 40 50 GO 70 ’
Time (mins)
FIG. 7. Changes in relative number of molecules of ANS ad- sorbed upon BSA (r&i) and ratio of apparent dissociation con- stants of adsorbates (K/K;). Calculations were made from fluorescence efficiency measurements according to Equations 6 and 7 of text.
FIG. 8. Reciprocal of polarization (l/p) as a function of T/q for adsorbates of ANS on BSA at 25” in solutions of sucrose in water. The concentration of ANS was 1 X 1OW M, and that of BSA was 10 mg per ml.
maximum of absorption, and r the half-width of the band in wave numbers. The latter is difficult to measure in the ab- sorption spectrum, where it is masked partially by other elec- tronic transition on the short wave side, but can be measured without ambiguitv in the fluorescence snectrum as & of the tote.1
h(mp)
- ”
FIG. 9. Absorption and fluorescence spectra of ANS adsorbates of BSA. Fluorescence units adjusted to equalize maxima of
I ~~ 1 .~~. . ..~ absorption and emission, in order to give idea of extent of overlap.
bandwidth. This is defined here (16) as the wave number inter- val determined by the two values of E = E,e-‘. With n2 = 2.2, 6, = 26,450 cm-r, r = 1,900 cm-r, and E, = 4.9 x 10P3 M cm-r, 7% = 11.3 nsec. The actual r is related to r, and the quantum yield, 4, by the relation 7 = q.rn. With Q = 0.75, r = 8.5 nsec, in agreement with the value deduced from the polarization experiments.
Fluorescence Depolarization by Energy Transfer in ANS-BSA Complexes
If two or more molecules of 4NS are adsorbed upon the same albumin molecule, with spatial orientations such that the emis-. sion oscillators are neither mutually parallel nor perpendicular, the emitted fluorescence is less polarized than that emitted by a complex containing a single molecule, provided the distance, r, between the adsorbed molecules is less than about 8 R,,, where Ro is the characteristic distance for the transfer of the excited state. If ?r is the probability that a single transfer from the excited to the unexcited molecule will take place during the life- time of the escited state and 1 - r the probability of emission without transfer (17),
(10)
Ro, the characteristic distance, is clearly that for which a = 1 - a = 3. In a theory due to Forster (17)
116
R,, = IO* cm (11)
where 0, is the maximum of absorption of the last band, 8, the fluorescence maximum in wave numbers, and JS the overlap integral. This, with the use of the Gaussian approximation (16), equals
The subscripts a and e refer to t.he absorption and fluorescence bands respectively. With the values obtained from Fig. 9 and 7 = 8.0 nsec from the polarization measurements, Je = 2.0 X lOlo cm3 rnMp2 and R. = 24 A.
Table V shows the polarization of the fluorescence of ANS adsorbed on serum albumin, as a function of the number, fi, of moles of ANS adsorbed per mole of albumin present in solution. The decrease in polarization with the number of ANS moles adsorbed may be used to estimate the size of the adsorbing region in BSA. To be more precise, the polarization values can yield unambiguously only an upper limit for the average distance between the first two molecules adsorbed. With the additional assumption that in the population of adsorbing molecules all sites are equally likely to be occupied, the average distance be- tween the first two adsorbed molecules becomes the average distance between all pairs of sites and is therefore directly re- lated to the size of the adsorbing region.
Let jn represent the fraction of protein molecules carrying n adsorbed ANS molecules (0 $ n 5 5), and (or1 the contribution to the total fluorescent intensity by these molecules. The aver- age number, fi, of molecules of ANS adsorbed per protein mole- cule is
and
ii = zn.jn (13)
(14)
I f fi is small compared to 1, we need not consider values of n greater than 2, in which case, most sites being vacant,
.fz N fl”
and therefore
so that for d 5 1
The quantities, A = (l/p - $)-I, called by Jablonski (18) the emission anisotropy, enjoy the property (3)
A = CA,+% (17) z
where B is the observed average value, -4; the anisotropy value for the ith component when alone in solution, and cpi its frac- tional contribution to the total fluorescent intensity of the sys- tem. For the case of our two components
A = A1 (nl + A2 ‘p2 (18)
which together with Equation 16 gives,
iI (1 + 2A) = A, + 2AAc (19)
Fig. 10 shows the plot of B (1 + 2%) against 2% For iz << 1, the expected linear relation is fulfilled. The intercept, 0.340, is the emission anisotropy for a pure n = 1 populat.ion; the limit- ing slope, 0.260, is the emission anisotropy for a population with n = 2. For this last one, the theoretical treatment of Forster (17) gives as the contributions fil and #s of the originally photo-
TABLE V
Polarization of jhorescence of adsorbates of 1 -anilinonaphthalene-8-suljonate on BSA
FIG. 10. Plot of emission anisotropy, A = (l/p - l/3)-’ against 2 A (% = average number of moles of ANS adsorbed per mole of BSA). The intercept and the slope are, respectively, the values of A for homogeneous populations with I and 2 moles of ANS adsorbed upon 1 BSA molecule.
excited and the second molecule to the total fluorescent intensity:
where ?r is the probability that one transfer will take place dur- ing the lifetime of the excited state. Using again Equation 17 in the form
A, Az = &AI + &A T = __
A TT +- 1+* 1+*
where A, designates the emission anisotropy for a molecule in- directly excited, it is possible to obtain ?r, provided AT is known. A, depends on the relative orientation of the two molecules, and if the value corresponding to random orientation is introduced,
the value of r determined is a minimal value. For random binding propert.ies upon separation of fragments are almost an transfer, AT = 0.04 Al. Equation 21, with A2 = 0.260, A1 = inevitable consequence. Independent evidence exists to show 0.340, and 8, = 0.04, gives 7r = 0.33, and this value introduced that adsorption of many polycyclic aromatic dyes on bovine with R. = 24 -4 in Equation 10 gives r = 27 A. serum albumin takes place in such a way as to shield the ad-
If the two molecules first adsorbed were distributed at random sorbed molecule from the water dipoles and give the absorption over the surface of a sphere of 56 A diameter (corresponding to and fluorescence spectra of the dye the characteristics of that an anhydrous molecular weight of 68,000), the expected value from a medium of low polarizability (22, 23). I f the dye mole- of r would be 0.18 (19). It must be concluded that the binding cules are adsorbed upon a restricted region of the BSA surface, area or volume must be much smaller than the total area or as must indeed be the case if the adsorption takes place upon volume of BSA. The value of r determined above is a maxi- the surface forming the common boundaries between the globu- mal value since preferential orientation of the molecules would lar fragments, the adsorption of several fluorescent dye molecules decrease the transfer (if perpendicular to each other) or the de- should in principle result in depolarization of the fluorescence by polarization (if parallel to each other). It is not practical to transfer of the excited state. Such effect is clearly observable examine more closely the situation that obtains for fi 2 1 since when ANS is adsorbed upon BSA. With some assumptions con- the extent of multiple transfers among the molecules introduces cerning the random character of the adsorbing process, the av- further uncertainties. erage distance between the two first a.dsorbed ANS molecules has
been found to be 27 A, which is to be compared with the value of DISCUSSION 33 A expected as the average distance of separation for random
The rapid fragment’ation of serum albumin in acid solution distribution of pairs over the surface of a spherical molecule of by enzymes has been previously observed by other authors. the same anhydrous volume as serum albumin. Holiday (20) reported in 1939 that digestion of horse serum al- A model of the albumin molecule consisting of compact frag- bumin with pepsin for a few minutes gave a species sedimenting ments and flexible links bet’ween them has already been proposed as one single peak with ~20 = 1.95, clearly the same phenomenon by Foster (24) on the basis of the behavior of albumin at acid as here described. Lapresle (21) has described the appearance pH, and on the interaction of albumin with detergents. The of fragments carrying three distinct antigenic determinants to- pepsin digestion experiments discussed, together with the isola- wards human serum albumin antiserum after treatment of hu- tion of the fragments in high yield described in the following man albumin with spleen extract at pH 3.5. paper, are in complete agreement with this model.
The changes observed by us, whether followed by fluorescence polarization, sedimentation, or change in binding power toward SUMMARY
I-anilinonaphthalene-8sulfonic acid, had a biphasic time course. During the first phase, the quantity under study changes rapidly 1. The fluorescence polarization of conjugates of bovine serum in comparison with the second slow phase. The rapid phase is albumin with l-dimethylaminonaphthalene-5sulfochloride in- attributed to separation of a few large fragments, and the second cubated with0.001 of its weight of pepsin at pH 3.0 showsa phase to the slow digestion of the fragments themselves. The ob- of rapid decrease followed by one of much slower change. servations of fluorescence polarization show that after the initial 2. After t.he rapid phase, the rotational relaxation time be- phase, the average rotational relaxation time is virt,ually the comes independent of the pH of the solution; i.e. the pepsin same in neutral (pH 7) and acid (pH 2) solution. This finding treatment abolishes the well known acid effect. is easily explained if it is assumed that this phase of pepsin action 3. The sedimentation constant of intact bovine serum al- results in the breaking of peptide bonds in the flexible links that bumin undergoes a similar biphasic change upon pepsin diges- establish the continuity of the peptide chain among the several tion. compact fragments. In acid solutions the separation of the 4. A rapidly reversible concentration-dependent association of compact regions makes possible the enzyme action, a fact sub- the fragments of pepsin digestion is observed as an increase in stantiated by the different order of magnitude of the velocity sedimentation constant and fluorescence polarization with total of enzyme action at pH 4 and 3, respectively. The reversible, protein concentration. concentration-dependent association of the fragments, observed 5. Five molecules of the polycyclic aromatic anion, l-anilino- in solutions neutralized after the first phase of pepsin action, naphthalene-8sulfonate are absorbed at pH 7 by 1 molecule of shows the existence of positive physical bonds between the frag- serum albumin with a statistical binding const,ant, K = 3.2 X ments. The influence of the ionic strength of the medium upon 10F6 M. The binding power of bovine serum albumin towards this concentration-dependent association indicates that at least this anion shows a biphasic decrease during pepsin digestion with part of these physical bonds are of electrostatic nature. respect to both K and the maximal number, n, of molecules
The marked decrease in the binding power of the fragments adsorbed. After the initial phase, n = 1.3 f 0.3 and K = toward ANS 18, as compared with the neutral molecule, implies 5.6 X lO-5 M.
that the surface or surfaces upon which adsorption takes place 6. The polarization of the fluorescence of l-anilinonephthalene- undergo a change during the initial period of digestion. This 8-sulfonic acid adsorbed upon bovine serum albumin decreases alteration could be explained on the assumption that the sep- monotonically as the number of moles of the acid adsorbed per arated globular parts undergo a change of configuration upon mole of albumin increases, as a result of migration of the excited their separation, but there is no evidence whatever in favor of state. such change. On the other hand, upon separation of the frag- 7. A calculation assuming random orientation and equal bind- ments, protein-solvent interfaces are created where protein- ing power of all binding sites in the bovine serum albumin mole- protein interfaces existed. If the adsorption in the intact BSA cule gives 27 A as the distance between a pair of such sites. ta,kes place upon such protein-protein interfaces, changes in 8. The preceding observations may be explained on the as-
1422 Fragmentation of Bovine Serum Albumin by Pepsin. I Vol. 239, No. 5
sumption that the action of pepsin liberates a small number of compact globular fragments by breaking up peptide bonds in the flexible links between them, and that adsorption of l-anilino- naphthalene-Ssulfonic acid takes place upon the binding sur- faces common to two or more of the compact fragments in the intact molecule.
Acknowledgments--‘I’he possibility of using proteolysis of acid solutions of BSA as a test of the proposed model of this protein was suggested to us by Dr. Parker Small. It is a pleasure to acknowledge here our debt. We are also indebt,ed to Dr. Finn Wold for his interest and help at all times.
REFERENCES
1. HARRINGTON, W. F., JOHNSON, P., AND OTTEWILL, R. H., Bio- them. J., 62, 569 (1956).
2. CHAMPAGNE, M., Thesis, University of Strasbourg, J. chim. phys., 64, 378 (1957).
3. WEBER, G., Biochem. J., 51, 155 (1952). 4. KRAUSE, S., AND O’KONSKI, C. T., J. Am. Chem. Sot., 81, 5082
(1959). 5. YANG, J. T., AND FOSTER, J. F., J. Am. Chem. Sot., 76, 1588
hoeck und Ruprecht, Giittmgen, 1951, p. 154. WEBER, G., Biochem. J., 76, 335 (1960). F~RSTER, T., Ann Physik, 2, 55 (1947). JABLONSKI, A., Bull. Polish Acad. Sci. (Math. Phya. Ser.), 8,
259 (1960). 19. WEBER, G., AND TEALE, F. J. W., Discussions Faraday Sot.,
27, 134 (1959). 20. HOLIDAY, E., Proc. Roy. Sot. (London), Ser. B., 127, 40 (1939). 21. LAPRESL&, c., Ann. inst. Pasteur, 89, 654 (1955). 22. DAVIS. B. D.. J. Clin. Invest.. 22. 753 (19431. 23. LAURENCE, D’. J. R., Biochem: J.; 51, 168 (1952). 24. FOSTER, J. F., in F. W. PUTNAM (Editor), The plasma proteins,
LUZZATTI, V., WITZ, J., AND NICOLAIEFF, A., J. Molecular Biol. 3, 379 (1961).
CHURCHICH, J., Arch. Biochem. Biophys., 97, 574 (1962). WAHL, P., Thesis, University of Strasbourg, 1961. WEBER, G., J. Opt. Sot. Am., 46, 962 (1956). BINGHAM, E. C., AND JACKSON, R. F., Bull. Bur. Standards,
14, 59 (1918). WEBER, G., Discussions Faraday Sot., 13, 33 (1953). WEBER, G., AND LAURENCE, D. J. R., Biochem. J., 66, xxxi
(1954). FILDES, J. E., LAURENCE, D. J. R., AND REES, V. H., Biochem.
J., 66, xxxi (1954).
Vol. 1, Academic Press, Inc., New York, 1960, p. 221.