27
Framework for a Regional Agenda to Leverage MAP-21 Ernie Perry, PhD Mid-America Freight Coalition [email protected] 608-890-2310

Framework for a Regional Agenda to Leverage MAP-21
Ernie Perry, PhDMid-America Freight [email protected]

Mid-America Freight CoalitionTen States
22% of total population
23% of Country’s total truck tonnage
63% of Nation’s total rail tonnage
Inland waterway system –about all of it!
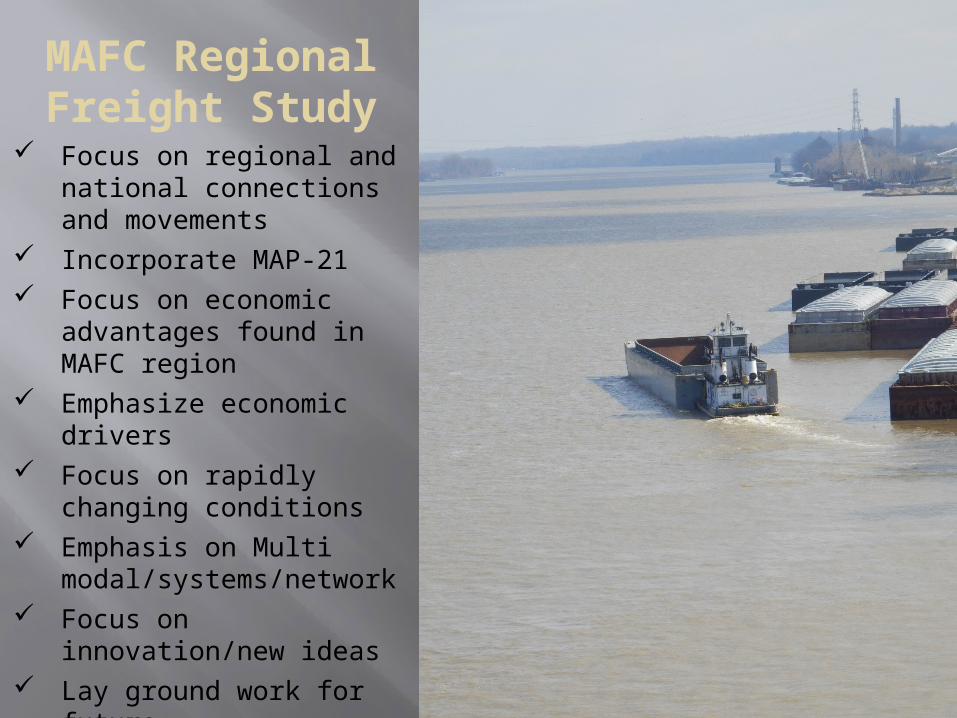
MAFC Regional Freight Study
Focus on regional and national connections and movements
Incorporate MAP-21 Focus on economic
advantages found in MAFC region
Emphasize economic drivers Focus on rapidly changing
conditions Emphasis on Multi
modal/systems/network Focus on innovation/new
ideas Lay ground work for future

Linking Regional and State Freight Planning to MAP-21 Freight Provisions

Major Freight Provisions National Freight Network
Priority Freight Network Critical Rural Corridors I-states
PrioritizationFreight Advisory CommitteesFreight PlanningFreight Performance
USDOT ProvisionsTruck SW StudyParking studyC&P
MAP-21 Freight Provisions


7
Regional Freight Study and NFN Our goal is to
identify the region’s system
Compare to USDOT PFN designation
Ensure state and regionally important corridors are represented
Make it Multimodal

What will the Primary Freight Network look like in MAFC?
We looked at:
1. Volumes
2. Value
3. Matrix Criteriahttp://www.gpo.gov/fdsys/
pkg/FR-2013-02-06/html/
2013-02580.htm
??

9
Draft High Volume Network
Meets Significant MAP-21 PFN criteria

Corridors that meet MAP-21 PFN Criteria

Tier 1 Corridors

• Identify important state and regional corridors and provide criteria related to NFN.
• Provide states with catalogue of corridors and criteria
• Document importance to system, economy, state, region and nation.

Why is PFN designation Critical? 1) Economic development2) Program benefits3) Focused funding and maintenance4) Business concentration can be expected to
continue

Freight Related Economic Development
Identify value and economic contribution
Identify policy option and investment strategies to support growth


16
CorridorCombined MSA GDP
(millions)I-94 $1,023,926 I-80 $768,315 I-90 $689,712 I-65 $652,225 I-55 $621,375
Nation MAFC %FHWA Major Freight
Corridor Miles 29,417 6,508 22%2009 GDP (billions) $13,974 $2,813 20%2010 GDP (billions) $14,499 $2,936 20%2011 GDP (billions) $15,076 $3,049 20%
Businesses Employees
MAFC Region 2,606,162 32,458,110Corridor 920,809 13,637,546
Percentage 35% 42%
Value Employment w/in 3 miles each side of corridor

17
Recent history – 2 lanes, 4 lane facilities and Interstates
Compared Counties with 15 miles of four lane highway
Differences in 6 socioeconomic factors range from 10% to 180%
Accelerated growth rates –over 12% for number of businesses
Bypass studieshttp://library.modot.mo.gov/RDT/reports/Ri00058/ss08002.pdf
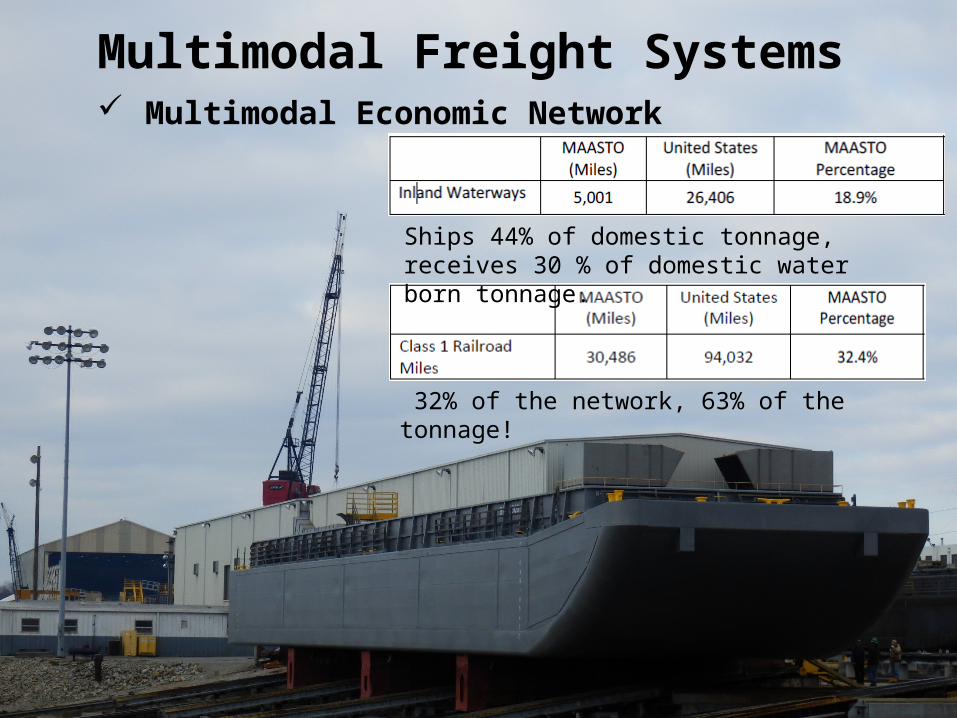
Multimodal Economic NetworkMultimodal Freight Systems
Ships 44% of domestic tonnage, receives 30 % of domestic water born tonnage.
32% of the network, 63% of the tonnage!
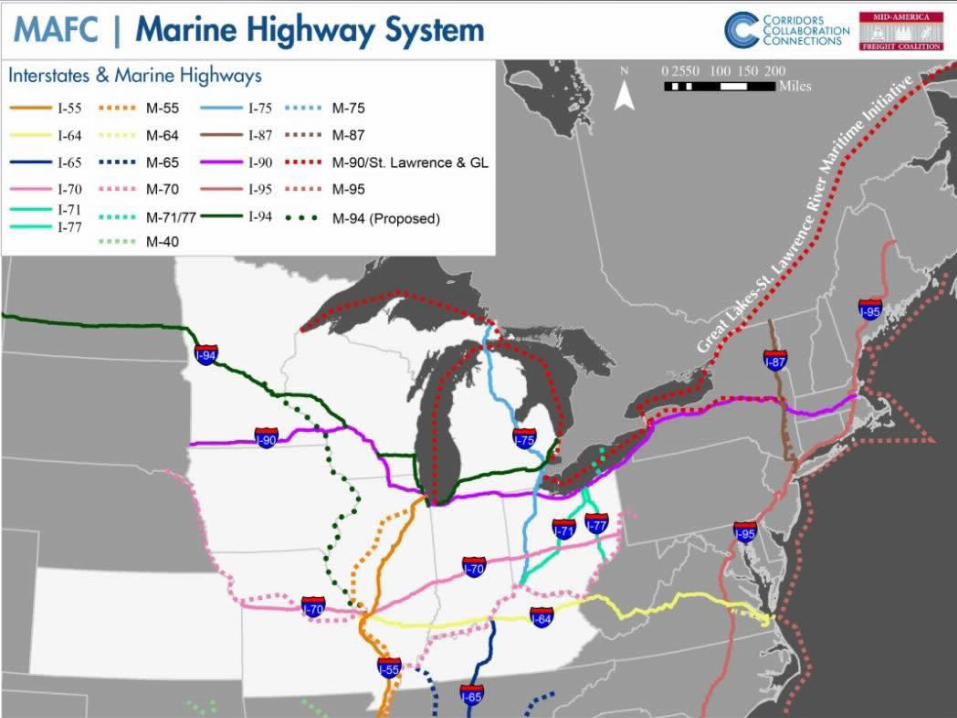

M70, M 94(Avenue of Saints), Great Lakes – St Lawrence Seaway, M71, M65, M75…


Build-out Impacts Product movement Fleet fuel Mode changes
The New Energy Economy
Wind, solar, natural gas….?

Fracking - Far reaching Impacts

Freight Stakeholder Particaption
National Freight Advisory Committee
Freight Policy Council State Freight Advisory
Councils Top line customer,
performance based relationship


MAP-21 ResourcesMAP-21 Resources-MAFC
http://midamericafreight.org/projects/study/map-21-resources/Full Bill Text
http://www.gpo.gov/fdsys/pkg/BILLS-112hr4348enr/pdf/BILLS-112hr4348enr.pdfMAP-21 Overview Presentation-AASHTO
http://www.transportation.org/Documents/Lee-2012-08-29.pdfMAP-21 Freight Provisions-STB
http://www.stb.dot.gov/stb/docs/RETAC/2012/Sept/Freight%20provisions%20MAP-21.pdfFHWA Site on MAP-21-FHWA
http://www.fhwa.dot.gov/map21/Webinars on MAP-21-FHWA
http://www.fhwa.dot.gov/map21/webinars.cfmQ & A on MAP-21-FHWA
http://www.fhwa.dot.gov/map21/qandas/index.cfmMAP-21 Guidance-FHWA
http://www.fhwa.dot.gov/map21/guidance/index.cfmMAP-21 Deadlines-Iowa DOT
http://www.iowadot.gov/pol_leg_services/Map21/MAP21%20Deadlines%20by%20Date.pdf

Thank you!Contact:Ernie Perry, PhDMAFC608 [email protected]


