Page 1
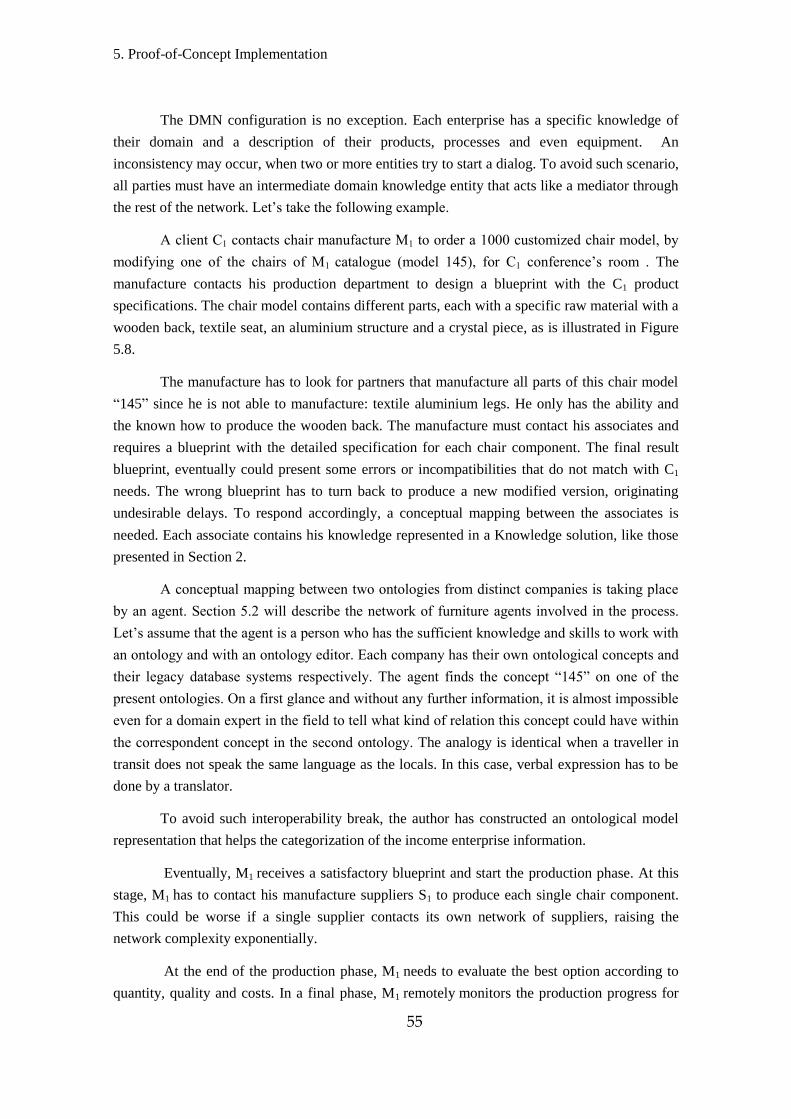
Fábio Manuel Nunes Branco
Licenciado em Ciências de Engenharia Electrotécnica e de Computadores
Framework for the Semantic Alignment of Enterprise’s Domain Knowledge
Dissertação para obtenção do Grau de Mestre em Engenharia Electrotécnica e de Computadores
Orientador: Ricardo Luís Rosa Jardim Gonçalves, Professor Associado com Agregação, Faculdade de
Ciências e Tecnologia da Universidade Nova de Lisboa Co-orientador: João Filipe dos Santos Sarraipa,
Investigador, Uninova
Júri:
Presidente: Prof. Doutor João Francisco Alves Martins
Arguente(s): Prof. Doutora Teresa Cristina de Freitas Gonçalves Vogal(ais): Prof. Doutor Ricardo Luís Rosa Jardim Gonçalves
Setembro 2014
Page 2
ii
Framework for the Semantic Alignment of Enterprise’s Domain Knowledge
Copyright © Fábio Manuel Nunes Branco, Faculdade de Ciências e Tecnologia, Universidade
Nova de Lisboa.
A Faculdade de Ciências e Tecnologia e a Universidade Nova de Lisboa têm o direito, perpétuo
e sem limites geográficos, de arquivar e publicar esta dissertação através de exemplares
impressos reproduzidos em papel ou de forma digital, ou por qualquer outro meio conhecido ou
que venha a ser inventado, e de a divulgar através de repositórios científicos e de admitir a sua
cópia e distribuição com objectivos educacionais ou de investigação, não comerciais, desde que
seja dado crédito ao autor e editor.
Page 3
iii
To my family and friends…
Page 5
v
Acknowledgements
First of all, I would like to express my sincere gratitude to Professor Ricardo Jardim-Gonçalves
for the opportunity to do this work. I also would like to thank this research group and
JoãoSarraipa for all their encouragement and guidance during the time-line of this thesis.
Moreover, I am also grateful to Miguel Beça and José Ferreira for the support they gave me
during my passage on the IMAGINE project.
Page 7
vii
Abstract
Nowadays, the consumption of goods and services on the Internet are increasing in a constant
motion. Small and Medium Enterprises (SMEs) mostly from the traditional industry sectors are
usually make business in weak and fragile market sectors, where customized products and
services prevail. To survive and compete in the actual markets they have to readjust their
business strategies by creating new manufacturing processes and establishing new business
networks through new technological approaches. In order to compete with big enterprises, these
partnerships aim the sharing of resources, knowledge and strategies to boost the sector’s
business consolidation through the creation of dynamic manufacturing networks.
To facilitate such demand, it is proposed the development of a centralized information system,
which allows enterprises to select and create dynamic manufacturing networks that would have
the capability to monitor all the manufacturing process, including the assembly, packaging and
distribution phases. Even the networking partners that come from the same area have multi and
heterogeneous representations of the same knowledge, denoting their own view of the domain.
Thus, different conceptual, semantic, and consequently, diverse lexically knowledge
representations may occur in the network, causing non-transparent sharing of information and
interoperability inconsistencies. The creation of a framework supported by a tool that in a
flexible way would enable the identification, classification and resolution of such semantic
heterogeneities is required. This tool will support the network in the semantic mapping
establishments, to facilitate the various enterprises information systems integration.
Keywords: End-to-End, Factories of the Future, Dynamic Manufacturing Networks, Semantic
Alignment
Page 9
ix
Resumo
Hoje em dia tem-se verificado uma tendência para consumo de bens e serviços disponíveis
através da Internet. Os pequenos produtores ou as pequenas e médias empresas, sobretudo dos
sectores tradicionais da indústria, normalmente atuam em sectores de mercado frágeis, onde
imperam produtos ou serviços personalizados. Para sobreviverem e poderem competir no
mercado atual têm que adaptar a sua estratégia empresarial, criando novos processos de fabrico
e parcerias através de novas abordagens ao mercado voltado para as novas tecnologias. Estas
parcerias visam a criação de redes dinâmicas de negócios através da partilha de recursos,
conhecimentos e estratégias de forma a conseguirem consolidar-se no seu sector ou domínio
empresarial para fazer face às grandes empresas.
Respondendo a esta necessidade, propõe-se desenvolver um sistema centralizado de informação,
que permita às empresas, escolher e criar parceiros para o estabelecimento de redes dinâmicas
de manufactura, que possam responder às suas necessidades de produção e que ao mesmo
tempo, de uma forma fácil tenham capacidade de monitorização todo o processo de fabrico,
incluindo as fases de montagem, embalagem e de distribuição. Os parceiros resultantes da rede
criada, mesmo que provenientes da mesma área de negócio, têm uma visão própria do seu
domínio acomodando caracterizações múltiplas e heterogéneas de uma área comum de
conhecimento. Esta corresponde a representações particulares de conhecimento ao nível
conceptual, semântico e de léxico, pelo que é espectável que a informação partilhada não seja
transparente ou interoperável em toda a rede, havendo portanto a necessidade de projetar uma
plataforma suportada por uma ferramenta que de uma forma flexível, possibilite a identificação,
classificação e resolução de tais heterogeneidades semânticas. Esta ferramenta suportará a rede
no estabelecimento de mapeamentos semânticos, cujos permitam a integração dos sistemas de
informação das empresas..
Palavras-chave: Fabricação ponta-a-ponta, Fábricas do Futuro, Redes de Manufactura
Dinâmicas, Alinhamento Semântico
Page 11
xi
Contents
1. INTRODUCTION ........................................................................................................................... 1
MOTIVATIONS AND CONTEXT ............................................................................................................... 2 1.1 RESEARCH METHOD ........................................................................................................................... 2 1.2 RESEARCH QUESTIONS AND PROBLEMS .................................................................................................. 4 1.3 HYPOTHESIS ..................................................................................................................................... 4 1.4 DISSERTATION OUTLINE ...................................................................................................................... 4 1.5
2. KNOWLEDGE BASED SOLUTIONS ................................................................................................. 7
KNOWLEDGE MANAGEMENT ............................................................................................................... 7 2.1 KNOWLEDGE REPRESENTATION ............................................................................................................ 8 2.2
2.2.1 Ontology ............................................................................................................................... 8 2.2.1.1 Operations ..................................................................................................................................... 10
2.2.2 Taxonomy ........................................................................................................................... 11 2.2.3 Thesaurus............................................................................................................................ 11 2.2.4 Dictionary ........................................................................................................................... 12 VISUALIZATION TOOLS ...................................................................................................................... 12 2.3
2.3.1 Webprotégé ........................................................................................................................ 12 2.3.2 OntoStudio .......................................................................................................................... 13 2.3.3 oBrowse .............................................................................................................................. 14 2.3.4 jOWL ................................................................................................................................... 15 2.3.5 AlloyUI ................................................................................................................................ 15 2.3.6 OWLGrEd ............................................................................................................................ 16 VISUALIZATION TOOLS COMPARATIVES ................................................................................................. 17 2.4 CONCLUDING REMARKS .................................................................................................................... 18 2.5
3. DYNAMIC MANUFACTURING NETWORKS ................................................................................. 21
OVERVIEW CONCEPT ........................................................................................................................ 21 3.1 BENEFITS AND RISKS......................................................................................................................... 23 3.2 THE DMN LIFE-CYCLE ...................................................................................................................... 24 3.3 BLUEPRINTS .................................................................................................................................... 25 3.4 INFORMATION TECHNOLOGY (IT) PLATFORM ........................................................................................ 26 3.5 CONCLUSION REMARKS .................................................................................................................... 28 3.6
4. SEMANTIC ALIGNMENT FOR SEAMLESS KNOWLEDGE INTEROPERABILITY ................................ 31
INTRODUCTION ............................................................................................................................... 31 4.1 HETEROGENEITY .............................................................................................................................. 33 4.2 SAMPOL FRAMEWORK ................................................................................................................... 34 4.3
4.3.1 Repository Ontology for Mapping Establishment ............................................................... 36 SEMANTIC ALIGNMENT RELATED WORK ................................................................................................ 38 4.4 CONCLUDING REMARKS .................................................................................................................... 39 4.5
5. PROOF-OF-CONCEPT IMPLEMENTATION ................................................................................... 41
USED TECHNOLOGIES ....................................................................................................................... 41 5.15.1.1 Liferay Portal ...................................................................................................................... 41 5.1.2 Java ..................................................................................................................................... 42 5.1.3 Java Server Pages (JSP) ....................................................................................................... 42 5.1.4 JavaScript ............................................................................................................................ 42
Page 12
xii
5.1.5 MySQL ................................................................................................................................. 42 5.1.6 Protégé-OWL API ................................................................................................................ 42 5.1.7 Service Oriented Architectures............................................................................................ 43
5.1.7.1 Web Services ................................................................................................................................. 43 NETWORK AGENTS .......................................................................................................................... 43 5.2 ADAPTER FOR ENTERPRISE’S LEGACY SYSTEM INTEGRATION ..................................................................... 44 5.3 MAPPING TOOL ARCHITECTURE ......................................................................................................... 46 5.4
5.4.1 Reference Ontology ............................................................................................................ 48 5.4.2 Support Database ............................................................................................................... 51 5.4.3 Information Ontology ......................................................................................................... 53 5.4.4 Information Control Module ............................................................................................... 53 APPLICATION SCENARIO .................................................................................................................... 54 5.5 IMPLEMENTED STEPS ........................................................................................................................ 56 5.6
5.6.1 Step 1 – Management and Monitoring of Mappings & Resources ..................................... 57 5.6.2 Step 2 - Client side Control .................................................................................................. 59 5.6.3 Step 3 – Mapping update & submission ............................................................................. 60
6. MAPPING TOOL DEMONSTRATION ........................................................................................... 61
IDENTIFIED CHALLENGES AND PROPOSED FUNCTIONALITIES ..................................................................... 61 6.1 SEMANTIC ALIGNMENT DEMONSTRATION ............................................................................................ 62 6.2
6.2.1 Client side Control Demonstration ...................................................................................... 63 6.2.2 Temporary Stored Mapping Demonstration ....................................................................... 65 6.2.3 Mapping update and Management Mappings Demonstration ......................................... 65 6.2.4 Mapping Submission Demonstration.................................................................................. 68 HYPOTHESIS VALIDATION .................................................................................................................. 69 6.3 INDUSTRY CONTRIBUTION ................................................................................................................. 70 6.4
7. CONCLUSIONS AND FUTURE WORK .......................................................................................... 71
FUTURE WORK ............................................................................................................................... 72 7.1
8. BIBLIOGRAPHY .......................................................................................................................... 73
9. APPENDIX .................................................................................................................................. 79
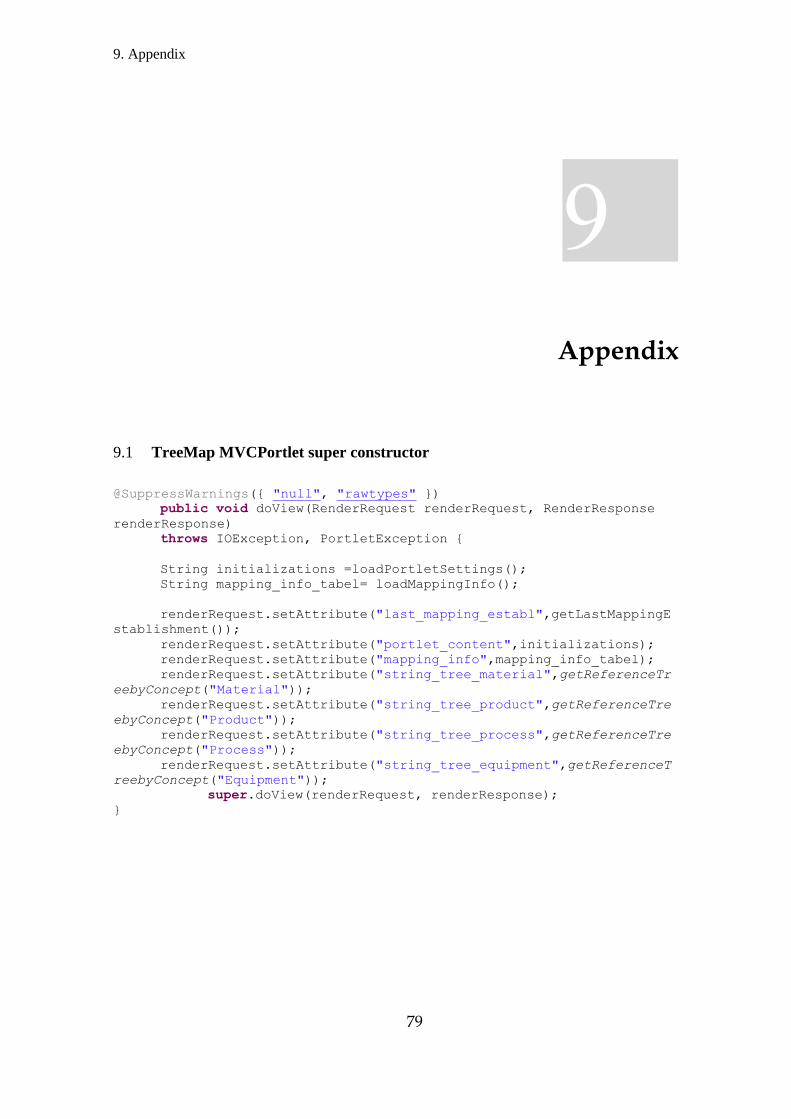
TREEMAP MVCPORTLET SUPER CONSTRUCTOR .................................................................................... 79 9.1
Page 13
xiii
List of Figures
Figure 1.1 – Phases of the Classical Research Method (Source: [4]) ........................................................... 2 Figure 2.1 - The mapping ontology operation (a, b); the result merged ontology ( c)................................ 11 Figure 2.2 - Webprotégé layout page (Source: [25]) .................................................................................. 13 Figure 2.3 - OntoStudio ontology visualizer (Source: [26]) ....................................................................... 14 Figure 2.4 - oBrowse visualization tool ilustration..................................................................................... 14 Figure 2.5 - An ilustration of the jOWL visualization tool (Source: [27]) ................................................. 15 Figure 2.6 - AUI TreeView example screenshot (Source: [29]) ................................................................. 16 Figure 2.7 - OWLGrEd visualization tool screenshot (Souce: [30]) .......................................................... 17 Figure 3.1 - Dynamic Manufacture Lifecyle phases (Adapted: Source [36]) ............................................. 25 Figure 3.2 - IMAGINE blueprint model (Source: [38] ) ............................................................................ 26 Figure 3.3 - Schematic of DMN platform modules (Source: [39]) ............................................................. 27 Figure 3.4 - Proposed UML diagram of the DMN methodology (Source:[39]) ......................................... 28 Figure 4.1 - WSMO conceptual schema (Adapted: Source [43]) .............................................................. 32 Figure 4.2 - The SAMPOL framework ...................................................................................................... 35 Figure 4.3 - Knowledge Mapping Chart (Adapted: Source:[51]) ............................................................... 37 Figure 4.4 - Structure of knowledge base for mapping repository (Source: [51]) ...................................... 38 Figure 5.1 - IMAGINE Adapter screenshot (Adapted: Source: [38]) ........................................................ 45 Figure 5.2 - Mappings establisment between enterprises legacy and the BP data models (Source: [72]) .. 46 Figure 5.3 - Client-Server mapping tool architecture model ...................................................................... 47 Figure 5.4 - Knowledge modelling ontology for enterprise’s resource categorization (Source: [38]) ...... 49 Figure 5.5 – Reference ontology screenshot ............................................................................................... 50 Figure 5.6 - The integration database enhanced entity-relationship model ................................................ 52 Figure 5.7 - Information control module phases workflow ........................................................................ 53 Figure 5.8 - Furniture production operations diagram (Source: [38]) ........................................................ 56 Figure 5.9 - Mapping tool architecture lifecycle ........................................................................................ 57 Figure 5.10 - Load mapping information diagram ..................................................................................... 58 Figure 5.11 - An example of the developed tree object ............................................................................. 59 Figure 6.1 - Enterprises Data Categorization portlet .................................................................................. 63 Figure 6.2 - Enterprise and category selection (a) without enterprise; (b) with enterprise selected ........... 63 Figure 6.3 - Seating Design Material resources and the material refrence tree .......................................... 64 Figure 6.4 - Selection of a new mapping establishment (a) selected invalid node; (b) a valid
correspondence ........................................................................................................................................... 64 Figure 6.5 - The stored data in the mapping table (mySQL Workbench screenshot) ................................. 65 Figure 6.6 - Updating a mapped resource ................................................................................................... 66 Figure 6.7 - The updated data in the mapping table (mySQL Workbench screenshot) .............................. 66 Figure 6.8 - The warning message to alert user to a mapped concept ........................................................ 67 Figure 6.9 - Reference node to be selected ................................................................................................. 67 Figure 6.10 - Category resources submission message .............................................................................. 68 Figure 6.11 - The resulted SOAP message ................................................................................................. 69 Figure 6.12 - The Seating Design categories after the Material resources submission .............................. 69
Page 15
xv
List of Tables
Table 2.1 - Ontology categories and their descriptions ................................................................................ 9 Table 2.2 - Tree knowledge visualization comapratives ............................................................................ 18 Table 3.1 - Dynamic Manufacturing Network benefits and risks (Adapted: Source [34]) ......................... 24 Table 4.1 - Semantic heterogeneity conflicts ............................................................................................. 33 Table 4.2 - Structural heterogeneity conflicts (Adapted: Source [46]) ....................................................... 34 Table 5.1 – The adopted semantic aligment ............................................................................................... 44
Page 17
xvii
Acronyms
API Application Programming Interface
ASMOV Automated Semantic Matching of Ontologies with Verification
CAD Computer Aided Design
CAM Computer Aided Manufacturing
CN Collaborative Networks
COMA COmbination of schema Matching Approaches
CSS Cascading Style Sheets
DKM Distributed Knowledge Management
DMNs Dynamic Manufacturing Networks
FoF Factories of the Future
HTML HyperText Markup Language
HTTP Hypertext Transfer Protocol
IF-MAP Information-Flow-based method of ontology MAPping
IMAGINE Innovative end-to-end Management of Dynamic Manufacturing
Networks
IT Information Technologies
JSP JavaSever Pages
JSR Java Specification Request
KB KnowledgeBase
NOKMS Negotiation process which uses Ontology-based Knowledge
Management System
KPI Key Performance Indicators
MENTOR Methodology of Enterprise Reference Ontology development
MES Manufacturing Execution Systems
MG Multiple Globalizations
MO Mediator Ontology
MoMo Model Morphism
Page 18
xviii
MRDs Machine-Readable Dictionaries
OASIS Organization for the Advance of Structural Information Standards
OEM Original Equipment Manufacturers
OWL Web Ontology Language
PLM Product Lifecycle Management
SMART Semi-autoMatic Approach to ontology meRging and alignmenT
RDF Resource Description Framework
RDFS Resource Description Framework Schema
RPC Remote Procedure Call
SAMPOL Semantic AlignMent of enterPrise’s dOmain knowLedge
SMEs Small and Medium Enterprises
SOA Service-Oriented Architecture
SOAP Simple Object Acess Protocol
SOCOM Semantic-Oriented Croos-Lingual Ontology Mapping
SQL Structured Query Language
SWS Semantic Web Services
UML Unified Modelling Language
URL Uniform Resource Locator
VE Virtual Enterprise
VO Virtual Organization
WAR Web Application ARchive
WSMO Web Service Modelling Ontology
Xmap eXtensible Mapping
XML eXtensible Markup Language
Page 19
1. Introduction
1
1 Introduction
Introduction
The recent development of new technologies has improved the quality of life of the general
population, but also lead to an increase of consumption of customised goods and services
acquired through the Internet. Due to such kind of requests, small manufacturers or Small and
Medium Enterprises (SME) have to embrace the end-to-end philosophy, which intend to reduce
as many middle steps as possible to reach the final customer, enhancing the performance and
productivity in their business supply chain or manufacturing process.
Thus, to maintain the sustainability of their business, SME should have the capability of
answering all their clients’ product requests. To reach such goal, all the SME even from
industry’s traditional sectors need to adopt new business strategies through new assembly
processes and new market approaches with reference to state-of-the-art innovations [1].
Despite having small structure, a SME employs more people in European Union comparatively
to other type of enterprises [2].
Consequently to this and to the economical status of the countries in 2008, the European Union
committed to increase production performance by starting an initiative to promote effectiveness
collaboration of SME designed Factories of the Future (FoF)s [3]. As a result, FoF has been
promoting the development of a set of centralized systems, to enable companies to choose and
create in an easy way, partner alliances. These alliances will have the capability to monitor not
only the assembly process, but also the packaging and shipment phases.
Even if all the enterprises of a business network alliance come from the same business area,
each one has its own view or perspective of its domain knowledge. Thus different conceptual,
semantic and lexical knowledge representations may occur and therefore it is expected to
happen non-transparent and interoperability inconsistencies of the shared information.
1
Page 20
1. Introduction
2
This research work proposes a framework supported by a web user interface component (tool)
to facilitate the identification of possible semantic heterogeneities between two information
systems in a flexible way, which would end up in the development or definition of applications
able of heterogeneous information systems integration in architectures able of business
networks establishment.
Motivations and Context 1.1
The assembly methods used today in SME do not meet the necessary requirements to answer
the client’s product specifications. Enterprises have been aware about a lack of productivity and
competitiveness conducted by persisting and maintaining a traditional manufacturing process
ideology. To overcome this, each single enterprise exchange data raising potential semantic
interoperability inconsistencies, due to the different knowledge representations exchanged
through out the process. For this reason, one of the motivations for this dissertation work has to
do with an adequate maintenance on conceptual alignment between various ERP’s (Enterprise
Resource Planning) from different legacy systems.
The Semantic alignment research focuses on designing an ontology-based tool that aims to
classify resource concepts used by such ERP systems in a fast, flexible and effective manner, in
relation to reference concepts existing in a reference ontology of the domain.
Therefore this work aims to provide a possible solution in the field of semantic interoperability,
with focus on the semantic alignment of information. Its main focus is to propose a framework
to serve as a backbone and guideline to then develop a proper tool, flexible and portable enough
to be deployed in a central and collaborative platform enabling seamless interoperability
communication to support the development of business networks establishment solutions.
Research Method 1.2
The research method used in this dissertation is inspired on the classical method proposed by
Camarinha-Matos [4]. The traditional seven steps of the classical method plus the “industrial
application” step composes the followed research method (Figure 1.1).
Figure 1.1 – Phases of the Classical Research Method (Source: [4])
•Research Question/ Problem 1
•Background/ Observation 2
•Formulate Hypothesis 3
•Design Experiment 4
•Test hypothesis / Collect data 5
•Interpret / Analyze results 6
•Publish findings 7
•Industrial Application 8
Page 21
1. Introduction
3
1. Research Question/ Problem: This is the most important step in research. It is a
period of study that intends to define the area of interest of the research. The research
question must be optimized according to the field of study in such a way that it could be
validated or refuted. The main question may be supplemented with secondary questions
to support the main idea of the research study.
2. Background / Observation: This step contemplates the study of the work already done
by other researchers about the same research area. In other words, this is where the state
of the art research takes place. This accomplishes the reviewing of general scientific
literature and specific research project results reports. Furthermore it is important to
have a big variety of documents for searching information on the area of interest,
because some of the literature even being recent and having ground-breaking ideas, can
be out-dated or of low reliability. Finally, it is also in this step that the researcher
defines what from his work would differ from existent one.
3. Formulate Hypothesis: As its name indicates, in this step the researcher formulates the
hypothesis in order to make the research simpler to understand, stating the ambitions to
accomplish at the end of the project. The hypothesis states the plausible arrangements to
answer the research question.
4. Designed Experiment: The designed experiment step aims to design a prototype
architecture capable of supporting the previous denied hypothesis. The section 4 and 5
present the design of a prototype and the proof-of-concept, respectively.
5. Teste Hypothesis: This step comprehends the implementation of the designed
prototype and the evaluation of the obtained results. A large amount of tests (especially
in different scenarios) should be done in order to test effusively the outcomes given by
the system. These outcomes are supposed to be collected for later analyses.
6. Interpret/ Analyses Results: After the batteries of tests have been made to the system
it is the time to evaluate and analyse the achieved results. At this point the veracity and
confidence in the hypothesis are put to the test. A number of outcomes are possible, the
results can be satisfactory, providing the author right, or they can be missing the initial
idea. If the initial point straights to the hypothesis, then it is reasonable to say that a
good prevision was made and it is possible to consider what comes after, making some
recommendations for further research. But even if the results are not what was expected
it should not be taken as a failure, but as an opportunity to improve the original
approach and go back again to the first steps of the search method. The researcher can
then try a different approach from the one taken before.
Page 22
1. Introduction
4
7. Publish Findings: The final results, if consistent, must end up in valuable contribution
to the scientific community as scientific papers. These papers can be then presented in
conferences, where the author has the chance to show in person his ideas for research,
presenting the results and answer questions of others researchers to prove the efficiency
of the results.
8. Transition to Industry: Upon the validation from the scientific community, the
conducted work should be analysed for a possible industrial application in order to
capitalize from it and contribute to the entrepreneurial world. This can be accomplished
by passing the developed work from a prototype stage to a fully functional industry
application, which can be applied to various enterprises and businesses.
Research Questions and Problems 1.3
Can a technological solution capable of formal semantic mapping representations supports the
establishment of interoperable communications in a manufacturing network?
Hypothesis 1.4
If a framework to establish the semantic alignment of enterprise’s domain knowledge is defined
supported by an organized knowledge management approach capable of semantic mappings
definition and representation, then the establishment of dynamic manufacturing
network is facilitated.
Dissertation Outline 1.5
The first section of this work is the Introduction, which addresses the purpose of this research
work, as well as the main ideas that led to the creation of this dissertation. It also presents the
thesis context and motivations. Finally, it identifies the research questions and problems that
this dissertation addresses and the hypothesis followed for attempting to solve them.
Section 2 is named Knowledge Based Solutions and addresses the background research that was
conducted. It covers the main tools for managing, maintain and the knowledge representation
tools with a special focus on ontology tree visualization tools.
Section 3 is named Dynamic Manufacturing Networks starts with an overview of the end-to-end
and Future of Factories concepts. Furthermore this section introduces and explores the
properties beyond an innovative enterprise collaborative environment, which will be the
building block for the proposed framework.
The next section 4, Semantic Alignment for Seamless Knowledge Interoperability, presents the
Heterogeneities raised from the result ontology mapping operations, a description of the
Page 23
1. Introduction
5
knowledge mapping type operations. Furthermore, this chapter also presents the proposed
framework as a solution to the semantic alignment between different enterprises for a specific
knowledge domain within a detail description of the involved modules in the system, namely
the MO (Mediator Ontology), the Support Database and the Furniture Reference Ontology.
Section 5 is called Proof-of-Concept Implementation featuring the architecture of the
developed prototype. The technologies used to develop it and reason why they were chosen.
Furthermore, it presents the implementation steps flow of the prototype to serve as a
complement to the architecture in the sense that it shows in detail the flow of the system.
The following section is the Mapping Tool Demonstration chapter which shows the results of
the implemented prototype by featuring some execution examples of the developed prototype.
This section also has the hypothesis validation, regarding the Research Questions and Problems
present in section 1.3.
The last Section contains the Conclusions and Future Work chapter where the concluding
remarks and future work topics are presented.
Page 24
1. Introduction
6
Page 25
2. Knowledge Based Solutions
7
2 Knowledge Based Solutions
Knowledge Based Solutions
Section 2 starts with an introduction of the knowledge management between different
enterprises and the potential benefits and risks addressed. Further, it will present a description of
most common knowledge representations used on a knowledgebase system, with a special focus
on ontologies. Finally, there were presented a set of visualization tools, which could be adequate
for the development of the proposed tool.
Knowledge Management 2.1
Thanks to technological development, traditional key sector companies adopted to the
new demands of the market by changing how a product is produced and manufactured. The
diversity of a product inside a company comes not only with creativity, but also with a new re-
thinking on assembly process itself.
The effective management of an organization’s knowledge assets is recognized to be a
critical success factor in business performance [5]. Even in the same business area, different
enterprises have different perspectives regarding their own business sector. Studies inferred that
the integration of knowledge management (KM) into business process is one of the keys on the
future core of the knowledge management [6].
A centralized management perspective could be an indicator for the inability to
recognize the mission critical knowledge resources and the ways in which knowledge collect,
analyse and evaluated information [5]. A Proposed solution [7], tries to deal exactly with this
problems.
Today, more than ever enterprises and organizations should reinforce assets in order to
be able to get new company strategies and adapt to continuously evolving environment in a
2
Page 26
2. Knowledge Based Solutions
8
prompt and economical acceptable manner [8]. Furthermore, the way how enterprises exchange
information varies according to the adopted protocol establishment. Traditional solutions
typically relied on a more centralized schemes in terms of knowledge sharing, however recently
approaches seems to follow a more dispersed solution. In an effort to achieve knowledge
sharing sustainability, Bonifacio et.al. [9] introduced the concept of Distributed Knowledge
Management (DKM) that relates to, a self-sustainable knowledge node organization cluster.
Schmücker & Müller [10] highlight some advantages by using a DKM system comparatively to
the centralized solutions:
The partner’s information is constantly accessible and updated
It is cheapest to maintain since its information is available in a single place
The assembly methods practiced today on a small enterprise do not meet all the necessary
requirements to answer the client’s product specifications. Enterprises have been conscious
about a lack of productivity and competitiveness conducted by persisting and maintaining a
traditional manufacturing process ideology. Alternatively the enterprises exchange knowledge
with a network of partners to acquire knowledge that is not available in their own organization.
Thus, the knowledge sharing could present risk if it is not properly managed [11].
Knowledge Representation 2.2
Section 2.1 presented the reasons why enterprises need to share its knowledge and the adopt
strategies to management of the exchanged data. It is pointless to achieve such organizational
form if it is any way to sustain, organize, represent and share the knowledge without an
adequate repository. A knowledge base enables the specification of such conceptualization,
even if it’s original from explicit or implicit knowledge [12].
Similar to tacit knowledge, implicit knowledge it is a knowledge that contains often, a non-clear
and straightforward definition by its own but it is the knowledge type that people understand
and have in their mind. On the other hand, the explicit knowledge is the formal knowledge that
is in some way represented in any representation code as an ontology, system, book, etc.
The universe of discourse it is the set of concepts or elements that enables knowledge to be
represented in a declarative formalism. Knowledge software solutions enable knowledge
representation formalism among such concepts or elements and their inerrant relations [13].
The next sub-sections describe the fundamentals behind ontologies, taxonomies, thesaurus and
dictionaries.
2.2.1 Ontology
Traditionally speaking, ontology have been used in distinct educational areas, from philosophy
to engineering which, consists of a logical model entity, containing concepts, properties and
Page 27
2. Knowledge Based Solutions
9
relations [14]. Such characteristics, help the acquisition and consolidation of domain knowledge
and enables the semantic integration of heterogeneous and disturbed knowledge [7].
Ontology is “an explicit specification of a shared conceptualization” [15]. This remains
today as the best acceptable definition of an ontology. Heijst et. al. [16], identified two ontology
dimensions (structure of the conceptualization and the subject of the conceptualization) with the
correspondent seven ontology categories showed in table 2.1. According to its needs and
applications, usually an ontology shares a common understanding of the structure of
information among people or software agents, enabling the reuse of domain knowledge, making
domain assumptions explicit [17].
The traditional database solution has exploited the ability to store and maintain a
considerable number of data [18] nonetheless it absences from the fact that concepts has special
semantic hierarchical relations, like disjoint, less-General or more-General associations , which
are not covered by this kind of systems [19]. Instead, more suitable semantic engines are used,
for instance, mediators and ontologies that have the capability to share common understanding of
the structure of information among people or software agents, enables the splitting of domain
knowledge from the operational knowledge to analyse contextual situations [17].
Table 2.1 - Ontology categories and their descriptions
Ontology type Category Description
Str
uct
ure
Terminological
Ontologies
Such as lexicons, specify the terms that are
used to represent knowledge in domain of
discourse. (…)
Information Ontologies Which specify the record structure of
databases. (…)
Knowledge Modeling
Ontologies
Specifies conceptualizations of the structure
of the knowledge. (…) These ontologies tuned
to a particular use of the knowledge that they
describe. (…)
Su
bje
ct
Domain Ontologies (…) constraints on the structure of the
domain knowledge expressions. (…)
Generic Ontologies (…) specifications of concepts in generic
ontologies. (…)
Representation
Ontologies
(…) conceptualization that is underly
knowledge edge representation formalisms.
(…)
Application Ontologies
(…) contain all the definitions that are
needed to model the knowledge that is
required for a specific application.
Page 28
2. Knowledge Based Solutions
10
2.2.1.1 Operations
The Oxford English Dictionary defines mathematical operation as a process in which a number,
quantity or even an expression, is changed or manipulated according to a set of formal rules, such
as addition, multiplication and differentiation [20].
Analogously, an ontology operation can be seen as a relational manipulation of concepts,
properties or even attributes, origination the same or even a number of independent ontologies.
The ontologies have three different operations and can be divided as follows:
Ontology Mapping – This operation establish a one-to-one or a one-to-many relation with a
number of concepts under two or more ontologies which create new concepts and
relationships that match semantically with each other, present in several dissimilar
ontologies. It does not change the meaning and the structure of the ontology [21]. The
concepts must have a semantic connection or same connotation that enables to form the
paired matches.
Ontology Alignment – This operation is similar to ontology mapping, except that the
involving ontologies (in the same domain) must agree conceptually with each other, affecting
the outcome result of the final(s) ontology(ies).
Ontology Merging - This process bring two or more mapped ontologies and to procedure
new original ontology.
Page 29
2. Knowledge Based Solutions
11
a)
Animal
b) c)
Dog Cat
Pet
FoxTerrier
CairnTerrier
Pet
Dog
FoxTerrier
CairnTerrier
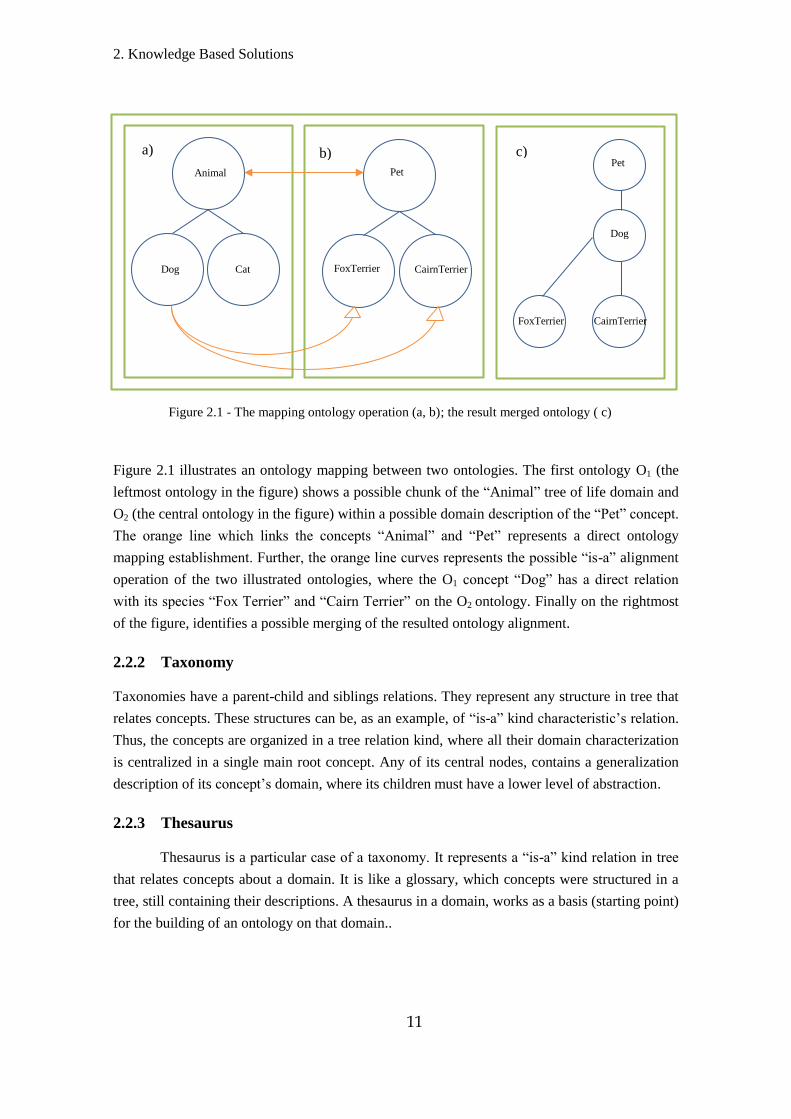
Figure 2.1 illustrates an ontology mapping between two ontologies. The first ontology O1 (the
leftmost ontology in the figure) shows a possible chunk of the “Animal” tree of life domain and
O2 (the central ontology in the figure) within a possible domain description of the “Pet” concept.
The orange line which links the concepts “Animal” and “Pet” represents a direct ontology
mapping establishment. Further, the orange line curves represents the possible “is-a” alignment
operation of the two illustrated ontologies, where the O1 concept “Dog” has a direct relation
with its species “Fox Terrier” and “Cairn Terrier” on the O2 ontology. Finally on the rightmost
of the figure, identifies a possible merging of the resulted ontology alignment.
2.2.2 Taxonomy
Taxonomies have a parent-child and siblings relations. They represent any structure in tree that
relates concepts. These structures can be, as an example, of “is-a” kind characteristic’s relation.
Thus, the concepts are organized in a tree relation kind, where all their domain characterization
is centralized in a single main root concept. Any of its central nodes, contains a generalization
description of its concept’s domain, where its children must have a lower level of abstraction.
2.2.3 Thesaurus
Thesaurus is a particular case of a taxonomy. It represents a “is-a” kind relation in tree
that relates concepts about a domain. It is like a glossary, which concepts were structured in a
tree, still containing their descriptions. A thesaurus in a domain, works as a basis (starting point)
for the building of an ontology on that domain..
Figure 2.1 - The mapping ontology operation (a, b); the result merged ontology ( c)
Page 30
2. Knowledge Based Solutions
12
2.2.4 Dictionary
Dictionary contains an alphabetic list of concepts, with definitions, synonyms and antonyms for
each single listed word. It can use only one language (monolingual) or it could relate the
concepts and the meanings (descriptions) between two different languages (bilingual).
Visualization tools 2.3
A proper visualization mechanism is essential to work and extract information from a
knowledge-based system point-of-view. The visualization’s tool varies according to the user
perspective’s application needs and can come in different shapes and sizes. Some make a focus
on the class relationship, showing the siblings and parent relations, others may include property
descriptions and individual’s links, making the knowledge description more explicit. In the
opposite side, a large amount of detail in a visualization tool could lose its primarily objective,
which is for the user perspective, to clearly transmit and identify the conceptual knowledge on a
representational form. For instance, the information contained in an ontology model needs to be
organized in such a way, that researchers actually could read and extract information besides the
present raw data. This could be accomplished by using graphs, maps, for instance tree maps or
other techniques.
The Web Ontology Language (OWL) is a specific ontology language designed for
Semantic Web recommended by the W3C1 that enables representation of concepts and
concept’s relations. Regarding with the motivations of this thesis, this section will focus
primarily on tree visualization mechanisms which looks after simplicity and flexibility, in
particularly those read OWL files.
2.3.1 Webprotégé
Webprotégé2 is a “free, open source, lightweight ontology editor and knowledge
acquisition tool for the Web” [22], initially designed to better support the collaborative
development in web. It allows client-to-client communication without compromise individual
user changes that is working in same ontology model either directly inside the platform or in a
collaborative desktop client in a real time communication environment [23]. This behavior
could also be found in collaborative web tools, like Google Docs3.
In order to work properly, the client side affords one user friendly and familiar interface
provided by Google Web Toolkit4 (GWT), the ontology model and a Remote Procedure Call
56
(RPC) module to interact with the server [22].
1 http://www.w3.org/
2 http://webprotege.stanford.edu
3 https://docs.google.com
4 http://www.gwtproject.org/
5 http://tools.ietf.org/html/rfc1057
6 http://tools.ietf.org/html/rfc5531
Page 31
2. Knowledge Based Solutions
13
The interface layout arrangement builds on top of tab concept, enabling user
customization appearance by drag-n-drop tabs from the toolbar, as illustrated in Figure 3.1.
In Section 5 will present the portlet concept, but for now let’s assume that the portlet resembles
a window interface which enables the display of personalized content. The class portlet is a tree-
based visualization module [24] that allows user to create, delete and also control the class
relations.
The application offers the possibility to choose working directly online or deploys it in a
servlet container.
Figure 2.2 - Webprotégé layout page (Source: [25])
2.3.2 OntoStudio
OntoStudio is of the most popular ontology visualization management and ontology
visualization tools in service. It stands out due to its comprehensive functions in intuitive
ontology modeling. Some of OntoStudio’s most important functions are the mapping tool,
which can be used to match heterogeneous structures. It also has a graphic editor which allows
users to edit and create rules for each single ontology model [26]. The relations are indicated by
an orange line and the classes by a blue square, as it illustrated in Figure 2.3.
Page 32
2. Knowledge Based Solutions
14
Figure 2.3 - OntoStudio ontology visualizer (Source: [26])
2.3.3 oBrowse
The oBrowse it is an open-project ontology visualization tool for the web located in
Sourceforge7 that displays an OWL in tree form of any browser, as illustrated in Figure 2.4. It
explorers the OWL-API built on top of Java allowing the class manipulations and extraction of
the class model relations.
7 http://sourceforge.net/
Figure 2.4 - oBrowse visualization tool ilustration
Page 33
2. Knowledge Based Solutions
15
2.3.4 jOWL
In an effort to migrate to the web 3.0, David Decraene designed the OntologyOnline [27]. The
project aims to get a visualization tool on web semantic applications. The jOWL it is a tree
visualization plugin tool built on top of jQuery8 that read OWL-RDFS files which is cable of
showing one navigation bar, a direct individuals and a Tree view containers and a search bar
(bellow the navigation bar), as illustrated in Figure 2.5.
Figure 2.5 - An ilustration of the jOWL visualization tool (Source: [27])
The project also contains a 3D sphere peripheral visualization perspective view of the ontology
model, called Hyperbolic Tree.9
2.3.5 AlloyUI
AlloyUI (known as AUI) is a framework built on top of JavaScript and CSS (Cascading Style
Sheets) libraries providing a consistent and simple API for building web applications across all
three levels of the browser: structure, style and behaviour [28]. The project contains one
dedicated API for tree manipulation. This particular tree component was not initially design to
8 http://jquery.com/
9 http://jowl.ontologyonline.org/HyperBolicTree.html
Page 34
2. Knowledge Based Solutions
16
ontology visualization, thus it is has the ability to represent the information regardless its
origins. Besides its independency, in a semantic web point-of-view; it helps who wants a better
taxonomy management of its concepts thanks to its collapsible and expandable features. The
API also contains a function which, allows semi-automatic children attachment of its root node,
saying the last selected node; search a node by name, telling the node relations (parents,
children and siblings). Regarding the node tree, it can be also define as a radio, task and check
type.
Among the other visualization tools the AUI stands out for its versatility and compatibility with
the Liferay10
portal.
Figure 2.6 - AUI TreeView example screenshot (Source: [29])
2.3.6 OWLGrEd
OWLFrEd is a visualization tool recommended by W3C, project of Institute of Mathematics
and Computer Science, University of Latvia. The tool contains an online version that allows
users to view and interact directly with ontologies. It also has a more complete desktop version,
which allows users to create their own ontology from scratch and customize the background and
line colours and node shapes. A particular interesting feature of this tool is the ability to export
the ontology diagram with the other users through an export mechanic, which creates a SVG
(Scalable Vector Graphics) to be placed in any web browser. The resulting view perspective
offers a tree that resembles a UML (Unified Modeling Language) diagram. Figure 2.6 shows the
koala11
OWL. The classes represented with yellow colour, the class hierarchical relations in
10
http://www.liferay.com/ 11
http://protege.stanford.edu/plugins/owl/owl-library/koala.owl
Page 35
2. Knowledge Based Solutions
17
purple, the constraints in red and the properties marked in black lines. Besides those
characteristics the OWLGrEd also provides a plugin for Protégé platform.
Figure 2.7 - OWLGrEd visualization tool screenshot (Souce: [30])
Visualization tools comparatives 2.4
The Section 2.3 the tree visualization tools were presented. It is time to now take a close look of
all tools and make some cooperation between them and take some conclusions.
A proper visualization mechanism (with a tree kind of representation feature) is essential to
work and extract information from a knowledge-based system point-of-view. The
visualization’s tool varies according to the user perspective’s application needs and can come in
different shapes and sizes. Some make a focus on the class relationship, showing the siblings
and parent relations, others may include property descriptions and individual’s links, making the
knowledge description more explicit. Table 2.2 resumes the characteristics and the assigned
classification of a set analysed visualization tools. It addressed the following characteristics:
personalization (the ability to customize and adapt the information according the desired needs);
a developer’s friendly (the ability for who intends to use the tool and deploy in a web
environment); the collaborative environment (ability to work remotely); the online interaction
(the possibility to view an ontology without a desktop environment); and finally the mapping
tool (the ability to matches heterogeneities).
Page 36
2. Knowledge Based Solutions
18
Table 2.2 - Tree knowledge visualization comapratives
Visualization
tool
Personal
content
Developer’s
friendly
Collaborative
Environment
Online
Interaction
Mapping
Tool
Webprotégé
OntoStudio N.D. N.D
oBrowse
jOWL Demo
AlloyUI Demo
OWLGrEd
From the defined characteristics is possible to state different statements. If the goal is to get a
tool that has flexibility in how it shows the content, having a clearer view, the best option is
OWLGrEd. On the other hand, only OntoStudio and OWLGrEd should not be considered for
the purpose of developing a web kind application. The Webprotégé will be the ideal choice if
what is required is a tool to access a remote knowledge-base (server). Additionally, there are
other visualization tools without integrated specific knowledge base handlers or engines (e.g.
OWL API), which requires a specific handling of the managed information as in specifc HTML
or flash graphic elements. In this case, it will be possible to resort to WebProtégé or jOWL or
even to OWLGrEd.
If is required a tool able to maximize user and developer interaction easiness, the AlloyUI
stands out for its versatility and compatibility with as an example a Liferay portal, which would
facilitate the integration to other existent components of a specific platform.
Concluding Remarks 2.5
The visualization tools should describe effectively its domain knowledge. Thus, a set of tools
are available to help maintain, edit and share the information among different entities.
The ontology offers the most complete mechanism available that reaches maximum description
of a knowledge base system. However, other representation forms could be more suitable,
depending on the type of system application in use. Furthermore, taxonomy will be perfectly
suitable for instance, if the intended information system only has to deal with a set of concepts
linked to each other. On the other hand, if a definition of terms is needed the best option passes
through the use of a dictionary.
Nevertheless, the information presented on such manage tools must be accompanied with a
proper visualization to allow data extraction and manipulation. Under the different possibilities
the choice should approximate a set of features to maximize user interaction.
Page 37
2. Knowledge Based Solutions
19
Enterprises that exchange information must have an adequate management system to work
collaboratively not fearing a leak of its market strategies to potential alliance partners. Besides
the attempts to turn the network more independent and trusted, the adopted distributed
mechanism do not cover yet the necessary requirements to overcome the potential risks of its
collaborative architecture. The next chapter will introduce the notion of new collaborative
approaches, which indeed seems to be the next tendency schemes.
Page 38
2. Knowledge Based Solutions
20
Page 39
3. Dynamic Manufacturing Networks
21
3 Dynamic Manufacturing Networks
Dynamic Manufacturing Networks
This chapter has the following structure: firstly, an introduction and overview of the Dynamic
Manufacturing Networks (DNMs) is presented, which briefly explores the traditional
manufacturing model concepts and reasons are given for the newest approaches; followed by
the benefits and risks adopted; the lifecycle and blueprints modification. Furthermore, it is also
presented the state-of-the art Dynamic Manufacturing Network platform. Finally, the identified
conclusions of this chapter will be addressed in the concluding remarks section.
Overview concept 3.1
The end-to-end concept introduced by Saltzer et.al. [31] can be seen as two processes
communicating with each other aiming consistency if they are less dependent of their
intermediate’s nodes. In other perspective, the probability of error in a message being
transported in a communication channel raises with the number of intermediate nodes on the
network configuration. Following the same idea, an end-to-end manufacture could be seen as a
constant change to reach reliability on partner coalition in an enterprise network environment.
Multiple Globalizations (MG) concept has been recently emerging. Manufacturing industries no
longer stay a local clustering nest. Recently economic crisis lead manufactures to adapt
effectiveness to the changing of the new global economy [32], specially for those who have to
constantly change their products and processes to survive in this new market paradigm. To
overcome this problem, companies and organizations joined forces, working together reusing
resources and capabilities in a sustainable economic collaborative environment, organized in a
Collaborative Network (CN) schema [8].
Launched in 2008, concerned with the economical state of its countries and committed to
increase production performance, the European Union started an initiative to promote
3
Page 40
3. Dynamic Manufacturing Networks
22
effectiveness collaboration of Small and Medium Enterprises named Factories of the Future
(FoF) [3].
Collaborative forms, with similar properties, such as virtual organization (VO), virtual
Enterprise (VE), dynamic supply chain do not have straight well-defined definitions.
Nevertheless some acceptable definitions could be found by Jeong et. al [33] for example, a VO
as comprising a set of (legally) independent organizations that share resources and skills to
achieve its mission/goal, which is not limited to an alliance to profit enterprises. A Virtual
Enterprise is a particular case of virtual organizations, where a temporary alliance is made to
share skills or core competencies and resources in order to better respond to business
opportunities, whose cooperation is supported by computer networks. A Virtual Manufacturing
Networks (VMN) is a manufacturing network usually built with the use of Information and
Communications Technology bringing together different suppliers and alliance partners to
create a virtual a collaborative network which is able to operate, as a solely owned supply
network [34].
A different set of attribute criteria, like quantity, price, raw material, could compromise
the establishment of a new network alliance, so in order to be competitive, innovative and more
complex products must pass through a state-of-the-art hybrid materials and assembly processes
implementation with a high degree of automation and quality control [35].
The adaptation of a centralized scheme increases the exchanged resources between
different organizations, thus raising the total maintenance costs of the established network.
Additionally, traditional collaborative schemes do not have monitor mechanisms, which enables
an adequate and fast response to a non-predicted network configuration changes, such as
unexpected production, packing and shipment delays.
Nowadays, some of the identified configurations are obsolete, thus it is time to get and
design a new approach. The Dynamic Manufacturing Networks is defined as “coalition, either
permanent or temporal, comprising production systems of geographically dispersed SME and/or
Original Equipment Manufacturers (OEMs) that collaborate in a shared value-chain to conduct
joint manufacturing” [36]. This concept although not being new is now emerging as a norm
solution.
Moreover, the beyond idea of a DMN is to enable specialized people or agents to
collaborate and integrate, spread goods and services globally from a set of independent sources.
Additionally, as the name suggests, a DNM must be cable of change its own defined
configurations, thus modifying its supplies in case of a non-predicted situation, such as, supplier
disruption or travel delays [34].
Page 41
3. Dynamic Manufacturing Networks
23
Benefits and Risks 3.2
Partnership collations between manufacturing networks face a variety of heterogeneous systems
to manage their processes and their data. A majority of benefits must be previously obtained to
justify the effort. However, adopting new innovations always come with risks that must not be
neglected [37]. This is the particular case of the acquisition VE models, like Dynamic
Manufacturing Networks opposed to the traditional ones [36]. Some of the benefits and risks are
identified as follows [34]:
Firstly, to succeed, a DMN should reach a consensus configuration to optimize the design and
the development of new products and components, thus at the same time avoiding unexpected
flaws and minimizing time waste consumption during the design phase of a product lifecycle.
This reduces inventory costs (each selected product has a specific price according to the desired
configuration), optimizing the selection of new partners and helps to maintain a healthy
competitive sector. Regarding knowledge acquisition and security threats, a DMN will have to
implement a confidential system that differentiates access rights and contractual agreements of
the exchanged information and therefore avoiding malicious attacks that could compromise the
trust of the engaged enterprises.
Moreover, the partner data has to be constantly available, therefore allowing organizations to
define product specifications in prompted and efficient manner, independently of the enterprise
localization. It is also important to have a system that rapidly adapts to production delays, by
identifying alternative partners for instance, in case of an eventual production line failure.
Nevertheless, it is expected some resistance by employees during the transition phase of the
recent implemented collaborative manufacturing model system. This risk can be resolved by
introducing a set of adapters that interconnects the data of all DMN members to the DMN
platform, ensuring thereby smooth transition for all involved entities. The platform will be
further explained in Section 3.5.
Additionally, a DMN promotes the opportunity for partners to work with more intelligent and
experienced organizations by exchanging and offering an opening for the birth of new
technological innovations. Consequently, out-dated information during the formation of a new
alliance configuration of a dynamic network could represent a serious risk for the network
maintenance; weaken quality standards and thereby jeopardizing its own life expectancy. To
avoid such undesirable setup, it is crucial to have accurate information on the actual
manufacturing and delivery capability of each DMN across the whole assigned partners.
To sum up, there were identified three main benefits: time savings, cost reduction, operations’
enhancement and five risks: information security, poor configuration, DMN dissolution,
competitive threats and loss partner’s reputation, as it can be seen in Table 3.1.
Page 42
3. Dynamic Manufacturing Networks
24
Table 3.1 - Dynamic Manufacturing Network benefits and risks (Adapted: Source [34])
Feature Description B
enef
its
Time Savings
Regarding DMN visibility, each
configuration will have an efficient and
suggestible partner selection during its
creation. Further, the products and
components are optimized individually for
each case. It is also important to consider the
planning and scheduling costs, possible
reconfigurations, the exchange time between
client and partners are saved.
Cost Reduction
DMN enables customized costs during
partner selection and production. This helps
to reducing the market expenses of the
managed resources.
Operations’
Enhancement
The gains that come from the relation
between a single enterprise and the rest of the
partners in the network.
Ris
ks
Information Security and
trust
Deliverable or indirect knowledge leaks
between enterprises.
Poor configuration Outdated information that could jeopardize
the lifetime of the DMN system.
DMN dissolution Unexpected partners that give up to
collaborate with the rest of the network.
Competitive threats Competitive threats after the exiting of a
partner or the dissolution of the DMN
Loss of partner’s
reputation
Partners that do not achieve its own
expectations, damaging the reputation of the
rest of the other DMN members.
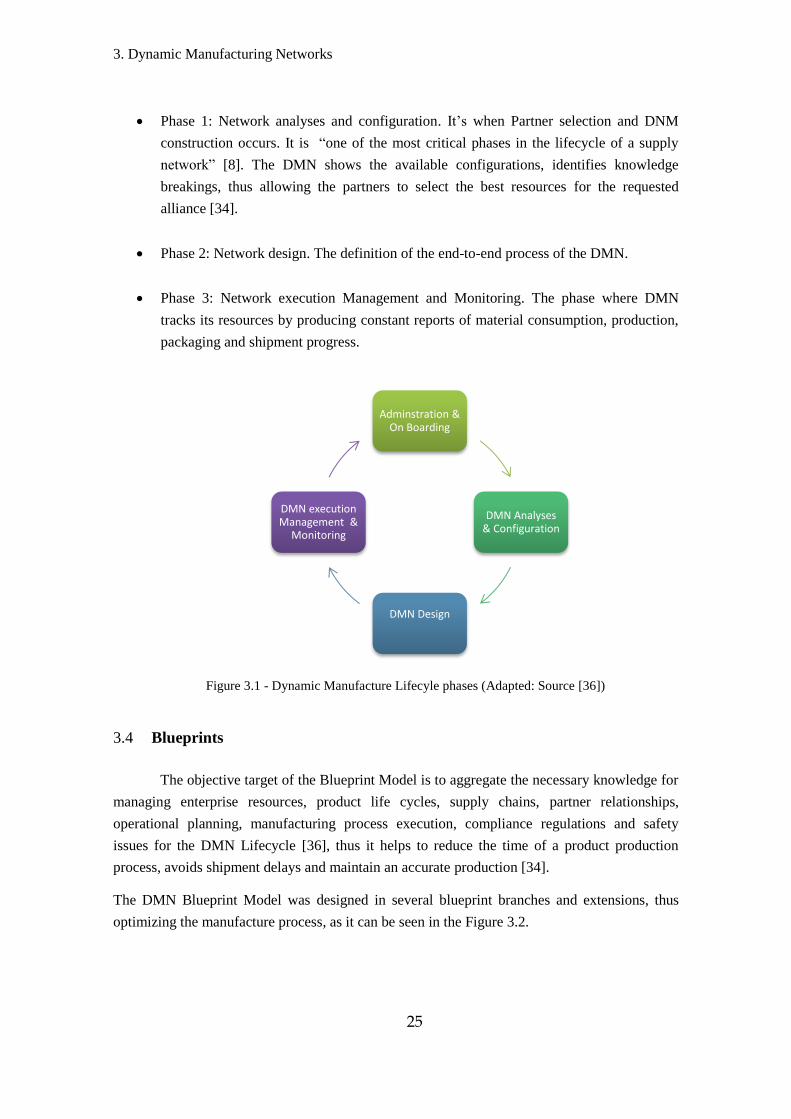
The DMN Life-Cycle 3.3
The DMN Lifecycle is an innovative method, including all supporting tools, such as
Service-oriented and Business Process Management technologies, which allows the
management of the entire lifespan of a manufacturing network, from planning and sourcing, to
manufacturing and delivery [36]. The Manufacture Network Lifecycle encompasses the
following three main phases, as illustrated in Figure 3.1:
Phase 0: Administration & On Boarding. Info orchestration; load blueprint information,
the registration of new partners and preparation and submission of the required
Dynamic Manufacturing Network information.
Page 43
3. Dynamic Manufacturing Networks
25
Phase 1: Network analyses and configuration. It’s when Partner selection and DNM
construction occurs. It is “one of the most critical phases in the lifecycle of a supply
network” [8]. The DMN shows the available configurations, identifies knowledge
breakings, thus allowing the partners to select the best resources for the requested
alliance [34].
Phase 2: Network design. The definition of the end-to-end process of the DMN.
Phase 3: Network execution Management and Monitoring. The phase where DMN
tracks its resources by producing constant reports of material consumption, production,
packaging and shipment progress.
Figure 3.1 - Dynamic Manufacture Lifecyle phases (Adapted: Source [36])
Blueprints 3.4
The objective target of the Blueprint Model is to aggregate the necessary knowledge for
managing enterprise resources, product life cycles, supply chains, partner relationships,
operational planning, manufacturing process execution, compliance regulations and safety
issues for the DMN Lifecycle [36], thus it helps to reduce the time of a product production
process, avoids shipment delays and maintain an accurate production [34].
The DMN Blueprint Model was designed in several blueprint branches and extensions, thus
optimizing the manufacture process, as it can be seen in the Figure 3.2.
Adminstration & On Boarding
DMN Analyses & Configuration
DMN Design
DMN execution Management &
Monitoring
Page 44
3. Dynamic Manufacturing Networks
26
Figure 3.2 - IMAGINE blueprint model (Source: [38] )
Partner Blueprint: It helps to set a new network configuration and makes the captured
skills and capabilities available in DMN to potential partners.
Product Blueprint: It enables companies to create, maintain, re-use and share the
product information of the entire manufacturing network.
End-to-End Blueprint: It ties together the unobtrusive processes associated with all
aspects of manufacturing and product development while providing the ability to adapt
to changing environments.
Quality Assurance Blueprint: It is intended to collect and maintain the resulted
production information and monitor the defined DMN configuration.
The blueprint was designed to be a cross sector independent which means that several branches’
extensions could be adjustable and to fit and fulfil to the desired needs. In the Figure 3.2 it is
illustrated three possible extension combinations, each one representing its own sector of
activity.
Information Technology (IT) platform 3.5
The constant market floatation and product competition force manufactures to have a promptly
response mechanisms. The DMN platform illustrated in Figure 3.3 is a crucial component that
helps manufactures to re-adjust their production when, for instance a supplier has a delay
shipment or a non-mismatch requirement to the initial products specifications.
In literature [39], an attempt to fulfil not only the evaluation performance DMN nodes
but also the overall current status of the DMN network partners and their rules. The overall
Page 45
3. Dynamic Manufacturing Networks
27
approach and the steps followed from the order arrival to the order dispatch are illustrated in
Figure 3.4.
Figure 3.3 - Schematic of DMN platform modules (Source: [39])
The process starts within an arrival of a new order. The requested product is analysed
by the system, which has to find among those available partners which one matches to the
required product’ specification.
The DMN process begins with the simulation of all network configurations and
analyses which one will maximize a set of performance indicators. Consequently, constant
information12
through the portal is necessary and the best node with all the profile requirements
is granted as the chosen competitor among the network.
However, an inconsistency may occur if one of the criteria fails, leading the network to
re-adjust, look for new potential partners and select once again a new desired configuration.
In the end, if the platform does not detect any more inconsistencies, then it will end the
DMN lifecycle and dispatch the product to its client.
12
Information related with costs (assembly, transport, raw-material) and delays (packing, shipment)
Page 46
3. Dynamic Manufacturing Networks
28
Figure 3.4 - Proposed UML diagram of the DMN methodology (Source:[39])
Special adapters are used for interfacing the platform with existing data sources and Information
Technologies (IT) systems, such as Enterprise Resource Planning (ERP) systems,
Manufacturing Execution Systems (MES), Product Lifecycle Management (PLM) systems and
Computer Aided Design (CAD) and Manufacturing (CAM) tools.
Conclusion Remarks 3.6
The twenty-first century has been characterized by the rapidly growth of new technologies that
inevitably triggered an increase consumption of new personalized products, which lead
enterprises to change its market strategies.
Consequently, each small and medium enterprise stopped to work against its direct competitors
and started to collaborate with each other by addressing new manufacturing networks to
promote a more dynamic knowledge exchanged to fill the technological gaps characterized by
traditional approaches.
This chapter introduced the notion of a new collaborative scheme: Dynamic Manufacturing
Network which invites enterprises and manufactures to work and share knowledge in an end-
end fashion.
The adoption of a new approach always comes up with some benefits and risks that should not
be disregarded. The design phase should consider saving time during the trade-off negotiations,
Page 47
3. Dynamic Manufacturing Networks
29
to select and choose products that maximize quality/price relation and, at the same time, capable
of managing partners dissolutions threats regarding security leaks and trustless configurations.
Page 48
3. Dynamic Manufacturing Networks
30
Page 49
4. Semantic Alignment for Seamless Knowledge Interoperability
31
4 Semantic Alignment for Seamless Knowledge Interoperability
Semantic Alignment for Seamless Knowledge
Interoperability
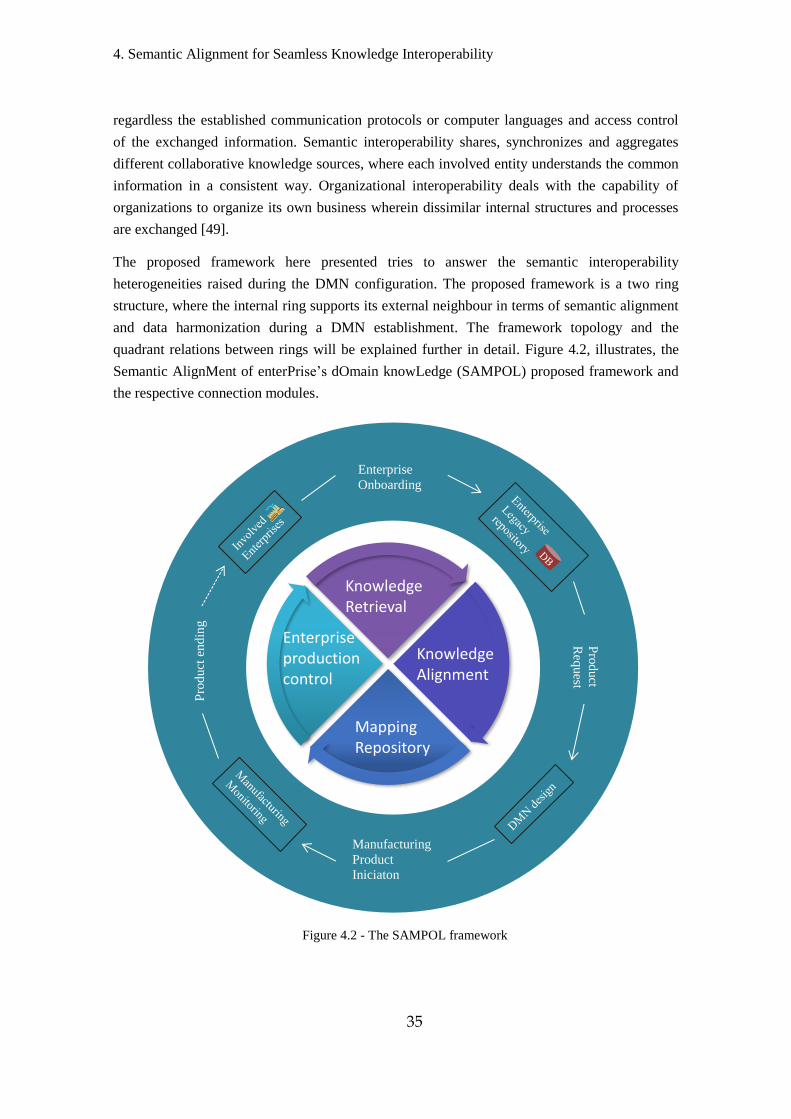
This chapter provides a context description of the proposed semantic alignment framework and
its components. It will also be presented the related work regarding mapping concepts and
knowledge alignment.
Introduction 4.1
Electronic commerce (e-commerce) strongly influences the way how enterprises exchange
information, trade products and services with other organizations. The Dynamic Manufacturing
Networks addresses the opportunity for manufactures to communicate with its partners and
exchange information in a transparent and efficient manner.
In terms of Dynamic Manufacturing Networks interoperability concerns on the specifications
that support seamless connectivity between allied partners by monitoring a set of defined
performance indicators. Connections along different partners bring forth a considerable amount
of data that has to be properly maintained in future integration for those who need to share their
acquired knowledge [40]. The mechanism for exchanging information on the Web may contain
a diversity of knowledge, each one with its enterprise resource planning (ERP) and enterprises’
legacy systems for the same-shared collaborative network configuration. Thus, it is expected to
find semantic heterogeneity inconsistencies during the establishment of a new DMN.
The Semantic Web is a vision for the future of the Web in which information is given explicit
meaning, making it easier for machines to automatically process and integrate information
available on the Web [41]. Semantic web services (SWS) technology aims to add sufficient
semantics to the specifications and implementations of web services to make possible the
4
Page 50
4. Semantic Alignment for Seamless Knowledge Interoperability
32
automatic integration of distributed autonomous systems, with independent designed data and
behaviour models [42].The web service modelling ontology (WSMO) [43] initiative defines the
inter-related semantic support modules of the web services. Figure 4.1, illustrates three branch
point-actions of the project:
Figure 4.1 - WSMO conceptual schema (Adapted: Source [43])
Concerning about heterogeneity problems and following the WSMO initiative, this dissertation
proposes the SAMPOL (Semantic AlignMent of EnterPrise’s dOmain knowleLge ) framework
to map every company resource concept according with a reference ontology and further fill the
result matches on an information ontology. SAMPOL selects each company’s information and
divides its resources, allowing user categorization of the in-game information, thus helping the
harmonization of the synchronized shared information. The SAMPOL has a support database
that stores the partner data. Every time a new company joins the network manufacture, the
SAMPOL will check the income information and will classify it as data to be aligned with the
reference concepts.
Goals
Web Services
Mediators
Ontologies
Objectives that a client may have
when consulting a Web Page
Semantic
description of the
Web Services
-Capability
-Interfaces
Provide the
formally
specified
Technology of
the information
used by all
other
components
Connectors between components with mediation
facilities for handling heterogeneities
Page 51
4. Semantic Alignment for Seamless Knowledge Interoperability
33
Heterogeneity 4.2
a) Semantic Heterogeneity
Chapter 3 (Dynamic Manufacturing Networks) identified the reason why it is important to have
a system able to maintain its repository constantly updated whereas enterprises and
organizations exchange data in a collaborative environment.
The resulted alliance was defined according to a set of criteria which, maximized the network
performance. Since each enterprise has its own legacy system repository, a single concept may
have different meanings or interpretations among the exchanged information. This phenomenon
it’s known as semantic heterogeneity. These types of heterogeneities can occur in form of
naming conflicts, generalization conflicts, language, as shown on table 4.1.
Table 4.1 - Semantic heterogeneity conflicts
Conflicts Description
Naming conflicts
Semantic correlations with equivalent meaning between two
concepts are located in different ontologies. That’s the case of the
synonyms and homonym.
A Synonym or equal relations occur when two or more distinct
concepts presented have the same or comparable denotation. On
the other hand, an antonym refers to opposite or disjoints
meanings.
Generalization conflict
Two different concepts (C1, C2) that are semantic correlated on
distinct system (S1, S2) where, 𝐶1 ⊇ 𝐶2, 𝐶1 ∈ 𝑆1 , 𝐶2 ∈ 𝑆2
That’s the case of the hypernym. A word A is a hypernym of B
when it describes a more comprehensive description than B. In an
opposite, a less general or comprehensive relation of those words
are known as hyponym.
Language conflict
Two identical concepts (C1, C2) that are semantic correlated on
distinct language systems (S1, S2) where, 𝐶1 ≡ 𝐶2, 𝐶1 ∈ 𝑆1 , 𝐶2 ∈ 𝑆2 That’s the case of the word “travel” and the word “viagem”. Both
meant the same but they are written in different native languages.
The word “travel” is an English word and “viagem” is a
Portuguese word.
b) Structural Heterogeneity
Further, a structural heterogeneity could appear, if the information from the DMN creation has
two identical concepts or properties. In most cases, no direct concept-to-concept or property-to-
property mapping are possible. In literature, like those conducted by Madnick & Zhu [44] and
Ram & Park [45], it is possible to find studies that classify structural heterogeneity in several
Page 52
4. Semantic Alignment for Seamless Knowledge Interoperability
34
types of conflicts. The table 4.2 has a detailed description of isomorphism, aggregation
conflicts; schematic and concept discrepancies.
Table 4.2 - Structural heterogeneity conflicts (Adapted: Source [46])
Conflicts Description
Isomorphism conflict
Semantic correlated concepts (C1, C2) classified by different set of
properties. Example: the concept Square and Circle. Square could
have the property Length and the circle the property Radius
Aggregation conflict
A property or a concept in one system maps to a group of
properties in other system. Example: the property Name of the
concept Teacher is to a group of properties FirstName and
LastName of the concept Person
Schematic
discrepancies
The logical structure of a set of properties and their values
belonging to a concept in one ontology are organized to form a
different structure in another ontology. This kind of conflict can
also be classified several types of conflicts, such as
DataValueProperty conflict, PropertyConceptConflict and
DataValueConcept conflict.
For example, the DataValueProperty conflict occurs when a
value of a property in one ontology corresponds to a property
name in another ontology. The PropertyConcept conflict occurs
when a property in one ontology is being modeled as a concept in
another ontology and the DataValueConcept conflict occurs when
the value of a property in one ontology corresponds to a concept
name in another ontology.
Concept discrepancies
A property or a concept in one system maps to a group of
properties in other system. Example: the property Name of the
concept Teacher is to a group of properties FirstName and
LastName of the concept Person
SAMPOL Framework 4.3
The Institute of Electrical and Electronics Engineers (IEEE) [47] describes interoperability as
the ability of a system or a product to work with other systems or products without special effort
on the part of the customer, either defined by Wegner [48] as the ability in which two or more
software components collaborate despite differences in language, interface and execution
platform.
The interoperability concept is constantly changing and adapting as large and more complex
systems emerge to rise above of the overall current faced challenges. Thus, interoperability can
be further classified, among others: technical or syntactical, semantic and organizational and so
on. Technical interoperability helps to reduce and maintain two or more information systems
Page 53
4. Semantic Alignment for Seamless Knowledge Interoperability
35
regardless the established communication protocols or computer languages and access control
of the exchanged information. Semantic interoperability shares, synchronizes and aggregates
different collaborative knowledge sources, where each involved entity understands the common
information in a consistent way. Organizational interoperability deals with the capability of
organizations to organize its own business wherein dissimilar internal structures and processes
are exchanged [49].
The proposed framework here presented tries to answer the semantic interoperability
heterogeneities raised during the DMN configuration. The proposed framework is a two ring
structure, where the internal ring supports its external neighbour in terms of semantic alignment
and data harmonization during a DMN establishment. The framework topology and the
quadrant relations between rings will be explained further in detail. Figure 4.2, illustrates, the
Semantic AlignMent of enterPrise’s dOmain knowLedge (SAMPOL) proposed framework and
the respective connection modules.
Enterprise
Onboarding
Pro
duct
Req
uest
Manufacturing
Product
Iniciaton
Pro
duct
end
ing
Figure 4.2 - The SAMPOL framework
Enterprise production control
Knowledge Retrieval
Knowledge Alignment
Mapping Repository
Page 54
4. Semantic Alignment for Seamless Knowledge Interoperability
36
The external ring is composed by eight elements which together briefly summarize a Dynamic
Manufacturing Network lifecycle.
The production productivity or the innovative technologies are some appointed reasons whereon
lead enterprises to support themselves and not working against each other. Thus, initially
enterprises are invited to join a collaborative manufacturing network, not forgetting that each
one has its own view perspective and knowledge of the domain they represent.
Before a manufacturing production begins, first it is necessary to design some of the
specifications, taking into account features like: time consumptions, raw material prices or the
distance between factories, when a new product request arrives to be manufactured. Moreover,
it is important to define an adequate monitoring mechanism during the production phase that
ensures a rapid response to non-expected events, already discussed in the last chapter.
The designed internal ring aims to support semantic consistency and therefore avoiding
heterogeneities in communication during a Dynamic Manicuring Network design, by
implementing previously semantic knowledge alignment mechanism, capable of resource
mapping of the overall invited enterprises. Moreover, following the same line of reasoning
that’s the reason, why the knowledge alignment module is in the same quadrant of Product
Request of the external ring. Also the knowledge retrieval module deals with the knowledge
extraction of the invited enterprises and it tries to understand its own domain, divides its
information in a set of categories in order to be further aligned within known reference source
knowledge. Having done with the alignment, it is necessary to support and save the resulted
mapping in repository. This information can be used for knowledge control and tries to
understand, for instance if a mapped resource suffers modifications over time. Finally, it’s also
important to define a control mechanism that could find and avoid already mapped conceptual
knowledge duplicates. Such module is identified in the internal ring as enterprise production
control.
4.3.1 Repository Ontology for Mapping Establishment
As described in Section 2.2.1, information ontology is used to store the data in a database
independent fashion. Some applications have the potential to store and maintain a record for all
the data exchanged during its lifecycle. The DNM contains a self-pragmatic configurations
since all information is in a continuously motion and has to adapt according to the network
needs. In response, the system does not have the capability to store and maintain an entire
record of exchanged data.
In order to be successful, a knowledge-alignment within two (or more) entities must happen,
when they communicate and collaborate with each other. The ontology mapping operation helps
to reduce, both semantic and structural heterogeneity wherein occurs resources exchange
information in collaborative system environments [46].
Page 55
4. Semantic Alignment for Seamless Knowledge Interoperability
37
The MENTOR (Methodology of Enterprise Reference Ontology development) [50] acts as a
mediator between entities, containing a reference for mapping establishment and allows to
record the result data to further use, making partner communication transparent and data
exchanged weightless. The project is also able to represent ontology semantic operations, for
instance: ontology mapping and semantic mismatches. Agostinho et.al. [51] proposed a tuple-
based semantic architecture to encompass such mediator behaviour. The output information
deriving from ontology mapping should be recorded in such Knowledge Base which will allow
future data manipulations. The mapping tuple is defined by an identifier (ID), the mapped
elements (MElems), the couple mismatches mapped classes (MathClass), a mapping expression
(Exp) and a Knowledge mapping type (KMType) which can be Conceptual, Structural or
Instantiable Data, as illustrated in Figure 4.5.
Figure 4.3 - Knowledge Mapping Chart (Adapted: Source:[51])
Figure 4.6, illustrates a modified and updated version of the proposed Mediator Ontology (MO).
In structural point-of-view the mapping repository represented bellow contains two main
phases: the model construction and the Morphism association. On the left-side of the diagram
the Object class is a representative class that wraps the content of ModelElement and
InformationMode classes. Together, the Object and the InformationModel construct the model
to be represented and the Object and the ModelElement constructs one component of the
previously represented model. The model also contains relational elements that glue the classes
of the desired represented model. According to the application needs, it is also necessary to state
the type of element which belongs to the model. The assigned type can be a class, instance,
property or concept. After the model is set, it is now possible to establish relations between two
Objects. The Morphism is responsible of such relational process. The MorphismType can be
mapping, merging or versioning. If a mapping occurs it is necessary to define the mapping type
(attribute, structural, conceptual or instance). The MatchMismatch class classifies the result
heterogeneities of the mapping process.
Knowledge Mapping
Conceptual Structural
Instantiable Data
Semantics
Page 56
4. Semantic Alignment for Seamless Knowledge Interoperability
38
Figure 4.4 - Structure of knowledge base for mapping repository (Source: [51])
Semantic Alignment related work 4.4
Semantic alignment proposed solutions diverge according to the mapping establishment
approach. Some solutions rely on ontology to extract relations just by looking for their size and
hierarchical conceptual structure neglecting the proper concept meaning in the first place.
PROMPT (formerly SMART) [52], an user-interaction semi-automatic tool that
continuously suggest the concept matches until the desired alignment is reached. As a result a
merged ontology with the results of such mapping process appears from the mapping process.
COMA++ [53] was one of the first proposed solutions containing a repository support to
store the mapping information present on a tree ontology visualization interface.
Hierarchical speaking, ontologies resembles an object-oriented programmer computer
language. Manner fact, not only those conceptual classes presented in an ontology and their
relations could be used to extract the semantic alignments on a mapping tool, but also properties
or individuals are in the manner fact well-accept. Jason Jung [54], proposed a mapping alignment
between two VE taxonomies by capturing the instance similarities of the respective paired
concepts. However, the solution may be meaningless if some instance concepts or relations are
missing despite the automated process.
Traditional approaches relied on the structure between the concepts presented in the
ontologies in order to establish a possible concept alignment. The process computes how far each
character is alphabetical apart from each order between two distinct concepts. A more recent
based on information distance theory approach proposed by Jiang et.al. [55], tries to find
similarities on the involving concepts by using the Google page.
Page 57
4. Semantic Alignment for Seamless Knowledge Interoperability
39
IF-MAP [56], identifies mappings automatically based on the theory of information flow.
It exploits both schema and instance information to match two ontologies. It first examines their
instances to determine whether they can be assigned to concepts in reference ontology and then
uses formal concept analysis to derive an alignment.
XMAP [57], explores a combined weighted sum with a sigmoid function, not only for
the linguist similarities in the ontologies but also, it tries to find correspondences on the class
that has identical property cardinality constraints in semantic heterogeneities. This approach,
reaches a better performance methodology, making the possible mismatches much easier to find,
plus the advantage to have free human agent interaction on the overall process.
ASMOV [58], solution computes semantic alignment inconsistencies. It uses two distinct
faces, one that tries to find similarities on a two input ontologies within a third pre-aligned
ontology and a second process which tries to validate the possible matches established in the first
phases. The drawback of this approach is the computational time needed to find the mappings in
the first place.
The mapping tools so far presented lack from the fact that the shared concepts must be
written in the same natural language. A heterogeneity problem could raise, if the source and the
target ontologies came from different native languages. Concepts written in different languages
offer a linguist barrier for those who try an establishment agreement.
SOCOM++ [59], solution translates the two ontologies in the same language before the
mapping takes place and the resulted morphism is managed by a MoMo (Model Morphism)
system.
Concluding remarks 4.5
In this chapter the proposed semantic alignment of enterprise’s domain knowledge framework
was presented. Its goal is to provide technological solution capable of formal semantic mapping
representations supports the establishment of interoperable communications in a manufacturing
network. Therefore, the chapter also included a breathily script description of its components to
support future collaborative networking integration to any semantic alignment system that needs
to exchange data from different knowledge sources.
Page 58
4. Semantic Alignment for Seamless Knowledge Interoperability
40
Page 59
5. Proof-of-Concept Implementation
41
5 Proof-of-Concept Implementation
Proof-of-Concept Implementation
Proof-of-Concept Implementation chapter will explain the proposed mapping tool according to
the scenario presented in section 5.2. The proposed solution designed a mapping tool which will
map each ERP’s registered company concepts according to the knowledge of the reference
ontology in order to avoid interoperability inconsistencies in the i-platform.
In this chapter will be possible to find a briefly reference of the used technologies that supports
the construction of the mapping alignment process. To understand how such semantic alignment
is made, the proposed architecture of the mapping tool followed by an enlightening explanation
of its components is also presented.
Used Technologies 5.1
5.1.1 Liferay Portal
Liferay Portal is a free and open source enterprise portal written in Java and distributed under
the GNU Lesser General Public License and proprietary licenses.
According to Oracle [60] a portal is “web based application that commonly provides
personalization, authentication, [and] content aggregation from different sources and hosts the
presentation layer of information systems”.
Liferay portal allows the user to create custom web content in independent window container so
called portlets [28]. The JSR-168 [61] specification defines portlet as:
Portlets are web components – like servlets – specifically designed to be
aggregated in the context of a composite page. Usually, many portlets are invoked
to in the single request of a portal page. Each portlet produces a fragment of
5
Page 60
5. Proof-of-Concept Implementation
42
markup that is combined with the markup of other portlets, all within the portal
page markup.
Portlets provide the user interface of the portal by accessing distinct applications, systems,
or data sources and generating markup fragments to present their content to portal users [62].
5.1.2 Java
Java is an object-oriented high-level programming language.
On the technical side, the portlet is a Java class that implements the javax.portlet.Portlet
interface and is a packaged and deployed as a WAR file inside of a Portlet Server container. The
Protégé API it is in Java language which encompasses the support for ontology manipulation.
5.1.3 Java Server Pages (JSP)
JavaServer Pages (JSP) technology enables Web developers and designers to rapidly develop
and easily maintain, information-rich, dynamic Web pages that leverage existing business
systems. As part of the Java technology family, JSP technology enables rapid development of
Web-based applications that are platform independent. JSP technology separates the user
interface from content generation, enabling designers to change the overall page layout without
altering the underlying dynamic content [63].
5.1.4 JavaScript
JavaScript is a dynamic computer programing language. It is commonly used as part of web
browsers, whose implementations allow client-side scripts to interact with the user, capture
events that occur on the page, provide the website of dynamic manipulation of the HTML
content displayed without needing to reload the page. This is the reason why the propose
solution utilizes the AlloyUI amongst all visualization tools discussed previously in Section 2.3.
5.1.5 MySQL
MySQL [64] is a multiplatform open source relational database system that allows current
access through multiple kernels. It is the worldest popular database for the web and it is the
number two choice of the web brands today, due to its flexibility and security concerns. It stores
its information exclusively in tables, supporting a diversity of data types, ordering functions
being an efficient auxiliary support to OWL management [18].
5.1.6 Protégé-OWL API
Designed by Stanford University, Protégé is one of the most popular free ontology modelling
tool editors. The management tool offers an OWL-API which allows developers to use and edit
Page 61
5. Proof-of-Concept Implementation
43
its Java source code, thus implementing class, property or even attribute manipulation of its
OWL or RDF files.
5.1.7 Service Oriented Architectures
The Organization for the Advance of Structural Information Standards13
(OASIS) defines the
Service Oriented Architecture (SOA) as a “paradigm that has gained significant attention within
the IT and business communities” [65].
5.1.7.1 Web Services
A Web service is a “software system designed to support interoperable machine-to-machine
interaction over a network”[66]. It exposes its features programmatically over the Internet
(e.g., XML14
message send through HTTP15
), and can be implemented via a self-describing
interface based on open Internet standards [67].
In particular, SOAP (Simple Object Access Protocol) offers the tools and the mechanisms to
implement Web services that perform Remote Procedure Calls between programs in a language
and system-independent way. The requested message is contracted in XML format and is sent to
the server, using the HTTP protocol. The reply message come also in XML format. In this way,
applications on heterogeneous platforms can communicate [68].
Network Agents 5.2
Even before an ontology mapping begins, it is necessary to state a reference for the
specific domain establishment. To be successful, agents need to exchange messages in a
protocol fashion. NOKMS [69] proposed solution relies on ontologies to negotiate an agreement
between agents. Recently efforts [70], [71] rely on more robust free-agent strategies which
overcome the possible mismatches trends during the protocol establishment.
In an attempt to avoid such inconsistency exposed in Section 4.2, the author identifies six agent
entities that communicate and work collaboratively. Each user has a special capability and well-
defined tasks which all together working in collaborative way helps define and maintain the
DMN configuration.
Agents talk to each other in order to achieve a consent understanding through all shared
concepts under the DMN. Table 5.1, define the platform agents and their rules to form the
domain knowledge ontology system establishment as base line for further mapping
establishment.
13
https://www.oasis-open.org/ 14
http://www.w3.org/XML/ 15
http://www.ietf.org/rfc/rfc2068.txt
Page 62
5. Proof-of-Concept Implementation
44
Table 5.1 – The adopted semantic aligment
Platform Users Description
DMN Manager It has the responsibility of creating a DNM, which
represents the manufacture process of a product
Company ERP Manager
The company production manager which has the role of
deciding a participation in DMN and update their own
ERP
Knowledge Engineer An agent that has the role to update the knowledge of the systems (e.g. ontology concepts that represent categories)
Domain Expert Domain expert agents. It knows the terminologies for a specific industrial activity sector.
LL Administrative
Officers with an administrative cargo that make the
subscriptions in the platform of the enterprises. Example: Office department
Informatics Engineer
Known as a computer science or a computer engineer that
manages and supports the subscriptions in the platform of the enterprise.
The Domain Expert is the most suitable person to say what entities and relations
concepts needed to acquire the representation of the knowledge for each specific case. Then the
Informatics Engineer store such information on an ontology database which will be the guided
reference for classify the information present in each company.
Adapter for Enterprise’s Legacy System Integration 5.3
The adapter acts like an intermediate module to grant that each enterprise contains the
necessary requirements specified in their blueprints. A correct and success registration should
has their knowledge concepts mapped according to the legacy ERP’s before the company
information is sent to the i-platfom. This facilitates the process of searching for new suppliers,
adding a simulation process taking account different scenarios, while enterprises autonomously
exchange information. This gives companies the ability to provide order tracking and
monitoring transparently to the user in real time.
Page 63
5. Proof-of-Concept Implementation
45
Figure 5.1 - IMAGINE Adapter screenshot (Adapted: Source: [38])
The workflow information in the adapter and the architecture models are explained as follows:
1. The process starts every time a new company is invited and joins the platform system.
If it is successful, the registered company needs to transfer its resources and legacy
systems through a web service connection linking the adapter.
2. The transformation module is responsible and test if the domain information is well
characterized according to the blueprint specifications. This is an important phase since
an absence of such structure it may compromise the further knowledge alignments on
de the Data Integration Module. Figure 5.2, illustrates the two transformations taken by
the Knowledge Engineer. The orange arrow symbolizes the transformation among
Organization (AP236) and the Company blueprint. The orange arrow symbolizes the
address transformation under the Organization (AP263) and the ContactDetails on the
blueprint side.
3. The Ontology DataBase contains knowledge reference, which will be used as a
competitive guideline for mapping establishment. This ontology will be explained in
Section 5.4.1.
4. The Data Integration Module has the capability to align the knowledge between the
ERP’s and the defined reference ontology. The mapping tool proposed in Section 5.3
manages and supports the functionality of this module.
5. A parallel communication channel Communication module which allows the final
prepared information being send to the i-platform.
Furniture LL Adapter
Communications Data Integration Transformations
Ontology DB
Furniture Platform Portal
Enterprise Service Bus
Company C
Portlets
WS
WS
WS
Legacy System
DB
Legacy System
DB
Legacy System
DB
Integration DB
Platform
BP Knowledge Base
DMN Services
WS
Company B
Company A
Portlets Company ERP Managers
Platform Portal
Page 64
5. Proof-of-Concept Implementation
46
Figure 5.2 - Mappings establisment between enterprises legacy and the BP data models
(Source: [72])
Mapping Tool Architecture 5.4
In Section 4.4 some mapping tools were presented regarding some strategy approaches. The
mapping tools architecture are inspired in some characteristics and advantages of each one those
works.
The mapping process tends to be a demand task for user interaction, that’s the reason why more
recent approaches look to get automatic. Besides the possibilities of having such mapping
process, the tool still maintains manual control to be more computer-light and maximize the
final map quality.
Concerning about a better sustainability, the mapping architecture presented also cares about the
scientific progress. The user involvement, the explanation of matching and the structure and
support are identified by Shvaiko et.al. [73] as future challenges that were taken in consideration
during the design phase of the proposed tool.
Due to its flexibility, the proposed mapping tool allows an user to determine the most accurate
matches in an effortless way. Figure 5.3 shows an overview of the proposed mapping tool which
will enable harmonization between ERP’s and a domain reference.
Page 65
5. Proof-of-Concept Implementation
47
Reference
Ontology
Information
Ontology
Support
Database
The mapping tool is divided in the following components and actors:
The Reference Ontology, which contains the reference knowledge for future
alignments.
The Support Database that acts as a manager of income and outcome information and
temporary mapping repository.
The Information ontology which, stores the final aligned concepts.
The domain expert that maps the partner data concepts according to the knowledge
defined in Reference Ontology.
A platform which receives the aligned information.
The DMN manager defines, publishes and starts a new manufacturing network
configuration.
The partner data present in each of the enterprise’s legacy repository.
The Information Control, which transforms and controls the income and outcome
information from the other modules.
Mapping tool
Liferay
Webprotégé
Platform
SO
AP
Figure 5.3 - Client-Server mapping tool architecture model
Client Server
Enterprise’s legacy
repositories
DB
DB
Information Control
Module
Page 66
5. Proof-of-Concept Implementation
48
The mapping tool portlet interface, which enables the semantic alignments of the
exchanged resources.
The Webprotégé enables reference domain knowledge re-adjustments.
The Informatic Engineer to control the Webprotégé environment.
The architecture is based on client-server communication model with a third external connection
to the IMAGINE platform. The client side is composed by one domain expert and an
imformatics engineer. Each one controls the designed mapping tool interface and the
Webprotégé environment respectively. When the expert domain agent finishes the mappings for
a single enterprise, the aligned information is sent to the platform to be further managed by the
DMN manager. Furthermore, the informatics engineer has the capability and the permission to
change and modify the reference ontology, thus providing accuracy and reliability of the
postulated domain knowledge. The server side has one integration repository that contains the
temporary information of income and outcome mappings and enterprise’s legacy resources; a
reference ontology that contains the in vogue domain knowledge; a mediator ontology to store
the resulted mapping establishments.
5.4.1 Reference Ontology
The reference ontology was designed in order to guarantee the most accuracy as
possible. Figure 5.4 shows the knowledge modelling ontology that states as a reference model
for the categories and concepts for each industrial domain. The class names and associated
description of the information ontology model are explained as follows:
Category – The main root class of the entire model. Contemplates a descriptive text
and manages the relationship with the platform blueprint knowledge base;
Company – A direct child class of Category class to identify the type of activity of each
company (e.g. manufacture, retailer);
Domain – A direct child class of Category class to identify the working domain (e.g.
automobile, furniture);
Market – A direct of class of Category class to describe the type of market that the
company can reach (e.g. European, Asian);
Product - – A direct class of Category class to represent the name of a company’s
product order (e.g. leather, glass);
Page 67
5. Proof-of-Concept Implementation
49
Material – A direct class of Category class to represent the material of each company
process (e.g. leather, glass);
Equipment - A direct class of Category class to represent the equipment that each
company has in their facilities to execute processes (e.g. 3D printer);
KPI - A direct class of Category class to maintain a list of standardized key
performance indicators (KPI). These can have metrics to enable subsequent evaluations;
Standard - A direct class of Category class to indicate the standards in use;
Unit – Class to represent measuring units (e.g. meters). As the Category class, it also
enables to define a relationship to the iplatform blueprint knowledge base.
Figure 5.4 - Knowledge modelling ontology for enterprise’s resource categorization
(Source: [38])
The Domain Expert is the most suitable agent to say what entities and relation concepts
are needed to acquire the representation of the knowledge for each specific case. The result
information is stored by an Informatics Engineer on an ontology database which will be the
guided reference to classify the information of each company.
For technological reasons, the project utilizes an adaptation of a catalogue whose acquired
knowledge is present in ontology partner16
with a property that indicates which categories, i.e.
the concepts that will be eligible for subsequent mappings. Among the conceptualized
knowledge, only those tagged concepts should be elected and presented in the proposed tool for
further knowledge alignment. The idea behind all of this is to have a reference ontology, which
16
www.aidima.es
Page 68
5. Proof-of-Concept Implementation
50
concepts could be known and used by all, without forcing semantic changes in enterprises
legacy system.
It is important to have an extended set of concepts to help describe and categorize the intended
domain and then as the repository gets larger it is expected to find more close information,
wherein it is crucial to have a way how to differentiate each resource among the remaining
categories.
The reference ontology has an IsReference boolean data type property whether the requested
resource is identified as a potential concept for mapping establishment with the received partner
concept of the external channel. It also has in its rdfs:comment property an optional description
of the selected class, thus turning the mapping process more feasible by helping the knowledge
expert to choose a category as future reference resourse. Figure 5.3, illustrates both, IsReference
and the rdfs:comment properties for the concept DomesticChair present in the Reference
Ontology.
Figure 5.5 – Reference ontology screenshot
Among the three hundred and thirty seven classes present in the reference ontology, were
initially considered only four classes (categories) as classifiers to the type of resource to be
mapped: Material, Product, Process and Equipment. A given material is for the purpose of
manufacture directly associated with a particular product. Therefore, the category Product is
merged with Material category a possible resource type to be mapped. The proposed tool is not
necessarily limited to these three possible resources, which can alternatively consider other
resources, depending on the intended application.
Page 69
5. Proof-of-Concept Implementation
51
Once recorded, each company will have its knowledge classified according to their types of
resources, such as specified in the categories present in the reference ontology. The information
for each company is recorded and saved in database integration.
5.4.2 Support Database
The database integration is the fundamental base of support for maintenance and management
of the registered enterprises and its category resources, the unfinished and the remaining
mapping establishments. The tables used in the mapping tool architecture are integrated in the
integration database of the IMAGINE adapter illustrated in Figure 5.1. Besides its size and
complexity, only five of the initial twelve tables are used to manage, implement and support the
proposed mapping tool architecture. Figure 5.6 shows the enhanced entity-relationship model
and therefore the names, data types and relations used in the integration DB.
The five used tables and its descriptions are presented below:
Company: Table responsible for storing the information from the registered companies.
It contains the name of the registered company, imagineCompanyID generated by the
platform and the vatNumber (unique identifier of the company).
Legacyerpresource: Table responsible for storing the remaining information of each
enterprise resource to be further mapped. It contains information regarding the type,
name and description of each successfully registered enterprise in company table. Thus,
the resource table contains the information resources of all companies registered in the
adapter, so there is a connection “one-to-many” with the company table.
Mappingcategories: This table was originally designed to indicate which resources
have been mapped from the registered companies. As it will be explained later, this
table will play an important role in the management and optimization of the content
shown in the portlet mappings.
Resourcecategories: Table responsible to identify the matched pairs to be further
submitted into the platform.
Page 70
5. Proof-of-Concept Implementation
52
Figure 5.6 - The integration database enhanced entity-relationship model
Page 71
5. Proof-of-Concept Implementation
53
Mappings: The mappings table is responsible for storing the mappings established in
portlet. It contains the mapped pair concepts (the resources received by the external
channel with the reference concepts), the mapping date, the descriptions of each map
establishment (when available), the taxonomy path, the company vatNumber, the
platform number and the resource type (imagineResourceId). This number will serve to
identify the concept sent by the service side of the platform after the mapping has been
established.
5.4.3 Information Ontology
This module already was described and widely clarified previously in Section 4.3.1 and
therefore it will not be once again explained. However it is important to remember that this
module concerns mainly on keeping a record of the semantic alignments and its resulted
morphism took in the mapping tool.
5.4.4 Information Control Module
The proposed tool tends to respond the ability to semantically align the received resources
among the registered partners with a specified reference.
The information control module is the most important component of the entire framework and
acts as a central base communication among the remaining modules. The Figure 5.7 shows the
proposed management module and its three modular components: 1) data preparation of the
reference ontology and information for enterprise resource registered in database integration, 2)
the conceptual mapping of a given business use stage 3 ) save mapping and forwarding
information to the platform.
Tree reference
data
Database management
Portlet control
Figure 5.7 - Information control
module phases workflow
Page 72
5. Proof-of-Concept Implementation
54
a) Tree Reference Data
The Tree reference data module is responsible to retrieve, organize and the reference ontology
classes and its hierarchical relations in a tree java object. This allows to easily searching for a
specific class by name, analyses the hierarchical relations between relative nodes and at the
same time maintain its own representational structure. The module is composed by
edu.ontology.tree java package with three classes.
The class Node.java defines a node of the requested tree in a java object and can be set as class,
property or attribute type. It also has one Boolean and one String data type to record the
description and the reference value present in the reference ontology. The remaining two classes
Tree.java and ModeltoTree.java together with the Protégé-OLW API read each create node
object and fill it into a tree java object.
b) Database management
The Tree reference data module is responsible for income and outcome information coming
from the support database. The information flow is controlled by the accessSQL.java class
which implements the ordering, searching and writing methods.
c) Portlet control
The portlet control module manages all the information regarding server side flow control,
including portlet Uniform Resource Locater (URL) phases. The functionality is located in
com.tree java package, which contains the TreMapConstants.java interface and TreeMap.java
class. The interface has the implemented constants and the class implements the portlet
functionality.
Application Scenario 5.5
The following scenario presents the interactions for a specific chair order between a retailer and
client of the IMAGINE project to support the applicability of the proposed thesis work.
Nagasawa [74] shows on his study that only around 38% of the inquired population sample
would buy a long term piece of furniture. These could be an indicator of the sector’s fragility
and thus it has to constantly adapt in a non-predict way to be competitive in their business
niche. Products with short lifecycles characterize the sector. As a result, time-to-market is
essential to keep up with customer demand and ensure customer satisfaction. Moreover, The
Furniture sector relies mostly on human intervention and manual processes in order to deal with
most of the tasks related to Product Lifecycle Management [75].
Page 73
5. Proof-of-Concept Implementation
55
The DMN configuration is no exception. Each enterprise has a specific knowledge of
their domain and a description of their products, processes and even equipment. An
inconsistency may occur, when two or more entities try to start a dialog. To avoid such scenario,
all parties must have an intermediate domain knowledge entity that acts like a mediator through
the rest of the network. Let’s take the following example.
A client C1 contacts chair manufacture M1 to order a 1000 customized chair model, by
modifying one of the chairs of M1 catalogue (model 145), for C1 conference’s room . The
manufacture contacts his production department to design a blueprint with the C1 product
specifications. The chair model contains different parts, each with a specific raw material with a
wooden back, textile seat, an aluminium structure and a crystal piece, as is illustrated in Figure
5.8.
The manufacture has to look for partners that manufacture all parts of this chair model
“145” since he is not able to manufacture: textile aluminium legs. He only has the ability and
the known how to produce the wooden back. The manufacture must contact his associates and
requires a blueprint with the detailed specification for each chair component. The final result
blueprint, eventually could present some errors or incompatibilities that do not match with C1
needs. The wrong blueprint has to turn back to produce a new modified version, originating
undesirable delays. To respond accordingly, a conceptual mapping between the associates is
needed. Each associate contains his knowledge represented in a Knowledge solution, like those
presented in Section 2.
A conceptual mapping between two ontologies from distinct companies is taking place
by an agent. Section 5.2 will describe the network of furniture agents involved in the process.
Let’s assume that the agent is a person who has the sufficient knowledge and skills to work with
an ontology and with an ontology editor. Each company has their own ontological concepts and
their legacy database systems respectively. The agent finds the concept “145” on one of the
present ontologies. On a first glance and without any further information, it is almost impossible
even for a domain expert in the field to tell what kind of relation this concept could have within
the correspondent concept in the second ontology. The analogy is identical when a traveller in
transit does not speak the same language as the locals. In this case, verbal expression has to be
done by a translator.
To avoid such interoperability break, the author has constructed an ontological model
representation that helps the categorization of the income enterprise information.
Eventually, M1 receives a satisfactory blueprint and start the production phase. At this
stage, M1 has to contact his manufacture suppliers S1 to produce each single chair component.
This could be worse if a single supplier contacts its own network of suppliers, raising the
network complexity exponentially.
At the end of the production phase, M1 needs to evaluate the best option according to
quantity, quality and costs. In a final phase, M1 remotely monitors the production progress for
Page 74
5. Proof-of-Concept Implementation
56
each component. The final delay can raise fair behind the deadline if the assembly line stops
operating due to a line error leading one of the M1‘s supplier productions to temporally stay
stationary.
Implemented steps 5.6
Chapter 5 started with the description of the involved technologies and the proposed semantic
mapping tool that intends to facilitate the establishment of new dynamic manufacturing network
configuration. The present Section aims to describe the implementation steps of the proposed
framework architecture illustrated in Figure 5.3.
In response to a client HTTP request, the first step the preparations of the reference and legacy
resources to be sent into the mapping tool. The tool also checks in this phase, for possible
remaining enterprise’s resources that have not been yet mapped and aligned with at least, one of
the reference categories. The second phase refers to the control, management and layout of the
received information in the mapping portlet.
Lastly, phase three implements the knowledge reception of the mapped resources to be stored
in the support database and it waits for the completion of all categories resources alignment. The
Figure 5.8 - Furniture production operations diagram (Source: [38])
Page 75
5. Proof-of-Concept Implementation
57
mapping lifecycle is endless, which means that the process re-starts every time the last phase
comes to an end and originating the beginning of a new cycle, as shown in Figure 5.9.
5.6.1 Step 1 – Management and Monitoring of Mappings & Resources
To accomplish total control of the received data, the server should prepare itself its own
information before the resources are sent back to the client in a HTTP (Hypertext Transfer
Protocol) message. Therefore the following sub processes are presented.
The semantic alignment could be a demanding and fatiguing task if it is not correctly designed.
The proposed mapping tool implements some mechanisms to minimize mapping establishment
time consumption. To accomplish such behaviour, the knowledge preparations phase is divided
in four sub process steps where which one has a specific and well-defined and distinct task
during the server side runtimes. At the end of this phase, the tool “concats” all information
involved in a String object class and writes it in the HTML (HyperText Markup Language)
body.
a) Load Mapping Information
The mapping tool must have a self-checking mechanism, which determines and indicates if a
determined enterprise resource was already mapped with a reference category. This was
possible by viewing how much resources have already been mapped including, its names, its
tree paths and IMAGINE’s Ids. The mechanism will allow the tool to control and say if a
specific required resource is mapped with its reference. In this way, the tool avoids at the same
time, the repeated alignments and reduces the induced hand process mapping fatigue. The
Figure 5.10 shows the mapping information diagram.
Phase 1
Phase 2 Phase 3
Figure 5.9 - Mapping tool architecture lifecycle
Page 76
5. Proof-of-Concept Implementation
58
b) Last Mapping Establishment
The server looks for the previous mapped resource and sends its information to the clients’ side.
This allows the tools to put the last mapped information in portlet in order to facilitate the
mapping process and once again reducing the unwanted repetitive action in which leads users to
select one enterprise and its correspondent category, every time the portlet process in the client
web browser.
c) Load Enterprise Resources
The mapping tool can access and collect its own information, including the enterprise Vat
Number, name and a list of resources, as were mentioned previously in Section 5.3.2.
The load enterprise resources counts the number of successful enterprise registered entries in the
support database and sees one by one the following information:
The type resource category registered (Material, Process and Equipment)
The number of resources already mapped for a single category
Count down
VatNumbers
EndCount >0
Material
elements>0
Process
elements>0
Equipment
elements>0
Connecting
information
Connecting
information
Connecting
information
no
yes
no
no
no
yes
yes
yes
Figure 5.10 - Load mapping information diagram
Page 77
5. Proof-of-Concept Implementation
59
It counts the un-mapped resources
The description of each resource
Each IMAGINE resource identifier
Finally it puts all the collected data into a tree java object which enable an easy manipulation
and extraction of the acquired information, as illustrated in Figure 5.11.
d) Reference Retrieval
The reference retrieval is one of the most important sub phases of the Management and
Monitoring of Mappings & Resources phase of the mapping tool lifecycle once it reads, extracts
the ontology reference knowledge into the portlet interface. To accomplish such task, the tool
uses the Protégé API to correctly get the wanted classes into a Tree Java object. As it was
previously mentioned in Section 5.4.2, only three categories will be used in the alignment
process. Thus, to help the acquisition of the desired data, the tool searchers a specific class by
name, it reads the siblings and its own child’s until a non-isRefenrece class is reached.
5.6.2 Step 2 - Client side Control
In a general perspective, the Client side phase manages and allows users to semantically
alignment each enterprise resource with a possible correspondence within the reference
Generic Comapny
Material
(ResourceName, descriptionResource, ImagineId)
Process
(...)
(ResourceName, descriptionResource, ImagineId)
(...)
Equipment
(ResourceName, descriptionResource, ImagineId)
(...)
Figure 5.11 - An example of the developed tree object
Page 78
5. Proof-of-Concept Implementation
60
ontology. To implement this, the tool reads the incoming HTTP information (sent during the
last phase), constructs and publishes the information on the portlet interface. It also implements
a checking functionally to block the undesired Root node to be mapped with other valid
resource. The Root node only acts as a father node to support tree construction, thus it should
not be considered as a future candidate for mapping establishment. Moreover, the portlet
manages and testes if a specific category’s enterprise has all resources mapped, thereby
allowing their resources to be sent to the platform by SOAP connection. This connection will be
further explained in the third implemented step.
5.6.3 Step 3 – Mapping update & submission
The Mapping update & submission phase starts when a user submits an alignment in the portlet
interface, returning the information back to the server side. Depending on the type of the
requested URL, the portlet will temporarily save the mapped information or it will get all
semantic alignments to be sent to the platform through a SOAP message. In this case, if a
successful connection is established, then the system will erase all information, since an expert
manager already mapped all the data previously.
On the other hand, if the system detects a remaining category to be mapped, it triggers a Java
Database Connection to store a new alignment or update an existent resource.
The phase ends by returning to portlet its first state, re-starting once again a new cycle and
thereby allowing users to map more resources.
Page 79
6. Mapping Tool Demonstration
61
6 Mapping Tool Demonstration
Mapping Tool Demonstration
This chapter shows an example of to the semantic alignment methodology of a single enterprise
for the furniture domain knowledge and intents to demonstrate the framework introduced in
section 4.3 and feature results of the developed mapping tool based on the implemented steps,
which was implemented according to the architecture presented in Section 5.4.
Identified Challenges and Proposed Functionalities 6.1
As the name suggests, this section will describe the challenges and functionalities faced during
the development phase of the proposed mapping tool. In an overall perspective point of view,
each one of the topics concerns with compatibility with the adapter architecture is presented as
follows:
Successful enterprise registration: The portlet must have the capability to understand
and test if all companies have its Vat and ImagineId numbers null or empty. This could
lead to an inconsistency of the read information.
Category resource’s management: The tool must know which ones and how many
categories have successfully been mapped for a single enterprise. Consequently, it also
has to know the number of the remains resourses for both category and enterprise.
Last mapped resource: This is especially important once, it enables the portlet
recovery its last work state, thus minimizing the repetitive process of choosing a new
enterprise and category that a user may experience every time the tool loads the portlet
in the client side.
6
Page 80
6. Mapping Tool Demonstration
62
Reference categories: To be able to detect and present only the identified possible
reference categories tagged as isReference Boolean.
Avoid repeated data: The tool has to be able to identify all mapped categories and
subsequently enterprises by not rendering its information, thus avoiding unnecessary
data in the mapping tool.
Temporary mapped resources identification: To visually make known which
resources were previously mapped. This helps users to remember which resources
were semantically established.
Avoid duplicates: The tool must be able to detect a second mapping attempt for the
same resource, thus avoiding unnecessary duplicate information.
Semantic Alignment Demonstration 6.2
The identified challenges and proposed functionalities of the mapping tool were identified in the
last subsection. This section will demonstrate how the semantic alignment is achieved by
resorting the proposed mapping tool describe in Section 5.3.
Figure 6.3 shows the mapping tool interface of the Enterprises Data Categorization portlet. The
interface was designed to be as clean and friendly as possible and it is divided into two drop-
down menus, two tree sections, central control output information and two button description
boxes. The first thing a user has to do is, to select a register enterprise and consequently the
available category that has not yet been totally mapped. Thus, the information regarding the
legacy resources and the reference ontology of the selected enterprise and the correspondent
category are shown in the Taxonomy and Reference sections, respectively. To establish an
alignment between those resources, the user only has to select the desire concepts and confirm
its operations by clicking a submitting button. The management and monitoring; the client side
control and the mapping submission will be describe in the following four subsections.
Section 5.3.4 discussed the three management lifecycle phases of the implement tool. Since the
information control module has endless process, it will only be shown one example to
demonstrate the overall functionalities, since it is the client starting point, the demonstrations
start with the explanation of the clients’ module control.
Page 81
6. Mapping Tool Demonstration
63
6.2.1 Client side Control Demonstration
The portlet must be able to control the enterprise and the category menus. The menu is designed
to only show valid category among the registered enterprises, thus both menus are implemented
in a two level selection chain. The portlet will show the referred information only if both menus
have a valid and not empty option selected. Figure 6.2 (a) illustrates an empty selection menu
waiting for a user to choose an available enterprise and (b) the correspondent associated
category.
Figure 6.1 - Enterprises Data Categorization portlet
Figure 6.2 - Enterprise and category selection (a) without enterprise; (b) with enterprise
selected
a) b)
Page 82
6. Mapping Tool Demonstration
64
After the user makes its choice, the Enterprise Data categorization portlet will show the
correspondent information in tree form. Since the Product category is merged with the Material,
therefore the reference information regarding both concepts are attracted in the same Tree,
located in Material category. Figure 6.5, shows the taxonomy of the Material resources for the
Seating Design enterprise, where it is also possible to see the presence of the both, material and
Product trees.
The portlet implements on-click events that enable, for instance, users to select a tree node to be
marketed as a future correspondence on the semantic alignment operation.
Figure 6.3 - Seating Design Material resources and the material refrence tree
Figure 6.4 - Selection of a new mapping establishment (a) selected invalid node; (b) a
valid correspondence
a) b)
Page 83
6. Mapping Tool Demonstration
65
Therefore, the developed portlet implements messages to alert the user that it is committing an
invalid or non-support operation. Figure 6.4 shows the selection process to enable new mapping
establishment, where (a) shows the error message result by the selection of the Root node in the
taxonomy tree; (b) illustrates a success message indicating that the user has established a valid
correspondence. The Figure 6.4 (b) also shows the match between the concept Wood (which is
described as Oakwood) and the reference concept Oakwood. When available, the concept’s
description helps the user to characterize the concept, thus help it to find the best accordant
correspondence. Further, the mapping tool also indicates if the concept is pressed by checking
the selected tree node. Both taxonomy and Reference Trees auto-scroll themselves to facilitate
tree manipulation. Finally, the information is stored temporarily in the support database if the
button Save is pressed, or even return the portlet state (illustrates in Figure 6.5) if the button
Cancel is pressed.
6.2.2 Temporary Stored Mapping Demonstration
Due to the previous mapping described in the last Subsection, the resulted alignment is stored
temporarily in the mapping table, as it can be seen in Figure 6.5.
Figure 6.5 - The stored data in the mapping table (mySQL Workbench screenshot)
The table stores the enterprise resource named taxTree, the reference resource known as
refTree, the submission data, the descriptions of both concepts, their tree paths, the enterprise
VatNumber, the chosen company Category and the IMAGINE resource identifier.
6.2.3 Mapping update and Management Mappings Demonstration
It is possible to update the last resource and therefore change the content of the previously
temporary mapping establishment. The user has to select the enterprise resource concept and
change its correspondence with another reference concept. The Figure 6.6, show the previously
mapped Wood concept with the reference OtherWood concept.
Once again the user needs to select the desired concepts and press the Update button to submit
the new information into de database.
Page 84
6. Mapping Tool Demonstration
66
At this stage the concept already has the new correspondent concept, as it can be seen in Figure
6.7.
Figure 6.7 - The updated data in the mapping table (mySQL Workbench screenshot)
It is possible to see the control functions of the server side control since its operations are
mirrored into the portlet interface. The portlet controls the number of the mapping
establishments that already took place during its information control lifecycle (as previously
discussed in Section 5.4.4) and consequently, its names and relations are also to be considered
during this management phase.
After a successful mapping establishment, the portlet indicates the user by identifying the
mapped node with a check mark. It also shows a message to tell what reference concept were
previously mapped and automatically expands the reference tree to its target node by clicking on
the mapped enterprises resource. The middle window also shows the present enterprise selected
resource, the present selected reference resource and the old reference selected recourse. Figure
6.8, illustrates such portlet control behaviour.
Figure 6.6 - Updating a mapped resource
Page 85
6. Mapping Tool Demonstration
67
The tool also alerts the user if only one concept it is selected, as it is illustrated in Figure 6.9,
where the concept Chair “waits” for its correspondent reference pair.
Figure 6.8 - The warning message to alert user to a
mapped concept
Figure 6.9 - Reference node to be selected
Page 86
6. Mapping Tool Demonstration
68
The portlet will show a message to notify the user that all available enterprise resources for a
specific category are completely mapped and are prepared to send the aligned information to the
platform, as it can be seen in Figure 6.10.
6.2.4 Mapping Submission Demonstration
The Submission process gets all mapped resources, encapsulate the information in SOAP
message and update the support database by removing the sent resources and marking the
Material concept as for the Seating Design enterprise as fully mapped category. The portlet no
longer shows the information regarding this category, since all resources were semantically
aligned with a defined reference and sent to the platform. The processes are illustrated in
Figures 6.11 and 6.12, respectively.
Figure 6.10 - Category resources submission
message
Page 87
6. Mapping Tool Demonstration
69
Hypothesis Validation 6.3
Regarding the research question presented in the beginning of this dissertation, it was verified
that it is possible to semantically align the data exchanged between enterprises legacy system
and systems databases by resorting to the guidelines provided by the proposed framework, thus
facilitating the establishment of a dynamic manufacturing network.
Figure 6.11 - The resulted SOAP message
Figure 6.12 - The Seating Design categories after the
Material resources submission
Page 88
6. Mapping Tool Demonstration
70
Industry Contribution 6.4
The transition to industry was one of the identified steps discussed in Section 1.2: Research
Methods. Thus, the chance to see the work being used in a real world scenario raises if it is well
accepted by the industry sectors.
IMAGINE (Innovative end-to-end Management of Dynamic Manufacturing Networks) is a
Research & Development project, funded by the European Commission under the “Virtual
Factories and Enterprises” theme of the 7th Framework Programme (FoF-ICT-2011.7.3, Grant
Agreement No: 285132). The project concerns with the
development and delivery of a novel comprehensive methodology and the
respective platform for effective end-to-end management of dynamic manufacturing
networks in an innovative plug and produce approach, and aims at supporting the
emergence of a powerful new production model, based on community,
collaboration, self-organisation and openness rather than on hierarchy and
centralised control. [76].
The initiative has a centralize system which in an autonomously way will facilitate an
eventual supply or production problems, by providing a production manager the capability to
monitor and track the production lifecycle of its joined manufacturing enterprises in the
Furniture sector [75].
This work contributes to the IMAGINE project by semantically align each future collaborative
enterprise domain knowledge (in the furniture sector) within a previously defined reference so
the information can be readable without heterogeneity inconsistencies during the design phase
of a new dynamic manufacturing network.
Page 89
7. Conclusions and Future Work
71
7 Conclusions and Future Work
Conclusions and Future Work
The traditional manufacturing process practiced by enterprises fulfilled all market expectations
and enabled them to achieve product competiveness. The growth of emerging technologies
raised the consumer’s expectations in how products are presented and produced. Consequently,
this fact lead enterprises to adopt new approaches by embracing new collaborative schemes that
inevitably changed the way how manufactures work and exchange knowledge under the same
network architecture. Therefore, it is expected semantic interoperability issues during the
establishment of a collaborative network, since each enterprise serenely have different
knowledge, for instance in how the products are produced or dispatched.
The knowledge exchanged should put together a central line communication in order to offer a
continuously and instant access to all available information existent in the network. Moreover, it
is also important to define an adequate knowledge management and representation mechanisms
to maximize knowledge sharing and acquisition.
The proposed framework was developed with the idea to provide specific information for
manufacturing solutions in various contexts or situations, allowing at the same time enterprises
to effectively assess if their ERP’s data with in the current domain knowledge representation.
Following pre-determined guidelines, defined in this work, it was possible to assess the
semantic alignment of the involved resources on the application scenario that comprises clients,
retailers and their suppliers. Furthermore, this framework can also be used for enterprises to
establish the mapping of their own ERPs before the definition and creation of a new Dynamic
Manufacturing Network. In conclusion, the proposed framework could prove to be a valuable
asset in helping, as a guideline, in the semantic alignment establishment of enterprise’s
knowledge domain.
7
Page 90
7. Conclusions and Future Work
72
Future Work 7.1
The main purpose behind the developed solution is to have seamless knowledge interoperability
between different representational systems, and in order to fulfil that goal all cases that can be
identified need to be implemented. Therefore, in terms of future work, more features of the
prototype tool can be implemented such as, the cases of 1-N mapping, supported with merged
operation and finally an integration with a mediator ontology for advanced reasoning solutions
implementation.
Page 91
8. Bibliography
73
8 Bibliography
Bibliography
[1] European Commission, “Unleashing Europe’s Entrepreneurial potential to bring back
growth,” Enterprise & Industry, p. 6, 2013.
[2] European Commission, “Main EU funding opportunities for SMEs,” Enterprise &
Industry, p. 4, 2012.
[3] “Factories of the Future PPP: towards competitive EU manufacturing.” European Union,
2013.
[4] L. M. Camarinha-Matos, “Scientific Research Methodologies and Techniques - Unit 2:
Scientific Method,” 2010.
[5] C. B. Lee W. B., Shek Vivien, “Auditing and Mapping theKnowledge Assets of
Business Processes - An Empirical Study,” in Knowledge Science, Engineering and
Management, Zhang Zili., Springer Berlin Heidelberg, 2007, pp. 11–16.
[6] W. Scholl, C. König, B. Meyer, and P. Heisig, “The future of knowledge management:
an international delphi study,” J. Knowl. Manag., vol. 8, no. 2, pp. 19–35, Jan. 2004.
[7] D. Y. Wang Yonggui, Wu Jiangning, Wang Zhongtuo, “Distributed Knowledge
Management Based on Ontological Engineering and Multi-Agent System Towards
Semantic Interoperation,” in Knowledge Science, Engineering and Management, S. J.
Zhang Zili, Ed. Springer Berlin Heidelberg, 2007, pp. 403–411.
[8] N. Papakostas, K. Efthymiou, K. Georgoulias, and G. Chryssolouris, “On the
configuration and planning of dynamic manufacturing networks,” Logist. Res., vol. 5,
no. 3–4, pp. 105–111, Sep. 2012.
[9] M. Bonifacio, P. Bouquet, and R. Cuel, “Knowledge nodes: the building blocks of a
distributed approach to knowledge management,” J. Univers. Comput. Sci., vol. 8, no. 6,
pp. 652–661, 2002.
8
Page 92
8. Bibliography
74
[10] J. Schmücker and W. Müller, “Praxiserfahrungen bei der Einführung dezentraler
Wissensmanagement-Lösungen,” Wirtschaftsinformatik, vol. 45, no. 3, pp. 307–311,
Jun. 2003.
[11] P. Trkman and K. C. Desouza, “Knowledge risks in organizational networks: An
exploratory framework,” J. Strateg. Inf. Syst., vol. 21, no. 1, pp. 1–17, Mar. 2012.
[12] “Ontologies - Introduction to ontologies and semantic web - tutorial.” [Online].
Available: http://www.obitko.com/tutorials/ontologies-semantic-web/ontologies.html.
[13] “Specification of Conceptualization - Introduction to ontologies and semantic web -
tutorial.” [Online]. Available: http://www.obitko.com/tutorials/ontologies-semantic-
web/specification-of-conceptualization.html.
[14] F. I. Amann Bernd, “Integrating Ontologies and Thesauri to Build RDF Schemas,” in
Research and Advanced Technology for Digital Libraries, V. A.-M. Abiteboul Serge,
Ed. Springer Berlin Heidelberg, 1999, pp. 234–253.
[15] T. R. Gruber, “Toward principles for the design of ontologies used for knowledge
sharing?,” Int. J. Hum. Comput. Stud., vol. 43, no. 5, pp. 907–928, 1995.
[16] G. van Heijst, S. Falasconi, A. Abu-Hanna, G. Schreiber, and M. Stefanelli, “A case
study in ontology library construction,” Artif. Intell. Med., vol. 7, no. 3, pp. 227–255,
Jun. 1995.
[17] N. Noy and D. McGuinness, “Ontology Development 101: A Guide to Creating Your
First Ontology,” Stanford.
[18] C. Franke, S. Morin, A. Chebotko, J. Abraham, and P. Brazier, “Efficient Processing of
Semantic Web Queries in HBase and MySQL Cluster,” IT Prof., vol. 15, no. 3, pp. 36–
43, May 2013.
[19] M. Uschold and M. Gruninger, “Ontologies and semantics for seamless connectivity,”
ACM SIGMOD Rec., vol. 33, no. 4, pp. 58–64, Dec. 2004.
[20] Oxford University Press, “Oxford Dictionaries - Operation definition,” 2014. [Online].
Available:
http://www.oxforddictionaries.com/definition/english/operation?q=+Operation.
[Accessed: 29-Sep-2014].
[21] N. Choi, I.-Y. Song, and H. Han, “A survey on ontology mapping,” ACM SIGMOD Rec.,
vol. 35, no. 3, pp. 34–41, Sep. 2006.
[22] T. Tudorache, J. Vendetti, and N. F. Noy, “Web-Protégé - Protégé going web,” Stanford.
[23] T. Tudorache, C. Nyulas, N. F. Noy, and M. a Musen, “WebProtégé: A Collaborative
Ontology Editor and Knowledge Acquisition Tool for the Web.,” Semant. Web, vol. 4,
no. 1, pp. 89–99, Jan. 2013.
Page 93
8. Bibliography
75
[24] S. Krivov, F. Villa, R. Williams, and X. Wu, “On Visualization of OWL Ontologies,” in
Semantic web, C. J. O. Baker and K.-H. Cheung, Eds. Boston, MA: Springer US, 2007,
pp. 205–221.
[25] “WebProtege Layout Configuration.” [Online]. Available:
http://protegewiki.stanford.edu/wiki/WebProtegeLayoutConfig. [Accessed: 09-May-
2014].
[26] semafora systems GmbH, “OntoStudio,” 2012. [Online]. Available:
http://www.semafora-systems.com/en/products/ontostudio/. [Accessed: 07-Sep-2014].
[27] D. Decraene, “OntologyOnline,” 2007. [Online]. Available: http://ontologyonline.org/.
[Accessed: 20-Sep-2014].
[28] A. Hasan, The Liferay Cookbook. MPower Global, 2013, pp. 21–68.
[29] Liferay, “Examples - TreeView,” 2014. [Online]. Available:
http://alloyui.com/examples/tree/real-world/. [Accessed: 21-Sep-2014].
[30] Institute of Mathematics and Computer Science, “OWLGrEd.” [Online]. Available:
http://owlgred.lumii.lv/online_visualization. [Accessed: 21-Sep-2014].
[31] J. H. Saltzer, D. P. Reed, and D. D. Clark, “End-to-end arguments in system design,”
ACM Trans. Comput. Syst., vol. 2, no. 4, pp. 277–288, Nov. 1984.
[32] S. KRÄTKE, “How manufacturing industries connect cities across the world: extending
research on ‘multiple globalizations,’” Glob. Networks, p. no–no, Jul. 2013.
[33] W. Jeong, S. Y. Nof, L. M. Camarinha-Matos, H. Afsarmanesh, N. Galeano, and A.
Molina, “Collaborative networked organizations – Concepts and practice in
manufacturing enterprises,” Comput. Ind. Eng., vol. 57, no. 1, pp. 46–60, 2009.
[34] IMAGINE Consortion, “Master: Introduction to Virtual Manufacturing Management &
IMAGINE Platform,” 2013. [Online]. Available: http://training.imagine-
futurefactory.eu/moodle/course/view.php?id=21. [Accessed: 03-Oct-2014].
[35] J. L. Vallés, Factories of the Future Multi-annual roadmap for the contractual PPP
under Horizon 2020. European Union, 2013.
[36] O. Markaki, D. Panopoulos, P. Kokkinakos, S. Koussouris, and D. Askounis, “Towards
Adopting Dynamic Manufacturing Networks for Future Manufacturing: Benefits and
Risks of the IMAGINE DMN End-to-End Management Methodology,” in 2013
Workshops on Enabling Technologies: Infrastructure for Collaborative Enterprises,
2013, pp. 305–310.
[37] J. Hallikas, I. Karvonen, U. Pulkkinen, V.-M. Virolainen, and M. Tuominen, “Risk
management processes in supplier networks,” Int. J. Prod. Econ., vol. 90, no. 1, pp. 47–
58, Jul. 2004.
[38] J. Ferreira, J. Sarraipa, C. Agostinho, F. Gigante, M. J. Nunez, and R. Jardim-Goncalves,
“Collaborative production using dynamic manufacturing networks for SME’s,” in 20th
Page 94
8. Bibliography
76
ICE - International Conference on Engineering, Technology and Innovation - IEEE
TMC Europe Conference, 2014, pp. 1–7.
[39] N. Papakostas, K. Georgoulias, and S. Koukas, “A novel platform for designing and
evaluating Dynamic Manufacturing Networks,” CIRP Ann. - Manuf. Technol., vol. 62,
no. 1, pp. 495–498, 2013.
[40] Q. Yang, W. Xiao, and J. Ren, “PRINS: Optimizing Performance of Reliable Internet
Storages,” in 26th IEEE International Conference on Distributed Computing Systems
(ICDCS’06), 2006, p. 32.
[41] W. Recomendation, “OWL Web Ontology Language Overview,” 10/02/2004. [Online].
Available: http://www.w3.org/TR/owl-features/. [Accessed: 06-Sep-2014].
[42] H. Jagdev, L. Vasiliu, J. Browne, and M. Zaremba, “A semantic web service
environment for B2B and B2C auction applications within extended and virtual
enterprises,” Comput. Ind., vol. 59, no. 8, pp. 786–797, Oct. 2008.
[43] D. Roman, U. Keller, H. Lausen, J. De Bruijn, R. Lara, S. Michael, A. Polleres, C. Feier,
C. Bussler, and D. Fensel, “Web Service Modeling Ontology,” Appl. Ontol., vol. 1, no.
Volume 1,Number 1/2005, pp. 77–106, 2005.
[44] S. Madnick and H. Zhu, “Improving data quality through effective use of data
semantics,” Data Knowl. Eng., vol. 59, no. 2, pp. 460–475, Nov. 2006.
[45] S. Ram, “Semantic conflict resolution ontology (SCROL): an ontology for detecting and
resolving data and schema-level semantic conflicts,” IEEE Trans. Knowl. Data Eng.,
vol. 16, no. 2, pp. 189–202, Feb. 2004.
[46] N. Arch-int and S. Arch-int, “Semantic Ontology Mapping for Interoperability of
Learning Resource Systems using a rule-based reasoning approach,” Expert Syst. Appl.,
vol. 40, no. 18, pp. 7428–7443, Dec. 2013.
[47] “Standards Glossary,” 2014. [Online]. Available:
http://www.ieee.org/education_careers/education/standards/standards_glossary.html.
[Accessed: 08-Oct-2014].
[48] P. Wegner, “Interoperability,” ACM Comput. Surv., vol. 28, no. 1, pp. 285–287, Mar.
1996.
[49] F. B. Vernadat, “Technical, semantic and organizational issues of enterprise
interoperability and networking,” Annu. Rev. Control, vol. 34, no. 1, pp. 139–144, Apr.
2010.
[50] J. Sarraipa, J. P. M. A. Silva, R. Jardim-Goncalves, and A. A. C. Monteiro, “MENTOR
— A methodology for enterprise reference ontology development,” in 2008 4th
International IEEE Conference Intelligent Systems, 2008, pp. 6–32–6–40.
[51] C. Agostinho, J. Sarraipa, D. Goncalves, and R. Jardim-, “Tuple-based semantic and
structural mapping for a sustainable interoperability,” in Doctoral Conference on
Computing, Electrical and Industrial Systems, 2011.
Page 95
8. Bibliography
77
[52] N. F. Noy and M. A. Musen, “PROMPT: algorithm and tool for automated ontology
merging and alignment,” in Proceedings of the Seventeenth National Conference on
Artificial Intelligence and Twelfth Conference on Innovative Applications of Artificial
Intelligence, 2000.
[53] D. Aumueller, H.-H. Do, S. Massmann, and E. Rahm, “Schema and ontology matching
with COMA++,” in Proceedings of the 2005 ACM SIGMOD international conference on
Management of data - SIGMOD ’05, 2005, p. 906.
[54] J. JUNG, “Taxonomy alignment for interoperability between heterogeneous virtual
organizations,” Expert Syst. Appl., vol. 34, no. 4, pp. 2721–2731, May 2008.
[55] Y. Jiang, X. Wang, and H. Zheng, “A semantic similarity measure based on information
distance for ontology alignment,” Inf. Sci. (Ny)., vol. 278, pp. 76–87, Sep. 2014.
[56] Y. Kalfoglou and M. Schorlemmer, “IF-Map : An Ontology-Mapping Method Based on
Information-Flow Theory,” J. Data Semant. I, pp. 98–127, 2003.
[57] W. E. Djeddi and M. T. Khadir, “XMAP: A novel structural approach for alignment of
OWL-Full ontologies,” in 2010 International Conference on Machine and Web
Intelligence, 2010, pp. 368–373.
[58] Y. R. Jean-Mary, E. P. Shironoshita, and M. R. Kabuka, “Ontology Matching with
Semantic Verification.,” Web Semant., vol. 7, no. 3, pp. 235–251, Sep. 2009.
[59] B. Fu, R. Brennan, and D. O’Sullivan, “A configurable translation-based cross-lingual
ontology mapping system to adjust mapping outcomes,” Web Semant. Sci. Serv. Agents
World Wide Web, vol. 15, pp. 15–36, Sep. 2012.
[60] Java Portlet Specifications, JSR 286, 2008.
[61] Java Specification Requests, JSR 168, 2003.
[62] A. Sarin, Portlets in Action. Manning Publications CO, 2011, p. 640.
[63] Oracle, “JavaServer Pages Overview.” [Online]. Available:
http://www.oracle.com/technetwork/java/overview-138580.html. [Accessed: 10-Sep-
2014].
[64] Oracle, “About MySQL,” 2014. [Online]. Available: http://www.mysql.com/about/.
[Accessed: 21-Sep-2014].
[65] “Reference Architecture Foundation for Service Oriented Architecture Version 1.0,”
OASIS, 2012. [Online]. Available: http://docs.oasis-open.org/soa-rm/soa-
ra/v1.0/cs01/soa-ra-v1.0-cs01.html#_ftn1. [Accessed: 13-Sep-2014].
[66] “Web Services Glossary,” W3C, 2004. [Online]. Available:
http://www.w3.org/TR/2004/NOTE-ws-gloss-20040211/#webservice. [Accessed: 13-
Sep-2014].
Page 96
8. Bibliography
78
[67] C.-M. Chituc, “Interoperability in Collaborative Networks: A Frame Proposal,”
University of Porto, 2008.
[68] A. Tanenbaum and D. Wetherall, Computer Networks. Pearson, 2011.
[69] S. Saad, H. Zgaya, and S. Hammadi, “Using an ontology to solve the negotiation
problems in mobile agent information system,” in 2008 IEEE International Conference
on Systems, Man and Cybernetics, 2008, pp. 3685–3690.
[70] M. Atencia and M. Schorlemmer, “I-SSA: Interaction-Situated Semantic Alignment,” in
On the Move to Meaningful Internet Systems: OTM 2008, vol. 5331, R. Meersman and
Z. Tari, Eds. Berlin, Heidelberg: Springer Berlin Heidelberg, 2008, pp. 445–455.
[71] M. Atencia and M. Schorlemmer, “An interaction-based approach to semantic
alignment,” Web Semant. Sci. Serv. Agents World Wide Web, vol. 12–13, pp. 131–147,
Apr. 2012.
[72] IMAGINE Consortion, “IMAGINE: End to End management of manufacturing
networks.” 2014.
[73] P. Shvaiko and J. Euzenat, “Ontology Matching: State of the Art and Future
Challenges,” IEEE Trans. Knowl. Data Eng., vol. 25, no. 1, pp. 158–176, Jan. 2013.
[74] S. Nagasawa, “Marketability of Long Life Products,” in 4th International Symposium on
Environmentally Conscious Design and Inverse Manufacturing, 2005, pp. 30–37.
[75] “IMAGINE Project: Furniture Manufacturing Living Lab.” [Online]. Available:
http://news.imagine-futurefactory.eu/articles/furniture-manufacturing-living-
lab/5000000000139487. [Accessed: 08-May-2014].
[76] “IMAGINE Project: Innovative End-to-end Management of Dynamic Manufacturing
Networks. Description of Work.” [Online]. Available: http://www.imagine-
futurefactory.eu. [Accessed: 08-May-2014].
Page 97
9. Appendix
79
9 Appendix
Appendix
TreeMap MVCPortlet super constructor 9.1
@SuppressWarnings({ "null", "rawtypes" })
public void doView(RenderRequest renderRequest, RenderResponse
renderResponse)
throws IOException, PortletException {
String initializations =loadPortletSettings();
String mapping_info_tabel= loadMappingInfo();
renderRequest.setAttribute("last_mapping_establ",getLastMappingE
stablishment());
renderRequest.setAttribute("portlet_content",initializations);
renderRequest.setAttribute("mapping_info",mapping_info_tabel);
renderRequest.setAttribute("string_tree_material",getReferenceTr
eebyConcept("Material"));
renderRequest.setAttribute("string_tree_product",getReferenceTre
ebyConcept("Product"));
renderRequest.setAttribute("string_tree_process",getReferenceTre
ebyConcept("Process"));
renderRequest.setAttribute("string_tree_equipment",getReferenceT
reebyConcept("Equipment"));
super.doView(renderRequest, renderResponse);
}
9