Frank Cowell: rank Cowell: TU Lisbon – Inequality & Poverty TU Lisbon – Inequality & Poverty Income Distribution and Welfare July July 2006 2006 Inequality and Poverty Measurement Inequality and Poverty Measurement Technical University of Lisbon Technical University of Lisbon Frank Cowell Frank Cowell http://darp.lse.ac.uk/lisbon2006 http://darp.lse.ac.uk/lisbon2006
Transcript
Frank C
owell:
Frank C
owell: T
U L
isbon – Inequality & P
overty T
U L
isbon – Inequality & P
overty
Income Distribution and Welfare
July 2006 July 2006
Inequality and Poverty Measurement Inequality and Poverty Measurement
Technical University of LisbonTechnical University of Lisbon
Frank CowellFrank Cowellhttp://darp.lse.ac.uk/lisbon2006http://darp.lse.ac.uk/lisbon2006
Frank C
owell:
Frank C
owell: T
U L
isbon – Inequality & P
overty T
U L
isbon – Inequality & P
overty
Onwards from welfare economics...
We’ve seen the welfare-economics basis for redistribution as We’ve seen the welfare-economics basis for redistribution as a public-policy objectivea public-policy objective
How to assess the impact and effectiveness of such policy?How to assess the impact and effectiveness of such policy?
We need appropriate criteria for comparing distributions of We need appropriate criteria for comparing distributions of income and personal welfareincome and personal welfare
This requires a treatment of issues in distributional analysis.This requires a treatment of issues in distributional analysis.
Frank C
owell:
Frank C
owell: T
U L
isbon – Inequality & P
overty T
U L
isbon – Inequality & P
overty
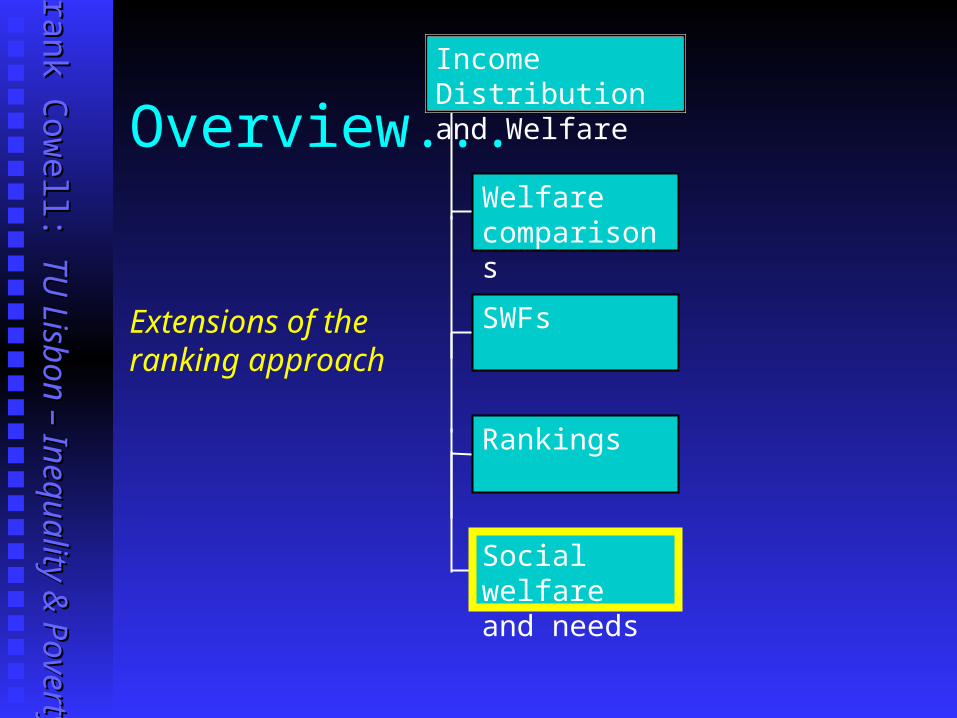
Overview...Welfare comparisons
SWFs
Rankings
Social welfare and needs
Income Distribution and Welfare
How to represent problems in distributionalanalysis
•Income distributions•Comparisons
Frank C
owell:
Frank C
owell: T
U L
isbon – Inequality & P
overty T
U L
isbon – Inequality & P
overty
Representing a distribution
Irene and JanetIrene and Janet
The The FF-form-form
particularly appropriate in approaches to the subject based primarily upon individualistic welfare criteria
Recall our two standard approaches:
especially useful in cases where it is appropriate to adopt a parametric model of income distribution
Frank C
owell:
Frank C
owell: T
U L
isbon – Inequality & P
overty T
U L
isbon – Inequality & P
overty
x
0.2 0.8 10
x0.8
q
"in
com
e" (
hei
ght)
proportion of the population
x0.2
Pen’s parade (Pen, 1971)
Now for some formalisation:
Now for some formalisation:
Plot income against proportion of population
Parade in ascending order of "income" / height
Frank C
owell:
Frank C
owell: T
U L
isbon – Inequality & P
overty T
U L
isbon – Inequality & P
overty 0
1
x
F(x)
x0
F(x0)
A distribution function
Frank C
owell:
Frank C
owell: T
U L
isbon – Inequality & P
overty T
U L
isbon – Inequality & P
overty
The set of distributions
We can imagine a typical distribution as belonging to some class F F
How should members of F be described or compared? Sets of distributions are, in principle complicated entities We need some fundamental principles
Frank C
owell:
Frank C
owell: T
U L
isbon – Inequality & P
overty T
U L
isbon – Inequality & P
overty
Overview...Welfare comparisons
SWFs
Rankings
Social welfare and needs
Income Distribution and Welfare
Methods and criteria of distributional analysis
•Income distributions•Comparisons
Frank C
owell:
Frank C
owell: T
U L
isbon – Inequality & P
overty T
U L
isbon – Inequality & P
overty
Comparing Income Distributions Consider the purpose of the comparison...Consider the purpose of the comparison...
……in this case to get a handle on the redistributive impact in this case to get a handle on the redistributive impact of government activity - taxes and benefits.of government activity - taxes and benefits.
This requires some concept of distributional “fairness” or This requires some concept of distributional “fairness” or “equity”.“equity”.
The ethical basis rests on some aspects of the last lecture…The ethical basis rests on some aspects of the last lecture…
……and the practical implementation requires an comparison and the practical implementation requires an comparison in terms of “inequality”.in terms of “inequality”.
Which is easy. Isn’t it?Which is easy. Isn’t it?
Frank C
owell:
Frank C
owell: T
U L
isbon – Inequality & P
overty T
U L
isbon – Inequality & P
overty
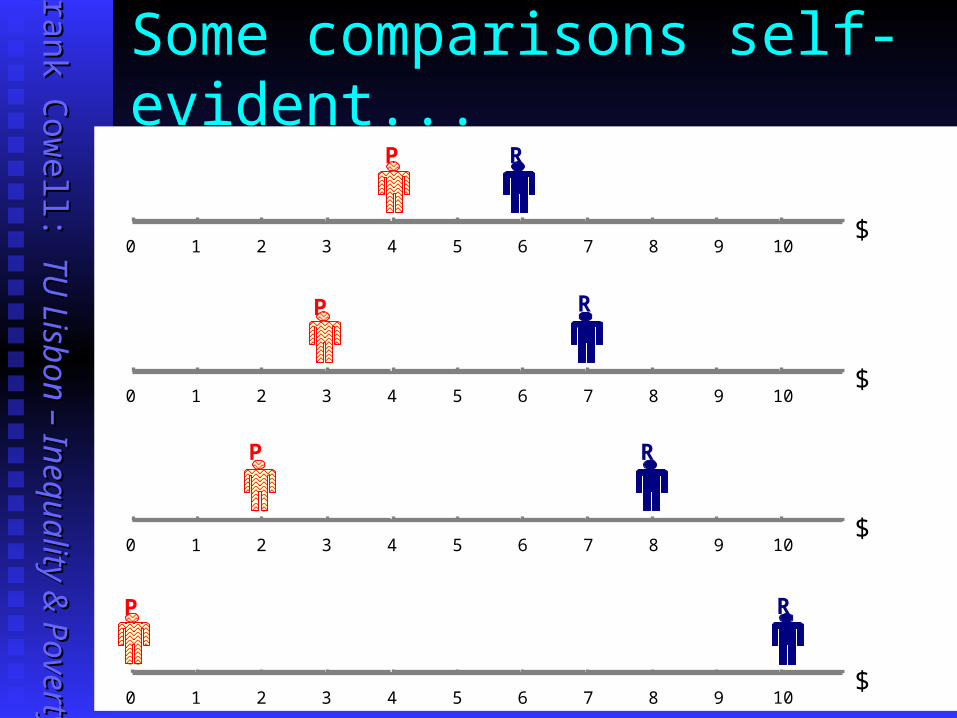
Some comparisons self-evident...
0 1 2 3 4 5 6 7 8 9 10$
P R
0 1 2 3 4 5 6 7 8 9 10$
P R
0 1 2 3 4 5 6 7 8 9 10$
P R
0 1 2 3 4 5 6 7 8 9 10$
RP
Frank C
owell:
Frank C
owell: T
U L
isbon – Inequality & P
overty T
U L
isbon – Inequality & P
overty
A fundamental issue...
Can distributional orderings be modelled using the two-Can distributional orderings be modelled using the two-person paradigm?person paradigm?
If so then comparing distributions in terms of inequality If so then comparing distributions in terms of inequality will be almost trivial.will be almost trivial.
Same applies to other equity criteriaSame applies to other equity criteria
But, consider a simple example with three persons and But, consider a simple example with three persons and fixed incomesfixed incomes
Frank C
owell:
Frank C
owell: T
U L
isbon – Inequality & P
overty T
U L
isbon – Inequality & P
overty
The 3-Person problem:two types of income difference
0 1 2 3 4 5 6 7 8 9 10 11 12 13$
P Q R
Tuesday
0 1 2 3 4 5 6 7 8 9 10 11 12 13$
P Q RMonday
Which do you think is “better”? Top Sensitivity Bottom Sensitivity
Low inequality
High inequality
Low inequality
High inequality
Frank C
owell:
Frank C
owell: T
U L
isbon – Inequality & P
overty T
U L
isbon – Inequality & P
overty
Distributional Orderings and Rankings
Arcadia
Borduria
Ruritania
more welfare
less welfare
Syldavia
In an ordering we unambiguously arrange distributions
But a ranking may include distributions that cannot be ordered
{Syldavia, Arcadia, Borduria} is an ordering.
{Syldavia, Ruritania, Borduria} is also an ordering.
But the ranking {Syldavia, Arcadia, Ruritania, Borduria} is not an ordering.
Frank C
owell:
Frank C
owell: T
U L
isbon – Inequality & P
overty T
U L
isbon – Inequality & P
overty
Comparing income distributions - 2 Distributional comparisons are more complex when more Distributional comparisons are more complex when more
than two individuals are involved.than two individuals are involved. P-Q and Q-R gaps importantP-Q and Q-R gaps important
To make progress we need an axiomatic approach.To make progress we need an axiomatic approach. Make precise “one distribution is better than another”Make precise “one distribution is better than another”
Axioms could be rooted in welfare economicsAxioms could be rooted in welfare economics There are other logical bases.There are other logical bases.
Apply the approach to general ranking principlesApply the approach to general ranking principles Lorenz comparisonsLorenz comparisons Social-welfare rankingsSocial-welfare rankings
Also to specific indicesAlso to specific indices Welfare functionsWelfare functions Inequality measuresInequality measures
Frank C
owell:
Frank C
owell: T
U L
isbon – Inequality & P
overty T
U L
isbon – Inequality & P
overty
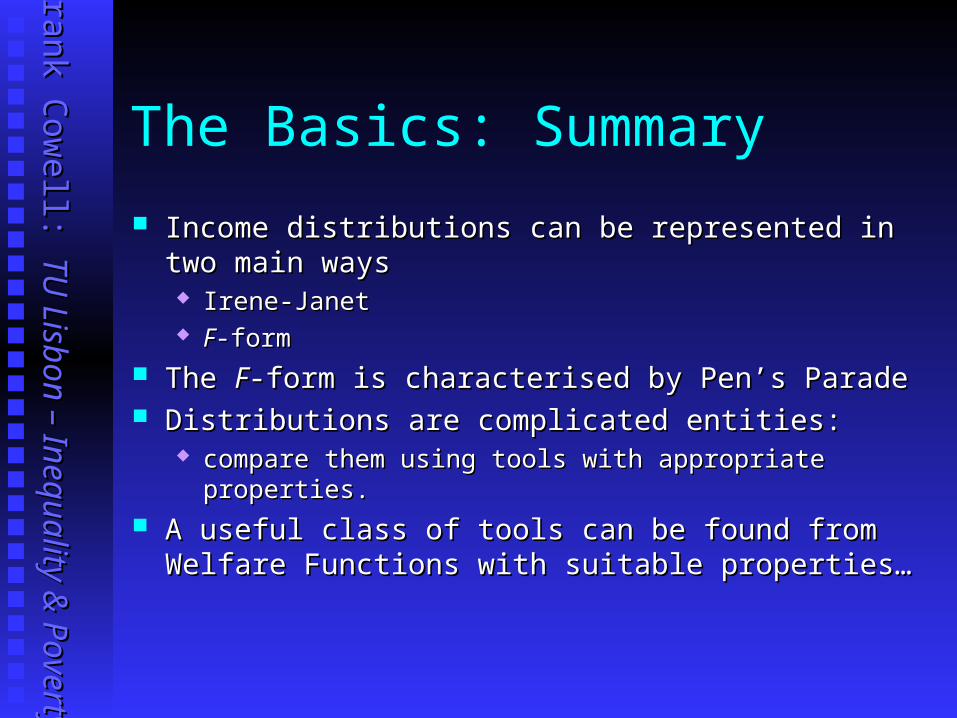
The Basics: Summary
Income distributions can be represented in two main ways Income distributions can be represented in two main ways Irene-Janet Irene-Janet FF-form-form
The The FF-form is characterised by Pen’s Parade-form is characterised by Pen’s Parade Distributions are complicated entities: Distributions are complicated entities:
compare them using tools with appropriate properties.compare them using tools with appropriate properties. A useful class of tools can be found from Welfare A useful class of tools can be found from Welfare
Functions with suitable properties…Functions with suitable properties…
Frank C
owell:
Frank C
owell: T
U L
isbon – Inequality & P
overty T
U L
isbon – Inequality & P
overty
Overview...Welfare comparisons
SWFs
Rankings
Social welfare and needs
Income Distribution and Welfare
How to incorporate fundamental principles
•Axiomatic structure•Classes•Values
Frank C
owell:
Frank C
owell: T
U L
isbon – Inequality & P
overty T
U L
isbon – Inequality & P
overty
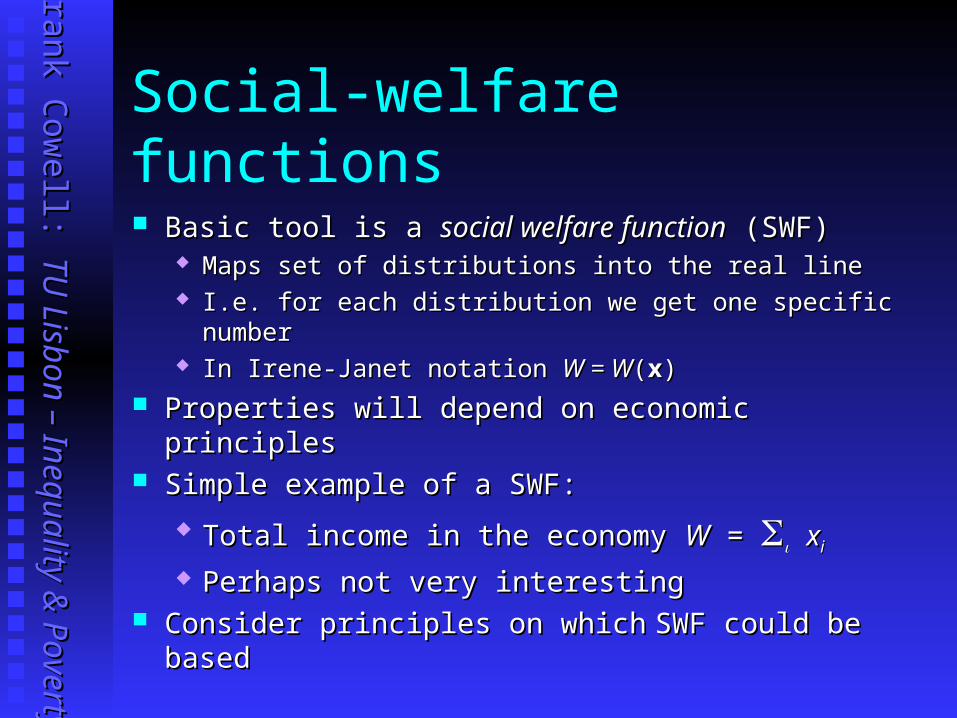
Social-welfare functions
Basic tool is a Basic tool is a social welfare functionsocial welfare function (SWF) (SWF) Maps set of distributions into the real lineMaps set of distributions into the real line I.e. for each distribution we get one specific numberI.e. for each distribution we get one specific number In Irene-Janet notation In Irene-Janet notation W = WW = W((xx))
Properties will depend on economic principlesProperties will depend on economic principles Simple example of a SWF:Simple example of a SWF:
Total income in the economy Total income in the economy WW = = xxii
Perhaps not very interestingPerhaps not very interesting Consider principles on whichConsider principles on which SWF could be basedSWF could be based
Frank C
owell:
Frank C
owell: T
U L
isbon – Inequality & P
overty T
U L
isbon – Inequality & P
overty
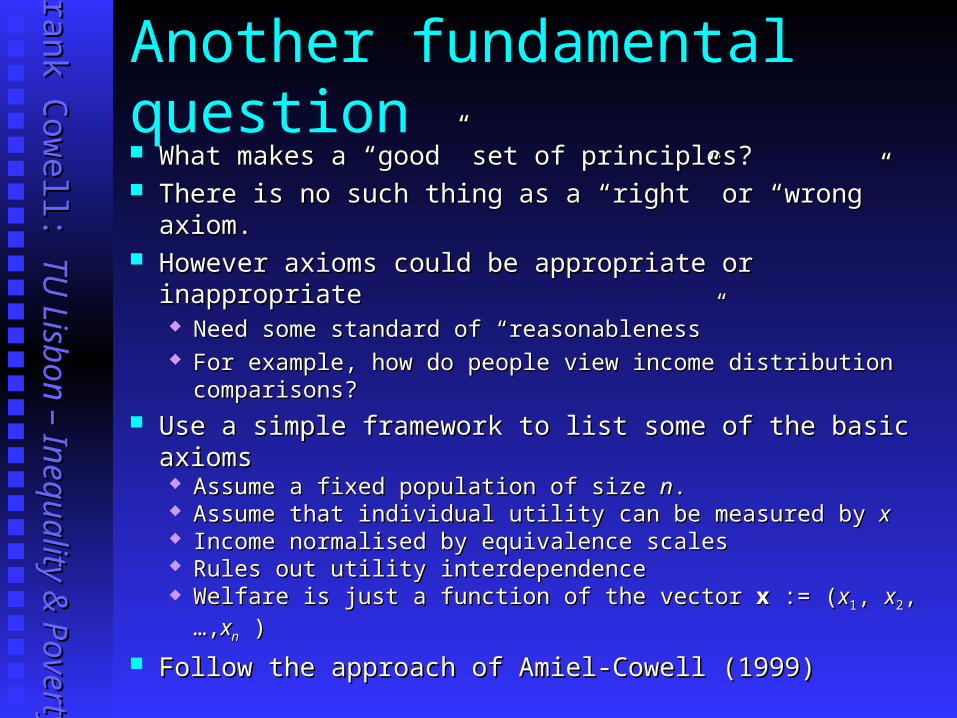
Another fundamental question What makes a “good” set of principles?What makes a “good” set of principles? There is no such thing as a “right” or “wrong” axiom.There is no such thing as a “right” or “wrong” axiom. However axioms could be appropriate or inappropriateHowever axioms could be appropriate or inappropriate
Need some standard of “reasonableness”Need some standard of “reasonableness” For example, how do people view income distribution For example, how do people view income distribution
comparisons?comparisons? Use a simple framework to list some of the basic axiomsUse a simple framework to list some of the basic axioms
Assume a fixed population of size Assume a fixed population of size nn.. Assume that individual utility can be measured by Assume that individual utility can be measured by xx Income normalised by equivalence scalesIncome normalised by equivalence scales Rules out utility interdependenceRules out utility interdependence Welfare is just a function of the vector Welfare is just a function of the vector xx := ( := (xx11, , xx22,…,,…,xxnn ) )
Follow the approach of Amiel-Cowell (1999)Follow the approach of Amiel-Cowell (1999)
Frank C
owell:
Frank C
owell: T
U L
isbon – Inequality & P
overty T
U L
isbon – Inequality & P
overty
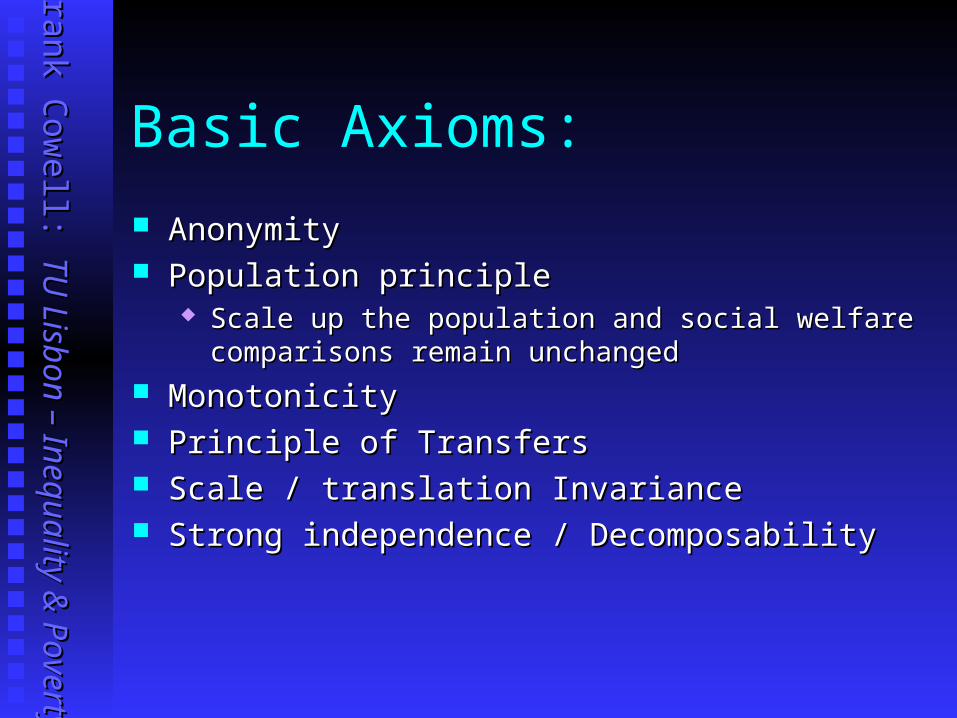
Basic Axioms:
AnonymityAnonymity Population principlePopulation principle MonotonicityMonotonicity Principle of TransfersPrinciple of Transfers Scale / translation InvarianceScale / translation Invariance Strong independence / DecomposabilityStrong independence / Decomposability
Frank C
owell:
Frank C
owell: T
U L
isbon – Inequality & P
overty T
U L
isbon – Inequality & P
overty
Basic Axioms:
AnonymityAnonymity Permute the individuals and social welfare does not changePermute the individuals and social welfare does not change
Population principlePopulation principle MonotonicityMonotonicity Principle of TransfersPrinciple of Transfers Scale / translation InvarianceScale / translation Invariance Strong independence / DecomposabilityStrong independence / Decomposability
Frank C
owell:
Frank C
owell: T
U L
isbon – Inequality & P
overty T
U L
isbon – Inequality & P
overty
0 1 2 3 4 5 6 7 8 9 10 11 12 13$
x
0 1 2 3 4 5 6 7 8 9 10 11 12 13$
x'
Anonymity
W(x′) = W(x)
Frank C
owell:
Frank C
owell: T
U L
isbon – Inequality & P
overty T
U L
isbon – Inequality & P
overty
0 1 2 3 4 5 6 7 8 9 10 11 12 13
0 1 2 3 4 5 6 7 8 9 10 11 12 13
$
$
x
y
0 1 2 3 4 5 6 7 8 9 10 11 12 13$
x'
y'
Implication of anonymity
End state principle: xy is equivalent to x′y .
Frank C
owell:
Frank C
owell: T
U L
isbon – Inequality & P
overty T
U L
isbon – Inequality & P
overty
Basic Axioms:
AnonymityAnonymity Population principlePopulation principle
Scale up the population and social welfare comparisons remain Scale up the population and social welfare comparisons remain unchangedunchanged
MonotonicityMonotonicity Principle of TransfersPrinciple of Transfers Scale / translation InvarianceScale / translation Invariance Strong independence / DecomposabilityStrong independence / Decomposability
Frank C
owell:
Frank C
owell: T
U L
isbon – Inequality & P
overty T
U L
isbon – Inequality & P
overty
0 1 2 3 4 5 6 7 8 9 10$
0 1 2 3 4 5 6 7 8 9 10$
Population replication
W(x) W(y) W(x,x,…,x) W(y,y,…,y)
Frank C
owell:
Frank C
owell: T
U L
isbon – Inequality & P
overty T
U L
isbon – Inequality & P
overty
A change of notation?
Using the first two axiomsUsing the first two axioms AnonymityAnonymity Population principlePopulation principle
We can write welfare using We can write welfare using F F –form–form Just use information about distributionJust use information about distribution Sometimes useful for descriptive purposesSometimes useful for descriptive purposes Remaining axioms can be expressed in either formRemaining axioms can be expressed in either form
Frank C
owell:
Frank C
owell: T
U L
isbon – Inequality & P
overty T
U L
isbon – Inequality & P
overty
Basic Axioms:
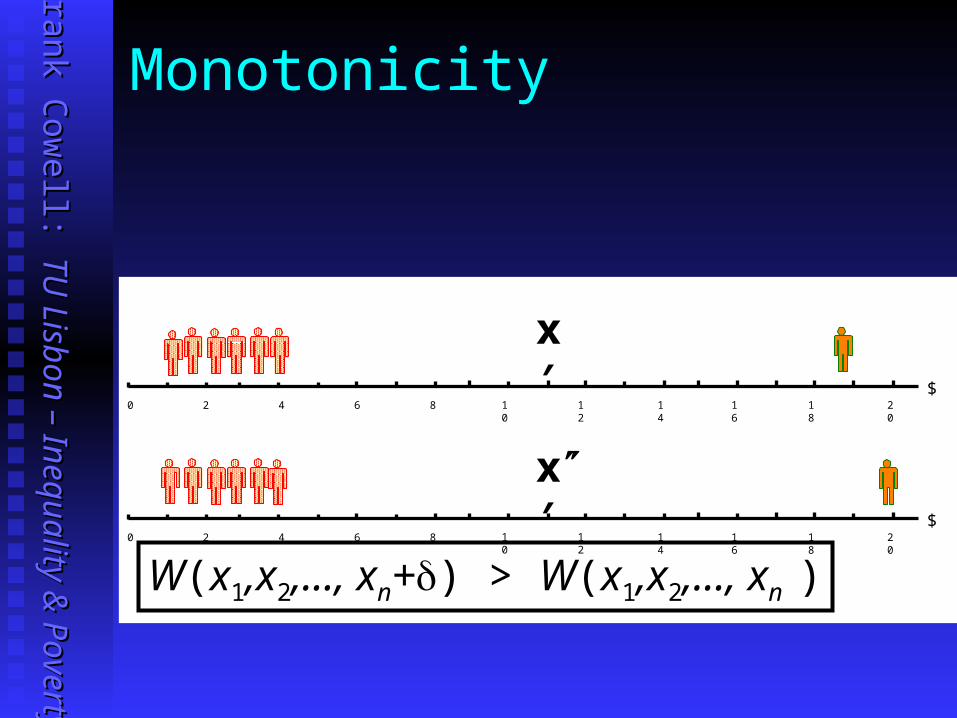
AnonymityAnonymity Population principlePopulation principle MonotonicityMonotonicity
Increase anyone’s income and social welfare increasesIncrease anyone’s income and social welfare increases Principle of TransfersPrinciple of Transfers Scale / translation InvarianceScale / translation Invariance Strong independence / DecomposabilityStrong independence / Decomposability
The Pigou (1912) approach:The Pigou (1912) approach: Focused on a 2-person worldFocused on a 2-person world A transfer from poor P to rich R must lower social welfareA transfer from poor P to rich R must lower social welfare
The The Dalton (1920) extension extension Extended to an Extended to an nn-person world-person world A transfer from (any) poorer A transfer from (any) poorer ii to (any) richer to (any) richer jj must must
lower social welfarelower social welfare
Although convenient, the extension is really quite Although convenient, the extension is really quite strong…strong…
Frank C
owell:
Frank C
owell: T
U L
isbon – Inequality & P
overty T
U L
isbon – Inequality & P
overty
Which group seems to have the more unequal distribution?
0 1 2 3 4 5 6 7 8 9 10 11 12 13
0 1 2 3 4 5 6 7 8 9 10 11 12 13
$
$
Frank C
owell:
Frank C
owell: T
U L
isbon – Inequality & P
overty T
U L
isbon – Inequality & P
overty
0 1 2 3 4 5 6 7 8 9 10 11 12 13
0 1 2 3 4 5 6 7 8 9 10 11 12 13
$
$
The issue viewed as two groups
Frank C
owell:
Frank C
owell: T
U L
isbon – Inequality & P
overty T
U L
isbon – Inequality & P
overty
Focus on just the affected persons
0 1 2 3 4 5 6 7 8 9 10 11 12 13
0 1 2 3 4 5 6 7 8 9 10 11 12 13
$
$
Frank C
owell:
Frank C
owell: T
U L
isbon – Inequality & P
overty T
U L
isbon – Inequality & P
overty
Basic Axioms:
AnonymityAnonymity Population principlePopulation principle MonotonicityMonotonicity Principle of TransfersPrinciple of Transfers Scale InvarianceScale Invariance
Rescaling incomes does not affect welfare comparisonsRescaling incomes does not affect welfare comparisons Strong independence / DecomposabilityStrong independence / Decomposability
Frank C
owell:
Frank C
owell: T
U L
isbon – Inequality & P
overty T
U L
isbon – Inequality & P
overty
Scale invariance (homotheticity)x
y
$0 5 10 15
$0 5 10 15
W(x) W(y) W(x) W(y)
x
$0 500 1000 1500
$0 500 1000 1500
y
Frank C
owell:
Frank C
owell: T
U L
isbon – Inequality & P
overty T
U L
isbon – Inequality & P
overty
Basic Axioms:
AnonymityAnonymity Population principlePopulation principle MonotonicityMonotonicity Principle of TransfersPrinciple of Transfers Translation InvarianceTranslation Invariance
Adding a constant to all incomes does not affect welfare Adding a constant to all incomes does not affect welfare comparisonscomparisons
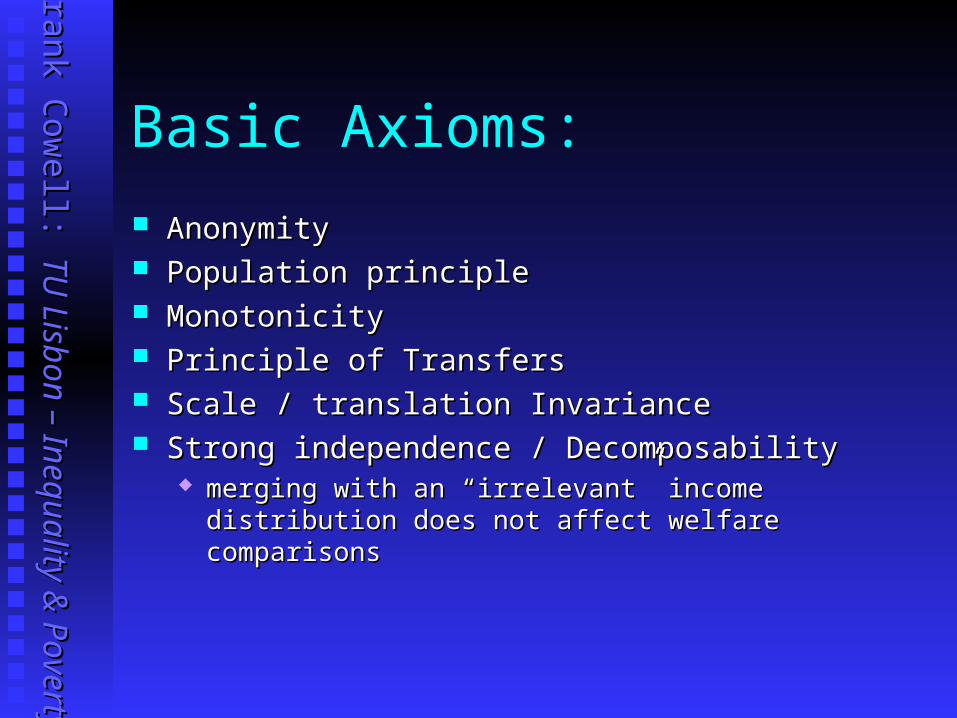
AnonymityAnonymity Population principlePopulation principle MonotonicityMonotonicity Principle of TransfersPrinciple of Transfers Scale / translation InvarianceScale / translation Invariance Strong independence / DecomposabilityStrong independence / Decomposability
merging with an “irrelevant” income distribution does not merging with an “irrelevant” income distribution does not affect welfare comparisonsaffect welfare comparisons
Frank C
owell:
Frank C
owell: T
U L
isbon – Inequality & P
overty T
U L
isbon – Inequality & P
overty
0 1 2 3 4 5 6 7 8 9 10 11 12 13
0 1 2 3 4 5 6 7 8 9 10 11 12 13
$
$
Before merger...
x
y
After merger...0 1 2 3 4 5 6 7 8 9 10 11 12 13
0 1 2 3 4 5 6 7 8 9 10 11 12 13
$
$
x'
y'
Decomposability / Independence
W(x) W(y) W(x') W(y')
Frank C
owell:
Frank C
owell: T
U L
isbon – Inequality & P
overty T
U L
isbon – Inequality & P
overty
Using axioms
Why the list of axioms?Why the list of axioms? We can use some, or all, of them to characterise particular We can use some, or all, of them to characterise particular
classes of SWFclasses of SWF More useful than picking individual functions More useful than picking individual functions WW ad hoc ad hoc
This then enables us to get fairly general results This then enables us to get fairly general results Depends on richness of the classDepends on richness of the class The more axioms we impose (perhaps) the less general the The more axioms we impose (perhaps) the less general the
resultresult This technique can be applied to other types of toolThis technique can be applied to other types of tool
Anonymity and population principle imply we can write SWF in either I-J form or F form Most modern approaches use these assumptions But you may need to standardise for needs etc
Introduce decomposability and you get class of Additive SWFs W : WW((xx)= )= u(xxii) or equivalently in F-form W(F) = u(x) dF(x)
The class W is of great importance Already seen this in lecture 2. But W excludes some well-known welfare criteria
Frank C
owell:
Frank C
owell: T
U L
isbon – Inequality & P
overty T
U L
isbon – Inequality & P
overty
Classes of SWFs (2)
From W we get important subclasses
If we impose monotonicity we get W1 W : u(•) increasing
If we further impose the transfer principle we get W2 W1: u(•) increasing and concave
We often need to use these special subclasses Illustrate their behaviour with a simple example…
Frank C
owell:
Frank C
owell: T
U L
isbon – Inequality & P
overty T
U L
isbon – Inequality & P
overty
The density function
x
f(x)
x0x1 x0
Income growth at x0
Welfare increases if WW1
A mean-preserving spread
Welfare decreases if WW2
Frank C
owell:
Frank C
owell: T
U L
isbon – Inequality & P
overty T
U L
isbon – Inequality & P
overty
An important family
Take the Take the W2 subclass and impose subclass and impose scale invariance. scale invariance. Get the family of SWFs where Get the family of SWFs where uu is iso-elastic: is iso-elastic:
xx1 – – 1 u(xx) = ————, 1 –
Same as that in lecture 2:Same as that in lecture 2: individual utility represented by individual utility represented by xx. . also same form as CRRA utility functionalso same form as CRRA utility function
Parameter Parameter captures society’s inequality aversion. captures society’s inequality aversion. Similar interpretation to individual risk aversionSimilar interpretation to individual risk aversion See See Atkinson (1970)
Frank C
owell:
Frank C
owell: T
U L
isbon – Inequality & P
overty T
U L
isbon – Inequality & P
overty
Another important family
Take the Take the W2 subclass and impose subclass and impose translation invariancetranslation invariance. .
Get the family of SWFs where Get the family of SWFs where uu is iso-elastic: is iso-elastic: 1 – e–xx
u(xx) = ——— Same form as CARA utility functionSame form as CARA utility function Parameter Parameter captures society’s absolute inequality aversion. captures society’s absolute inequality aversion.
Similar to individual absolute risk aversionSimilar to individual absolute risk aversion
Frank C
owell:
Frank C
owell: T
U L
isbon – Inequality & P
overty T
U L
isbon – Inequality & P
overty
Overview...Welfare comparisons
SWFs
Rankings
Social welfare and needs
Income Distribution and Welfare
…Can we deduce how inequality-averse “society” is?
•Axiomatic structure•Classes•Values
Frank C
owell:
Frank C
owell: T
U L
isbon – Inequality & P
overty T
U L
isbon – Inequality & P
overty
Values: the issues
In previous lecture we saw the problem of adducing social In previous lecture we saw the problem of adducing social values.values.
Here we will focus on two questions…Here we will focus on two questions… First: do people care about distribution?First: do people care about distribution?
Justify a motive for considering positive inequality aversionJustify a motive for considering positive inequality aversion Second: What is the shape of Second: What is the shape of uu??
What is the value of What is the value of ?? Examine survey data and other sourcesExamine survey data and other sources
Frank C
owell:
Frank C
owell: T
U L
isbon – Inequality & P
overty T
U L
isbon – Inequality & P
overty
Happiness and welfare?
Alesina et al (2004) Use data on happiness from social surveyUse data on happiness from social survey Construct a model of the determinants of happinessConstruct a model of the determinants of happiness Use this to see if income inequality makes a differenceUse this to see if income inequality makes a difference Seems to be a difference in priorities between US and Seems to be a difference in priorities between US and
EuropeEuropeUSUS Continental EuropeContinental Europe
Share of government in GDP Share of government in GDP 30% 30% 45%45%Share of transfers in GDP Share of transfers in GDP 11% 11% 18%18%
But does this reflect values?But does this reflect values? Do people in Europe care more about inequality?Do people in Europe care more about inequality?
Frank C
owell:
Frank C
owell: T
U L
isbon – Inequality & P
overty T
U L
isbon – Inequality & P
overty
The Alesina et al model
An ordered logitAn ordered logit ““Happy” is categorical; built from three (0,1) variables:Happy” is categorical; built from three (0,1) variables:
not too happynot too happy fairly happyfairly happy very happyvery happy
iindividual, ndividual, sstate, tate, ttime, ime, ggroup. roup. Macro variables include inflation, unemployment rateMacro variables include inflation, unemployment rate Micro variables include personal characteristicsMicro variables include personal characteristics are state, time dummiesare state, time dummies
Frank C
owell:
Frank C
owell: T
U L
isbon – Inequality & P
overty T
U L
isbon – Inequality & P
overty
The Alesina et al. results
People tend to declare lower happiness levels when People tend to declare lower happiness levels when inequality is high. inequality is high.
Strong negative effects of inequality on happiness of the Strong negative effects of inequality on happiness of the European poor and leftists. European poor and leftists.
No effects of inequality on happiness of US poor and the No effects of inequality on happiness of US poor and the left-wingers are not affected by inequalityleft-wingers are not affected by inequality
Negative effect of inequality on happiness of US richNegative effect of inequality on happiness of US rich No differences across the American right and the European No differences across the American right and the European
right. right. No differences between the American rich and the No differences between the American rich and the
European richEuropean rich
Frank C
owell:
Frank C
owell: T
U L
isbon – Inequality & P
overty T
U L
isbon – Inequality & P
overty
The shape of u: approaches
Direct estimates of inequality aversionDirect estimates of inequality aversion See Cowell-Gardiner (2000)See Cowell-Gardiner (2000) CarlssonCarlsson et al (2005) et al (2005)
Direct estimates of risk aversion Direct estimates of risk aversion Use as proxy for inequality aversionUse as proxy for inequality aversion Base this on Harsanyi arguments?Base this on Harsanyi arguments?
Indirect estimates of risk aversionIndirect estimates of risk aversion Indirect estimates of inequality aversionIndirect estimates of inequality aversion
From choices made by governmentFrom choices made by government (for later…)(for later…)
Frank C
owell:
Frank C
owell: T
U L
isbon – Inequality & P
overty T
U L
isbon – Inequality & P
overty
Direct evidence on risk aversion Barsky et al (1997) estimated relative risk-aversion from Barsky et al (1997) estimated relative risk-aversion from survey survey
evidenceevidence.. Note dependence on how well-off people are.Note dependence on how well-off people are.
Frank C
owell:
Frank C
owell: T
U L
isbon – Inequality & P
overty T
U L
isbon – Inequality & P
overty
Indirect evidence on risk aversion Blundell et al (1994) inferred relative risk-aversion from estimated Blundell et al (1994) inferred relative risk-aversion from estimated
parameter of savings using parameter of savings using expenditure dataexpenditure data.. Use two models: second version includes variables to capture Use two models: second version includes variables to capture
anticipated income growth.anticipated income growth. Again note dependence on how well-off people are.Again note dependence on how well-off people are.
Frank C
owell:
Frank C
owell: T
U L
isbon – Inequality & P
overty T
U L
isbon – Inequality & P
overty
SWFs: Summary
A small number of key axiomsA small number of key axioms Generate an important class of SWFs with useful Generate an important class of SWFs with useful
subclasses.subclasses. Need to make a decision on the form of the SWFNeed to make a decision on the form of the SWF
If we use the isoelastic model perhaps a value of around If we use the isoelastic model perhaps a value of around 1.5 – 2 is reasonable.1.5 – 2 is reasonable.
We pick up on the problem of comparing distributionsWe pick up on the problem of comparing distributions Two simple concepts based on elementary axiomsTwo simple concepts based on elementary axioms
AnonymityAnonymity Population principlePopulation principle MonotonicityMonotonicity Transfer principleTransfer principle
Illustrate these tools with a simple exampleIllustrate these tools with a simple example Use the Irene-Janet representation of the distributionUse the Irene-Janet representation of the distribution Fixed population (so we don’t need pop principle)Fixed population (so we don’t need pop principle)
Frank C
owell:
Frank C
owell: T
U L
isbon – Inequality & P
overty T
U L
isbon – Inequality & P
overty
0 2 4 6 8 10
12
14
16
18
20
0 2 4 6 8 10
12
14
16
18
x
y
20
$
$
First-order Dominance
y[1] > x[1], y[2] > x[2], y[3] > x[3]
Each ordered income in Each ordered income in yy larger than that in larger than that in xx..
Each cumulated income sum in Each cumulated income sum in yy larger than that in larger than that in xx..Weaker than first-order dominanceWeaker than first-order dominance
Frank C
owell:
Frank C
owell: T
U L
isbon – Inequality & P
overty T
U L
isbon – Inequality & P
overty
Social-welfare criteria and dominance Why are these concepts useful? Relate these dominance ideas to classes of SWF Recall the class of additive SWFs
W : W(F) = u(x) dF(x)
… and its important subclasses W1 W : u(•) increasing
W2 W1: u(•) increasing and concave
Now for the special relationship. We need to move on from the example by introducing
formal tools of distributional analysis.
Frank C
owell:
Frank C
owell: T
U L
isbon – Inequality & P
overty T
U L
isbon – Inequality & P
overty
1st-Order approach
The basic tool is the The basic tool is the quantilequantile. This can be . This can be expressed in general as the functionalexpressed in general as the functional
Use this to derive a number of intuitive concepts Interquartile range Decile-ratios Semi-decile ratios
The graph of The graph of QQ is Pen’s Parade is Pen’s Parade
Extend it to characterise the idea of dominance…Extend it to characterise the idea of dominance…
Frank C
owell:
Frank C
owell: T
U L
isbon – Inequality & P
overty T
U L
isbon – Inequality & P
overty
An important relationship
The idea of quantile (1The idea of quantile (1stst-order) dominance:-order) dominance:
G quantile-dominates FW(G) > W(F) for all WW1
A fundamental result:A fundamental result:
To illustrate, use Pen's paradeTo illustrate, use Pen's parade
G quantile-dominates Fmeans: for every q, Q(G;q) Q(F;q), for some q, Q(G;q) > Q(F;q)
Frank C
owell:
Frank C
owell: T
U L
isbon – Inequality & P
overty T
U L
isbon – Inequality & P
overty
First-order dominance
F
G
Q(.; q)
10 q
Frank C
owell:
Frank C
owell: T
U L
isbon – Inequality & P
overty T
U L
isbon – Inequality & P
overty
2nd-Order approachThe basic tool is the The basic tool is the income cumulantincome cumulant. This can be . This can be expressed as the functionalexpressed as the functional
Use this to derive three intuitive conceptsUse this to derive three intuitive concepts The (relative) Lorenz curveThe (relative) Lorenz curve The shares rankingThe shares ranking Gini coefficientGini coefficient
The graph of The graph of CC is the is the generalised Lorenz curvegeneralised Lorenz curve
Again use it to characterise dominance…Again use it to characterise dominance…
Frank C
owell:
Frank C
owell: T
U L
isbon – Inequality & P
overty T
U L
isbon – Inequality & P
overty
Another important relationship
The idea of cumulant (2The idea of cumulant (2ndnd-order) dominance:-order) dominance:
G cumulant-dominates FW(G) > W(F) for all WW2
A fundamental result:A fundamental result:
To illustrate, draw the GLCTo illustrate, draw the GLC
G cumulant-dominates Fmeans: for every q, C (G;q) C (F;q), for some q, C (G;q) > C (F;q)
Frank C
owell:
Frank C
owell: T
U L
isbon – Inequality & P
overty T
U L
isbon – Inequality & P
overty
Second order dominance
10
0
C(G; . )
C(F; . )
C(.; q)
(F)
(G)
q
cum
ulat
ive
inco
me
Frank C
owell:
Frank C
owell: T
U L
isbon – Inequality & P
overty T
U L
isbon – Inequality & P
overty
£0
£5,000
£10,000
£15,000
£20,000
£25,000
0.0 0.1 0.2 0.3 0.4 0.5 0.6 0.7 0.8 0.9 1.0
Proportion of population
1993
2000-1
UK “Final income” – GLC
Frank C
owell:
Frank C
owell: T
U L
isbon – Inequality & P
overty T
U L
isbon – Inequality & P
overty
£0
£5,000
£10,000
£15,000
£20,000
£25,000
0.0 0.1 0.2 0.3 0.4 0.5 0.6 0.7 0.8 0.9 1.0
Proportion of population
1993
2000-1
“Original income” – GLC
Frank C
owell:
Frank C
owell: T
U L
isbon – Inequality & P
overty T
U L
isbon – Inequality & P
overty
Ranking Distributions: Summary
First-order (Parade) dominance is equivalent to ranking by First-order (Parade) dominance is equivalent to ranking by quantiles. quantiles. A strong result.A strong result.
Where Parades cross, second-order methods may be Where Parades cross, second-order methods may be appropriate.appropriate.
Second-order (GL)-dominance is equivalent to ranking by Second-order (GL)-dominance is equivalent to ranking by cumulations. cumulations. Another strong result.Another strong result.
Lorenz dominance equivalent to ranking by shares. Lorenz dominance equivalent to ranking by shares. Special case of GL-dominance normalised by means.Special case of GL-dominance normalised by means.
Where Lorenz-curves intersect unambiguous inequality Where Lorenz-curves intersect unambiguous inequality orderings are not possible.orderings are not possible.
This makes inequality measures especially interesting.This makes inequality measures especially interesting.
Frank C
owell:
Frank C
owell: T
U L
isbon – Inequality & P
overty T
U L
isbon – Inequality & P
overty
Overview...Welfare comparisons
SWFs
Rankings
Social welfare and needs
Income Distribution and Welfare
Extensions of the ranking approach
Frank C
owell:
Frank C
owell: T
U L
isbon – Inequality & P
overty T
U L
isbon – Inequality & P
overty
Difficulties with needs
Why equivalence scales?Why equivalence scales? Need a way of making welfare comparisonsNeed a way of making welfare comparisons
Should be coherentShould be coherent Take account of differing family sizeTake account of differing family size Take account of needsTake account of needs
But there are irreconcilable difficulties:But there are irreconcilable difficulties: LogicLogic Source informationSource information Estimation problemsEstimation problems
Perhaps a more general approach Perhaps a more general approach ““Needs” seems an obvious place for explicit Needs” seems an obvious place for explicit
welfare analysiswelfare analysis
Frank C
owell:
Frank C
owell: T
U L
isbon – Inequality & P
overty T
U L
isbon – Inequality & P
overty
Income and needs reconsidered Standard approach uses “equivalised income”Standard approach uses “equivalised income” The approach assumes:The approach assumes:
Given, known welfare-relevant attributes Given, known welfare-relevant attributes aa A known relationshipA known relationship((aa)) Equivalised income given by Equivalised income given by x x = = y y / / is the "exchange-rate" between income types is the "exchange-rate" between income types xx, , yy
Set aside the assumption that we have a single Set aside the assumption that we have a single ((••).). Get a general result on joint distribution of (Get a general result on joint distribution of (yy, , aa))
This makes distributional comparisons multidimensionalThis makes distributional comparisons multidimensional Intrinsically very difficult (Intrinsically very difficult (Atkinson and Bourguignon Atkinson and Bourguignon 19821982))
To make progress:To make progress: We simplify the structure of the problemWe simplify the structure of the problem We again use results on ranking criteriaWe again use results on ranking criteria
Frank C
owell:
Frank C
owell: T
U L
isbon – Inequality & P
overty T
U L
isbon – Inequality & P
overty
Alternative approach to needs Based on Atkinson and Bourguignon (Atkinson and Bourguignon (19821982, 1987), 1987) see also
Cowell (2000) Sort individuals be into needs groups N1, N2 ,… Suppose a proportion j are in group Nj . Then social welfare can be written:
To make this operational… Utility people get from income depends on their needs:
Frank C
owell:
Frank C
owell: T
U L
isbon – Inequality & P
overty T
U L
isbon – Inequality & P
overty
A needs-related class of SWFs
“Need” reflected in high MU of income? If need falls with j then the above should be positive. Let W3 W2 be the subclass of welfare functions for
which the above is positive and decreasing in y
Suppose we want Suppose we want jj=1,2,… to reflect decreasing order of =1,2,… to reflect decreasing order of need.need.
Consider need and the marginal utility of income:Consider need and the marginal utility of income:
Frank C
owell:
Frank C
owell: T
U L
isbon – Inequality & P
overty T
U L
isbon – Inequality & P
overty
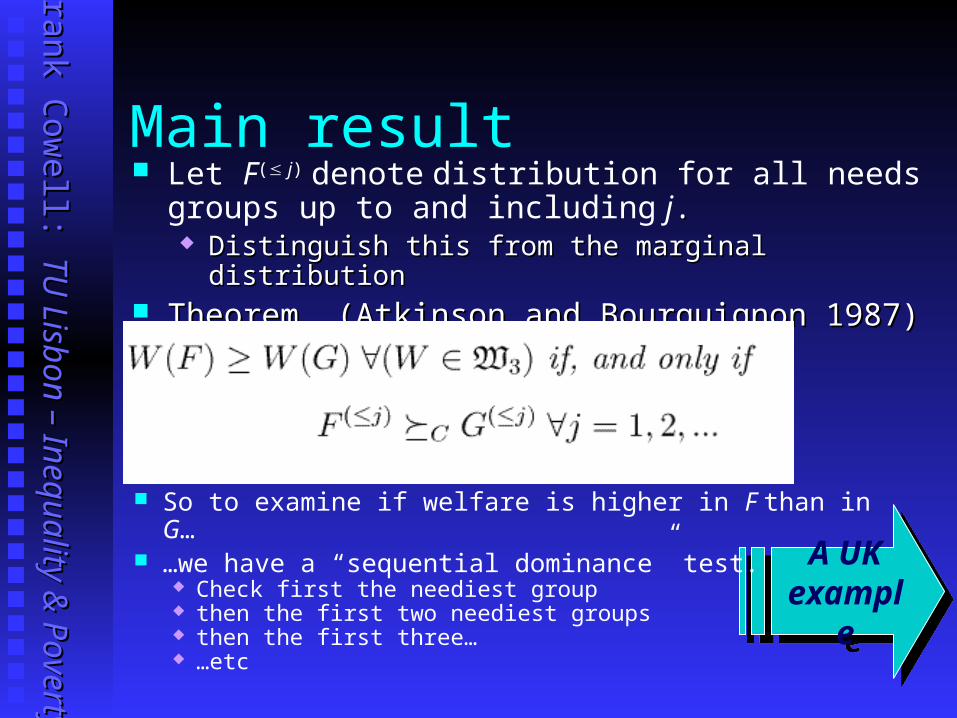
Main result Let F( j) denote distribution for all needs groups up to and
including j.. Distinguish this from the marginal distributionDistinguish this from the marginal distribution
Theorem (Atkinson and Bourguignon 1987)Theorem (Atkinson and Bourguignon 1987)
A UK example
A UK example
So to examine if welfare is higher in F than in G… …we have a “sequential dominance” test.
Check first the neediest group then the first two neediest groups then the first three… …etc
Frank C
owell:
Frank C
owell: T
U L
isbon – Inequality & P
overty T
U L
isbon – Inequality & P
overty
Household types in Economic Trends
2+ads,3+chn/3+ads,chn2+ads,3+chn/3+ads,chn 2 adults with 2 children2 adults with 2 children 1 adult with children1 adult with children 2 adults with 1 child2 adults with 1 child 2+ adults 0 children2+ adults 0 children 1 adult, 0 children1 adult, 0 children
Frank C
owell:
Frank C
owell: T
U L
isbon – Inequality & P
overty T
U L
isbon – Inequality & P
overty
£0
£500
£1,000
£1,500
£2,000
£2,500
£3,000
£3,500
£4,000
£4,500
0.00 0.05 0.10 0.15 0.20 0.25
Proportion of population
Type 1 originalType 1 finalTypes 1,2 originalTypes 1,2 finalTypes 1-3 originalTypes 1-3 final
Impact of Taxes and Benefits. UK 1991. Sequential GLCs (1)
Impact of Taxes and Benefits. UK 1991. Sequential GLCs (2)
Frank C
owell:
Frank C
owell: T
U L
isbon – Inequality & P
overty T
U L
isbon – Inequality & P
overty
Conclusion Axiomatisation of welfare can be accomplished using just Axiomatisation of welfare can be accomplished using just
a few basic principlesa few basic principles Ranking criteria can be used to provide broad judgmentsRanking criteria can be used to provide broad judgments These may be indecisive, so specific SWFs could be usedThese may be indecisive, so specific SWFs could be used
What shape should they have?What shape should they have? How do we specify them empirically?How do we specify them empirically?
The same basic framework of distributional analysis can The same basic framework of distributional analysis can be extended to a number of related problems:be extended to a number of related problems:
For example inequality and poverty…For example inequality and poverty… ……in next lecturein next lecture
Frank C
owell:
Frank C
owell: T
U L
isbon – Inequality & P
overty T
U L
isbon – Inequality & P
overty
References:
Alesina, A., Di Tella, R. and MacCulloch, R (2004) “Inequality and happiness: are Europeans and Americans different?”, Journal of Public Economics, 88, 2009-2042
Amiel, Y. and Cowell, F.A. (1999) Thinking about Inequality, Cambridge University Press
Atkinson, A. B. (1970) “On the Measurement of Inequality,” Journal of Economic Theory, 2, 244-263
Atkinson, A. B. and Bourguignon, F. (1987) “Income distribution and differences Atkinson, A. B. and Bourguignon, F. (1987) “Income distribution and differences in needs,” in Feiwel, G. R. (ed), in needs,” in Feiwel, G. R. (ed), Arrow and the Foundations of the Theory of Arrow and the Foundations of the Theory of Economic PolicyEconomic Policy, Macmillan, New York, chapter 12, pp 350-370, Macmillan, New York, chapter 12, pp 350-370
Atkinson, A. B. and Bourguignon, F. (1982)Atkinson, A. B. and Bourguignon, F. (1982) “The comparison of multi- “The comparison of multi-dimensional distributions of economic status,” dimensional distributions of economic status,” Review of Economic StudiesReview of Economic Studies, , 4949, , 183-201183-201
Barsky, R. B., Juster, F. T., Kimball, M. S. and Shapiro, M. D. (1997) “Preference parameters and behavioral heterogeneity : An Experimental Approach in the Health and Retirement Survey,” Quarterly Journal of Economics,112, 537-579
Frank C
owell:
Frank C
owell: T
U L
isbon – Inequality & P
overty T
U L
isbon – Inequality & P
overty
References:
Blundell, R., Browning, M. and Meghir, C. (1994) “Consumer Demand and the Life-Cycle Allocation of Household Expenditures,” Review of Economic Studies, 61, 57-80
Carlsson, F., Daruvala, D. and Johansson-Stenman, O. (2005) “Are people inequality averse or just risk averse?” Economica, 72,
Cowell, F. A. (2000)Cowell, F. A. (2000) “Measurement of Inequality,” in Atkinson, A. B. “Measurement of Inequality,” in Atkinson, A. B. and Bourguignon, F. (eds) and Bourguignon, F. (eds) Handbook of Income DistributionHandbook of Income Distribution, North , North Holland, Amsterdam, Chapter 2, 87-166Holland, Amsterdam, Chapter 2, 87-166
Cowell, F. A. and Gardiner, K.A. (2000) “Welfare Weights”, OFT Economic Research Paper 202, Office of Fair Training, Salisbury Square, London
Dalton, H. (1920) “Measurement of the inequality of incomes,” The Economic Journal, 30, 348-361
Pen, J. (1971) Income Distribution, Allen Lane, The Penguin Press, London
Pigou, A. C. (1912) Wealth and Welfare, Macmillan, London