• Long awaited corporate tax reform became a reality at quarter end, removing a disincentive on global companies such as ours to invest offshore earnings in the United States. However, its implementation did have a net negative impact on earnings in the fiscal quarter, due mostly to the applicable repatriation tolls. As detailed later, a one-time charge of $1.1 billion resulted in the net loss in the quarter. • Earlier this month we announced an agreement to acquire Edinburgh Partners Limited, an established global value investment manager that strengthens our global equity product offerings with a highly regarded investment team. Additionally, Dr. Sandy Nairn, CEO of Edinburgh Partners, whose deep history with Templeton and expertise in value investing brings strong talent and leadership to the company, will be appointed Chairman of the Templeton Global Equity Group, while maintaining responsibility for Edinburgh Partners, which will continue to operate as a distinct business. • In November, we launched an initial suite of 16 single country and regional market-cap weighted ETFs. These new passive ETFs will allow investors, including investors in our own solutions products, to gain inexpensive beta exposure to these markets at expense ratios that are among the lowest for their respective categories. • During the quarter, the company’s Board of Directors once again increased the regular quarterly dividend, to $0.23 per share, a 15% increase from the prior year, maintaining our exceptional dividend growth track record. Additionally, we repurchased 4.6 million shares, bringing the total payout for the trailing twelve months to $1.2 billion. FRANKLIN RESOURCES, INC. Q1 2018 Executive Quarterly Earnings Commentary Highlights Investment Performance 2 Assets Under Management and Flows 3-5 Flows by Investment Objective 6-8 Financial Results 9 Operating Revenues and Expenses 9-10 Other Income and Taxes 11 Capital Management 12-13 Appendix 14-15 Greg Johnson Chairman of the Board Chief Executive Officer Kenneth A. Lewis Executive Vice President Chief Financial Officer Contents Page(s) Conference Call Details: Johnson and Lewis will lead a live teleconference today at 11:00 a.m. Eastern Time to answer questions of a material nature. Access to the teleconference will be available via investors.franklinresources.com or by dialing (877) 407-8293 in the U.S. and Canada or (201) 689-8349 internationally. A replay of the teleconference can also be accessed by calling (877) 660-6853 in the U.S. and Canada or (201) 612-7415 internationally using access code 13674993, after 2:00 p.m. Eastern Time on January 30, 2018 through February 27, 2018. Analysts and investors are encouraged to review the Company’s recent filings with the U.S. Securities and Exchange Commission and to contact Investor Relations at (650) 312-4091 before the live teleconference for any clarifications or questions related to the earnings release or written commentary.
Transcript
• Long awaited corporate tax reform became a reality at quarter end,removing a disincentive on global companies such as ours to investoffshore earnings in the United States. However, its implementationdid have a net negative impact on earnings in the fiscal quarter, duemostly to the applicable repatriation tolls. As detailed later, a one-timecharge of $1.1 billion resulted in the net loss in the quarter.
• Earlier this month we announced an agreement to acquire EdinburghPartners Limited, an established global value investment manager thatstrengthens our global equity product offerings with a highly regardedinvestment team. Additionally, Dr. Sandy Nairn, CEO of EdinburghPartners, whose deep history with Templeton and expertise in valueinvesting brings strong talent and leadership to the company, will beappointed Chairman of the Templeton Global Equity Group, whilemaintaining responsibility for Edinburgh Partners, which will continueto operate as a distinct business.
• In November, we launched an initial suite of 16 single country andregional market-cap weighted ETFs. These new passive ETFs willallow investors, including investors in our own solutions products, togain inexpensive beta exposure to these markets at expense ratiosthat are among the lowest for their respective categories.
• During the quarter, the company’s Board of Directors once againincreased the regular quarterly dividend, to $0.23 per share, a 15%increase from the prior year, maintaining our exceptional dividendgrowth track record. Additionally, we repurchased 4.6 million shares,bringing the total payout for the trailing twelve months to $1.2 billion.
FRANKLIN RESOURCES, INC.Q1 2018 Executive Quarterly Earnings Commentary
Highlights
InvestmentPerformance
2
Assets Under Management and Flows
3-5
Flows by Investment Objective
6-8
Financial Results 9
Operating Revenues and Expenses
9-10
Other Income and Taxes
11
Capital Management 12-13
Appendix 14-15
Greg JohnsonChairman of the Board Chief Executive Officer
Kenneth A. LewisExecutive Vice PresidentChief Financial Officer
Contents Page(s)
Conference Call Details:
Johnson and Lewis will lead a live teleconference today at 11:00 a.m.Eastern Time to answer questions of a material nature. Access to theteleconference will be available via investors.franklinresources.com or bydialing (877) 407-8293 in the U.S. and Canada or (201) 689-8349internationally. A replay of the teleconference can also be accessed bycalling (877) 660-6853 in the U.S. and Canada or (201) 612-7415internationally using access code 13674993, after 2:00 p.m. EasternTime on January 30, 2018 through February 27, 2018.
Analysts and investors are encouraged to review the Company’s recentfilings with the U.S. Securities and Exchange Commission and to contactInvestor Relations at (650) 312-4091 before the live teleconference forany clarifications or questions related to the earnings release or writtencommentary.
Q1 2018 Executive CommentaryUnaudited
Investment Performance
After outperforming in 2016, value lagged growth by the widest margin in nearly two decades in 2017, as the MSCI ACWIValue Index returned 19% compared to the MSCI ACWI Growth Index return of over 30%; marking the tenth year out of thepast eleven that global growth has outperformed.
Not surprisingly, short-term performance was challenged in the current market environment as several of our largest fundscollectively experienced a decrease in relative performance for the 1-year time period, which also weighed on 3-yearperformance track records. The 10-year relative investment performance rankings of our U.S. and cross-border mutualfunds were in line with the previous quarter.
The primary detractors were some of our larger funds, such as Franklin Income, which is not managed to compete on atotal return basis with either its benchmark or its Lipper peer group, but rather focuses on the attractiveness and stability ofincome distribution that is more than 2x the benchmark and peer group. Templeton Global Macro team strategies, such asTempleton Global Bond, also underperformed in the quarter, due primarily to certain currency positions and defensivepositioning around interest rates in developed markets.
We also saw areas of noticeable improvements. A number of our U.S. growth strategies have been bright spots.Specifically, Franklin DynaTech which ranked in the 1st quartile for the 1-, 3-, 5- and 10-year time periods, and FranklinGrowth also had strong relative performance, ranking in the top 2 quartiles for the 3- and 5- year, and 1st quartile in the 10-year period.
Some other standouts were our California focused municipal bond funds. Franklin CA Tax-Free Income and Franklin CAHigh Yield funds both delivered strong relative performance for the 1-year period. In fact, the high yield fund has deliveredtop decile performance across the trailing 3-, 5- and 10-year periods as it benefited from the rally in duration and lowercredit quality that had the opposite impact on many of our other, larger bond funds.
2
Percentage of Total Long-Term Assets ($491 billion) in the Top Two Peer Group Quartiles1
Long-term sales increased this quarter as we saw anotable rebound in institutional sales, particularlyoutside of the U.S. Redemptions also ticked up in thequarter, with much of the increase coming inDecember, when we normally see higher redemptionsrelated to end of year tax planning and certaindistribution reinvestment dynamics.
Net outflows for the quarter improved to $2.3 billion, thelowest level since our second quarter of 2015. Theimprovement from last quarter was largely due toseasonally higher reinvested distributions that morethan offset elevated redemptions in December.
3
Simple Monthly Average vs. End of Period(in US$ billions, for the three months ended)
723 732 742 749 753
720 740 743 753 754
12/16 3/17 6/17 9/17 12/17
Average AUM Ending AUM
Greg Johnson, Chairman and CEO
Net Market Change and Other(In US$ billions, for the three months ended)
Long-Term Flows(In US$ billions, for the three months ended)
24.5 30.5 29.8 27.5 28.1
(46.7) (44.5) (41.1) (37.4) (39.4)
(14.4) (11.0) (7.3) (5.9) (2.3)
12/16 3/17 6/17 9/17 12/17
1.1
31.0
10.1
16.3
2.9
12/16 3/17 6/17 9/17 12/17
Ending and average assets under management forthe quarter were marginally higher at $753.8 billionand $752.7 billion, respectively.
Long-Term Sales
Long-Term Redemptions
Net Flows
Q1 2018 Executive CommentaryUnaudited
10.9 12.4 11.6 9.6 8.9
(25.9)(20.7)
(17.1) (16.0) (17.4)
(8.3)(6.1)
(2.4) (3.2)(0.6)
12/16 3/17 6/17 9/17 12/17
International retail's recent momentum slowed thisquarter as both sales and redemptions weakened fromthe prior quarter. However, our previous success in theAsia-Pacific region continued this quarter, specificallyin China and India, where sales and demand remainedstrong. In the ETF space, we launched a Smart-BetaMulti-Factor Emerging Markets product in Europe,making us the first company to do so, and increasingour ETF presence in Europe.
4
Greg Johnson, Chairman and CEO
Long-Term Sales
Long-Term Redemptions
Net Flows
Internationally, our institutional business attractedstrong sales of $4.6 billion; its highest level in twoyears. Redemptions also picked up a bit, largelydue to several large redemptions in the Asia-Pacific and the Americas region. Nevertheless, ourinstitutional pipeline remains healthy and wecontinue to track opportunities around the globe.
Q1 2018 Executive CommentaryUnaudited
Retail
Institutional Long-Term Sales
Long-Term Redemptions
Net Flows
Long-Term Flows: International¹(In US$ billions, for the three months ended)
8.512.0 12.5 12.4 11.6
(11.8) (11.6) (11.3) (11.2) (11.8)
(4.0)
1.0 2.1 2.0 0.6
12/16 3/17 6/17 9/17 12/17
1. Graphs do not include high net-worth client flows.
2.1 2.9 2.4 3.2 4.6
(3.3)(6.0) (6.3)
(3.5) (5.0)
0.5
(2.9) (3.9)(0.3) (0.3)
12/16 3/17 6/17 9/17 12/17
Long-Term Flows: United States¹(In US$ billions, for the three months ended)
Retail
While net flows increased for U.S. retail, we did seesales decrease to $8.9 billion and redemptions tickup, mostly attributed to both of our flagship funds,Franklin Income and Templeton Global Bond, jointlyexperiencing larger redemptions this quarter. Wecontinue to build on our success from last quarter byadding a number of funds from a wide range ofstrategies onto major platforms this quarter.
Long-Term Sales
Long-Term Redemptions
Net Flows
5
Greg Johnson, Chairman and CEO
Long-Term Sales
Long-Term Redemptions
Net Flows
Q1 2018 Executive CommentaryUnaudited
1. Graphs do not include high net-worth client flows.
Shifting to the U.S. institutional flows, sales improvedfrom last quarter and redemptions slowed to the lowestlevel since our third quarter of 2016. As we begin to seethe effects of our recent strategic moves in this space, wecontinue to be optimistic about our U.S. institutionalbusiness. We also launched several new CollectiveInvestment Trust products with a new partner in thedefined contribution space this quarter.
Long-Term Flows: United States¹(In US$ billions, for the three months ended)
Flows by Investment Objective
61. Sales and redemptions as a percentage of beginning assets under management are annualized.
Global/International Equity
Net Flows Long-Term Sales
Long-Term Redemptions
(in US$ billions, for the three months ended)
5.9 6.9 6.5 5.4 5.9
(10.7)(13.8) (12.9) (11.0) (11.6)
(2.9)(6.7) (6.2) (5.0) (3.6)
12/16 3/17 6/17 9/17 12/17
Global/International Fixed Income(in US$ billions, for the three months ended)
6.1 9.0 11.2 11.9 11.1
(14.2)(11.6) (9.5) (9.0) (10.2)
(7.5)
(2.0)
2.6 3.8 1.8
12/16 3/17 6/17 9/17 12/17
% of Beg. AUM1
Prior 4 Quarters Avg
Current Quarter
Sales 12% 11%Redemptions 24% 22%
% of Beg. AUM1
Prior 4 Quarters Avg
Current Quarter
Sales 24% 27%Redemptions 28% 25%
Net Flows Long-Term Sales
Long-Term Redemptions
Greg Johnson, Chairman and CEO
Global fixed income inflows slowed to $1.8 billionthis quarter due to a combination of lower salesand higher redemptions. The higher redemptionlevel was largely due to an expected portfolioallocation change in Templeton Global Bond fund.We continue to see strong demand for our cross-border Templeton Emerging Markets Bond fund,which attracted $1.3 billion of net inflows thisquarter, and was our top net selling mutual fund,primarily in the Asia-Pacific region.
Q1 2018 Executive CommentaryUnaudited
Moving on to flows by investment objective,global/international equity flows improved for thefourth consecutive quarter to $3.6 billion of netoutflows. Flows in the global equity categorycontinue to be driven by institutional activity,where in this quarter we saw solid new businesstapered by redemptions.
We are excited to be adding Edinburgh Partnersand its experienced investment team, includingits founder and CEO, Dr. Sandy Nairn, who willprovide experienced leadership over bothTempleton Global Equity Group and EdinburghPartners. His strong knowledge of TempletonGlobal Equity Group’s philosophy and processfrom his prior decade of experience working forthe group, along with new insights, having runhis own firm for the last 15 years, arecontributions we believe will lead to improvedinvestment performance and flows over time.
7
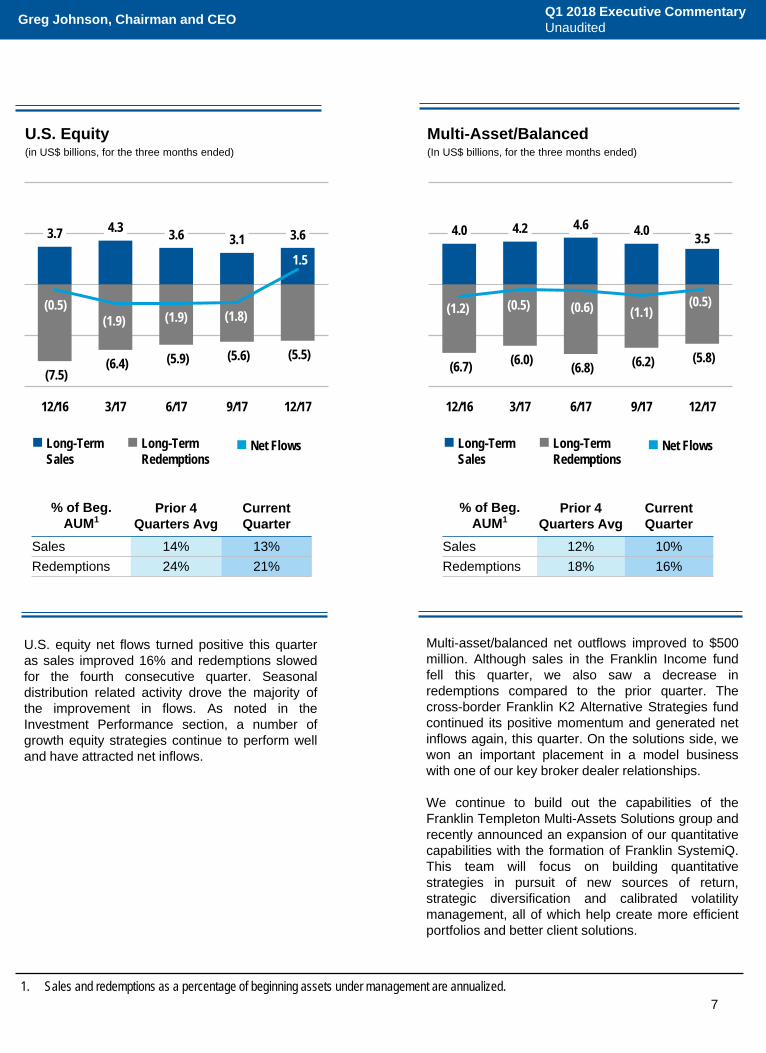
Multi-Asset/Balanced(In US$ billions, for the three months ended)
4.0 4.2 4.6 4.0 3.5
(6.7) (6.0) (6.8) (6.2) (5.8)
(1.2) (0.5) (0.6) (1.1)(0.5)
12/16 3/17 6/17 9/17 12/17
U.S. Equity (in US$ billions, for the three months ended)
3.7 4.3 3.6 3.1 3.6
(7.5)(6.4) (5.9) (5.6) (5.5)
(0.5)(1.9) (1.9) (1.8)
1.5
12/16 3/17 6/17 9/17 12/17
U.S. equity net flows turned positive this quarteras sales improved 16% and redemptions slowedfor the fourth consecutive quarter. Seasonaldistribution related activity drove the majority ofthe improvement in flows. As noted in theInvestment Performance section, a number ofgrowth equity strategies continue to perform welland have attracted net inflows.
Net Flows Long-Term Sales
Long-Term Redemptions
% of Beg. AUM1
Prior 4 Quarters Avg
Current Quarter
Sales 14% 13%Redemptions 24% 21%
% of Beg. AUM1
Prior 4 Quarters Avg
Current Quarter
Sales 12% 10%Redemptions 18% 16%
Net Flows Long-Term Sales
Long-Term Redemptions
Multi-asset/balanced net outflows improved to $500million. Although sales in the Franklin Income fundfell this quarter, we also saw a decrease inredemptions compared to the prior quarter. Thecross-border Franklin K2 Alternative Strategies fundcontinued its positive momentum and generated netinflows again, this quarter. On the solutions side, wewon an important placement in a model businesswith one of our key broker dealer relationships.
We continue to build out the capabilities of theFranklin Templeton Multi-Assets Solutions group andrecently announced an expansion of our quantitativecapabilities with the formation of Franklin SystemiQ.This team will focus on building quantitativestrategies in pursuit of new sources of return,strategic diversification and calibrated volatilitymanagement, all of which help create more efficientportfolios and better client solutions.
Greg Johnson, Chairman and CEO
1. Sales and redemptions as a percentage of beginning assets under management are annualized.
Q1 2018 Executive CommentaryUnaudited
2.6
4.2
2.2 1.5
2.5
(3.9) (3.9)(3.1) (3.4) (3.1)
(0.8)
0.5
(0.5)(1.7)
(0.1)
12/16 3/17 6/17 9/17 12/17
8
Taxable U.S. Fixed Income(In US$ billions, for the three months ended)
Taxable U.S. fixed income net flows were nearlybreakeven this quarter primarily due to strongsales which increased 67%, while redemptionsslightly declined. The rebound in sales wasprimarily attributable to an institutional client in theAsia-Pacific region that funded a new mandate at$1 billion.
Net Flows Long-Term Sales
Long-Term Redemptions
% of Beg. AUM1
Prior 4 Quarters Avg
Current Quarter
Sales 20% 20%Redemptions 27% 25%
Tax-Free Fixed Income(In US$ billions, for the three months ended)
2.2 1.9 1.7 1.6 1.5
(3.7)(2.8) (2.9)
(2.2)(3.2)
(1.5)(0.4) (0.7) (0.1)
(1.4)
12/16 3/17 6/17 9/17 12/17
Tax-free fixed income net outflows increased thisquarter, due primarily to increased redemptions, assales were essentially flat. Increased redemptionswere mostly from our three largest federal tax-freefunds, likely as a result of end of year tax planning.
% of Beg. AUM1
Prior 4 Quarters Avg
Current Quarter
Sales 10% 8%Redemptions 16% 18%
Net Flows Long-Term Sales
Long-Term Redemptions
Greg Johnson, Chairman and CEO
1. Sales and redemptions as a percentage of beginning assets under management are annualized.
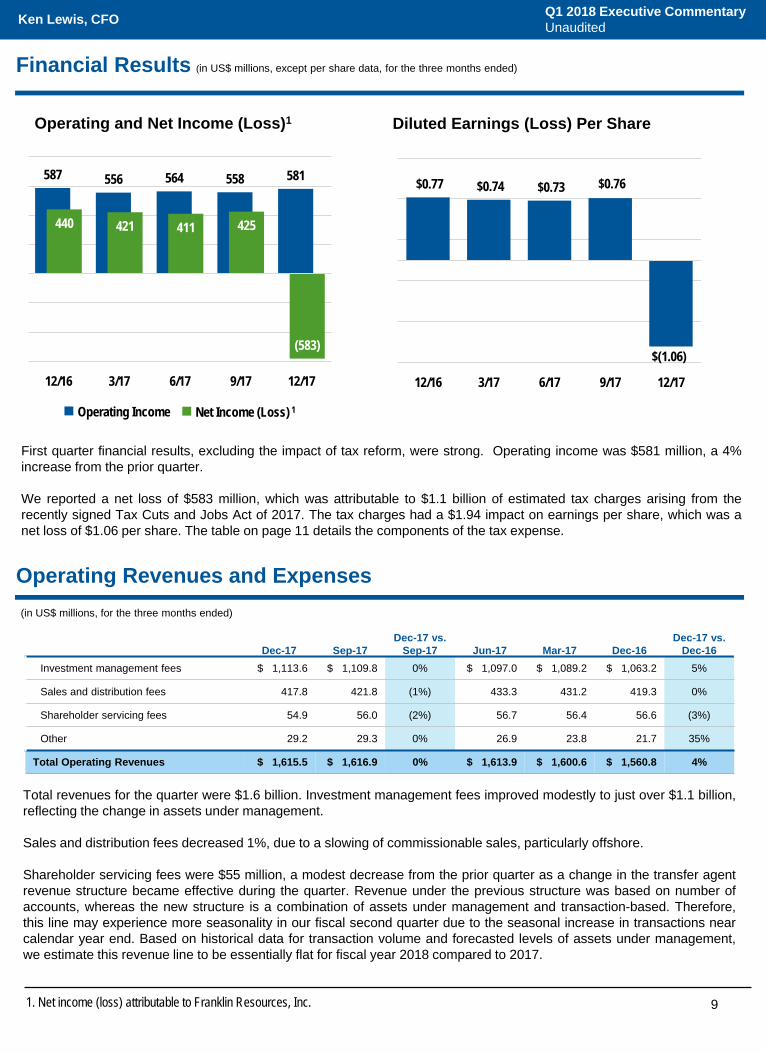
(in US$ millions, except per share data, for the three months ended)
First quarter financial results, excluding the impact of tax reform, were strong. Operating income was $581 million, a 4%increase from the prior quarter.
We reported a net loss of $583 million, which was attributable to $1.1 billion of estimated tax charges arising from therecently signed Tax Cuts and Jobs Act of 2017. The tax charges had a $1.94 impact on earnings per share, which was anet loss of $1.06 per share. The table on page 11 details the components of the tax expense.
1. Net income (loss) attributable to Franklin Resources, Inc.
Ken Lewis, CFO Q1 2018 Executive CommentaryUnaudited
(in US$ millions, for the three months ended)
Total revenues for the quarter were $1.6 billion. Investment management fees improved modestly to just over $1.1 billion,reflecting the change in assets under management.
Sales and distribution fees decreased 1%, due to a slowing of commissionable sales, particularly offshore.
Shareholder servicing fees were $55 million, a modest decrease from the prior quarter as a change in the transfer agentrevenue structure became effective during the quarter. Revenue under the previous structure was based on number ofaccounts, whereas the new structure is a combination of assets under management and transaction-based. Therefore,this line may experience more seasonality in our fiscal second quarter due to the seasonal increase in transactions nearcalendar year end. Based on historical data for transaction volume and forecasted levels of assets under management,we estimate this revenue line to be essentially flat for fiscal year 2018 compared to 2017.
Operating and Net Income (Loss)1 Diluted Earnings (Loss) Per Share
Operating Income Net Income (Loss) 1
Operating Revenues and Expenses
10
Operating expenses were seasonally lower by 2%.
Sales, distribution and marketing expense declined to $529 million in line with the decrease in revenues.
Compensation and benefits expense was $333 million for the quarter. The decrease was primarily due to a non-recurring benefit from certain performance-based, long-term incentive awards that did not vest, offsetting higher salaries,wages and benefits, including annual merit increases effective in December.
Information systems and technology experienced its usual seasonal pullback in expenses during the quarter, along withoccupancy and general and administrative expenses that were also lower.
As expenses were seasonally lower this quarter, we expect an uptick in expenses next quarter, though at a much slowerpace than reported last year. The biggest increase should be in compensation and benefits, which will likely increase inthe range of 6% to 8%, due to the normal seasonal factors. Full year expectations for expense growth (excluding sales,distribution and marketing expense) are tracking toward the higher end of the range we previously guided to, beforefactoring in the acquisition of Edinburgh Partners, which is expected to close in our third quarter.
Ken Lewis, CFO Q1 2018 Executive CommentaryUnaudited
Dec-17 Sep-17Dec-17 vs.
Sep-17 Jun-17 Mar-17 Dec-16Dec-17 vs.
Dec-16Sales, distribution and marketing $ 528.7 $ 534.9 (1%) $ 541.2 $ 534.8 $ 520.0 2%
Compensation and benefits 332.5 336.1 (1%) 342.7 343.4 311.5 7%
Information systems and technology 55.0 60.0 (8%) 54.1 54.0 51.7 6%
Occupancy 29.4 33.0 (11%) 30.2 29.0 29.1 1%
General, administrative and other 88.8 95.2 (7%) 81.5 83.9 61.6 44%
Profitability continues to be strong with an operating margin for the quarter of 36%. After closing, most likely in our thirdquarter, the Edinburgh Partners acquisition will be accretive on a cash basis, but initially modestly dilutive to reportedU.S. GAAP earnings, due to the amortization and expensing of various incentive and retention provisions as wellstructural elements of the transaction.
Average AUM: 2.2% CAGR
Operating Income1:
1.0% CAGR
1. Fiscal year-to-date operating income is annualized for CAGR calculation. CAGR is the compound average annual growth rate over the trailing 10-year period.
11
Other Income
Ken Lewis, CFO
Other Income(In US$ millions, for the three months ended December 31, 2017)
1. Reflects the portion of noncontrolling interests, attributable to third-party investors, related to CIPs included in Other income.
Other income, net of noncontrolling interests was $67.3 million, up from $57.9 million in the prior quarter. Other incomethis quarter was driven by earnings from equity method investments and interest income.
Q1 2018 Executive CommentaryUnaudited
Taxes
Q1 Tax Expense % of Income before Taxes
Q1 Tax Expense from Operations $ 154.6 23.7%
Deemed Repatriation (Fed & State) 1,120.7 172.0%
Revaluation of Net DTL (53.1) (8.1%)
Others 1.3 0.2%
Total Q1 Tax Expense $ 1,223.5 187.8%
Near the end of the quarter, Congress passed comprehensive tax legislation, commonly referred to as the Tax Cuts andJobs Act of 2017. This new law makes broad and complex changes to the U.S. tax code, and while it will take time tofully interpret the changes, its impact on first quarter earnings was significant.
In particular, the transition to a new territorial-like tax system and the resultant deemed repatriation tax on undistributedearnings of non-U.S. subsidiaries caused us to take an estimated charge of $1.1 billion in the quarter.
Partially offsetting that was a benefit of $51.8 million from the revaluation of net deferred tax liabilities and other factorsrelated to the implementation of the law, which features a new lower base rate of 21%. These impacts on tax expenseare summarized in the table below.
Our current estimate of the effective tax rate for the full fiscal year 2018 is in the range of 24% to 25% excluding theone-time impacts from the Tax Act, but please note that because tax reform was signed into law near the end of our firstfiscal quarter, roughly three-fourths of the benefits of the lower base rate will be realized this fiscal year, and our goforward effective tax rate will likely moderately exceed the new U.S. base rate.
28.5
35.2
0.0 0.7(10.8) 0.9 16.0
70.5
(3.2)
67.3
Interest anddividendincome
Equity methodinvestments
Available-for-sale
investments
Tradinginvestments
Interestexpense
Foreignexchange and
other
ConsolidatedInvestment
Products (CIPs)
Total otherincome
Noncontrollinginterests¹
Other income,net of
noncontrollinginterests
12
1. U.S. asset managers include AB, AMG, APAM, APO, ARES, BLK, BX, CG, CNS, EV, FIG, FII, GBL, HLNE, IVZ, KKR, LM, MN, OAK, OMAM, OZM, PZN, TROW, VRTS, WDR and WETF. Source: Thomson Reuters and company reports.
BEN U.S. Asset Managers Average (ex-BEN)1
Change in Ending Shares Outstanding
U.S. Asset Managers (ex-BEN)1: 2.1% Compound Annual Dilution
Share Repurchases (US$ millions) vs. Average BEN Price
BEN Average Price for the Period Special Cash Dividend DeclaredShare Repurchase Amount
During the quarter, the company repurchased 4.6 million shares, more than offsetting annual issuance related to long-term incentive awards, at a total cost of $200 million.
Additionally, as already noted, the regular quarterly dividend was increased by 15%, keeping with our long-term trackrecord of steady growth that compares favorably to other public asset managers.
Cumulatively, for the trailing twelve months, we returned $710 million to shareholders via repurchases and $463million through the regular quarterly dividend, for a combined payout of just under $1.2 billion.
Cash and investments, net of debt and the liability for repatriation tolls was $9.4 billion as of December 31, 2017.
Q1 2018 Executive CommentaryUnaudited
25% 24% 25% 26%
69% 57% 49% 45%NM
1,6081,444
1,300 1,220 1,173
12/16 3/17 6/17 9/17 12/17
13
1. U.S. asset managers include AB, AMG, APAM, APO, ARES, BLK, BX, CG, CNS, EV, FIG, FII, GBL, HLNE, IVZ, KKR, LM, MN, OAK, OMAM, OZM, PZN, TROW, VRTS, WDR and WETF. Source: Thomson Reuters and company reports.
2. The chart above illustrates the amount of share repurchases and dividends over the trailing 12 months, for the period ended. Dividend payout is calculated as dividend amount declared divided by net income attributable to Franklin Resources, Inc. for the trailing 12-month period. Repurchase payout is calculated as stock repurchase amount divided by net income attributable to Franklin Resources, Inc. for the trailing 12-month period.Note: The payout ratio for the 12/17 period is not meaningful due to reported loss that was attributable to tax reform.
Trailing 12 Months Share Repurchases and Dividends2
(US$ millions and percentage of net income)
Dividends Share Repurchases
Ken Lewis, CFO Q1 2018 Executive CommentaryUnaudited
NM
15.0% 15.3%
18.9%
13.2%
5.6%
-1.7%
5.6%
-1.1%
1-Year 3-Year 5-Year 10-Year
Compound Annual Growth of Regular Dividends as of December 31, 2017
BEN U.S. Asset Managers Average (ex-BEN)1
NM
Dec-17
Equity $ 321.4 Multi-Asset/Balanced 142.7 Fixed Income 283.1 Cash Management 6.6 Total $ 753.8 66%
15%
13%
4%2%
43%
19%
37%
1%
141. Net cash and investments consist of Franklin Resources, Inc. cash and investments (including only direct investments in CIPs), net of debt, deposits (in FY 2014) and one-time estimated tax charge (12/17).
Net Cash and Investments1 (US$ billions)
Appendix
Net Cash and Investments¹
Ken Lewis, CFO
Investment Objective (US$ billions)
Sales Region (US$ billions)
Mix of Ending Assets Under Management(as of December 31, 2017)
Q1 2018 Executive CommentaryUnaudited
Dec-17
United States $ 497.2 Europe, the Middle East and Africa 109.9
Asia-Pacific 97.4 Canada 31.4 Latin America 17.9 Total $ 753.8
9.2 9.6 9.710.4
9.4
FYE-9/14 FYE-9/15 FYE-9/16 FYE-9/17 12/17
15
Appendix (continued)
Sales and Distribution Summary(in US$ millions, for the three months ended)
CIPs Related Adjustments(in US$ millions, for the three months ended)
This table summarizes the impact of CIPs on the
Company’s reported U.S. GAAP financial results.
Ken Lewis, CFO Q1 2018 Executive CommentaryUnaudited
Sales-based fees, net $ 8.0 $ 7.6 $ 0.4 5%Amortization of deferred sales commissions (19.1) (19.1) - 0%
Sales and Distribution Fees, Net $ (110.9) $ (113.1) $ 2.2 (2%)
Statements in this commentary regarding Franklin Resources, Inc. (“Franklin”) and its subsidiaries, which are nothistorical facts, are "forward-looking statements" within the meaning of the U.S. Private Securities Litigation Reform Actof 1995. When used in this commentary, words or phrases generally written in the future tense and/or preceded bywords such as “will,” “may,” “could,” “expect,” “believe,” “anticipate,” “intend,” “plan,” “seek,” “estimate” or other similarwords are forward-looking statements. Forward-looking statements involve a number of known and unknown risks,uncertainties and other important factors, some of which are listed below, that could cause actual results and outcomesto differ materially from any future results or outcomes expressed or implied by such forward-looking statements. Whileforward-looking statements are our best prediction at the time that they are made, you should not rely on them and arecautioned against doing so. Forward-looking statements are based on our current expectations and assumptionsregarding our business, the economy and other future conditions. Because forward-looking statements relate to thefuture, they are subject to inherent uncertainties, risks and changes in circumstances that are difficult to predict. They areneither statements of historical fact nor guarantees or assurances of future performance.
These and other risks, uncertainties and other important factors are described in more detail in Franklin’s recent filingswith the U.S. Securities and Exchange Commission, including, without limitation, in Risk Factors and Management’sDiscussion and Analysis of Financial Condition and Results of Operations in Franklin’s Annual Report on Form 10-K forthe fiscal year ended September 30, 2017 and Franklin’s subsequent Quarterly Report on Form 10-Q:• Volatility and disruption of the capital and credit markets, and adverse changes in the global economy, may
significantly affect our results of operations and may put pressure on our financial results.• The amount and mix of our assets under management (“AUM”) are subject to significant fluctuations.• We are subject to extensive, complex, overlapping and frequently changing rules, regulations, policies, and legal
interpretations.• Global regulatory and legislative actions and reforms have made the regulatory environment in which we operate
more costly and future actions and reforms could adversely impact our financial condition and results of operations.• Failure to comply with the laws, rules or regulations in any of the jurisdictions in which we operate could result in
substantial harm to our reputation and results of operations.• Changes in tax laws or exposure to additional income tax liabilities could have a material impact on our financial
condition, results of operations and liquidity.• Any significant limitation, failure or security breach of our information and cyber security infrastructure, software
applications, technology or other systems that are critical to our operations could disrupt our business and harm our operations and reputation.
• Our business operations are complex and a failure to properly perform operational tasks or the misrepresentation of our products and services, or the termination of investment management agreements representing a significant portion of our AUM, could have an adverse effect on our revenues and income.
• We face risks, and corresponding potential costs and expenses, associated with conducting operations and growing our business in numerous countries.
• We depend on key personnel and our financial performance could be negatively affected by the loss of their services.• Strong competition from numerous and sometimes larger companies with competing offerings and products could
limit or reduce sales of our products, potentially resulting in a decline in our market share, revenues and income.• Changes in the third-party distribution and sales channels on which we depend could reduce our income and hinder
our growth.• Our increasing focus on international markets as a source of investments and sales of our products subjects us to
increased exchange rate and market-specific political, economic or other risks that may adversely impact our revenues and income generated overseas.
• Harm to our reputation or poor investment performance of our products could reduce the level of our AUM or affect our sales, and negatively impact our revenues and income.
• Our future results are dependent upon maintaining an appropriate level of expenses, which is subject to fluctuation.• Our ability to successfully manage and grow our business can be impeded by systems and other technological
limitations.• Our inability to successfully recover should we experience a disaster or other business continuity problem could
cause material financial loss, loss of human capital, regulatory actions, reputational harm, or legal liability.• Regulatory and governmental examinations and/or investigations, litigation and the legal risks associated with our
business, could adversely impact our AUM, increase costs and negatively impact our profitability and/or our future financial results.
16
Forward-Looking Statements
17
Investor Relations Contacts
Brian Sevilla +1 (650) 312-3326
Forward-Looking Statements (continued)
• Our ability to meet cash needs depends upon certain factors, including the market value of our assets, operating cash flows and our perceived creditworthiness.
• We are dependent on the earnings of our subsidiaries.
Any forward-looking statement made by us in this commentary speaks only as of the date on which it is made. Factors or events that could cause our actual results to differ may emerge from time to time, and it is not possible for us to predict all of them. We undertake no obligation to publicly update any forward-looking statement, whether as a result of new information, future developments or otherwise, except as may be required by law.
The information in this commentary is provided solely in connection with this commentary, and is not directed toward existing or potential investment advisory clients or fund shareholders.