26
1 FPT Corporate Day | 3Q FY2021 Frasers Property Thailand Corporate Day 3Q/2021 Earnings – Three Month Period Ended 30 June 2021

1FPT Corporate Day | 3Q FY2021
Frasers Property Thailand Corporate Day
3Q/2021 Earnings – Three Month Period Ended 30 June 2021

2FPT Corporate Day | 3Q FY2021
Statements in this presentation constitute “forward-looking statements”, including forward-looking financial information. Such forward-looking statements and financial
information involve known and unknown risks, uncertainties and other factors which may cause the actual results, performance or achievements of Frasers Property
(Thailand) Public Company Limited (“FPT”) and its subsidiaries or industry results, to be materially different from any future results, or FPT performance or
achievements expressed or implied by such forward-looking statements and financial information. Such forward-looking statements and financial information are based
on numerous assumptions regarding the present and future business strategies and the environment in which the FPT and its subsidiaries will operate in the future.
Because these statements and financial information reflect FPT’s current views concerning future events, these statements and financial information necessarily involve
risks, uncertainties and assumptions. Actual future performance could differ materially from these forward-looking statements and financial information as a result of
these risks, uncertainties and assumptions and you are cautioned not to place undue reliance on these statements and financial information.
FPT expressly disclaims any obligation or undertaking to release publicly any updates or revisions to any forward-looking statement or financial information contained in
this presentation to reflect any change in FPT’s expectations with regard thereto or any change in events, conditions or circumstances on which any such statement or
information is based, subject to compliance with all applicable laws and regulations and/or the rules of the Stock Exchange of Thailand, the Securities and Exchange
Commission and/or any other regulatory or supervisory body or agency.
This presentation includes market and industry data and forecast that have been obtained from internal survey, reports and studies, where appropriate, as well as
market research, publicly available information and industry publications. Industry publications, surveys and forecasts generally state that the information they contain
has been obtained from sources believed to be reliable, but there can be no assurance as to the accuracy or completeness of such included information. FPT has not
independently verified any of the data from third party sources or ascertained the underlying economic assumptions relied upon therein.
The information contained in this document is strictly confidential and is made available to the recipient on the condition that it will be held in complete confidence. Any
reproduction or distribution of this document in whole or in part, or the disclosure of any of its Presentations, without prior expressed or written consent of the Company
is prohibited. The information contained in this document has been compiled from sources believed to be reliable. The accuracy and completeness of such information,
however, is not guaranteed nor warranted. Nothing in this presentation should be construed as financial, investment, business, legal or tax advice and you should
consult your independent advisors.
2

3FPT Corporate Day | 3Q FY2021
• 3Q21 Quarterly Highlights and Business Outlook
• BU in Focus - Segmental Performance
• Financial Summary
• Q&A
4FPT Corporate Day | 3Q FY2021
Business Review
Mitrtown Office Tower, Bangkok | Thailand
Progressive
Consolidated
Platform
5FPT Corporate Day | 3Q FY2021 5
FINANCIAL
PERFORMANCE
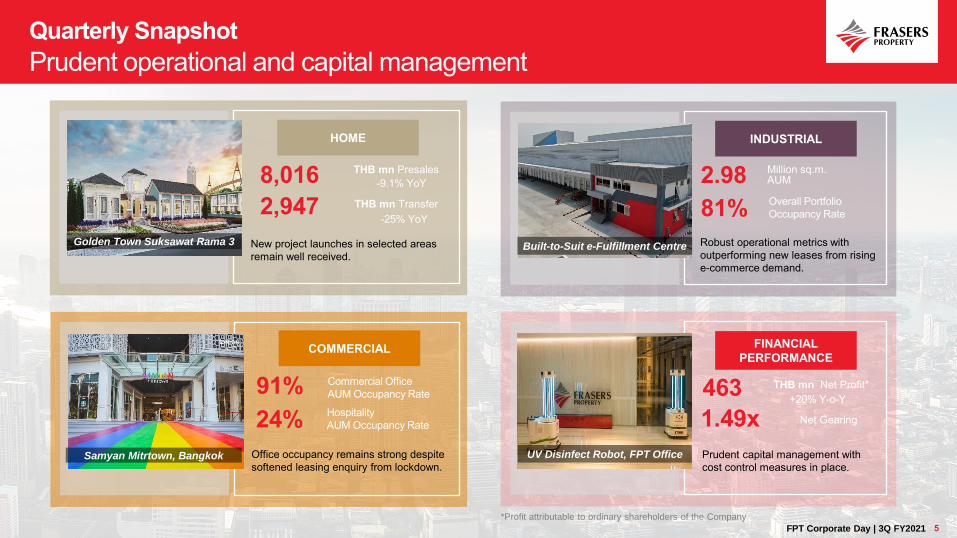
New project launches in selected areas
remain well received.
Office occupancy remains strong despite
softened leasing enquiry from lockdown.
Robust operational metrics with
outperforming new leases from rising
e-commerce demand.
Prudent capital management with
cost control measures in place.
2.98 Million sq.m.AUM
81%Overall Portfolio
Occupancy Rate
8,016 THB mn Presales
2,947 THB mn Transfer
91% Commercial Office
AUM Occupancy Rate
24%Hospitality
AUM Occupancy Rate
+20% Y-o-Y463 THB mn Net Profit*
1.49x Net Gearing
HOME INDUSTRIAL
COMMERCIAL
-9.1% YoY
-25% YoY
Built-to-Suit e-Fulfillment Centre
UV Disinfect Robot, FPT Office
5FPT Corporate Day | 3Q FY2021
Golden Town Suksawat Rama 3
Samyan Mitrtown, Bangkok
*Profit attributable to ordinary shareholders of the Company
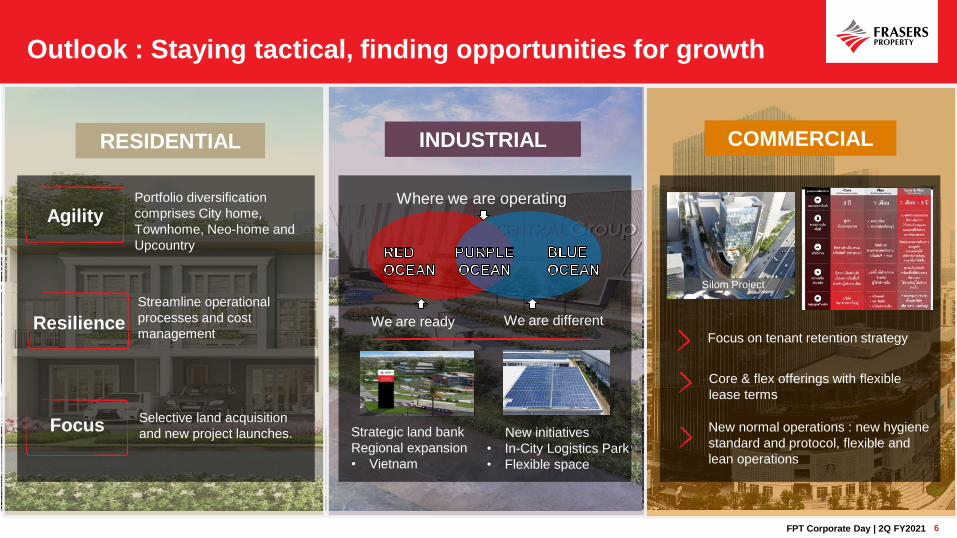
Outlook : Staying tactical, finding opportunities for growth
INDUSTRIAL COMMERCIALRESIDENTIAL
Streamline operational
processes and cost
managementResilience
Agility
Focus
Portfolio diversification
comprises City home,
Townhome, Neo-home and
Upcountry
Selective land acquisition
and new project launches.
Where we are operating
We are ready We are different
6FPT Corporate Day | 2Q FY2021
Strategic land bank
Regional expansion
• Vietnam
New initiatives
• In-City Logistics Park
• Flexible space
Focus on tenant retention strategy
Silom Project
Core & flex offerings with flexible
lease terms
New normal operations : new hygiene
standard and protocol, flexible and
lean operations

7FPT Corporate Day | 3Q FY2021 7
Demonstrated integrated property execution capabilites
7FPT Corporate Day | 3Q FY2021

8FPT Corporate Day | 3Q FY2021 8
FPT stands behind our stakeholders during COVID-19 situation
On-going support at our
construction sites
Converting our factory into
‘Community Isolation Center’
Vaccination Center at
Samyan Mitrtown

9FPT Corporate Day | 3Q FY2021
Frasers Property
Home
Golden Neo Ramintra-Wongwaen, Bangkok | Thailand
10FPT Corporate Day | 3Q FY2021
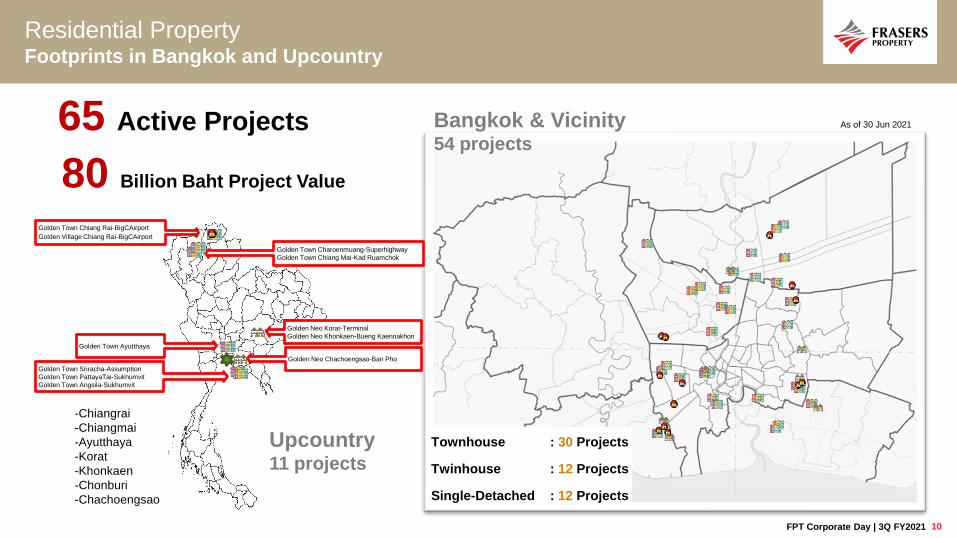
Residential PropertyFootprints in Bangkok and Upcountry
Bangkok & Vicinity54 projects
65 Active Projects
Golden Town Charoenmuang-Superhighway
Golden Town Chiang Mai-Kad Ruamchok
Golden Town Chiang Rai-BigCAirport
Golden Village Chiang Rai-BigCAirport
Golden Neo Korat-Terminal
Golden Neo Khonkaen-Bueng Kaennakhon
Golden Town Ayutthaya
Golden Town Sriracha-Assumption
Golden Town PattayaTai-Sukhumvit
Golden Town Angsila-Sukhumvit
Golden Neo Chachoengsao-Ban Pho
Upcountry11 projects
As of 30 Jun 2021
-Chiangrai
-Chiangmai
-Ayutthaya
-Korat
-Khonkaen
-Chonburi
-Chachoengsao
80 Billion Baht Project Value
Townhouse : 30 Projects
Twinhouse : 12 Projects
Single-Detached : 12 Projects

11FPT Corporate Day | 3Q FY2021
3,054 3,163 2,947
0
1,000
2,000
3,000
4,000
5,000
6,000
Oct-Dec Jan-Mar Apr-Jun Jul-Sep
FY2019 FY2020 FY2021
3,932 3,163 2,947
Apr 20 - Jun 20 Jan 21 - Mar 21 Apr 21 - Jun 21
6,6738,255 8,016
0
2,000
4,000
6,000
8,000
10,000
12,000
Oct-Dec Jan-Mar Apr-Jun Jul-Sep
FY2019 FY2020 FY2021
(THB mn)
Residential Presale Residential Revenue
(THB mn)
8,016 MB Presale in 3Q21
(THB mn)
8,819 8,255 8,016
Apr 20 - Jun 20 Jan 20 - Mar 21 Apr 21 - Jun 21
2,947 MB Revenue in 3Q21
(THB mn)9.1% YoY
Presale Revenue
TownhouseTownhome
50%
TwinhouseNeoHome
17%
Single-detached21%
Upcountry12%
Revenue by Product Categories
FY2020
2.9% QoQ
25% YoY
6.8% QoQ
TownhouseTownhome
47%
TwinhouseNeoHome
17%
Single-detached23%
Upcountry13%
9M21
3Q212Q213Q20
1Q 2Q 3Q 4Q 1Q 2Q 3Q 4Q
Residential PropertySales Performance
3Q212Q213Q20

12FPT Corporate Day | 3Q FY2021
1
3
11
3
11
1
2
Oct-Dec20
Jan-Mar21
Apr-Jun21
Jul-Sep21(F)
TH TWH SDH Upcountry
85
4
5
22
3
2
FY2020 FY2021(F)
Residential Property5 new projects launched in 3Q21 with social distancing procedures
FY21 Launch Plan
10% YoY
FY2021THB billion
# of projects
17Projects
14Projects
6Projects 5
Projects
2Projects
THB
2.1 Bn
THB
7.0 BnTHB
6.0 Bn
THB
20 BnTHB
18 Bn
TH | Ratchapruk Rama5
May-21
TH | Angsila-Sukhumvit
May-21TWH | Khonkaen
May-21
TWH | Siriraj-Ratchapruek
May-21
SDH | Suksawat Rama 3
Jun-21
1Projects
THB
2.5 Bn

13FPT Corporate Day | 3Q FY2021
Frasers Property
Industrial
Frasers Property Logistics Center Bangplee 2, Samutprakarn | Thailand

14FPT Corporate Day | 3Q FY2021
Industrial Property – Operational PerformanceRobust performance boosted by demand from e-commerce
Jun-20 Jun-21
Occ rate 82% 84%
WALE3.84
Years
4.00
Years
YTD Net add +36.5K sq.m.
Factory453
properties under
management
1.16mn sq.m.
AUM
Warehouse
properties under
management
445
1.82mn sq.m.
AUM
FPT262
properties under
management
0.95
Jun-20 Jun-21
Occ rate 80% 82%
YTD Net add -105.5K sq.m.1
Jun-20 Jun-21
Occ rate 80% 81%
YTD Net add +132.4K sq.m.
mn sq.m.AUM
FTREIT properties under
management
636
2.03mn sq.m.
AUM
+26.9K sq.m. YTD Net Add for total portfolio of asset under management Breakdown of
industrial property tenants
Jun-20 Jun-21
Occ rate 77% 77%
WALE1.92
Years
1.69
Years
YTD Net add -9.6K sq.m.
COUNTRY/
REGION
INDUSTRY
Japan33.0%
Thailand 22.0%Germany
12.7%
USA 4.9%
China 4.7%
Singapore4.7%
Others18.0%
Logistic/Warehouse
Operator 31.5%
Auto 17.5%
Electronics/Computer13.1%
Consumer Products 6.4%
Plastic Injection/ Products 4.0%
Trading/ Retail/ Wholesale 3.7%
Others23.8%
1Includes transferred assets to FTREIT in Oct-20, Dec-20 and Feb-21 with leased space of 141,284 sqm.FPT Corporate Day | 3Q FY2021 14

15FPT Corporate Day | 3Q FY2021
Industrial Property – Construction scheduled on targets
Frasers Property Logistics Park, Khonkaen
April 2021Completion & handover
9K sqm NLA
Built-to-suit project with
customer-centric design
Frasers Property Logistics Center, Wangnoi Ayutthaya
July 2021 Completion & handover
21K sqm Industrial GFA
On-time project delivery in July 2021
Robot-based storage
solution
Smart working area with
high quality fittings
Racking, Loading-Unloading
with Dock Levelers
Customer centric design
for sustainable workplace

16FPT Corporate Day | 3Q FY2021
Industrial Property – Launch of new logistics center in Bangplee
Cluster effect in strategic locations to enhance
competitiveness.
First phase of 44,000 sqm has secured >60%
commitment from top-tier logistics players.
Frasers Property Logistics Center, Bangplee 7Unique facility with FM Global standards, GMP compliance, and certified LEED Gold
Land AreaTotal
Built Area
Target
Competition
Over 80 Rai 74K sq.m.2QFY2022
(1st Phase)
16FPT Corporate Day | 3Q FY2021

17FPT Corporate Day | 3Q FY2021
Frasers Property
Commercial
FYI Center, Bangkok | Thailand

18FPT Corporate Day | 3Q FY2021
Commercial Property – Prime Development Portfolio
OFFICE
TOTAL ~209,000 SQM AUM
91%OCCUPANCY
28,000FOOT TRAFFIC
PEOPLE / DAY
24%OCCUPANCY
NLA ~30,300 SQM NUMBER OF KEYS
~1,100 ROOM KEY
RETAIL HOSPITALITY

19FPT Corporate Day | 3Q FY2021
Office Leasing Performance
239k sq.m.Total asset under management (AUM)
As at 30 Jun 2021
Portfolio
Overview92%End of 3Q/2021
As at 30 Jun 2021
NLA 11,231 sq.m NLA 50,021 sq.m NLA 46,995 / 30,337 sq.m. NLA 73,035 sq.m NLA 27,477 sq.m
Occ%* 68% ▼1pp QoQ Occ%* 95% flat QoQ Occ%*Office 83% flat QoQ
Retail 97% ▲2pp QoQOcc%* 94% flat QoQ Occ%* 97% ▲2pp QoQ
Asking
RentTHB 600/sq.m
Asking
RentTHB 900/sq.m
Asking
RentTHB 1,200/sq.m
Asking
RentTHB 1,100/sq.m
Asking
RentTHB 1,500/sq.m
Goldenland Building FYI Center Mitrtown Office Tower / Retail Sathorn Square Park Ventures Ecoplex
REIT Management
*End of period
Flat QoQ

20FPT Corporate Day | 3Q FY2021
Hospitality Performance
Shareholding 33% Shareholding 60% Shareholding 20% Shareholding 49% Shareholding 100%
# of Keys 159 # of Keys 177 # of Keys 403 # of Keys 102 # of Keys 238
Occ%*64%
▲12pp QoQOcc%*
49%
▲13pp QoQOcc%*
9%
▼10pp QoQOcc%*
31%
▲9pp QoQOcc%* n/a
24%Quarterly Average
For 3Q/2021
~1,100 roomsHigh-rise Residential
Serviced Apartment & Hotel
Mayfair Marriott
Executive Apartment
The Ascott Sathorn
and Sky VillasW Hotel Bangkok Triple Y Hotel Modena by Fraser Bangkok
Portfolio
Overview24%End of Period
As of Jun-2021
*End of period
▲3pp QoQ flat QoQ

21FPT Corporate Day | 3Q FY2021
Financial Performance

22FPT Corporate Day | 3Q FY2021
3Q21 and 9M21 Financial Metrics
Unit: THB
3Q 2021
(Apr – Jun 2021)YoY
9M 2021
(Oct 20 – Jun 21)YoY
Total revenue 3,845 mn(22)% 4,937 mn in 3Q20
12,278 mn(16)% 14,649 mn in 9M20
Total expenses1 3,431 mn(23)%4,475 mn in 3Q20
10,824 mn(16)% 12,839 mn in 9M20
Net profit
(excl. NCI)463 mn
20%385 mn in 3Q20
1,428 mn(5.1)% 1,506 mn in 9M20
Net profit margin2 12.1%4.3pp 7.8% in 3Q20
11.6 %1.4pp 10.3% in 9M20
EPS3 THB 0.205.2% THB 0.19 in 3Q20
THB 0.62(18)% THB 0.75 in 9M20
Net IBD/E 1.49x as of Jun 21 +0.1x
1.39X as of Sep 20
1 Include operating costs, SG&A, and finance costs2 Net profit margin (NPM) is calculated by dividing profit attributable to ordinary shareholders of the Company by total revenue3 Earnings per share (EPS) is calculated by dividing profit attributable to ordinary shareholders of the Company by the weighted average number of ordinary shares outstanding during the year
23FPT Corporate Day | 3Q FY2021
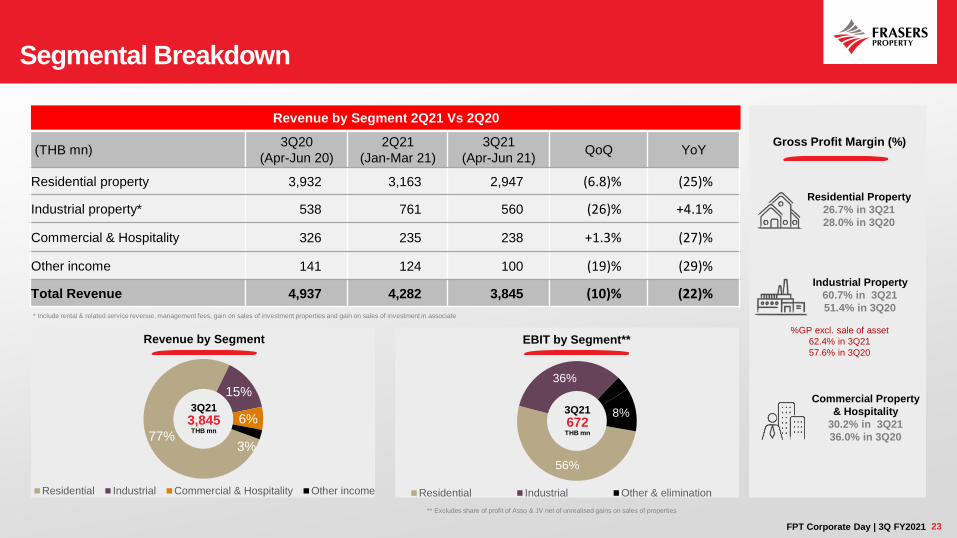
Segmental Breakdown
Revenue by Segment 2Q21 Vs 2Q20
(THB mn)3Q20
(Apr-Jun 20)
2Q21
(Jan-Mar 21)
3Q21
(Apr-Jun 21)QoQ YoY
Residential property 3,932 3,163 2,947 (6.8)% (25)%
Industrial property* 538 761 560 (26)% +4.1%
Commercial & Hospitality 326 235 238 +1.3% (27)%
Other income 141 124 100 (19)% (29)%
Total Revenue 4,937 4,282 3,845 (10)% (22)%
Gross Profit Margin (%)
Residential Property
26.7% in 3Q21
28.0% in 3Q20
Industrial Property
60.7% in 3Q21
51.4% in 3Q20
Commercial Property
& Hospitality
30.2% in 3Q21
36.0% in 3Q20
%GP excl. sale of asset
62.4% in 3Q21
57.6% in 3Q20
Revenue by Segment EBIT by Segment**
** Excludes share of profit of Asso & JV net of unrealised gains on sales of properties
* Include rental & related service revenue, management fees, gain on sales of investment properties and gain on sales of investment in associate
77%
15%
6%
3%
Residential Industrial Commercial & Hospitality Other income
3Q21
3,845THB mn
56%
36%
8%
Residential Industrial Other & elimination
3Q21
672THB mn
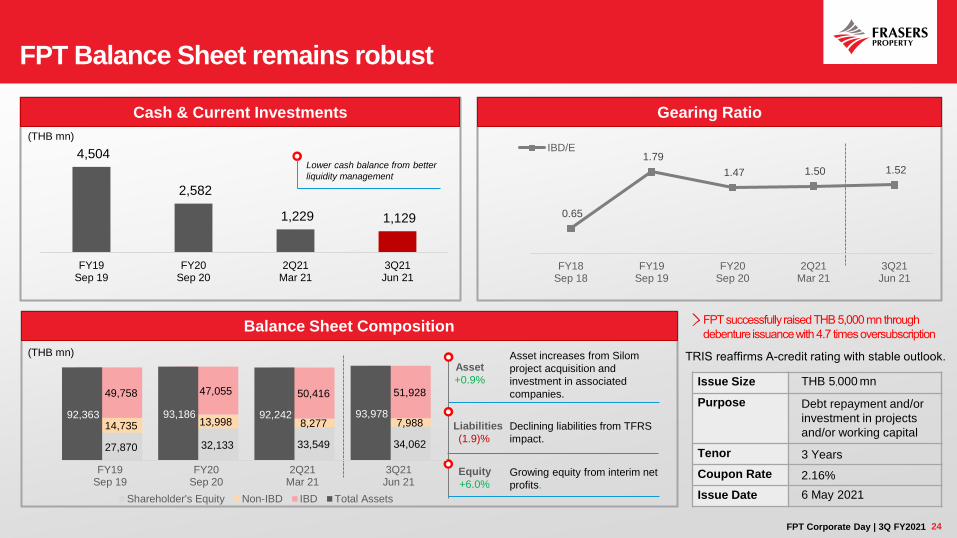
24FPT Corporate Day | 3Q FY2021
FPT Balance Sheet remains robust
Gearing RatioCash & Current Investments
4,504
2,582
1,229 1,129
FY19Sep 19
FY20Sep 20
2Q21Mar 21
3Q21Jun 21
Lower cash balance from better
liquidity management
(THB mn)
Balance Sheet Composition
Asset
+0.9%
Liabilities
(1.9)%
Equity
+6.0%
(THB mn)
Asset increases from Silom
project acquisition and
investment in associated
companies.
Declining liabilities from TFRS
impact.
Growing equity from interim net
profits.
0.65
1.79
1.47 1.50 1.52
FY18Sep 18
FY19Sep 19
FY20Sep 20
2Q21Mar 21
3Q21Jun 21
IBD/E
Issue Size THB 5,000 mn
Purpose Debt repayment and/or
investment in projects
and/or working capital
Tenor 3 Years
Coupon Rate 2.16%
Issue Date 6 May 2021
27,870 32,133 33,549 34,062
14,735 13,998 8,277 7,988
49,758 47,055 50,416 51,928
92,363 93,186 92,242 93,978
FY19Sep 19
FY20Sep 20
2Q21Mar 21
3Q21Jun 21
Shareholder's Equity Non-IBD IBD Total Assets

25FPT Corporate Day | 3Q FY2021
Profit & Loss statement (THB mn)3Q20
(Apr-Jun 20)
3Q21
(Apr-Jun 21)YoY %
9M20
(Oct 19-Jun 20)
9M21
(Oct 20-Jun 21)YoY %
Total revenue 4,937 3,845 (22)% 14,649 12,278 (16)%
Revenue from sales of real estate 3,932 2,947 (25)% 11,142 9,163 (18)%
Rental and related service revenue 677 545 (19)% 2,064 1,662 (19)%
Revenue from hotel business 33 45 34% 290 119 (59)%
Management fee income 148 185 25% 475 534 12%
Gain on sale of investment properties 10 20 97% 40 536 1238%
Gain on sale of investment in associate - 4 n/a 384 4 (99)%
Total cost and expenses* 4,186 3,173 (24)% 11,999 10,023 (16)%
Share of profits of Asso & JV, net of unrealized gains on
sales of properties 12 119 907% 68 117 73%
Distribution costs and administrative expenses (916) (645) (30)% (2,682) (2,219) (17)%
Finance cost (289) (258) (11)% (840) (800) (4.7)%
Corporate tax expense (74) (73) (1.3)% (318) (248) (22)%
Profit for the period 400 459 15% 1,560 1,416 (9.2)%
>> Attributable to major shareholder 385 463 20% 1,506 1,428 (5.1)%
Net profit margin** 7.79% 12.05% 4.3pp 10.28% 11.63% 1.4pp
Earnings Per Share** (Unit in THB) 0.19 0.20 5.2% 0.75 0.62 (18)%
* Excludes finance cost **Calculated by profit attributable to owner of the company over total revenue

26FPT Corporate Day | 3Q FY2021


