Page 1 FRASERS HOSPITALITY TRUST FINANCIAL STATEMENTS ANNOUNCEMENT FOR THE FOURTH QUARTER ENDED 30 SEPTEMBER 2016 * Based on STR Global Chain Scales Distribution Policy Distributions from FHT comprises distributions from FH-REIT and FH-BT. The distribution will be made on a semi-annual basis for the six-month periods ending 31 March, and 30 September. Distributions, when paid, will be in Singapore dollars. Fraser Suites Singapore Upper Upscale Market Segment* Number of Units Upscale 328 Serviced Residences 2,692 Maritim Hotel Dresden 255 Total Market Segment* Luxury Luxury Mid-scale Mid-scale Mid-scale Upper Upscale 406 Number of Rooms Sofitel Sydney Wentworth The Westin Kuala Lumpur ANA Crowne Plaza Kobe Best Western Cromwell London 230 436 171 85 593 Park International London 443 Novotel Rockford Darling Harbour FH-REIT’s distribution policy is to distribute 100.0% of FH-REIT’s Distributable Income for the period from the Listing Date to 30 September 2015 and at least 90.0% of its Distributable Income thereafter. 201 Fraser Place Canary Wharf Upper Upscale 108 Fraser Suites Queens Gate Upper Upscale 105 Fraser Suites Glasgow Upper Upscale 98 Fraser Suites Edinburgh Upper Upscale 75 Total Frasers Hospitality Trust (“FHT”) is a stapled group comprising Frasers Hospitality Real Estate Investment Trust (“FH-REIT”) and Frasers Hospitality Business Trust (“FH-BT”). FHT is established with the principal investment strategy of investing, directly or indirectly, in a diversified portfolio of income-producing real estate located anywhere in the world except Thailand, which is used primarily for hospitality and/or hospitality-related purposes, as well as real estate- related assets in connection to the foregoing. The portfolio of FHT comprises 14 properties, eight hotels (the “Hotels”) and six serviced residences (the “Serviced Residences”, and together with the Hotels, the “Properties”), with a total of 2,692 hotel rooms and 842 serviced residence units. The Properties are located in Singapore, Australia, the United Kingdom, Japan, Malaysia and Germany. FH-BT was dormant as at the Listing Date and no distributions will be made during the period that FH-BT remains dormant. In the event that FH-BT becomes active and profitable, FH-BT’s distribution policy will be to distribute as much of its income as practicable, and the declaration and payment of distributions by FH-BT will be at the sole discretion of Board of Directors of the Trustee-Manager. Upper Upscale InterContinental Singapore Fraser Suites Sydney Upper Upscale 842 Hotels
Transcript
Page 1
FRASERS HOSPITALITY TRUSTFINANCIAL STATEMENTS ANNOUNCEMENTFOR THE FOURTH QUARTER ENDED 30 SEPTEMBER 2016
* Based on STR Global Chain Scales
Distribution Policy
Distributions from FHT comprises distributions from FH-REIT and FH-BT.
The distribution will be made on a semi-annual basis for the six-month periods ending 31 March, and 30 September. Distributions, when paid, will be in Singapore dollars.
Fraser Suites Singapore Upper UpscaleMarket Segment* Number of Units
Upscale 328
Serviced Residences
2,692Maritim Hotel Dresden
255
Total
Market Segment*
LuxuryLuxury
Mid-scale
Mid-scaleMid-scale
Upper Upscale
406
Number of Rooms
Sofitel Sydney Wentworth
The Westin Kuala LumpurANA Crowne Plaza Kobe
Best Western Cromwell London
230436
17185
593
Park International London
443
Novotel Rockford Darling Harbour
FH-REIT’s distribution policy is to distribute 100.0% of FH-REIT’s Distributable Income for the period from the Listing Date to 30 September 2015 and at least 90.0% of its Distributable Income thereafter.
Frasers Hospitality Trust (“FHT”) is a stapled group comprising Frasers Hospitality Real Estate Investment Trust (“FH-REIT”) and Frasers Hospitality Business Trust (“FH-BT”). FHT is established with the principal investment strategy ofinvesting, directly or indirectly, in a diversified portfolio of income-producing real estate located anywhere in the world except Thailand, which is used primarily for hospitality and/or hospitality-related purposes, as well as real estate-related assets in connection to the foregoing.
The portfolio of FHT comprises 14 properties, eight hotels (the “Hotels”) and six serviced residences (the “Serviced Residences”, and together with the Hotels, the “Properties”), with a total of 2,692 hotel rooms and 842 servicedresidence units. The Properties are located in Singapore, Australia, the United Kingdom, Japan, Malaysia and Germany.
FH-BT was dormant as at the Listing Date and no distributions will be made during the period that FH-BT remains dormant. In the event that FH-BT becomes active and profitable, FH-BT’s distribution policy will be to distribute as much ofits income as practicable, and the declaration and payment of distributions by FH-BT will be at the sole discretion of Board of Directors of the Trustee-Manager.
Upper Upscale
InterContinental Singapore
Fraser Suites Sydney Upper Upscale
842
Hotels
Page 2
FRASERS HOSPITALITY TRUSTFINANCIAL STATEMENTS ANNOUNCEMENTFOR THE FOURTH QUARTER ENDED 30 SEPTEMBER 2016
1 (a) (i) Consolidated Statements of Total Return and Statements of Comprehensive Income for 4Q 2016 and 4Q 2015
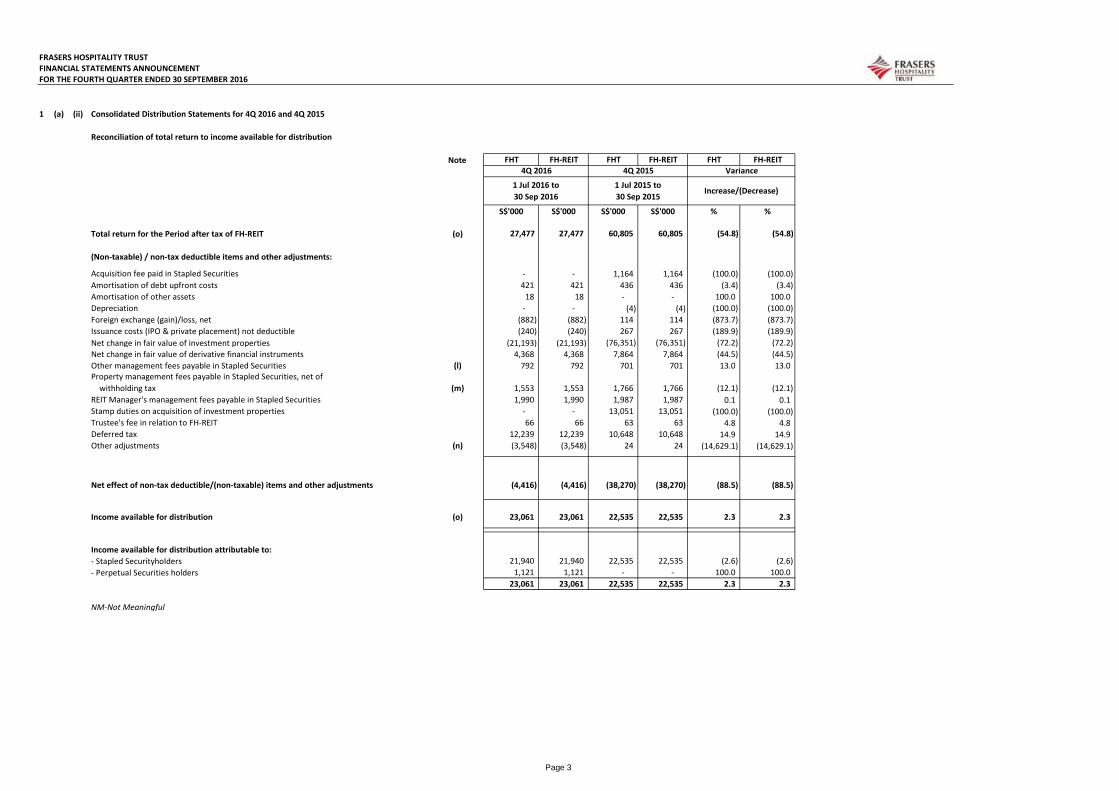
Income available for distribution attributable to: - Stapled Securityholders 21,940 21,940 22,535 22,535 (2.6) (2.6) - Perpetual Securities holders 1,121 1,121 - - 100.0 100.0
23,061 23,061 22,535 22,535 2.3 2.3
NM-Not Meaningful
4Q 2015
Acquisition fee paid in Stapled Securities
4Q 2016
Property management fees payable in Stapled Securities, net of withholding tax
Income available for distribution
Variance
1 Jul 2016 to 30 Sep 2016
Stamp duties on acquisition of investment properties
Net effect of non-tax deductible/(non-taxable) items and other adjustments
Increase/(Decrease)1 Jul 2015 to 30 Sep 2015
Total return for the Period after tax of FH-REIT
Page 4
FRASERS HOSPITALITY TRUSTFINANCIAL STATEMENTS ANNOUNCEMENTFOR THE FOURTH QUARTER ENDED 30 SEPTEMBER 2016
Footnotes:
(a)
(b)
(c)
(d)
(e)
(f)
(g)
(h) This relates to net realised gain arising from the settlement of foreign currency forward contracts.
(i) This relates to current and deferred tax of S$1.06 million and S$12.24 million respectively. (4Q 2015: S$2.13 million and S$10.65 million)
(j) This relates to fair value gain arising from the IRS contracts.
(k)
(l) MIT Manager's management fee which is payable in Stapled Securities.
(m) Property management fee includes service residences management fee and trademark licence fee which are paid and payable in Stapled Securities.
(n) Other adjustments are in relation to non-tax deductible and non-taxable items.
(o)
The credit amounts relate to capitalisation of stamp duty and professional fees incurred in relation to acquistion of the freehold property, Maritim Hotel Dresden, Germany in June 2016.
Administrative and other expenses mainly relates to professional fees, audit fees, tax fees and irrecoverable GST.
This relates to net unrealised loss arising mainly from fair valuation of the JPYSGD cross currency swap.
The payment top-up of S$3.12 million in 4Q 2015 comprises (a) S$2.62 million and (b) S$0.5 million in relation to InterContinental Singapore and Fraser Suites Singapore respectively. Thepayment top-up had been fully paid for Fraser Suites Singapore in 1Q 2016 and InterContinental Singapore in 2Q 2016. The renovation of InterContinental Singapore commenced in 3Q 2015 andwas completed in 2Q 2016.
The net change in fair value of investment properties relates to the net fair value gains arising from the measurement of the Group's investment properties at fair value based on valuationsperformed by independent valuers as at 30 September 2016.
The credit amounts relate to write back of over-accrual of non-capitalisable expenses in relation to assets acquistion and IPO and the private placement in July 2015.
Finance costs in 4Q 2016 comprise interest expenses on FH-REIT Group's borrowings in SGD, JPY, MYR and AUD as well as net interest expense arising from the interest rate swap ("IRS") andcross currency swap contracts.
This relates to exchange differences arising from translation of the results and the financial positon of all the Group entities with functional currencies other than the Singapore dollar. The foreigncurrency translation gain in 4Q 2016 was mainly due to appreciation of AUD, EUR and JPY against SGD, which was partially offset by the depreciation of GBP and MYR against SGD.
Distribution of FHT represents the aggregate of distributions by FH-REIT and FH-BT. The income available for distribution of FHT for the fourth quarter ended 30 Sep 2016 and for the period from1 Jul 2015 to 30 Sep 2015 are contributed solely by FH-REIT as FH-BT was dormant during the period. Accordingly, only the income available for distribution of FH-REIT has been included for thepurpose of calculating the Distribution per Stapled Security.
Page 5
FRASERS HOSPITALITY TRUSTFINANCIAL STATEMENTS ANNOUNCEMENTFOR THE FOURTH QUARTER ENDED 30 SEPTEMBER 2016
1 (a) (i) Consolidated Statements of Total Return and Statements of Comprehensive Income for YTD 30 Sepember 2016 and YTD 30 September 2015
Trustee's fee in relation to FH-REIT 257 257 298 298 (13.8) (13.8) Deferred tax 12,239 12,239 11,612 11,612 5.4 5.4 Other adjustments (o) 178 178 54 54 229.6 229.6
Net effect of non-tax deductible/(non-taxable) items and other adjustments 24,559 24,559 (41,742) (41,742) NM NM
(p) 86,679 86,679 93,727 93,727 (7.5) (7.5)
Income available for distribution attributable to: - Stapled Securityholders 84,948 84,948 93,727 93,727 (9.4) (9.4) - Perpetual Securities holders 1,731 1,731 - - 100.0 100.0
86,679 86,679 93,727 93,727 (7.5) (7.5)
NM-Not Meaningful
Property management fees paid and payable in Stapled Securities, net of withholding tax
14 Jul 2014 to 30 Sep 2015 (a)
REIT Manager's management fees paid and payable in Stapled Securities
Income available for distribution
Stamp duties on acquisition of investment properties
VarianceYTD 30 September 2016 YTD 30 September 2015
Acquisition fee paid in Stapled Securities
1 Oct 2015 to 30 Sep 2016
Increase/(Decrease)
Total return for the Period after tax of FH-REIT
Page 7
FRASERS HOSPITALITY TRUSTFINANCIAL STATEMENTS ANNOUNCEMENTFOR THE FOURTH QUARTER ENDED 30 SEPTEMBER 2016
Footnotes:
(a)
(b)
(c)
(d)
(e)
(f)
(g)
(h)
(i)
(j) This relates to realised gain arising from the settlement of foreign currency forward contracts.
(k) This relates to current tax and deferred tax of S$4.3million and S$12.2 million respectively. (2015: S$6.3million and S$11.6million)
(l)
(m) MIT Manager's management fee which is paid and payable in Stapled Securities.
(n) Property management fee includes service residences management fee and trademark licence fee which are paid and payable in Stapled Securities.
(o) Other adjustments are in relation to non-tax deductible items.
(p)
Administrative and other expenses included in YTD 30 Sep 2015 was an impairment loss on goodwill of approximately S$4.3 million which arose from the acquisition of the entities that hold ANACrowne Plaza Kobe. Decrease in adminstrative expense in the current year is mainly attributable to a decrease in professional fees.
This mainly relates to unrealised loss arising from fair valuation of the JPYSGD cross currency swap and foreign currency forward contracts and the unrealised gain arising from the fair valuationof the EURSGD cross currency swap contract.
The payment top-up of S$2.91 million in YTD 30 Sep 2016 comprises (a) S$2.58 million and (b) S$0.33 million in relation to InterContinental Singapore and Fraser Suites Singapore respectively.The decrease in payment top-up of S$3.88 million as compared to YTD 30 Sep 2015 was because to the payment top-up had been fully paid for Fraser Suites Singapore in 1Q 2016 andInterContinental Singapore in 2Q 2016. The renovation of the InterContinental Singapore commenced in 3Q 2015 and was completed in 2Q 2016.
The acquisition fee paid to the REIT Manager in 2016 is in stapled securities in relation to the acquisition of the freehold property, Maritim Hotel Dresden, Germany in June 2016.
The expenses comprise miscellaneous expenses incurred in relation to other asset acquisiton.
Under the Listing Manual, FHT is required to present a comparative statement for the corresponding period of the immediately preceding financial year. As FHT was listed on 14 July 2014("Listing Date"), FHT had obtained from the SGX-ST a waiver from reporting its first quarter results for the period from Listing Date till 30 September 2014. Accordingly, only the financialstatements for the period from 1 July 2015 to 30 September 2015 are available for comparison. The financial statements for the period from 1 October 2014 to 30 September 2015 are notavailable for comparison and in lieu thereof, the comparative statement for a longer period from the Listing Date to 30 September 2015 is presented.
Included in YTD 30 Sep 2015 were stamp duties paid in relation to the acquisition of the United Kingdom and Australia properties of approximately S$25 million and one-off non-capitalisableissuance costs including initial public listing fee, registry fee, advertisements, design & printing of prospectus and roadshow expenses etc. In YTD 30 Sep 2016, there was S$0.24 millon write backof over-accrual of non-capitalisable expenses in relation to assets acquistion and IPO and the private placement in July 2015.
Distribution of FHT represents the aggregate of distributions by FH-REIT and FH-BT. The income available for distribution of FHT for the period from 1 April 2016 to 30 September 2016 and for theperiod from 14 July 2014 to 30 September 2015 are contributed solely by FH-REIT as FH-BT was dormant during the period. Accordingly, only the income available for distribution of FH-REIT hasbeen included for the purpose of calculating the Distribution per Stapled Security.
This relates to exchange differences arising from translation of the results and the financial positon of all the Group entities with functional currencies other than the Singapore dollar. The foreigncurrency translation loss in YTD 30 Sep 2016 was mainly due to appreciation of AUD and JPY against SGD, which was partially offset by the depreciation of GBP, MYR and EUR against SGD.
The net change in fair value of investment properties relates to the net fair value gains arising from the measurement of the Group's investment properties at fair value based on valuationsperformed by independent valuers as at 30 September 2016.
Finance costs comprise interest expenses on FH-REIT's Group borrowings in SGD, JPY, MYR and AUD as well as net interest expense arising from the IRS and cross currency swap contracts.Interest expense was higher in YTD 30 Sep 2016 mainly because the AUD borrowings were only incurred in Q4 2015. As at 30 Sep 2016, 86% of FH-REIT's Group debt portfolio was secured at fixedinterest rates with remaining 14% at floating interest rates.
Page 8
FRASERS HOSPITALITY TRUSTFINANCIAL STATEMENTS ANNOUNCEMENTFOR THE FOURTH QUARTER ENDED 30 SEPTEMBER 2016
1 (b) (i) Statements of Financial Position FHT FH-REIT FH-BT FHT FH-REIT FH-BT
FRASERS HOSPITALITY TRUSTFINANCIAL STATEMENTS ANNOUNCEMENTFOR THE FOURTH QUARTER ENDED 30 SEPTEMBER 2016
Footnotes:
(a)
(b)
(c)
(d)
(e) The net current liability position as at 30 September 2016 was mainly due to Facility A of S$615 million Term Loan Facilities due within the next 12 months.
(f)
(g) This relates to issue of S$100 million fixed rate subordinated perpetual securities.
Amount repayable in one year or less, or on demand - 128,925(1) - - Amount repayable after one year * 31,294(2) 649,788(3) 30,882(2) 754,121(3)
* net of transaction costs
Details of borrowings and collateral:
(1)
(2)
(3)
As at 30 Sep 2016, derivative financial instruments (non-current liabilities) relate to fair value of the JPYSGD cross currency swap and IRS. As compared to 30 September 2015, the fair value of theJPYSGD cross currency swap and IRS were in a asset position.
As at 30 Sep 2015
The secured borrowing was drawn under the MYR95 million Senior Bond and the interest rate on these borrowings is 4.9% p.a.. The Senior Bond will mature 5 years from 14 July 2014 and issecured by the property, The Westin Kuala Lumpur.
The increase is mainly due to the payment of a 10% deposit amounting to A$23.7 million pursuant to the Hotel Assets SPA and Property SPA as announced by FHT on 9 September 2016 on
The unsecured borrowings were Facility A of S$615 million Term Loan Facilities due on 14 July 2017 and short-term unsecured borrowings of S$14.2 million drawn from a revolving credit facilityof S$25 million with DBS Bank Ltd.
Short-term borrowings comprise of (i) Facility A of S$615 million Term Loan Facilities that is due within the next 12 months and (ii) short-term unsecured borrowings of S$14.2 millon drawn froma revolving credit facility of S$25 million.
As at 30 Sep 2016
The unsecured borrowings were drawn from (i) Facility B of S$615 million of Term Loan Facilities with loan maturities of five-year terms from 14 July 2014, (ii) the JPY2.35 billion Kobe ExcellenceTMK series 1 Bonds maturing 5 years from 14 July 2014 and (iii) A$117.2 million of Term Loan Facility maturing 3 years from 7 July 2015.
FHT
As at 30 September 2016, derivative financial instruments (non-current assets) relate to fair value of the EURSGD cross currency swap (30 September 2015: JPYSGD CCS and IRS).
FHT
This mainly comprise trade creditors, GST payable, provision for withholding tax and property tax, accruals for interest expense payable to banks, accruals for professional fees and accruals forREIT manager and property management fees.
Page 10
FRASERS HOSPITALITY TRUSTFINANCIAL STATEMENTS ANNOUNCEMENTFOR THE FOURTH QUARTER ENDED 30 SEPTEMBER 2016
1,024 1,024 - (504) (504) - 1,037 1,037 - 411 411 - Cash and cash equivalents at end of the financial Period/year 64,385 64,381 4 52,308 52,298 10 64,385 64,381 4 52,308 52,298 10
For the purpose of the consolidated cash flow statement, cash and cash equivalents comprise the following:
FHT FH-REIT FH-BT FHT FH-REIT FH-BT
S$'000 S$'000 S$'000 S$'000 S$'000 S$'000Cash and cash equivalent comprise:Cash and bank balances 62,172 62,168 4 46,102 46,092 10Fixed deposits 2,213 2,213 - 6,206 6,206 - Cash and cash equivalents 64,385 64,381 4 52,308 52,298 10
Footnotes:(a)
1 Oct 2015 to 30 Sep 2016 14 Jul 2014 to 30 Sep 2015 (a)1 Jul 2015 to 30 Sep 2015
Under the Listing Manual, FHT is required to present a comparative statement for the corresponding period of the immediately preceding financial year. As FHT was listed on 14 July 2014 ("Listing Date"), FHT had obtained from the SGX-ST a waiver from reporting its first quarter results for the period from Listing Date till 30 September 2014. Accordingly, only the financial statements for the period from 1 July 2015 to 30 September 2015 are available for comparison.The financial statements for the period from 1 October 2014 to 30 September 2015 are not available for comparison and in lieu thereof, the comparative statement for a longer period from the Listing Date to 30 September 2015 ispresented.
Effect of exchange rate changes on cash and cash equivalents
YTD 30 September 2015
4Q 2016 4Q 2015 YTD 30 September 2016 YTD 30 September 20151 Jul 2016 to 30 Sep 2016
Deposits placed in relation to acquisition of assets and business
Cash and cash equivalents at beginning of the financial Period/year
YTD 30 September 20161 Oct 2015 to 30 Sep 2016 14 Jul 2014 to 30 Sep 2015 (a)
Page 12
FRASERS HOSPITALITY TRUSTFINANCIAL STATEMENTS ANNOUNCEMENTFOR THE FOURTH QUARTER ENDED 30 SEPTEMBER 2016
1 (d) (i) Statements of Changes in Stapled Securityholders' Funds
Foreigncurrency
Issue Revenue Hedging translationcosts reserves reserve reserve Total
At 1 Oct 2015 1,185,539 (23,686) 63,280 6,599 (59,450) 1,172,282 - 1,172,282 Total return for the Period, net of tax - - 34,641 - - 34,641 - 34,641 Total return for the Period attributable to Perpetual Securities holders - - (610) - - (610) - (610) Other comprehensive incomeEffective portion of changes in fair value change of cash flow hedges - - - (9,400) - (9,400) - (9,400) Net change in fair value of cash flow hedges reclassified to total return - - - (1,028) - (1,028) - (1,028) Foreign currency translation differences - - - - (46,105) (46,105) - (46,105) Total comprehensive income for the Period, net of tax - - - (10,428) (46,105) (56,533) - (56,533)
Contributions by and distributions to Stapled SecurityholdersREIT Manager's management fees paid in Stapled Securities 7,808 - - - - 7,808 - 7,808 Other management fees paid in Stapled Securities 2,398 - - - - 2,398 - 2,398 Property management fees paid in Stapled Securities 6,154 - - - - 6,154 - 6,154 Acquisition fee paid in Stapled Securities 902 - - - - 902 - 902 Distributions to Stapled Securityholders - - (63,597) - - (63,597) - (63,597)
Total contributions by and distributions to Stapled Securityholders 17,262 - (63,597) - - (46,335) - (46,335)
At 30 Jun 2016 1,202,801 (23,686) 33,714 (3,829) (105,555) 1,103,445 - 1,103,445
Total return for the Period, net of tax - - 27,461 - - 27,461 - 27,461 Total return for the Period, attributable to Perpetual Securities holders - - (1,121) - - (1,121) - (1,121) Other comprehensive incomeEffective portion of changes in fair value change of cash flow hedges - - - 325 - 325 - 325 Net change in fair value of cash flow hedges reclassified to total return - - - (836) - (836) - (836) Foreign currency translation differences - - - - 14,413 14,413 - 14,413 Total comprehensive income for the Period, net of tax - - - (511) 14,413 13,902 - 13,902
Contributions by and distributions to Stapled SecurityholdersIssue costs - 204 - - - 204 - 204 Total contributions by and distributions to Stapled Securityholders - 204 - - - 204 - 204 Stapled Securityholders' funds at 30 Sep 2016 1,202,801 (23,482) 60,054 (4,340) (91,142) 1,143,891 - 1,143,891
Stapled Securityholders of the TrustPerpetual Securities holders of the Trust
Stapled securities in issue Total
Attributable to
Page 13
FRASERS HOSPITALITY TRUSTFINANCIAL STATEMENTS ANNOUNCEMENTFOR THE FOURTH QUARTER ENDED 30 SEPTEMBER 2016
1 (d) (i) Statements of Changes in Stapled Securityholders' Funds
Foreigncurrency
Issue Revenue Hedging translationcosts reserves reserve reserve Total
At 14 Jul 2014 (a) - - - - - - - - Total return for the Period, net of tax - - 74,662 - - 74,662 - 74,662
Other comprehensive incomeEffective portion of changes in fair value change of cash flow hedges - - - 5,921 - 5,921 - 5,921 Net change in fair value of cash flow hedges reclassified to total return - - - (2,239) - (2,239) - (2,239) Foreign currency translation differences - - - - (53,857) (53,857) - (53,857)
Total comprehensive income for the Period, net of tax - - - 3,682 (53,857) (50,175) - (50,175)
Contributions by and distributions to Stapled SecurityholdersIssuance of new Stapled Securities 1,049,513 - - - - 1,049,513 - 1,049,513 Issue costs - (21,238) - - - (21,238) - (21,238) REIT Manager's management fees paid in Stapled Securities 5,544 - - - - 5,544 - 5,544 Other management fees paid in Stapled Securities 917 - - - - 917 - 917 Property management fees paid in Stapled Securities 4,185 - - - - 4,185 - 4,185 Distribution Reinvestment Plan 1,216 - - - - 1,216 - 1,216 Distributions to Stapled Securityholders - - (44,449) - - (44,449) - (44,449)
Total contributions by and distributions to Stapled Securityholders 1,061,375 (21,238) (44,449) - - 995,688 - 995,688 At 30 Jun 2015 1,061,375 (21,238) 30,213 3,682 (53,857) 1,020,175 - 1,020,175
Total return for the Period, net of tax - - 60,805 - - 60,805 - 60,805 Total return for the Period, attributable to Perpetual Securities holders - - - - - - - - Other comprehensive incomeEffective portion of changes in fair value change of cash flow hedges - - - 3,696 - 3,696 - 3,696 Net change in fair value of cash flow hedges reclassified to total return - - - (779) - (779) - (779) Foreign currency translation differences - - - - (5,593) (5,593) - (5,593) Total comprehensive income for the Period, net of tax - - - 2,917 (5,593) (2,676) - (2,676)
At 1 Oct 2015 1,185,529 (23,686) 63,282 6,599 (59,450) 1,172,274 - 1,172,274 Total return for the Period, net of tax - - 34,643 - - 34,643 - 34,643 Total return for the Period attributable to Perpetual Securities holders - - (610) - - (610) - (610) Other comprehensive incomeEffective portion of changes in fair value change of cash flow hedges - - - (9,400) - (9,400) - (9,400) Net change in fair value of cash flow hedges reclassified to total return - - - (1,028) - (1,028) - (1,028) Foreign currency translation differences - - - - (46,105) (46,105) - (46,105) Total comprehensive income for the Period, net of tax - - - (10,428) (46,105) (56,533) - (56,533)
Contributions by and distributions to Stapled Securityholders REIT Manager's management fees paid in Stapled Securities 7,808 - - - - 7,808 - 7,808
Other management fees paid in Stapled Securities 2,398 - - - - 2,398 - 2,398 Property management fees paid in Stapled Securities 6,154 - - - - 6,154 - 6,154 Acquisition fee paid in Stapled Securities 902 - - - - 902 - 902 Distributions to Stapled Securityholders - - (63,597) - - (63,597) - (63,597) Total contributions by and distributions to Stapled Securityholders 17,262 - (63,597) - - (46,335) - (46,335)
At 30 Jun 2016 1,202,791 (23,686) 33,718 (3,829) (105,555) 1,103,439 - 1,103,439
Total return for the Period, net of tax - - 27,477 - - 27,477 - 27,477 Total return for the Period attributable to Perpetual Securities holders - - (1,121) - - (1,121) - (1,121) Other comprehensive incomeEffective portion of changes in fair value change of cash flow hedges - - - 325 - 325 - 325 Net change in fair value of cash flow hedges reclassified to total return - - - (836) - (836) - (836) Foreign currency translation differences - - - - 14,413 14,413 - 14,413 Total comprehensive income for the Period, net of tax - - - (511) 14,413 13,902 - 13,902
Contributions by and distributions to Stapled SecurityholdersIssue costs - 204 - - - 204 - 204 Total contributions by and distributions to Stapled Securityholders - 204 - - - 204 - 204 Stapled Securityholders' funds at 30 Sep 2016 1,202,791 (23,482) 60,074 (4,340) (91,142) 1,143,901 - 1,143,901
Stapled Securityholders of the TrustPerpetual Securities holders of the Trust
Stapled securities in issue
Attributable to
Total
Page 16
FRASERS HOSPITALITY TRUSTFINANCIAL STATEMENTS ANNOUNCEMENTFOR THE FOURTH QUARTER ENDED 30 SEPTEMBER 2016
1 (d) (i) Statements of Changes in Stapled Securityholders' Funds (Cont'd)
Foreigncurrency
Issue Revenue Hedging translationcosts reserves reserve reserve Total
At 1 Oct 2015 - - - - - - - - Contributions by and distributions to Perpetual Securities holdersIssue of perpetual securities - - - - - - 100,000 100,000 Issue expenses - - - - - - (1,600) (1,600) Total return for the Period attributable to Perpetual Securities holders - - - - - - 610 610
At 30 Jun 2016 - - - - - - 99,010 99,010 Contributions by and distributions to Perpetual Securities holdersIssue expenses - - - - - - 128 128 Total return for the Period attributable to Perpetual Securities holders - - - - - - 1,121 1,121
At 14 Jul 2014 (a) - - - - - - - - Total return for the Period, net of tax - - 74,664 - - 74,664 - 74,664
Other comprehensive incomeEffective portion of changes in fair value change of cash flow hedges - - - 5,921 - 5,921 - 5,921 Net change in fair value of cash flow hedges reclassified to total return - - - (2,239) - (2,239) - (2,239) Foreign currency translation differences - - - - (53,857) (53,857) - (53,857)
Total comprehensive income for the Period, net of tax - - - 3,682 (53,857) (50,175) - (50,175)
Contributions by and distributions to Stapled Securityholders
Issuance of new Stapled Securities 1,049,503 - - - - 1,049,503 - 1,049,503 Issue costs - (21,238) - - - (21,238) - (21,238) REIT Manager's management fees paid in Stapled Securities 5,544 - - - - 5,544 - 5,544 Other management fees paid in Stapled Securities 917 - - - - 917 - 917 Property management fees paid in Stapled Securities 4,185 - - - - 4,185 - 4,185 Distribution Reinvestment Plan 1,216 - - - - 1,216 - 1,216 Distributions to Stapled Securityholders - - (44,449) - - (44,449) - (44,449) Total contributions by and distributions to Stapled Securityholders 1,061,365 (21,238) (44,449) - - 995,678 - 995,678 At 30 Jun 2015 1,061,365 (21,238) 30,215 3,682 (53,857) 1,020,167 - 1,020,167
Total return for the Period, net of tax - - 60,805 - - 60,805 - 60,805 Total return for the Period, attributable to Perpetual Securities holders - - - - - - - - Other comprehensive incomeEffective portion of changes in fair value change of cash flow hedges - - - 3,696 - 3,696 - 3,696 Net change in fair value of cash flow hedges reclassified to total return - - - (779) - (779) - (779) Foreign currency translation differences - - - - (5,593) (5,593) - (5,593) Total comprehensive income for the Period, net of tax - - - 2,917 (5,593) (2,676) - (2,676)
Footnotes:(a) Under the Listing Manual, FHT is required to present a comparative statement for the corresponding period of the immediately preceding financial year. As FHT was listed on 14 July 2014
("Listing Date"), FHT had obtained from the SGX-ST a waiver from reporting its first quarter results for the period from Listing Date till 30 September 2014. Accordingly, only the financialstatements for the period from 1 July 2015 to 30 September 2015 are available for comparison. The financial statements for the period from 1 October 2014 to 30 September 2015 are notavailable for comparison and in lieu thereof, the comparative statement for a longer period from the Listing Date to 30 September 2015 is presented.
Stapled Securityholders of the TrustPerpetual Securities holders of the Trust
Stapled securities in issue
Attributable to
Total
Stapled Securityholders of the TrustPerpetual Securities holders of the Trust
Stapled securities in issue
Attributable to
Total
Page 19
FRASERS HOSPITALITY TRUSTFINANCIAL STATEMENTS ANNOUNCEMENTFOR THE FOURTH QUARTER ENDED 30 SEPTEMBER 2016
1 (d) (ii) Details of Changes in Issued and Issuable Stapled Securities
Note
Balance at beginning of the Period- Issue of new Stapled Securities at the date of prospectus (30 Jun 2014)- Issue of new Stapled Securities on listing date- As payment of REIT Manager's management fees- As payment of other management fees- As payment of property management fees - As payment of acquisition fee- Distribution Reinvestment Plan- Private PlacementIssued Stapled Securities at the end of the Period
Issuable Stapled SecuritiesAs payment of REIT Manager's management fee (b)As payment of other management fee (c)As payment of property management fee (b)As payment of acquisition fee (d) 4,001,979 - 4,001,979 - Rights Issue (e) - - Total issued and issuable Stapled Securities
Footnotes:(a) FHT was listed on SGX-ST on 14 July 2014 with the completion of acquisition of the Initial Portfolio on the same date.
(b) This represents 100% of the REIT Manager's management fee and property management fee payable in Stapled Securities.
(c) This represents 100% of the MIT Manager's management fee payable in Stapled Securities.
(d) This represents 100% of the acquistion fee payable in Stapled Securities.
(e)
1 Please refer to FHT’s announcement on the SGX-ST dated 17 October 2016 and the offer information statement of FHT dated 20 September 2016 for further details.
2 Whether the figures have been audited, or reviewed and in accordance with which auditing standard or practice.
The figures have not been audited or reviewed by the auditor.
3 Where the figures have been audited or reviewed, the auditor's report (including any qualifications or emphasis of matter).
Not applicable.
4 Whether the same accounting policies and methods of computation as in the issuer's most recently audited annual financial statements have been applied.
1 Oct 2015 to
30 Sep 2016
7,971,540
FHT
- -
-
-
4,710,669
441,549,281
No. of Stapled Securities
-
1,419,941
-
-
-
1,379,841,506 1,205,958,580
1,028,464
FHT
-
5,390,691
The accounting policies and methods of computation adopted are consistent with those applied in the audited financial statements for the financial year ended 30 September 2015 except for the adoption of new or revisedFRSs that are mandatory for the financial year beginning on or after 1 October 2015. Such adoption has no significant impact on the financial position or performance of FHT for this reporting period.
4,063,849
14 Jul 2014to
30 Sep 2015 (a)
1 Jul 2015to
30 Sep 2015
4Q 2015 YTD 30 September 2015
- - 1,365,322
1,357,378,521 150,000,000 150,000,000
-
5,244,952 1,273,230
1,836,994,026
1,273,230
1,368,026,070
4,129,367
5,390,691 2,146,720
441,549,281
The underwritten and renounceable rights issue (the "Rights Issue")1 of 441,549,281 new Stapled Securities in FHT were credited to the Stapled Securityholders' CDP accounts on 17 October2016. These new Stapled Securities will, upon allotment and issue, rank pari passu in all respects with the existing Stapled Securities, including the right to any distributions which may accrue forthe period from 1 April 2016 to 30 September 2016 as well as all distributions thereafter.
1,368,026,070
1,357,378,521
4,063,849
1,836,994,026
1,379,841,506 1,379,841,506
5,244,952
1,419,941
-
4,129,367 2,146,720
-
1,192,627,999
YTD 30 September 2016
1
3,143,006 -
-
10,189,293
-
No. of Stapled Securities
- 6,226,125
No. of Stapled Securities
-
1,357,378,521
1 Jul 2016to
30 Sep 2016
No. of Stapled Securities
4Q 2016
1,159,146
Page 20
FRASERS HOSPITALITY TRUSTFINANCIAL STATEMENTS ANNOUNCEMENTFOR THE FOURTH QUARTER ENDED 30 SEPTEMBER 2016
5 If there are any changes in the accounting policies and methods of computation, including any required by an accounting standard, what has changed, as well as the reasons for, and the effect of, the change.
6 Earnings per Stapled Security ("EPS") and Distribution per Stapled Security ("DPS") for the financial period ended 30 September 2016
Group earnings per stapled security
Note
Total return for the Period after tax (S$'000)
Basic EPS
(b)
Dilutive EPS
(b)
Footnotes:(a)
(b)
(c) The weighted average number of Stapled Securities and EPS have been restated to reflect the effect of bonus element pursuant to the Rights Issue.
YTD 30 September 2015YTD 30 September 2016
135,467
11.04
Under the Listing Manual, FHT is required to present a comparative statement for the corresponding period of the immediately preceding financial year. As FHT was listed on 14 July 2014("Listing Date"), FHT had obtained from the SGX-ST a waiver from reporting its first quarter results for the period from Listing Date till 30 September 2014. Accordingly, only the financialstatements for the period from 1 July 2015 to 30 September 2015 are available for comparison. The financial statements for the period from 1 October 2014 to 30 September 2015 are notavailable for comparison and in lieu thereof, the comparative statement for a longer period from the Listing Date to 30 September 2015 is presented.
The weighted average number of Stapled Securities is weighted for units 4Q 2016, 4Q 2015, YTD 30 September 2016 and YTD 30 September 2015, respectively.
135,467
1,226,592,952
4.12 10.48 11.04
4.39
1,464,306,996 1,292,460,994
135,467
- -
135,467
1 Jul 2015 to 30 Sep 2015
4Q 2015 4Q 20154Q 2016
There has been no change in the accounting policies and methods of computation adopted by FHT for the current reporting period compared with the audited financial statements as at 30 September 2015, except for theadoption of new or revised FRSs that are mandatory for financial year beginning on or after 1 October 2015. The adoption of these FRSs has no significant impact on the financial position or performance of FHT as at 30September 2016 and for the quarter ended on that day.
11.04
1,226,592,952
14 Jul 2014 to 30 Sep 2015 (c)
EPS based on weighted average number of Stapled Securities in issue (cents)
EPS based on weighted average number of Stapled Securities in issue (cents)
Weighted average number of Stapled Securities in issue
1.80
1,465,745,741
1.90
1,383,668,058
26,340
(1,121)
27,461
As restated As previously reported
FHT FHT
14 Jul 2014 to 30 Sep 2015 ⁽ᵃ⁾
1,226,592,952
Less: Total return for the Period after tax attributable to Perpetual Securities holders (S$'000)Total return for the Period after tax attributable to Stapled Securityholders (S$'000)
Weighted average number of Stapled Securities in issue
As restated As previously reported1 Jul 2016 to 30 Sep 2016
1 Oct 2016 to 30 Sep 2016
4.53
62,102
(1,731)
60,371
4.30
1,343,297,023
4.53
1,343,297,023
60,805
-
60,805
60,805
-
60,805
1,343,297,023
4.53
1,415,432,073
1,374,753,349
1 Jul 2015 to 30 Sep 2015 (c)
Page 21
FRASERS HOSPITALITY TRUSTFINANCIAL STATEMENTS ANNOUNCEMENTFOR THE FOURTH QUARTER ENDED 30 SEPTEMBER 2016
6
Group distribution per stapled security
Footnotes:(a) FHT was listed on SGX-ST on 14 July 2014 with the completion of acquisition of the Initial Portfolio on the same date.
(b)
(i)
(ii)
(iii) The underwritten and renounceable rights issue of 441,549,281 new Stapled Securities in FHT which were issued in October 2016.
(iv) The estimated number of Stapled Securities 4,001,979, to be issued to MIT Manager as consideration for acquistion fee.
(c)
(d) The number of Stapled Securities entitled for distribution and DPS have been restated to reflect the effect of bonus element pursuant to the Rights Issue.
(e)
As previously reported
Income available for distribution for the period from 1 July 2015 to 5 July 2015 is part of the advanced distribution which was announced in FHT's announcement "Notice of Advanced DistributionBooks Closure and Distribution Payment Dates" dated 25 June 2015. The advanced distribution for the period from 1 July 2015 to 5 July 2015 amounted to SGD 0.09 cents per Stapled Securitywas paid out on 28 September 2015.
The distributable income for the period from 6 July 2015 to 30 September 2015 of SGD 1.57 cents per Stapled Security was paid on 29 December 2015.
For illustrative purpose and comparability, these figures are computed based on a shorter period, from 1 October 2014 to 30 September 2015. These figures included prorated amounts for theperiods from 14 July 2014 to 31 December 2014, to a 92-day period from 1 October 2014 to 31 December 2014.
Total number of issued and issuable Stapled Securities at end of PeriodDistribution to Stapled Securityholders (S$'000)DPS based on the total number of Stapled Securities entitled to distribution (cents)
FHT
1 Oct 2015 to 30 Sep 2016 (d)
YTD 30 September 2016 YTD 30 September 201514 Jul 2014 to 30 Sep 2015 ⁽ᵃ⁾
4Q 20151 Jul 2015 to 30 Sep 2015
As restated (d)1 Jul 2016 to
30 Sep 2016 (d)
1.1903
21,940
1,836,994,026 (b)
FHT makes distributions on a semi-annual basis and the distributions are payable by the REIT Manager within 90 days from the end of the said semi-annual period.
5.2299
The estimated number of Stapled Securities 11,601,260, to be issued to the Asset Manager, MIT Manager and Property Manager as consideration for Asset Manager's management fee, MITManager management fee and property management fee payable for the period from 1 April 2016 to 30 September 2016.
1,836,994,0261,386,026,070
1 Oct 2014 to 30 Sep 2015 (d)(e) As restated (d)As previously reported
4Q 2016
1,386,026,070
93,727
7.56
Earnings per Stapled Security ("EPS") and Distribution per Stapled Security ("DPS") for the financial period ended 30 September 2016 (Cont'd)
5.82(e)
84,948
FHT
1,441,489,0701,441,489,070
22,535
1.3142 1.66(c)
1,441,489,070
The number of Stapled Securities in issue as at 30 September 2016 of 1,379,841,506; and
22,535
The computation of DPS for the periods are based on the number of Stapled Securities entitled to distribution. This comprises:
6.92
93,727 77,219(e)
** As provided for in the Trust Deed dated 12 June 2014 constituting FH-REIT (the "Trust Deed"), the price of a Stapled Security issued shall be computed based on the volume weighted averageprice of a Stapled Security for the last ten business days immediately preceding the relevant financial period of which the fees accrues.
Page 22
FRASERS HOSPITALITY TRUSTFINANCIAL STATEMENTS ANNOUNCEMENTFOR THE FOURTH QUARTER ENDED 30 SEPTEMBER 2016
7 (i) Group net asset value ("NAV") per stapled security based on stapled securities in issue at the end of the period
Net asset value (S$'000)Net asset value per stapled security (cents)
(ii) Group net tangible asset ("NTA") per stapled security based on stapled securities in issue at the end of the period
Net tangible asset (S$'000)Net tangible asset value per stapled security (cents)
1,357,378,521
Number of Stapled Securities issued at end of the Period
82.90
Number of Stapled Securities issued at end of the Period
1,172,282
FHTAs at 30 Sep 2016 As at 30 Sep 2015
1,379,841,506
1,379,841,506
As at 30 Sep 2016
1,172,282 1,143,891 86.36
1,357,378,521
86.36
FHT
82.90 1,143,891
As at 30 Sep 2015
Page 23
FRASERS HOSPITALITY TRUSTFINANCIAL STATEMENTS ANNOUNCEMENTFOR THE FOURTH QUARTER ENDED 30 SEPTEMBER 2016
The Singapore portfolio reported GOR and GOP growth of 10.7% and 15.9% respectively due to the return of full inventory in InterContinental Singapore, compared to 4Q FY2015 when some rooms were not in operationbecause of renovation. To-date, the hotel has achieved ADRs close to pre-renovation levels and continues to drive room occupancy and food and beverage ("F&B") revenue to get to its optimal performance. Fraser SuitesSingapore turned in lower RevPAR for 4Q FY2016 due to continued weakness from oil and gas accounts. The property is actively pursuing long stay accounts by targeting at industries with better growth prospects (e.g. ITand pharmaceutical) and companies that are relocating.
(a) Review of performance for 4Q 2016 compared to 4Q 2015
The UK portfolio saw yoy decline in GOR and GOP of 1.5% and 2.9% respectively due to weaker business sentiment following Brexit which affected corporate demand and occupancy. GOP was also impacted by the 7.5%increase in minimum wage which took effect on 1 April 2016.
9,336 390,607 7,436
Master Lessees - Gross Operating Profit4Q 2016
With the strengthening of the Japanese Yen, ANA Crowne Plaza saw a decline in inbound guests, leading to lower occupancy in 4Q FY2016. GOR and GOP dropped 3.7% and 4.2% yoy respectively due to decline in roomrevenue. Expenses of the property will continue to be monitored and ongoing work on increasing revenue from conferences and events to improve performance will continue to be undertaken.
LC$'000
22,318
24,476
LC$'000Change
1,524,801
1 Jul 2016 to 30 Sep 2016
1 Jul 2015 to 30 Sep 2015
9,431
In 4Q FY2016, RevPAR of The Westin Kuala Lumpur grew yoy largely due to stronger transient and corporate demand from industries other than oil and gas. F&B revenue was up yoy due to improved performance of theF&B outlets which helped to offset the underperformance of the banquet and catering businesses. Both the GOR and GOP of the hotel increased 1.7% and 4.7% respectively.
In 4Q FY2016, Australia portfolio reported an average Revenue Per Available Room (“RevPAR”) growth of 5.6%, driven by higher Average Daily Rate (“ADR”) and occupancy of almost 93%. While Sydney continues to benefitfrom a busy events calendar, the conference business at Sofitel Sydney Wentworth was soft due to increased competition and as such, the hotel reported 0.8% and 0.9% growth in Gross Operating Revenue (“GOR”) andGross Operating Profit (“GOP”) respectively.
1,584,029 22,537 22,114
Change
2,733
Master Lessees - Gross Operating Revenue
4,429
8,136
1 Jul 2015 to 30 Sep 2015
LC$'000
7,024
4Q 2015
22,909
4Q 2015
22,499
1 Jul 2016 to 30 Sep 2016
LC$'000
6,921
For the financial quarter ended 30 September 2016 (“4Q FY2016”), Gross Revenue (“GR”) increased by 8.6% to $33.5 million while Net Property Income (“NPI”) increased by 11.5% to $28.6 million compared to same timelast year (“4Q FY2015”). Distributable Income (“DI”) registered 2.6% decline year-on-year (“yoy”) to S$21.9 million. Distribution Per Stapled Security (“DPS”) declined 5.4% yoy to 1.57 cents.
4Q 2016
9,257
Page 24
FRASERS HOSPITALITY TRUSTFINANCIAL STATEMENTS ANNOUNCEMENTFOR THE FOURTH QUARTER ENDED 30 SEPTEMBER 2016
8 Review of performance (Cont'd)
Gross operating revenue and gross operating profit for YTD 30 Sep 2016 were based on a period of 366 days compared to YTD 30 Sep 2015 of 444 days
Footnotes:(a) The acquisition of the Initial Portfolio of FHT was completed on Listing Date which was the day it was listed on the SGX-ST.
(b)
Operational Performance
(b) Review of performance for YTD 30 September 2016 compared to YTD 30 September 2015
36,331
LC$'000 LC$'000
1 Oct 2015 to
38,826 1,706,797
YTD 30 September 2016
29,022
30 Sep 2016
Prorated to
111,326
30 Sep 2015 (a)
17,819
1,933,575
LC$'000
109,788
45,217
For FY2016, the Australia portfolio achieved GOR and GOP growth of 85.8% and 76.5% respectively due mainly to the addition of Sofitel Sydney Wentworth. The portfolio continued to record strong performance withaverage occupancy at more than 90% during the year.
13,573
23,766 91,557
6,435,341 90,713
24,778 49,285 56,818
30,369
YTD 30 September 2015
Master Lessees - Gross Operating ProfitYTD 30 September 2015
For the financial year ended 30 September 2016 (“FY2016”), GR increased by 17.1% to $123.6 million while NPI rose by 20.6% to $104.2 million compared to same period last year (“FY2015”). Although DI grew 10.0% yoy toS$84.9 million, DPS registered a decline of 1.1% yoy to 6.13 cents.
88,801
30 Sep 2016 14 Jul 2014 to
6,195,649
Prorated to366 days (b)
LC$'000366 days (b)
21,998 1,567,116
28,578 36,229
90,646
LC$'000
87,832
34,992
14,597
1 Oct 2015 toChange
YTD 30 September 2016
(b) YTD 30 September 2016 VS YTD 30 September 2015
The results of YTD 30 September 2015 presented and announced by FHT on 29 October 2015 were from the period from 14 July 2014 to 30 September 2015 which involves 444 days ofoperations. For a more meaningful comparison with the YTD 30 September 2016 results, the YTD 30 September 2015 results are comprised of the prorated figures for Q1 2015 (from 171 days to92 days) and the results from 2Q 2015, 3Q2015 and 4Q 2015. The resultant YTD 30 September 2015 figures are only for comparative purposes and do not represent the actual results of anyspecific 366-day period.
GOR and GOP of the Singapore portfolio declined 1.1% and 3.4% respectively compared to FY2015. This was due to the performance of InterContinental Singapore being affected by the renovation works which werecompleted in February this year.
Master Lessees - Gross Operating Revenue
25,556
14 Jul 2014 to 30 Sep 2015 (a)
LC$'000
7,528,833
Page 25
FRASERS HOSPITALITY TRUSTFINANCIAL STATEMENTS ANNOUNCEMENTFOR THE FOURTH QUARTER ENDED 30 SEPTEMBER 2016
8 Review of performance (Cont'd)
Operational Performance (Cont'd)
(b) Review of performance for YTD 30 September 2016 compared to YTD 30 September 2015 (Cont'd)
9 Where a forecast, or a prospect statement, has been previously disclosed to shareholders, any variance between it and the actual result
No forecast or prospect statement has been previously disclosed.
10
1 JLL – Asia Pacific Property Digest Q2 2016.2 Knight Frank – The UK Provincial Hotel Market Review, September 2016.3 JLL Hotel Intelligence, September 2016.4 Savills Spotlight: Japan Hospitality, August 2016.5 Tourism Malaysia media release, “Efforts to facilitate travel to Malaysia take a major leap”, 26 July 2016. 6 JLL Hotel Intelligence, September 2016.
For January to August 2016, the Singapore Tourism Board reported an 10.3% increase in tourist arrivals, fuelled in part by a surge in arrivals of Chinese and Indonesian visitors. Underscoring its status as a leading MICEdestination, Singapore continues to grow its pipeline of events including World Mail & Express Asia, International Conference on Biomedical Engineering, MilSim Asia and IoT Asia. However, the weak global economicoutlook, moderating growth in China, increasing regional competition and supply of new rooms will continue to weigh on the hospitality sector.
For January to September 2016, Japan National Tourism Organization reported growth in the number of foreign visitors to the country, with Chinese visitors remaining the largest group. Going forward, growth in inboundtourism is expected to be at a slower pace. As repeated ADR increases have started to weigh on occupancy, growth in ADR is also expected to moderate4.
Tourism Malaysia reported a 3.7% growth in tourist arrivals to 13 million in the first six months of 2016. Chinese tourists grew 32.1% yoy for January to June 2016. According to Tourism Malaysia, the country is expected towelcome 30.5 million tourists and earn MYR103 billion tourist receipts in 2016. Following the introduction of visa exemption and e-visa programme for Chinese tourists in March 2016, the government has launched its e-visaprogramme for tourists from India in July. It aims to make travel to Malaysia more convenient, thereby attracting more Indian tourists to visit the country5.
For January to August 2016, Tourism Australia reported a yoy growth of 11.7% in international arrivals to 5.2 million. Chinese visitors to Australia grew 20.7% yoy. Hotels in Sydney have maintained high occupancy withdemand expected to stay strong in 2H2016, buoyed by the city’s extensive events calendar, and strong corporate and leisure demand. While new supply is due to enter the market in the next 12 to 24 months, it isanticipated that demand generated by existing infrastructure developments such as the Sydney International Convention Centre and Barangaroo should be able to absorb these new rooms1.
For 2016, the German National Tourist Board has predicted a 1% to 3% growth in inbound tourist arrivals. Tourism in Germany largely benefits from a well-balanced mix between corporate and leisure demand, supportedby the country’s wide range of tourist attractions and its standing as an important MICE and business destination6. Known as a major host for conferences and trade fairs in Germany, Dresden has an ongoing pipeline ofevents including Aachen-Dresden International Textile Conference, Trading Dresden, International Symposium Additive Manufacturing, HAUS (construction tradeshow) and Sachsenback (bakery and confectionerytradeshow).
For FY 2016, GOR and GOP of The Westin Kuala Lumpur increased 0.1% and 1.6% respectively. Improved transient and corporate demand have helped to offset the weaker banquet and catering business.
Commentary on the significant trends and competitive conditions of the industry in which the group operates and any known factors or events that may affect the group in the next reporting period and the next 12months
According to Visit Britain, inbound visitors for January to August 2016 were up 3% yoy to 25 million. Following Brexit, the weakened Pound has led to an increase in overseas visitors to London but this may be masked by theimpact that future negotiations on Brexit could have on business investment and consumer confidence2. With rising confidence in the Scottish economy and growing tourism demand, outlook for Edinburgh and Glasgow isexpected to remain positive. Edinburgh is set to benefit from significant developments including the Edinburgh St James, an £850 million city centre redevelopment project while the Scottish Exhibition and ConferenceCentre and SSE Hydro (an entertainment and sporting arena) remain significant demand drivers for Glasgow3.
The UK portfolio recorded a drop in GOR and GOP of 4.1% and 7.0% yoy respectively due to the various events that occurred during the year, including the Paris and Brussels incidents as well as Brexit. GOP was also affectedby increased costs with the 7.5% increase in minimum wage that took effect on 1 April 2016.
The Japan property continued to register healthy growth of 3.9% and 8.9% in GOR and GOP respectively for FY2016. Its better performance was attributed to the continued healthy domestic and international arrivals intoJapan.
Page 26
FRASERS HOSPITALITY TRUSTFINANCIAL STATEMENTS ANNOUNCEMENTFOR THE FOURTH QUARTER ENDED 30 SEPTEMBER 2016
10
Subsequent Events
On 17 October 2016, FHT issued 441,549,281 Rights Stapled Securities pursuant to the Rights Issue at an Issue Price of S$0.603 per Rights Stapled Security.
On 19 and 20 October 2016, FHT completed the acquisitions of Novotel on Collins and the Hotel Assets1 which were financed through the Rights Issue.
1 Please refer to FHT's announcement on the SGX-ST dated 20 October 2016 for further details.
11 Distributions
(a) Current financial period
Name of Distribution
Distribution Type (a) Taxable income(b) Tax-exempt income(c) Capital distribution
Distribution Rate
(a) Taxable income distribution(b) Tax-exempt income distribution (c) Capital distribution
Tax Rate Taxable income distribution
Qualifying foreign non-individual investors will receive their distributions after deduction of tax at the rate of 10%.
All other investors will receive their distributions after deduction of tax at the rate of 17%.
Capital distribution
Tax-exempt income distributionTax-exempt income distribution is exempt from tax in the hands of all Stapled Securityholders, regardless of their nationality, corporate identity or taxresidence status. No tax will be deducted at source from such distribution. The tax-exempt income relates to tax-exempt dividend income received fromsubsidiaries by FH-REIT.
The Capital Distribution represents a return of capital to Stapled Securityholders for Singapore income tax purposes and is therefore not subject toSingapore income tax. For Stapled Securityholders who are liable to Singapore income tax on profits from sale of Stapled Securities, the amount of CapitalDistribution will be applied to reduce the cost base of their Stapled Securities for Singapore income tax purposes.
0.2341
Commentary on the significant trends and competitive conditions of the industry in which the group operates and any known factors or events that may affect the group in the next reporting period and the next 12months (Cont'd)
(Per Stapled Security)
2.3347
0.6427
1.4579
Qualifying investors and individuals (other than those who held their stapled securities through a partnership) will receive pre-tax distributions. Thesedistributions are exempted from tax in the hands of individuals unless such distributions are derived through a Singapore partnership or from the carryingon of a trade, business or profession.
Any distribution declared for the current financial period? Yes.
(i) Distribution for period from 1 April 2016 to 30 September 2016.
(i) Distribution for period from 1 April 2016 to 30 September 2016.
Cents
Page 27
FRASERS HOSPITALITY TRUSTFINANCIAL STATEMENTS ANNOUNCEMENTFOR THE FOURTH QUARTER ENDED 30 SEPTEMBER 2016
11 Distributions (Cont'd)
(b) Corresponding period of the immediately preceding financial year
Name of Distribution(ii) Distribution for period from 6 July 2015 to 30 September 2015.
Distribution Type (a) Taxable income(b) Tax-exempt income(c) Capital distribution
Distribution Rate
(a) Taxable income distribution(b) Tax-exempt income distribution (c) Capital distribution
(ii) Distribution for period from 6 July 2015 to 30 September 2015
(a) Taxable income distribution(b) Tax-exempt income distribution (c) Capital distribution
Tax Rate Taxable income distribution
Capital distribution
(c) Date payable
29 December 2016.
(d) Books closure date
10 November 2016.
12 If no dividend has been declared/recommended, a statement to that effect
Refer to paragraph 11.
(i) Advanced distribution for period from 1 July 2015 to 5 July 2015 (paid out on 28 September 2015).
(i) Advanced distribution for period from 1 July 2015 to 5 July 2015 (paid out on 28 September 2015)
Qualifying investors and individuals (other than those who held their stapled securities through a partnership) will receive pre-tax distributions. Thesedistributions are exempted from tax in the hands of individuals unless such distributions are derived through a Singapore partnership or from the carryingon of a trade, business or profession.
Cents
0.09
1.5745
(Per Stapled Security)Cents
0.020.01
Qualifying foreign non-individual investors will receive their distributions after deduction of tax at the rate of 10%.
Tax-exempt income distribution is exempt from tax in the hands of all Stapled Securityholders, regardless of their nationality, corporate identity or taxresidence status. No tax will be deducted at source from such distribution. The tax-exempt income relates to the net taxed income top-up received by FH-REIT and tax-exempt dividend income received from subsidiary by FH-REIT.
The Capital Distribution represents a return of capital to Stapled Securityholders for Singapore income tax purposes and is therefore not subject toSingapore income tax. For Stapled Securityholders who are liable to Singapore income tax on profits from sale of Stapled Securities, the amount of CapitalDistribution will be applied to reduce the cost base of their Stapled Securities for Singapore income tax purposes.
Tax-exempt income distribution
All other investors will receive their distributions after deduction of tax at the rate of 17%.
0.06
(Per Stapled Security)0.29760.18411.0928
Page 28
FRASERS HOSPITALITY TRUSTFINANCIAL STATEMENTS ANNOUNCEMENTFOR THE FOURTH QUARTER ENDED 30 SEPTEMBER 2016
13
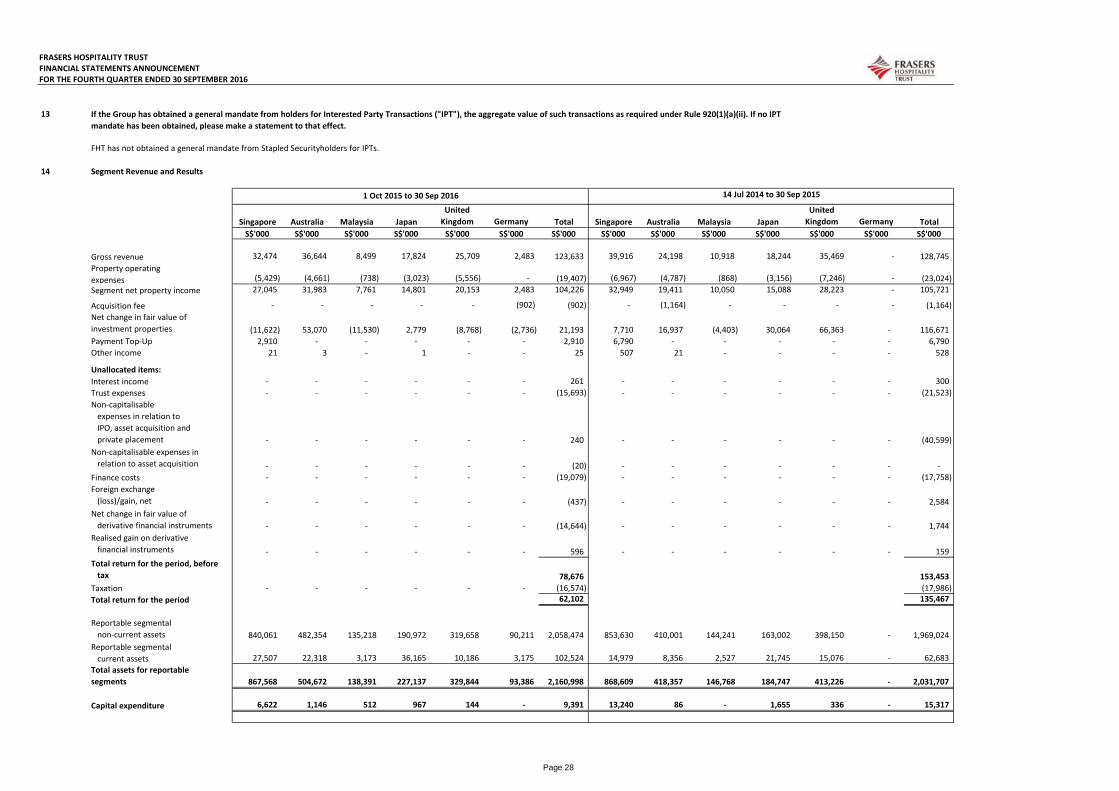
FHT has not obtained a general mandate from Stapled Securityholders for IPTs.
14 Segment Revenue and Results
Singapore Australia Malaysia JapanUnited
Kingdom Germany Total Singapore Australia Malaysia JapanUnited
Non-capitalisable expenses in relation to IPO, asset acquisition and private placement
If the Group has obtained a general mandate from holders for Interested Party Transactions ("IPT"), the aggregate value of such transactions as required under Rule 920(1)(a)(ii). If no IPT mandate has been obtained, please make a statement to that effect.
Net change in fair value of derivative financial instruments
Reportable segmental non-current assets
Segment net property income
Realised gain on derivative financial instrumentsTotal return for the period, before tax
Reportable segmental current assetsTotal assets for reportable segments
Non-capitalisable expenses in relation to asset acquisition
Foreign exchange (loss)/gain, net
1 Oct 2015 to 30 Sep 2016 14 Jul 2014 to 30 Sep 2015
Page 29
FRASERS HOSPITALITY TRUSTFINANCIAL STATEMENTS ANNOUNCEMENTFOR THE FOURTH QUARTER ENDED 30 SEPTEMBER 2016
15
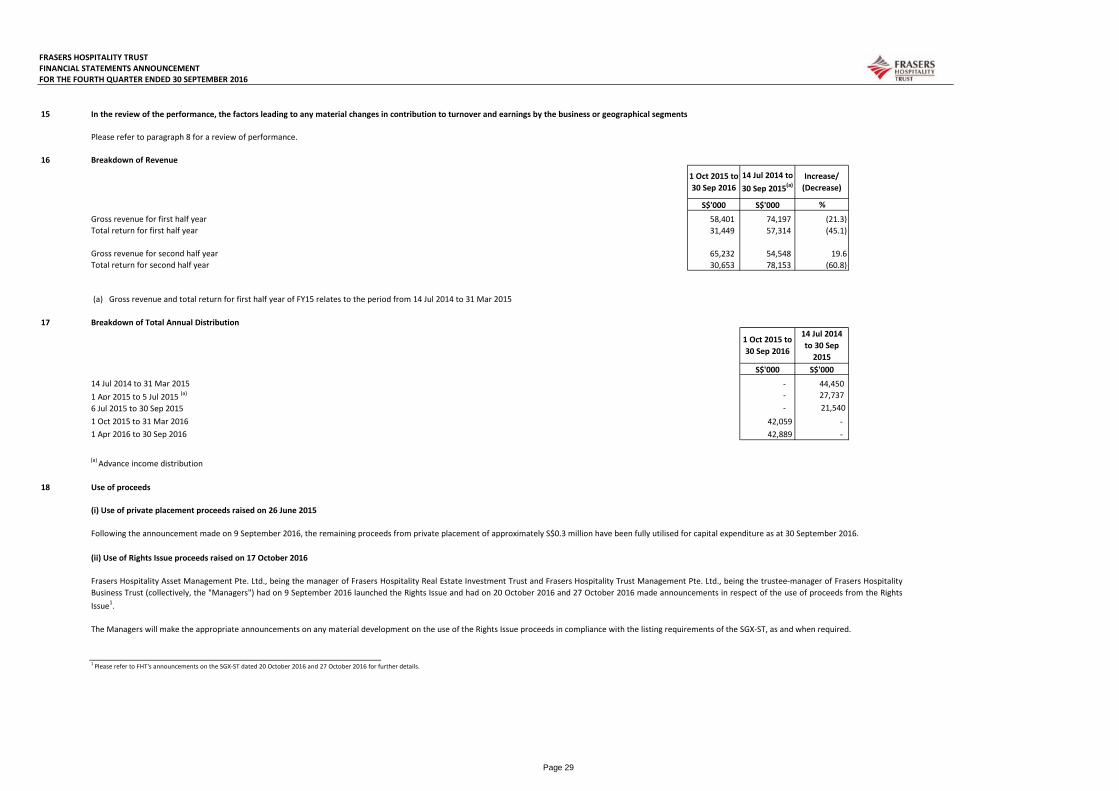
Please refer to paragraph 8 for a review of performance.
16 Breakdown of Revenue
S$'000 S$'000 %
Gross revenue for first half year 58,401 74,197 (21.3)Total return for first half year 31,449 57,314 (45.1)
Gross revenue for second half year 65,232 54,548 19.6 Total return for second half year 30,653 78,153 (60.8)
(a) Gross revenue and total return for first half year of FY15 relates to the period from 14 Jul 2014 to 31 Mar 2015
17 Breakdown of Total Annual Distribution
S$'000 S$'00014 Jul 2014 to 31 Mar 2015 - 44,450 1 Apr 2015 to 5 Jul 2015 (a) - 27,737 6 Jul 2015 to 30 Sep 2015 - 21,540 1 Oct 2015 to 31 Mar 2016 42,059 - 1 Apr 2016 to 30 Sep 2016 42,889 -
(a) Advance income distribution
18 Use of proceeds
(i) Use of private placement proceeds raised on 26 June 2015
(ii) Use of Rights Issue proceeds raised on 17 October 2016
1 Please refer to FHT's announcements on the SGX-ST dated 20 October 2016 and 27 October 2016 for further details.
The Managers will make the appropriate announcements on any material development on the use of the Rights Issue proceeds in compliance with the listing requirements of the SGX-ST, as and when required.
Increase/(Decrease)
In the review of the performance, the factors leading to any material changes in contribution to turnover and earnings by the business or geographical segments
14 Jul 2014 to 30 Sep 2015(a)
1 Oct 2015 to 30 Sep 2016
14 Jul 2014 to 30 Sep
2015
1 Oct 2015 to 30 Sep 2016
Following the announcement made on 9 September 2016, the remaining proceeds from private placement of approximately S$0.3 million have been fully utilised for capital expenditure as at 30 September 2016.
Frasers Hospitality Asset Management Pte. Ltd., being the manager of Frasers Hospitality Real Estate Investment Trust and Frasers Hospitality Trust Management Pte. Ltd., being the trustee-manager of Frasers HospitalityBusiness Trust (collectively, the "Managers") had on 9 September 2016 launched the Rights Issue and had on 20 October 2016 and 27 October 2016 made announcements in respect of the use of proceeds from the RightsIssue1.
Page 30
FRASERS HOSPITALITY TRUSTFINANCIAL STATEMENTS ANNOUNCEMENTFOR THE FOURTH QUARTER ENDED 30 SEPTEMBER 2016
19 Additional information - FHT's interests in Australia Urban Land Trust Estate
Australia's foreign investment regime was substantially re-written and amended on and from 1 December 2015.
Notifiable actions (i.e. mandatory notification)
Exemptions from ALT requirements
Significant actions (i.e. voluntary notification)
As at 30 September 2016, FHT has gross Australian assets of approximately AUD 463million, which is above AUD252.0 million.
Any Investor acquiring Stapled Securities on the secondary market should seek their own advice on the FIRB requirements as they pertain to their specific circumstances.
If FHT has gross Australian assets in excess of a specified threshold prescribed under the FATA (as at the date of this announcement, the threshold prescribed under the FATA is AUD252.0 million for most private foreigninvestors)vii at the time of acquisition, all investors (i) who are foreign persons and (ii) who are acquiring a Substantial Interest in FHT or have a Substantial Interestviii and increase their holding, should note that, while priornotification and FIRB Clearance are not required, the Australian Treasurer still has the power to make adverse orders under the FATA if such transaction is considered to be contrary to Australia's national interest.ix In suchcase, it may be prudent for an Investor to seek FIRB Clearance on a voluntary basis.
As at 30 September 2016, the value of the Australian assets comprised in FH-REIT's portfolio is 22.32% of the total asset value of FH-REIT. FH-BT was dormant as at 30 September 2016. Consequently, FHT is not consideredto be an ALT.
(a) the relevant person's interest in FH-REIT or FH-BT would not be valued in excess of a specified threshold prescribed under the FATA (at the date of this announcement, the threshold prescribed under the FATA isAUD252.0m, unless the ALT has 'sensitive' land holdings, in which case the threshold is AUD55.0m)v ; and
(b) the relevant person, together with associates, is acquiring an interest of less than 10% in FHT and will not be in a position to influence or participate in the central management and control of the land entity or toinfluence, participate in or determine the policy of the land entity. vi
(b) any investor that is a Foreign Government Investoriii acquiring a "direct interest"iv in FHT will require FIRB Clearance at the time of acquisition, regardless of whether FH-REIT or FH-BT is considered to be an ALT orwhether FHT has gross Australian assets in excess of AUD252.0million.
(a) if either FH-REIT or FH-BT is considered to be an "Australian Land Trust"ii ("ALT") at the time of acquisition, all foreign persons acquiring Stapled Securities (including existing holders of Stapled Securities acquiringadditional Stapled Securities) will require FIRB Clearance unless an exemption applies (see below); and
Investors who are "foreign persons"i that acquire Stapled Securities are required under the Australian Foreign Acquisitions and Takeovers Act 1975 ("FATA") or the Australian Government's Foreign Investment Policy tonotify and receive a prior statement of no objection ("FIRB Clearance") of their investment in FHT under Australia's foreign investment regime from the Australian Treasurer through the Foreign Investment Review Board ifany of the circumstances set out below apply at the time the Stapled Securities are acquired:
The FATA, as recently amended, contains two relevant exemptions from the requirement to obtain FIRB Clearance that would otherwise apply if FH-REIT or FH-BT was considered to be an ALT:
Page 31
FRASERS HOSPITALITY TRUSTFINANCIAL STATEMENTS ANNOUNCEMENTFOR THE FOURTH QUARTER ENDED 30 SEPTEMBER 2016
20 Additional information - FHT's interests in Australia Urban Land Trust Estate (Cont'd)
i A "foreign person" is now defined as:
▪ an individual not ordinarily resident in Australia; or
▪ a corporation in which an individual not ordinarily resident in Australia, a foreign corporation or a foreign government holds a substantial interest; or
▪ a corporation in which 2 or more persons, each of whom is an individual not ordinarily resident in Australia, a foreign corporation or a foreign government, hold an aggregate substantial interest; or
▪ the trustee of a trust in which an individual not ordinarily resident in Australia, a foreign corporation or a foreign government holds a substantial interest; or
▪ the trustee of a trust in which 2 or more persons, each of whom is an individual not ordinarily resident in Australia, a foreign corporation or a foreign government, hold an aggregate substantial interest; or
▪ a foreign government; or
▪ any other person, or any other person that meets the conditions, prescribed by the regulations.ii Previously, this was an "Australian Urban Land Trust Estate". An ALT is similarly defined, being a unit trust in which the value of interests in Australian land exceeds 50% of the value of the total assets of the unit trust.iii A ''foreign government investor'' is now defined to mean:▪ a foreign government or separate government entity;
▪ a corporation or trustee of a trust in which:
▪ a foreign government or separate government entity, alone or together with one or more associates, holds a substantial interest (that is, an interest of at least 20%); or
▪ a general partner of a limited partnership in which:
▪ a foreign government or separate government entity, alone or together with one or more associates, holds an interest of at least 20%; or
▪ foreign governments or separate government entities of more than one foreign country (or parts of more than one foreign country), together with any one or more associates, hold an aggregate interest of 40% or more; or
▪ a corporation, trustee or general partner of a kind described above.iv A ''direct interest'' is now defined to mean:▪ an interest of at least 10% in the entity or business, or
▪ an interest of at least 5% in the entity or business if the person who acquires the interest has entered a legal arrangement relating to the businesses of the person and the entity or business, or
▪ an interest of any percentage in the entity or business if the person who has acquired the interest is in a position to:
▪ participate or influence the central management and control of the entity or business; or
▪ influence, participate or determine the policy of the entity or business.
vi This exemption reflects the ''passive investor administrative exemption'' that was previously available, and applies where an ALT is listed on an official stock exchange (whether in Australia or not).vii A higher threshold of AUD1,094.0 million applies to foreign persons that are enterprises from the United States, New Zealand, Chile, Japan, South Korea or the People's Republic of China.viii A person holds a ''Substantial Interest '' in a trust if the person together with any one or more associates, holds a beneficial interest in at least 20% of the income or property of the trust. Before 1 December 2015, the threshold was 15%.ix Previously, such an acquisition would have been captured by the mandatory notification regime; it is now captured only by the voluntary notification regime.
v This is a new exemption that was introduced into the FATA on and from 1 December 2015 and applies in respect of ALTs that have predominantly developed commercial real estate portfolios (i.e. less than 10% residential or vacant commercial land). Previously, there was no applicablemonetary threshold. FIRB has also confirmed that it is the value of the interest being acquired, rather than the value of the underlying land that is determinative for the purposes of this exemption. The concept of 'sensitive' land is broad and includes mines and critical infrastructure (forexample, an airport or port).
▪ foreign governments or separate government entities of more than one foreign country (or parts of more than one foreign country), together with any one or more associates, hold an aggregate substantial interest (that is, an interest of at least 40%);
Page 32
FRASERS HOSPITALITY TRUSTFINANCIAL STATEMENTS ANNOUNCEMENTFOR THE FOURTH QUARTER ENDED 30 SEPTEMBER 2016
21 Confirmation pursuant to Rule 720(1) of the SGX-ST Listing Manual
22 Disclosure pursuant to Rule 704(13) of the listing manual
For and on behalf of the Board of Directors ofFrasers Hospitality Asset Management Pte. Ltd.Frasers Hospitality Trust Management Pte. Ltd.
Law Song Keng Choe Peng SumDirector Director
BY ORDER OF THE BOARD
Frasers Hospitality Asset Management Pte. Ltd.(Company registration no. 201331351D)As Manager of Frasers Hospitality Real Estate Investment Trust
Frasers Hospitality Trust Management Pte. Ltd.(Company registration no. 201401270M)As Trustee-Manager of Frasers Hospitality Business Trust
Catherine YeoCompany Secretary28 October 2016
Pursuant to Rule 704(13) of the Listing Manual of Singapore Exchange Securities Trading Limited, the Managers confirm that there is no person occupying a managerial position in the Managers or in any of the principalsubsidiaries of FHT who is a relative of a Director, Chief Executive Officer, substantial shareholder of the Managers or substantial Stapled Securityholder of FHT.
Frasers Hospitality Asset Management Pte. Ltd., as manager of FH-REIT, and Frasers Hospitality Trust Management Pte. Ltd., as trustee-manager of FH-BT, confirm that they have procured undertakings from all theirDirectors and Executive Officers (in the format set out in Appendix 7.7) pursuant to Rule 720(1) of the SGX-ST Listing Manual.
Page 33
FRASERS HOSPITALITY TRUSTFINANCIAL STATEMENTS ANNOUNCEMENTFOR THE FOURTH QUARTER ENDED 30 SEPTEMBER 2016
IMPORTANT NOTICE
Investors are cautioned not to place undue reliance on these forward-looking statements, which are based on the Manager’s current view on future events.
The past performance of FHT is not necessarily indicative of the future performance of FHT.
Any discrepancies in the tables included in this announcement between the listed amounts and total thereof are due to rounding.
This announcement may contain forward-looking statements that involve risks and uncertainties. Actual future performance, outcomes and results may differs materially from those expressed in forward-looking statementsas a result of a number of risks, uncertainties and assumptions. Representative examples of these factors include (without limitation) general industry and economic conditions, interest rate trends, cost of capital andcapital availability, competition from similar developments, shifts in expected levels of average daily room rates and occupancy, changes in operating expenses (including employee wages, benefits and training costs),property expenses, governmental and public policy changes and the continued availability of financing in the amounts and the terms necessary to support future business.
The value of the Stapled Securities and the income derived from them, may fall as well as rise. Stapled Securities are not obligations of, deposits in, or guaranteed by, the REIT Manager, the Trustee-Manager or any of itsaffiliates. An investment in Stapled Securities is subject to investment risks, including the possible loss of the principal amount invested. Investors have no right to request that the Managers redeem or purchase theirStapled Securities while the Stapled Securities are listed. It is intended that holders of Stapled Securities may only deal in their Stapled Securities through trading on SGX-ST. Listing of the Stapled Securities on the SGX-STdoes not guarantee a liquid market for the Stapled Securities.