Fraud Detection Experiments • Chase Credit Card – 500,000 records spanning one year – Evenly distributed – 20% fraud, 80% non fraud • First Union Credit Card – 500,000 records spanning one year – Unevenly distributed – 15% fraud, 85% non fraud
Transcript
Fraud Detection Experiments• Chase Credit Card
– 500,000 records spanning one year
– Evenly distributed
– 20% fraud, 80% non fraud
• First Union Credit Card– 500,000 records spanning one year
• Until no other examples in V be covered– select the classifier with highest TP-FP rate on V
– Remove covered examples from V
Setting• 12 subsets
• 5 algorithms (Bayes, C4.5, Cart, ID3, Ripper)
• 6-fold cross validation
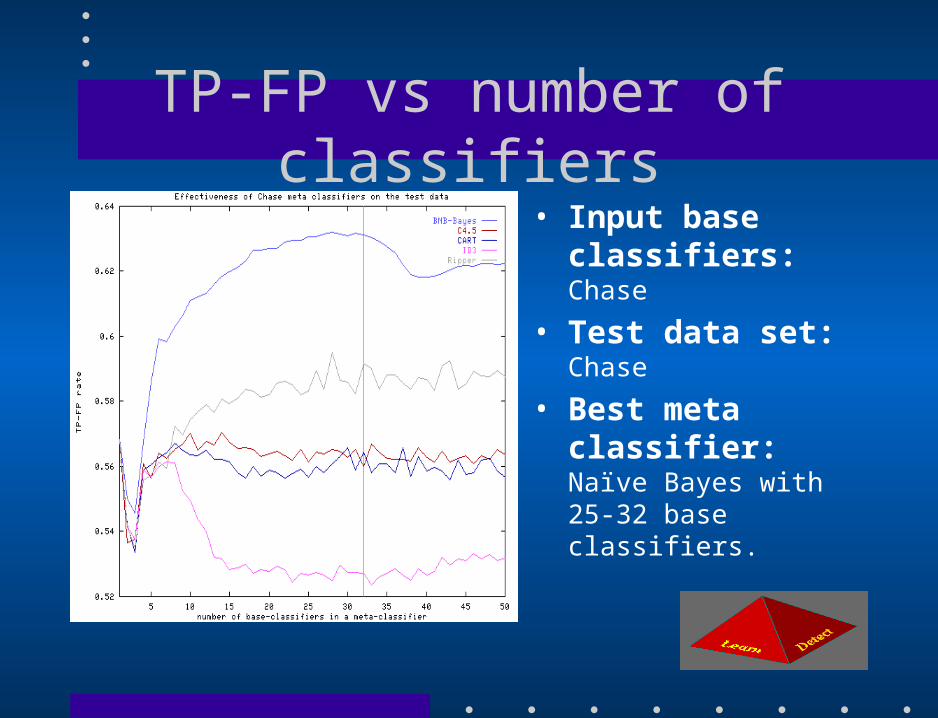
TP-FP vs number of classifiers• Input base classifiers:
Chase
• Test data set:Chase
• Best meta classifier: Naïve Bayes with 25-32 base classifiers.
TP-FP vs number of classifiers
• Input base classifiers:
First Union
• Test data set:First Union
• Best meta classifier: Naïve Bayes with 10-17
base classifiers.
Accuracy vs number of classifiers
• Input base classifiers: Chase
• Test data set:Chase
• Best meta classifier: Ripper with 50 base classifiers. Comparable performance is attained with 25-30 classifiers
Accuracy vs number of classifiers
• Input base classifiers: First Union
• Test data set:First Union
• Best meta classifier: Ripper with 13 base classifiers.
Intra-bank experimentsCoverage, cost model combined metric
algorithm:– Let V be the validation set
– Until no examples can be covered from V• select classifier Cj that achieves the highest savings on V
• Remove covered examples from V
Savings vs number of classifiers
• Input base classifiers: Chase
• Test data set: Chase
• Best Meta Classifiers:Single naïve bayesian base classifier (~ $820K)
Savings of base classifiers
• Input base classifiers: Chase
• Test data set: Chase
• Conclusion: Learning algorithms focus on binary classification problem. If base classifiers fail to detect expensive fraud, meta learning cannot improve savings.
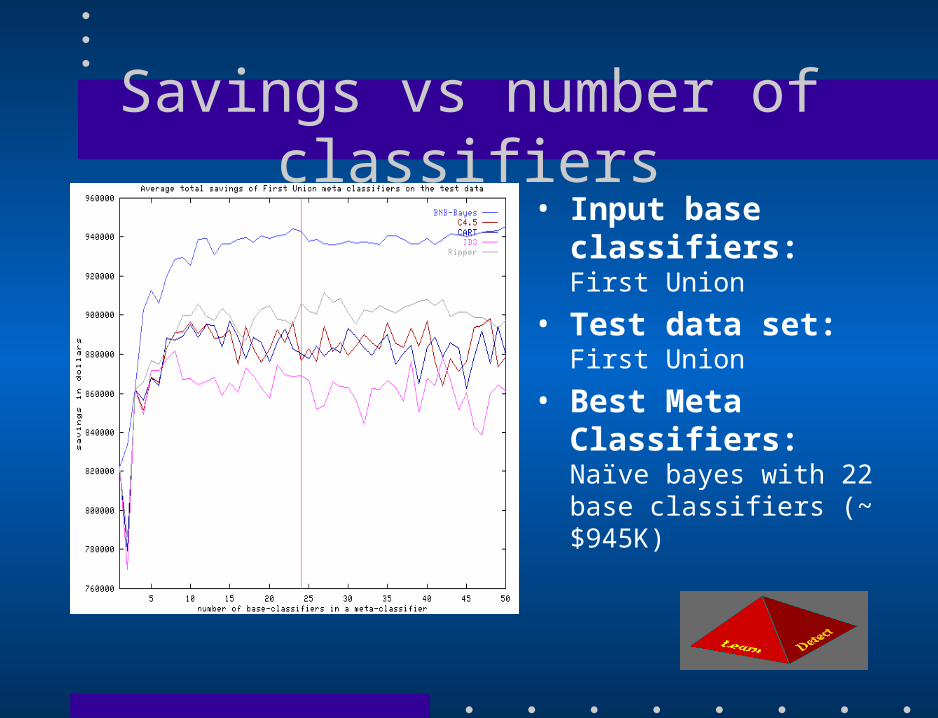
Savings vs number of classifiers• Input base classifiers:
First Union
• Test data set: First Union
• Best Meta Classifiers:Naïve bayes with 22 base classifiers (~ $945K)
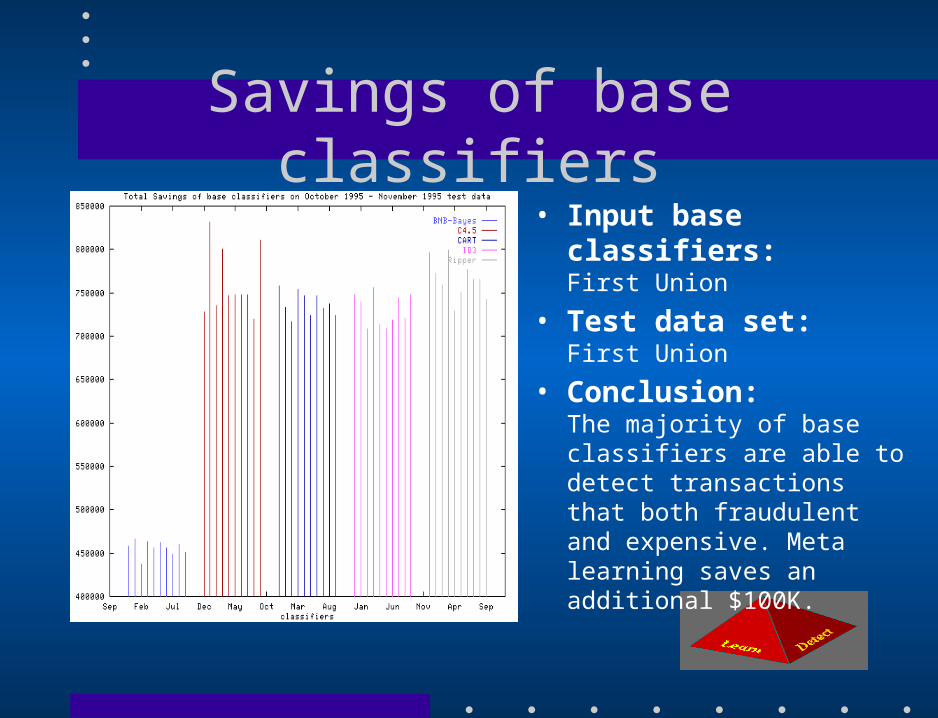
Savings of base classifiers• Input base classifiers:
First Union
• Test data set: First Union
• Conclusion:The majority of base classifiers are able to detect transactions that both fraudulent and expensive. Meta learning saves an additional $100K.
Different distributions experiments
– Number of Datasites: 6– Training sets: 50-50% Fraud/Non-Fraud– Testing sets: 20-80% Fraud/Non-Fraud – Base classifiers: ID3, CART– Meta classifiers: ID3, CART, Bayes, Ripper– Base classifiers: 81% TP, 29% FP– Meta-classifiers: 86% TP, 25% FP
Inter-bank experiments
• Chase includes 2 attributes not present in First Union data– Add two fictitious fields – Classifier agents support unknown values
• Chase and First Union define an attribute with different semantics– Project Chase values on First Union semantics
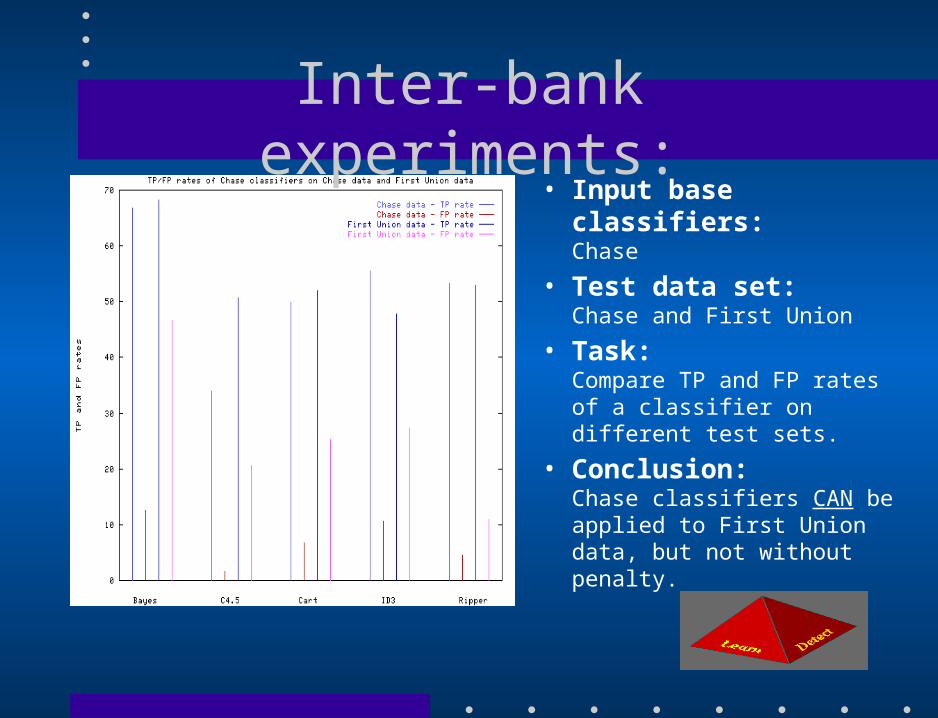
Inter-bank experiments:• Input base classifiers:
Chase
• Test data set:Chase and First Union
• Task:Compare TP and FP rates of a classifier on different test sets.
• Conclusion:Chase classifiers CAN be applied to First Union data, but not without penalty.
Inter-bank experiments:• Input base classifiers:
First Union
• Test data set:First Union and Chase
• Task:Compare TP and FP rates of a classifier on different test sets.
• Conclusion:First Union classifiers CAN be applied to Chase data, but not without penalty.
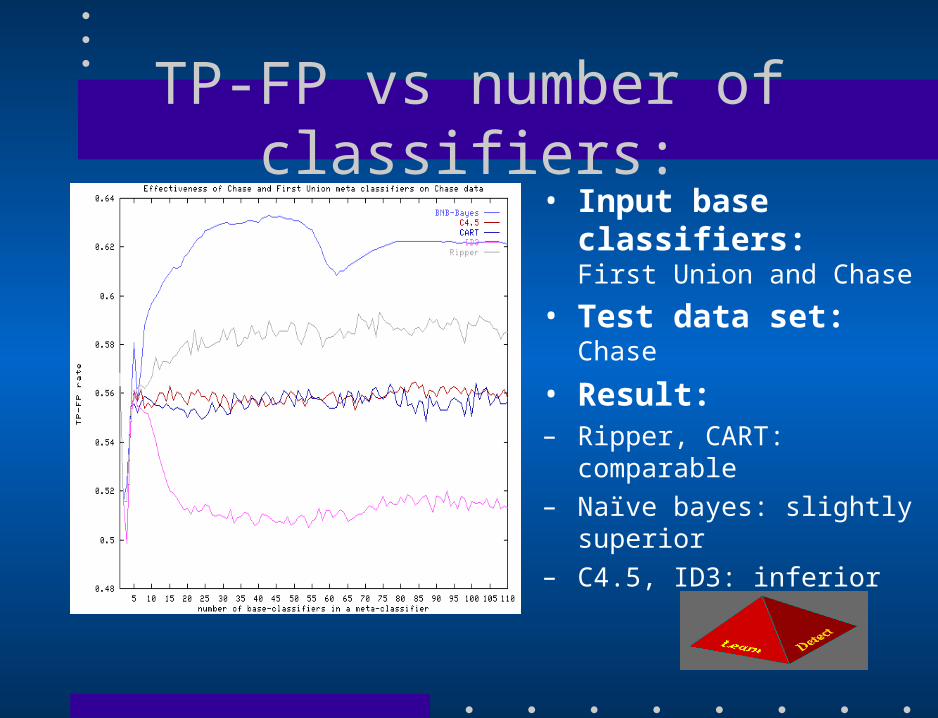
TP-FP vs number of classifiers:• Input base classifiers:
First Union and Chase
• Test data set:Chase
• Result:– Ripper, CART: comparable
– Naïve bayes: slightly superior
– C4.5, ID3: inferior
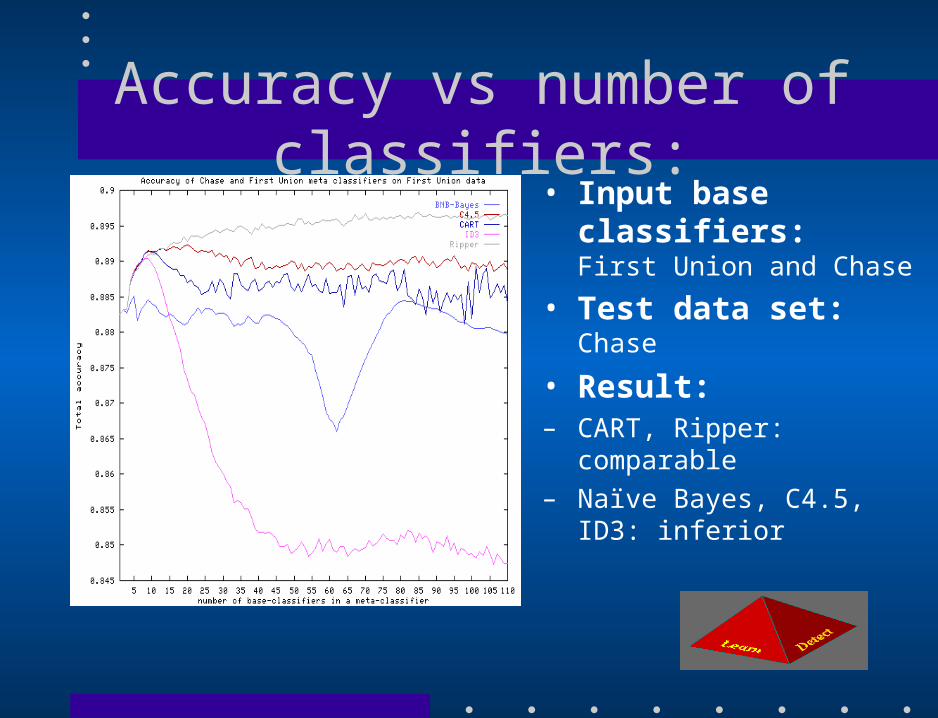
Accuracy vs number of classifiers:• Input base classifiers:
First Union and Chase
• Test data set:Chase
• Result:– CART, Ripper: comparable
– Naïve Bayes, C4.5, ID3: inferior
TP-FP vs number of classifiers:• Input base classifiers:
First Union and Chase
• Test data set:First Union
• Result:– Naïve Bayes, C4.5, CART:
comparable only when using all classifiers
– Ripper: superior only when using all classifiers
– ID3: inferior
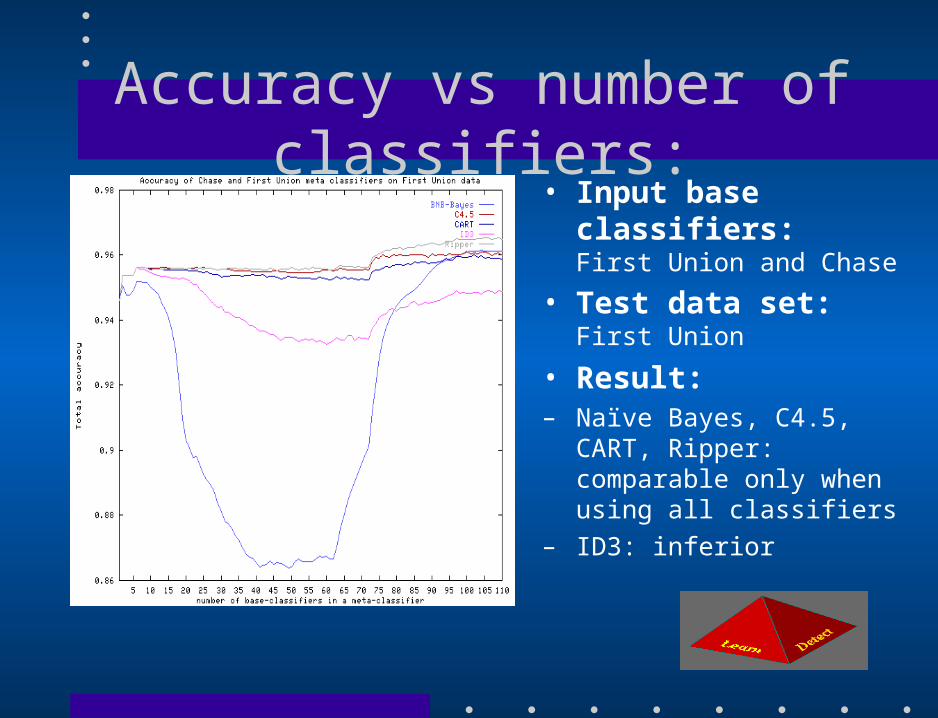
Accuracy vs number of classifiers:• Input base classifiers:
First Union and Chase
• Test data set:First Union
• Result:– Naïve Bayes, C4.5, CART,
Ripper: comparable only when using all classifiers
– ID3: inferior
Number ofClassifiers
Selection Criteria
Training Data TP-FP
TotalAccuracy Savings
25 TP-FP Chase 63.2% 89.2% $ 855K
25 Cost Model
Chase 63.0% 89.3% $ 903K
45 TP-FP Chase + FU
63.3% 89.6% $ 865K
1 TP-FP Chase 49.3% 87.6% $ 651K
1 Cost Model
Chase 44.8% 83.1% $ 966K
CHASE max fraud loss: $1,470K
Overhead: $75
FU max fraud loss: $ 1,085KNumber ofClassifiers
Selection Criteria
Training Data TP-FP
TotalAccuracy Savings
15 TP-FP FU 84.6% 96.6% $ 944K
23 Cost Model
FU 82.5% 96.4% $ 963K
100 TP-FP Chase + FU
83.6% 96.5% $ 957K
1 TP-FP FU 74.9% 94.8% $ 826K
1 Cost Model
FU 72.8% 94.3% $ 843K
Overhead: $75
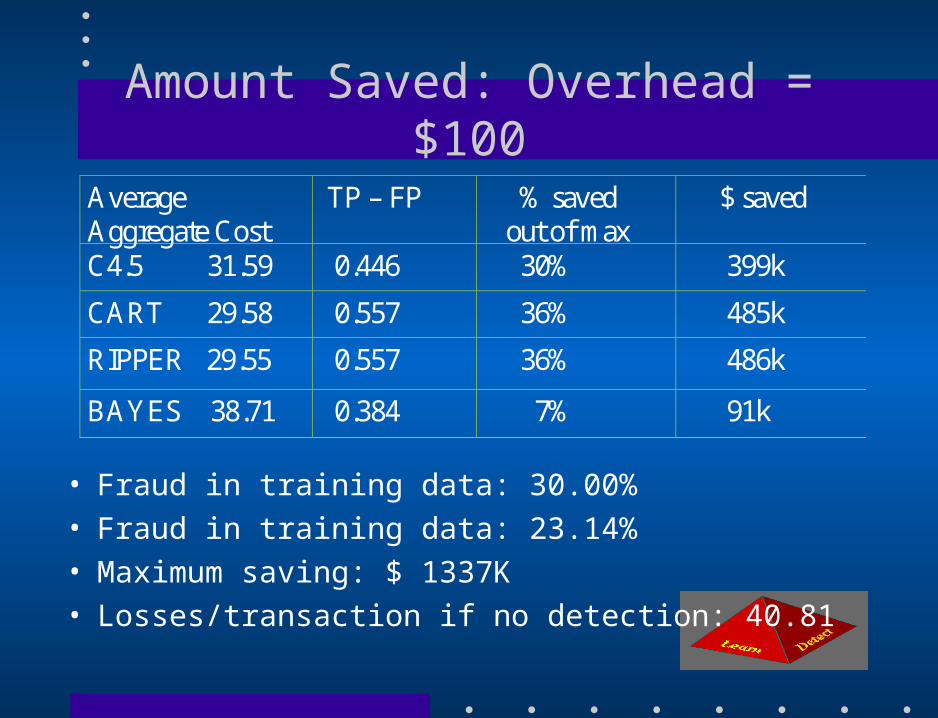
Aggregate Cost Model
Cost(FN) = tranamt
Cost(FP) = $X if tranamt > X (overhead) = 0 if tranamt <= X (ignore fraud)Cost(TP) = $X if tranamt > X (overhead) = tranamt if tranamt <= X (ignore fraud)Cost(TN) = 0
• $X overhead to challenge a fraud
Experiment Set-up
• Training data set: 10/1995 - 7/1996
• Testing data set: 9/1996
• Each data point is the average of the 10 classifiers (Oct. 1995 to July 1996)
• Training set size: 6,400 transactions (to allow 90% of frauds)
• Due to billing cycle and fraud investigation delays, training data are 2 months older than testing data
• Two experiments were conducted with different training data sets
• Test data set: 9/1996 (last month)
Training data sets• Back in time experiment:
– July 1996– June + July 1996– ...– October 1995 + ... + July 1996
• Forward in time experiment:– October 1995– October 1995 + November 1995– …– October 1995 + ... + July 1996
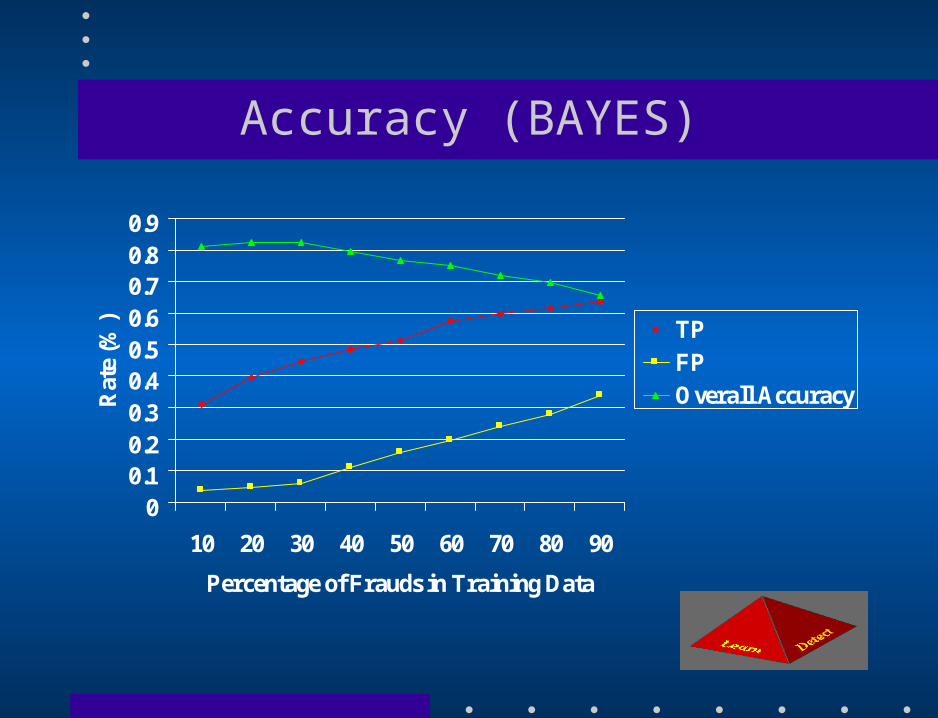
Patterns don’t change: Accuracy
0
0.2
0.4
0.6
0.8
1
1 2 3 4 5 6 7 8 9
Num of Months in Training data
Ra
te
TP(back in time)
FP (back in time)
Overall Accuracy(back in time)
FN (forward in time)
FP (forward in time)
Overall Accuracy(forward in time)
Patterns don’t change: Savings
26
27
28
29
30
31
32
33
1 2 3 4 5 6 7 8 9
Num of Month in Training Data
Sa
vin
gs
Per
Tra
nsa
ctio
n (
US
D)
Overhead=$25 back intimeOverhead=$50 back intimeOverhead=$75 back intimeOverhead=$100 back intimeOverhead=$125 back intimeOverhead=$150 back intimeOverhead=$25 forward intimeOverhead=$50 forward intimeOverhead=$75 forward intimeOverhead=$100 forward intimeOverhead=$125 forward intimeOverhead=$150 forward intime
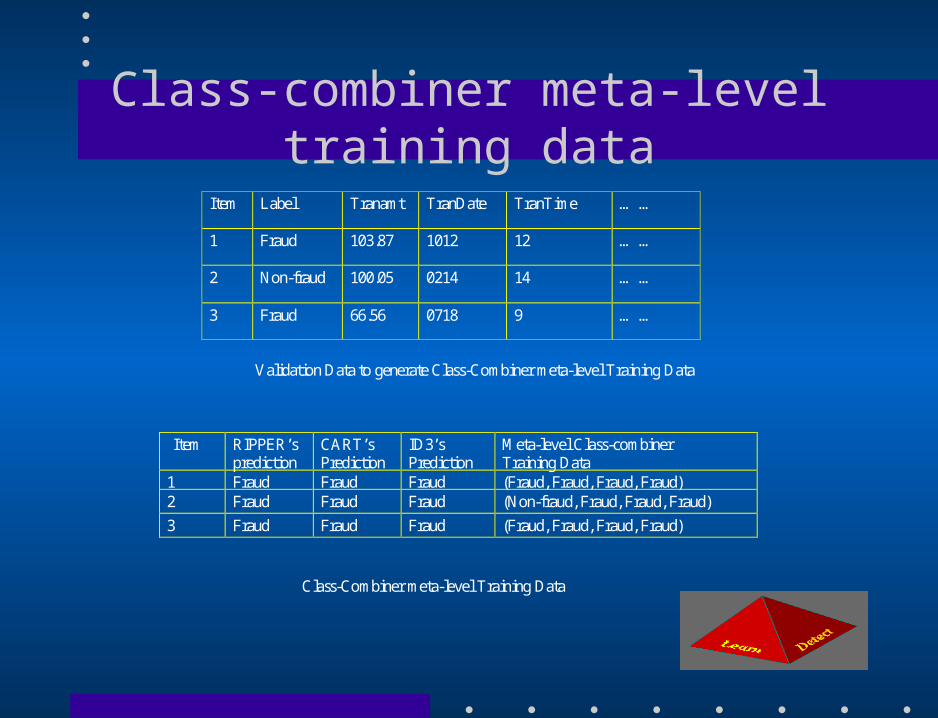
Divide and Conquer Conflict Resolving
• Conflicts: Base level data with different class labels yet same predicted classifications.
Class-combiner meta-level training data
Item Label Tranamt TranDate TranTime … …
1 Fraud 103.87 1012 12 … …
2 Non-fraud 100.05 0214 14 … …
3 Fraud 66.56 0718 9 … …
Validation Data to generate Class-Combiner meta-level Training Data