27

2
Background l Fraud is common and costly for the insurance industry.
– “According to the Federal Bureau of Investigations, insurance fraud is the second most costly white-collar crime in America, and accounts for more than $30 billion in losses every year.”*
l SIGI had an active SIU group within the claims department. However, based on perceived opportunity and a “proof of concept” project, in June of 2010 Selective Insurance began its “Automated Fraud Referral” project.
l All work described here in was done with Statistica v9-11. Statistica has been deployed within Selective as the enterprise modeling platform.
l * Allstate Insurance Website http://www.allstate.com/claims/fight-fraud.aspx
3
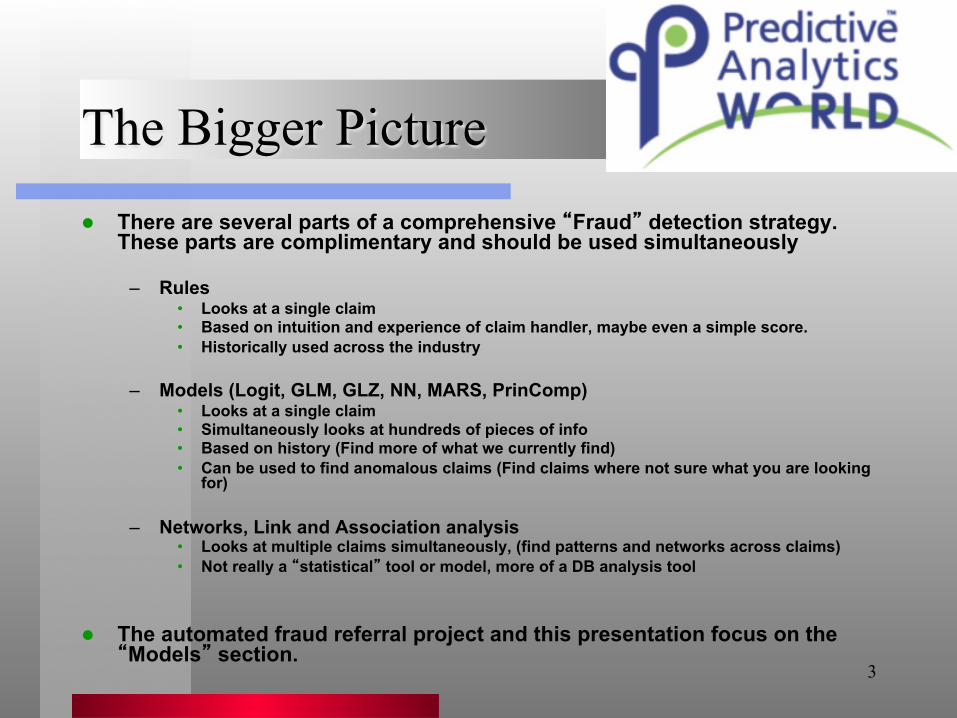
The Bigger Picture l There are several parts of a comprehensive “Fraud” detection strategy.
These parts are complimentary and should be used simultaneously
– Rules • Looks at a single claim • Based on intuition and experience of claim handler, maybe even a simple score. • Historically used across the industry
– Models (Logit, GLM, GLZ, NN, MARS, PrinComp) • Looks at a single claim • Simultaneously looks at hundreds of pieces of info • Based on history (Find more of what we currently find) • Can be used to find anomalous claims (Find claims where not sure what you are looking
for)
– Networks, Link and Association analysis • Looks at multiple claims simultaneously, (find patterns and networks across claims) • Not really a “statistical” tool or model, more of a DB analysis tool
l The automated fraud referral project and this presentation focus on the “Models” section.

4
Project Goals l The company historically used the rules
approach.
l As such, goals for project were simple: Take advantage of automation and advanced analytic capabilities to increase the economic impact of SIU activity, through:
• Increase the number of “Fraudulent” claims that are found. • Decrease the proportion of claims that SIU investigates
that are not “Fraudulent”

5
A Picture may help
All Claims
• Let the oval on the right represent the universe of all claims. • The smaller oval on the left represents the “Fraudulent” claims. • The oval on the right represents the claims SIU investigates. • The intersection represents claims that SIU investigated and determined “Fraud”. • Based on analytics, we are trying to shift the claims investigated to make the intersection bigger.
Fraud
Investigated

6
It’s a team effort
l 3 departments involved – Claims
• SIU is the ultimate customer. – IT
• Built a claims database specifically for analytics and scoring claims.
• Manage the projects execution. – Actuarial-Sr. Econometrician
• Responsible for all quantitative work. (design, build and supervise deployment)
7
Now What?
l Its easy, just clean the data, build a model and wait for the credit. . .
l Only problem, its not that easy! A significant number of issues and challenges exist. Those issues are the subject of this presentation.

8
Data Issues Issues always exist within fraud data and they MUST BE
DEALT WITH l Fraud and its detection are dynamic, the type of fraud and
its environment change. As such what you investigate and determine to be fraud change. Identifying a stable data window can be a challenge.
l Sample sizes are small. By the time you slice your data by lines of business, geography, time windows, etc., sample size gets very small very fast. By LOB we had only a few hundred proven fraud claims in our time window.
l Fraud data is biased and censored. We only know if the claim was fraudulent if SIU investigated. SIU investigated only if the claim was referred and claims referred are a biased sample.
9
The First Question l The first big question is, “What are we trying predict?”
l Our project was straightforward. “Can we identify claims that may be fraudulent early in the claim’s life-cycle?”
– This may not be specific enough, are you looking at a specific type of fraud, I.e., injury fraud vs. property fraud vs. a generic fraud?
– Do dollar amounts play a role?
l The questions boil down to, “How is your dependent variable specified?” Is a fraud variable binary (1/0), ordinal (1/2/3/4) or cardinal and a continuous variable?
l Given the limited sample sizes we had available it was determined that the data couldn’t support a more complex specification of fraud. I.e., we defined fraud as a binary variable.

10
Claim Data: We are data rich! l Claim data
– FNOL – Claim Data – Claims History – Medical Billing, Doctors, ICDX-9’s – Log Notes – ISO Reports
l Policy data, current and history l D+B l Census l Others? l Capstone List l Before text and ISO we had more than 350 raw data fields
l Time must play an explicit role in your independent variables.

11
Claims Data l Most of claims data is straightforward in interpretation and
structure for analysis and modeling. The handling of these data elements, i.e., policy holder age, sex, etc., is intuitively obvious.
l ISO reports are a semi-structured dynamic data source and with sophisticated SQL queries we were able to reconstruct this information into the structure appropriate for our modeling and analytics.
l The unstructured data, claim reps log notes was a very different story. Log notes are not English. They represent the handler’s notes (probably entered in real time) from a call or interaction at any point in the claim process. They contain fragments of sentences, abbreviations, acronyms, copy and pasted e mails, medical notes, supervisors notes, machine generated notes, typos, misspellings, etc.

12
Text Mining l Limit the time window for log notes.
– It is important to limit the biases created by the fact that more complex claims are open longer, have more log notes and are more likely to be referred to SIU.
– Likewise, post SIU referral log notes will contaminate your data if included.
l Traditional, top down, sentiment assessment or text mining is not appropriate and will produce nonsensical results when applied to the log notes.
l The inclusion text mining approach resolves many of the issues that the log note application creates.
– This approach requires manually building an inclusion list of words we are searching for in the log notes.
– From the inclusion list a text mining “dictionary” can be manually created. – This dictionary is then used to transform the unstructured log notes into the
structured variables used in modeling and analysis.

13
Text Mining l The inclusion list can be based on reps training, NICB, ISO,
etc., materials. However, everybody uses the language differently. There is no substitute for reading historically proven fraud claims’ log notes. You learn a lot.
l 5 issues need be confronted in the development of your inclusion list/dictionary
– Words vs. Concepts – Contextualization – Stemming – Word Count Specifications – Changing Characters

14
Inclusion List Dictionary Issues l Of the 5 issues listed, the resolution of 2 is clear:
– “Word count specification” should be a simple count. The added complexity of the more complex metrics appear to add little in predictive power.
• This count should then be transformed into a binary flag to avoid biasing your data by claim duration.
– Changing (adding or deleting) characters should only be done at the beginning of the dictionary’s creation and be done with great care. The impact of changing characters can be unpredictable.

15
Inclusion List Dictionary Issues l The remaining 3 issues:
– Words vs. Concepts – Contextualization and – Stemming are intimately related.
l Consider a simple workers comp example: according to the NICB if a worker was to be fired and they filed a WC claim- we should be suspicious of potential fraud.
16
Stemming l Stemming allows the text mining tool to stem a
word and the various cases, tenses, endings. In the case of the word “fired”, fire, firing, etc., are stemmed to the same word, “fire.”
l Stemming is powerful and can deal with many of the usage and typo issues.
l However, stemming can lead to false positives in your text mining. You’ll be surprised how many WC claims involve a fireplace or fire truck or a firebox or a machine firing.
l Stem with caution.

17
Contextualization
l As shown, stemming of the word “fired” has issues. A solution lies in the tradeoff of contextualization. For example if we look for the phrases “was fired” or “to be fired” or “on list for firing” we avoid many of the false positives.
l However, this solution is not cost free. – The benefits of stemming (typos, tenses, etc.) are lost. – Need to include all possible alternatives of the “contextualized phrase” in the inclusion list. It has to be an exact match.
– The count of times the phrase is found falls the more contextualized the phrase and at some point the phrase is so rare to be of no value in predictive modeling.

18
Words vs. Concepts l We just saw how the contextualized phrases “was fired” or “to be fired” can help deal with some stemming issues.
l However, all the “fired” words get at the concept that the claimant was to be terminated.
l I strongly recommend all the words that represent a single concept be rolled up into a variable for that specific concept. This strategy; – Rolls the different words “to be fired” and “was fired” into one
concept variable. – Allows the flexibility be include let go, layoff and terminate
words. – Avoids the various “fired” words having different parameters
and potential overspecification in modeling. – Helps increase the text data occurrence rates so that rare
phrases can be useful for predictive modeling.
19
Final Modeling Data l A stable data window, 2005-2010.6, was identified. l The 300+ raw data fields were combined with
about 200 “word” variables to create the source data file.
l The source data was transformed into a modeling data file of about 75k closed claims, with 500 variables including about 200 word and 25 text mining concepts.
l Of those closed claims, about 2300 had been investigated by SIU, with around 450 having been proven fraud.

20
Build the Model l At this point we had jumped over numerous data
hurdles and we were ready. We built a simple GLZ model on the investigated population.
l The various statistical results of the model were very good.
l We then used the model to score all the closed claims that were not investigated. We then sorted the claims based on score from high to low. By the normal measures of lift the results looked good.
l So we gave SIU a list of the highest scoring claims for their review. . .
l . . . and the results were not great!

21
The Solution l We had ignored the biased nature of the
investigated population. We needed a bridge between the general population of claims and those investigated by SIU.
l Approaches to building this bridge include; – Segmentations (clustering, machine learning) – Models (GLZ, NN)
l We developed the 2 model solution – These GLZ models are then used to generate a
prediction that is used as the referral criteria.

22
An Example
• The population of 75k closed claims were scored by the respective models.
• The claims were then sorted by score and broken into percentiles.
• The report on the following page presents the performance of the respective models.

23
Results
INVESTIGATED FRAUD Both
PERCENTILE
NOT LOOKED AT
INVESTIGATED
INJURY FRAUD
% INVESTIGATED IN PERCENTILE
NOT LOOKED AT
INVESTIGATED
INJURY FRAUD
% OF KNOWN INJURY FRAUD IN PERCENTILE
NOT LOOKED AT
INVESTIGATED
INJURY FRAUD
% OF KNOWN FRAUD IN PERCENTILE
100 342 389 122 17.0% 527 204 124 29.0% 403 328 171 40.0%99 438 288 68 12.6% 582 144 60 14.1% 527 199 72 16.9%98 522 204 46 8.9% 629 97 43 10.1% 582 144 26 6.1%97 573 153 28 6.7% 629 97 28 6.6% 607 119 26 6.1%96 593 133 26 5.8% 646 80 17 4.0% 610 116 21 4.9%95 605 121 17 5.3% 655 71 20 4.7% 610 116 17 4.0%94 654 72 16 3.1% 666 60 11 2.6% 644 82 9 2.1%93 663 63 10 2.7% 660 66 10 2.3% 668 58 9 2.1%92 661 65 9 2.8% 670 56 11 2.6% 642 84 12 2.8%91 671 55 7 2.4% 678 48 9 2.1% 672 54 6 1.4%90 676 50 8 2.2% 698 28 3 0.7% 678 48 3 0.7%
The above table shows the percentile results and the gain in lift from using the 2 model approach. The top percentiles lift jumps 33%, 40 vs. 29.

24
A Final Test
l As a final test, the Fraud and Investigate models were used to score the open claims in our claims DB.
l The top scoring claims were reviewed by SIU, 50+% were accepted for investigation.
l This served as the final acceptance check.
25
After Acceptance l Model deployment was done in Statistica Live Score.
– The models’ PMML and variable transformation code are generated in a Statistica workspace and passed directly into system integration.
l Deployment means nightly scoring of all claims that had any changes in the claim file that day. After the claims are scored, a report listing all claims that exceed the determined “threshold” is sent to SIU via e-mail.
l Then we wait. . .

26
Project Status l To date, 32 models are deployed across 6 lines of business.
l Hundreds of investigations, across all 6 lines of business have been opened from model referrals.
l Between 50-60% of modeled referrals are accepted for investigation. Somewhere between 25-50% of these investigated claims are ultimately determined to be “fraudulent.”
l Claims referred by the modeling project have an economic impact that averages about 35+% larger than claim handler referrals.
l The Fraud Modeling project paid for the project while in development. After 2 years the projects ROI is estimated between 350-500%.
l At current rates, the automated fraud referral project has increased SIU cost avoidance by 35-50%.

27
Future Opportunities l Opportunities exist to improve our SIU models’
performance. These include: – SIU referral feedback – Text Mining enhancement – Threshold optimization – Re-Referrals – Rules that utilize text mining results that are not viable in
modeling?
l The claims modeling infrastructure can be used for a variety of other claims modeling projects, including – Recovery – Severity – Litigation – Etc.