In is Issue Inflation and Prices August Price Statistics Financial Markets, Money, and Monetary Policy Staying the Course e Yield Curve International Markets Swap Lines Economic Activity and Labor Markets Cracks in the Real Economy e Employment Situation, September Trend Unemployment and What It Says about Unemployment Patterns Second-Quarter GDP, Final Revision Banking and Financial Markets Housing and the Banking Industry Economic Trends October 2008 (Covering September 11, 2008, to October 9, 2008)
Transcript
In Th is IssueInfl ation and Prices
August Price Statistics Financial Markets, Money, and Monetary Policy
Staying the CourseTh e Yield Curve
International MarketsSwap Lines
Economic Activity and Labor MarketsCracks in the Real EconomyTh e Employment Situation, SeptemberTrend Unemployment and What It Says about Unemployment PatternsSecond-Quarter GDP, Final Revision
Banking and Financial Markets Housing and the Banking Industry
Economic TrendsOctober 2008
(Covering September 11, 2008, to October 9, 2008)
2Federal Reserve Bank of Cleveland, Economic Trends | October 2008
Infl ation and PricesAugust Price Statistics
09.26.08 Brent Meyer
Th e Consumer Price Index (CPI) fell for the fi rst time since October 2006, declining at an annual-ized rate of 1.6 percent in August. It was pulled down, as expected, by a large decrease (−31.8 per-cent) in energy prices, which, in the three months prior to August, had helped to push the CPI up 10.6 percent. Th e CPI excluding food and energy (core CPI) increased 2.4 percent during the month, compared to a 4.0 percent increase in July and a 3.9 percent increase in June. Th e median and 16 percent trimmed–mean CPI estimates also rose more slowly in August than in July. Th e median CPI rose 3.5 percent during the month, down from 4.7 percent in July. At the same time, the 16 per-cent trimmed–mean CPI increased just 1.2 percent, compared to a 7.2 percent increase last month.
In August, 30 percent of the components of the CPI exhibited price decreases, while 22.5 percent experienced increases at rates exceeding 5.0 percent (so a majority of the index’s components fell into the tails of the distribution). Th e prices of some fairly substantial components—gas and piped electricity, lodging away from home, new vehicles and used cars and trucks, and communication—which together account for 16 percent of house-hold expenditures on CPI components, decreased in August. Th e combined weight of their decreases helped to pull down the 16 percent trimmed–mean. It also explains some of the disparity be-tween the median and the 16 percent trimmed–mean measures.
Over the past 12 months, the CPI has increased 5.4 percent. Th e longer-term trends in the core and trimmed-mean measures remained somewhat elevated in August, ranging between 2.5 percent and 3.5 percent.
Core services, which account for roughly 55 per-cent of the overall CPI, exhibited price gains in August (up 3.0 percent), roughly in line with the longer–term trend of 3.3 percent. Core goods pric-
August Price Statistics Percent change, last
1mo.a 3mo.a 6mo.a 12mo. 5yr.a 2007 avg.
Consumer Price Index All items −1.6 7.2 6.0 5.4 3.5 4.2 Less food and energy 2.4 3.4 2.6 2.5 2.3 2.4 Medianb 3.5 4.3 3.5 3.3 2.8 3.1 16% trimmed meanb 1.2 4.6 4.0 3.5 2.7 2.8Producer Price Index Finished goods −10.5 8.6 9.6 9.7 4.9 7.1 Less food and energy 2.9 4.6 4.3 3.7 2.2 2.1
a. Annualized.b. Calculated by the Federal Reserve Bank of Cleveland.Sources: U.S. Department of Labor and Bureau of Labor Statistics.
0
510
1520
25
3035
4045
50
<0 0 to 1 1 to 2 2 to 3 3 to 4 4 to 5 >5
Weighted frequency
CPI Component Price Change Distributions
August 20082008 year-to-date average
Source: Bureau of Labor Statistics.
Annualized monthly percentage change
3Federal Reserve Bank of Cleveland, Economic Trends | October 2008
es returned to trend growth, increasing 0.8 percent in August after a hefty 5.6 percent gain last month.
Short-term (one-year ahead) average infl ation expectations fell to 3.9 percent in September (as measured by the University of Michigan’s Survey of Consumers), as energy and commodity prices con-tinued to fall from recent highs. Long–term (5–10 year) average infl ation expectations decreased from 3.9 percent in August to 3.1 percent in September.
1
2
3
4
5
6
1998 2000 2002 2004 2006 2008
12-month percent change
Core CPI
Median CPIa
16% trimmed-mean CPIa
CPI
CPI, Core CPI, and Trimmed-Mean CPI Measures
a. Calculated by the Federal Reserve Bank of Cleveland.Sources: U.S. Department of Labor, Bureau of Labor Statistics, FRBC.
-6-5-4-3-2-1012345678
1998 2000 2002 2004 2006 2008
12-month percent change
Core goods
One-month annualized percent change
Core CPI Goods and Core CPI Services
Source: U.S. Department of Labor, Bureau of Labor Statistics.
Note: Mean expected change as measured by the University of Michigan’s Survey of Consumers. Source: University of Michigan.
4Federal Reserve Bank of Cleveland, Economic Trends | October 2008
Financial Markets, Money, and Monetary PolicyStaying the Course
09.17.08 John Carlson and Sarah Wakefi eld
In a unanimous vote, the Federal Open Market Committee (FOMC) voted to keep its target fed funds rate steady at 2 percent. In its statement, the FOMC recognized that “Strains in fi nancial mar-kets have increased signifi cantly...” While noting that credit conditions had tightened, the statement concluded, “Over time, the substantial easing of monetary policy, combined with ongoing measures to foster market liquidity, should help to promote moderate economic growth.”
Just last week, most market participants took the no-change outcome as a given. However, fi nancial market developments over the weekend sent shock-waves through the whole fi nancial system. By Mon-day, options and futures prices on the fed funds rate indicated that odds slightly favored a rate cut of at least 25 basis points. But that was not to be.
Th e dramatic collapse of Lehman Brothers, the hasty sale of Merrill Lynch to Bank of America, and the appeal of AIG for aid changed all that. Concerns about liquidity and systemic risk, which had been rising, intensifi ed. One closely watched indicator of liquidity conditions, the spread be-tween the term borrowing rate in the London interbank market (Libor) and the cash market rate (OIS), refl ected these developments. Th e spread for one-month borrowing had declined consider-ably from recent peaks; however, recent turmoil in fi nancial markets has caused the spread to increase substantially.
Rather than addressing this liquidity problem with a change in the policy rate, the Fed decided to continue to rely on its several lending facilities. Th e New York Federal Reserve Bank added $50 billion in liquidity to money markets through overnight repurchase agreements, known as repos. In ad-dition, the Trading Desk, which conducts open market operations on behalf of the Federal Reserve, said in a statement that it “stands ready to arrange further operations later in the day, as needed.”
0
1
2
3
4
5
6
7
8
1999 2000 2001 2002 2003 2004 2005 2006 2007 2008
Percent
Effective federal funds ratea
Intended federal funds rateb
Primary credit rateb
Discount rateb
Reserve Market Rates
a. Weekly average of daily figures.b. Daily observations.Sources: Board of Governors of the Federal Reserve System, “Selected Interest Rates,” Federal Reserve Statistical Releases, H.15.
0.0
0.1
0.2
0.3
0.4
0.5
0.6
0.7
0.8
0.9
1.0
5/09 5/24 6/08 6/23 7/08 7/23 8/07 8/22 9/06
September Meeting OutcomesImplied probability
2.25%
2.00%
1.75%
2.50%
2.75%
3.00%
Industrial Production (Aug)
1.50%
Note: Probabilities are calculated using trading-day closing prices from options on federal funds futures that trade on the Chicago Board of Trade.Sources: Chicago Board of Trade and Bloomberg Financial Services
5Federal Reserve Bank of Cleveland, Economic Trends | October 2008
Th e markets backed off on an expectation for a rate hike at the FOMC’s next meeting in October. Th e odds for the no-change outcome moved to better than even.
Ten-year minus three-month yield s pread
R eal GDP growth (year-to-year percent change)
rpr
e-
Peaa
-4
-2
0
2
4
6
8
10
12
1953 1963 1973 1983 1993 2003
PercentYield Spread and Real GDP Growth
Sources: Bureau of Economic Analysis; Federal Reserve Board.Note: Shaded bars represent recessions
0.00
0.20
0.40
0.60
0.80
1.00
1.20
7/07 9/07 11/07 1/08 3/08 5/08 7/08
Percent
One-Month LIBOR Spread
Notes: Daily observations; LIBOR spread is the one-month LIBOR rate minus the one-month OIS Rate. Sources: Bloomberg Financial Services, Financial Times.
0.0
0.1
0.2
0.3
0.4
0.5
0.6
0.7
0.8
0.9
1.0
8/01 8/12 8/23 9/03 9/14
October Meeting OutcomesImplied probability
2.25%
2.00%
2.50% 1.75%
1.50%
Industrial Production (Aug)
1.25%
Consumer Price Index (Aug); FOMC Statement
Note: Probabilities are calculated using trading-day closing prices from options on federal funds futures that trade on the Chicago Board of Trade.Sources: Chicago Board of Trade and Bloomberg Financial Services
Financial Markets, Money, and Monetary Policy Th e Yield Curve
09.26.08 Joseph G. Haubrich and Kent Cherny
Since last month, the yield curve has moved lower and gotten steeper, as both short and long-term interest rates fell. One reason for noting this is that the slope of the yield curve has achieved some no-toriety as a simple forecaster of economic growth. Th e rule of thumb is that an inverted yield curve (short rates above long rates) indicates a recession in about a year, and yield curve inversions have preceded each of the last six recessions (as defi ned by the NBER). Very fl at yield curves preceded the previous two, and there have been two notable false positives: an inversion in late 1966 and a very fl at curve in late 1998. More generally, though, a fl at curve indicates weak growth, and conversely, a steep curve indicates strong growth. One measure of slope, the spread between 10-year Treasury bonds and 3-month Treasury bills, bears out this relation, particularly when real GDP growth is lagged a year to line up growth with the spread that predicts it.
6Federal Reserve Bank of Cleveland, Economic Trends | October 2008
Th e fi nancial crisis showed up in the yield curve, with rates falling since last month, as investors fl ed to quality. Th is was particularly true at the short end, with the 3-month rate dropping from 1.86 percent all the way down to 0.62 percent (for the week ending September 19).
Th e 10-year rate took a substantial but less impres-sive drop from 3.91 to 3.52 percent. Consequently, the slope increased by a full 85 basis points, moving to 290 basis points up from the 205 basis points for August and well above the 213 basis points seen in July. Th e fl ight to quality and the turmoil in the fi nancial markets may impact the reliability of the yield curve as an indicator growth, but projecting forward using past values of the spread and GDP growth suggests that real GDP will grow at about a 3.0 percent rate over the next year. Th is remains on the high side of other forecasts.
While such an approach predicts when growth is above or below average, it does not do so well in predicting the actual number, especially in the case of recessions. Th us, it is sometimes preferable to focus on using the yield curve to predict a discrete event: whether or not the economy is in recession. Looking at that relationship, the expected chance of the economy being in a recession next September stands a miniscule 0.2 percent, down from August’s 1.3 percent and July’s 1.1 percent.
Th e probability of recession is below several recent estimates and perhaps seems strange the in the midst of the recent fi nancial concerns, but one aspect of those concerns has been a fl ight to quality which lowers Treasury yields. Furthermore, both the federal funds target rate and the discount rate have remained low, which tends to result in a steep yield curve. Remember also that the forecast is for where the economy will be next September, not earlier in the year.
To compare the 0.2 percent to some other prob-abilities, and learn more about diff erent techniques of predicting recessions, head on over to the Econ-browser blog.
Of course, it might not be advisable to take this number quite so literally, for two reasons. First, this probability is itself subject to error, as is the case
-4
-2
0
2
4
6
8
10
12
1953 1963 1973 1983 1993 2003
Percent
Ten-year minus three-month yield spread
One year lagged real GDP growth (year-to-year percent change)
Yield Spread and One-Year Lagged Real GDP Growth
Sources: Bureau of Economic Analysis; Federal Reserve Board.
-2
-1
0
1
2
3
4
5
6
2002 2003 2004 2005 2006 2007 2008 2009
Percent
Ten-year minus three-month yield s pread
R eal GDP growth (year-to-year percent change)
P redicted GDP growth
Yield Spread and Predicted GDP Growth
Sources: Bureau of Economic Analysis; Federal Reserve Board.
0
10
20
30
40
50
60
70
80
90
100
1960 1966 1972 1978 1984 1990 1996 2002 2008
Percent
Forecas t
P robability of reces s ion
Probability of Recession Based on the Yield Spread
Sources: Bureau of Economic Analysis; Federal Reserve Board; author’s calculations.Note: Estimated using probit model.
7Federal Reserve Bank of Cleveland, Economic Trends | October 2008
with all statistical estimates. Second, other research-ers have postulated that the underlying determi-nants of the yield spread today are materially dif-ferent from the determinants that generated yield spreads during prior decades. Diff erences could arise from changes in international capital fl ows and infl ation expectations, for example. Th e bottom line is that yield curves contain important information for business cycle analysis, but, like other indicators, should be interpreted with caution.
For more detail on these and other issues related to us-ing the yield curve to predict recessions, see the Com-mentary “Does the Yield Curve Signal Recession?”
To see other forecasts of GDP growth:http://www.cbo.gov/ftpdocs/89xx/doc8979/02-15-EconForecast_ConradLetter.pdf
To see other probabilities of recession:http://www.bloomberg.com/apps/news?pid=20601087&sid=aEX73qWiBrb4
Econbrowser blog is available at:http://www.econbrowser.com/archives/2008/02/predicting_rece.html
Does the Yield Curve Signal Recession?,” by Joseph G. Haubrich. 2006. Federal Reserve Bank of Cleveland, Economic Commentary, is available at:http://www.clevelandfed.org/Research/Commentary/2006/0415.pdf
International ActivitySwap Lines
10.09.08 Owen F. Humpage and Michael Shenk
Th e current fi nancial crisis is global. Banks in many countries are scrambling for liquidity—not just in their own currencies, but in dollars too. Th e Federal Reserve has attempted to facilitate this process by set-ting up swap lines with the world’s key central banks.
Th e dollar is world’s leading international cur-rency. Many cross-border transactions—even between individuals who are not residents of the United States—are denominated in U.S. dollars. Commodities, most notably oil, are an excellent example; they typically are priced in U.S. dollars, and payments usually are made in U.S. dollars. Because of the dollar’s international role, large banks around the globe hold signifi cant amounts of dollar-denominated assets and liabilities. Many of these banks have found themselves stuck with dollar-denominated assets that are tied to the U.S.
Libor-Federal Funds Rate Spread
-1
0
1
2
3
4
5
7/07 10/07 1/08 4/08 7/08 10/08
Note: Spread is calculated with the overnight dollar Libor.Sources: The Federal Reserve Board; Financial Times.
Percent
8Federal Reserve Bank of Cleveland, Economic Trends | October 2008
real estate debacle or that are otherwise distressed. Th ese banks, like many U.S. domestic banks, have been scrambling for needed dollar liquidity, but the interbank market has frozen up as banks with funds worry about potential counterparties’ balance sheets.
Indicative of the problem, rates on overnight inter-bank loans have recently shot skyward. Over the past year, spreads between the Libor (the index rate on overnight dollar funds in the London interbank market) and the federal funds rate, which typically are miniscule, became large and very volatile. In September, these rate spreads frequently exceeded a whopping 4 percentage points.
Th e Federal Reserve has been helping to provide dollar liquidity to foreign markets by agreeing to “swap” U.S. dollars temporarily for foreign curren-cy. On September 29, the System off ered swaps to-taling $620 billion dollars to nine key central banks through April 2009, if necessary. In a swap transac-tion, the Federal Reserve and a foreign central bank immediately exchange U.S. dollars for the foreign currency at a specifi c exchange rate—typically the prevailing spot rate—and simultaneously agree to reverse the transaction at a set exchange rate—often the same exchange rates—on a specifi c date in the future. Conducting the spot and forward legs of this currency swap at set exchange rates protects both the Federal Reserve and its foreign counter-part from losses (or gains) associated with any un-anticipated intervening exchange-rate movements. During the term of the swap, the United States holds its foreign exchange in a special account at the foreign central bank, and the participating foreign Special Temporary Swap Lines
9Federal Reserve Bank of Cleveland, Economic Trends | October 2008
central bank uses its newly acquired funds to provide emergency dollar liquidity to commercial banks.
Over the past 50 years, the Federal Reserves has often used swaps to fi nance foreign exchange interventions and to provide temporary funding to foreign coun-tries in times of fi nancial chaos. During the 1960s, for example, the Fed established a serious of recipro-cal swap lines with the major developed countries. At the time, the dollar was pegged to gold, and foreign currencies were fi xed to the dollar. When foreign countries accumulated unwanted dollars reserves, they could exchange them with the U.S. Treasury for gold. Often, however, the U.S. monetary authorities believed that the foreign infl ow of unwanted dollars would soon reverse, so they encouraged foreign cen-tral banks not to convert dollars into gold too hastily. A key way of doing so utilized swaps. Th e Federal Reserve would swap dollars for foreign currency with a central bank that held too many U.S. dollars and then use the newly acquired foreign currency to buy the excess dollars from that same foreign central bank. Th is sounds odd, because this set of transac-tions left the foreign central bank holding just as many dollars as initially was the case. It often worked because the central bank now held dollars under a swap with an established, single exchange rate for both the forward and spot legs of the transaction. Th e deal then protected the foreign central bank for the term of the swap against any dollar depreciation.
After March 1973, when exchange rates began to vary with market pressures, the Fed sometimes intervened to infl uence them. When the Fed wanted to prop up the dollar by selling foreign exchange, it often facilitated the operation by drawing foreign exchange on its swap lines. Use of the swap lines for foreign exchange intervention waned as the Fed eventually acquired a substantial portfolio of Ger-man marks and Japanese yen, which it could use for intervention purposes instead. Th e Fed also used swap lines to provide dollars temporarily to Mexico during the peso crises of 1982 and 1995. Th e United States terminated all of its on-going swap lines when Europe inaugurated the euro, except for two lines with our NAFTA partners, Canada and Mexico. Nevertheless, swaps are easy to step up and off er central banks a useful, very fl exible mechanism for acquiring foreign currencies.
10Federal Reserve Bank of Cleveland, Economic Trends | October 2008
Economic Activity and Labor Markets Cracks in the Real Economy
10.02.08 Timothy Dunne and Kyle Fee
Not too surprisingly, news of general economic ac-tivity has taken a backseat to news of the problems plaguing the U.S. fi nancial system. A look at the main data releases of September (which describe the economic activity of August) suggests a picture of weakening across a broad range of the economy. Th e month opened with the Bureau of Labor Statistics reporting a sharp rise in the unemploy-ment rate, from 5.7 percent in July to 6.1 percent in August, along with a drop of 84,000 in payroll employment. Th e BLS also revised downward its estimates of payrolls for June and July.
Although the unemployment rate is at levels similar to that experienced shortly after the last recession, the drop in payroll employment has been rela-tively modest in comparison to previous recessions. According to the BLS, payroll employment de-clined in each month in 2008, though none of the month’s losses exceeded 100,000 workers. To put this fi gure in perspective, note that job losses dur-ing the 2001 recession averaged 200,000 workers a month.
Th e employment report for September won’t be released until tomorrow, but the unemployment claims data published weekly throughout the month suggest that labor markets continued to weaken during the month. Th e four–week moving average of continuing claims moved substantially higher throughout August and the fi rst part of September. To be sure, some of these statistics have been negatively impacted by the recent hurricanes in Texas and Louisiana, but even factoring in such events, initial claims and continuing claims remain at high levels.
While the labor data over the last several months have indicated a deteriorating economy, monthly data on industrial production, durable goods, and retail sales have off ered a somewhat mixed picture up through July. In fact, initial reports for indus-trial production and durable goods shipments and
3
4
5
6
7
1998 2000 2002 2004 2006 2008
Unemployment RatePercent
Notes: Data are seasonally adjusted. Shaded bar indicate recession.Source: Bureau of Labor Statistics.
-400
-300
-200
-100
0
100
200
300
400
500
1998 2000 2002 2004 2006 2008
Payroll EmploymentMonthly Change
Notes: Data are seasonally adjusted. Shaded bar indicate recession.Source: Bureau of Labor Statistics.
11Federal Reserve Bank of Cleveland, Economic Trends | October 2008
orders for July showed some strength. However, these series turned sharply lower in August, with July data being revised downward, as well. Industri-al production fell 1.1 percent from July to August. It is important to caution that one month does not make a trend, and the data are subject to revi-sion. Th at said, our fi rst look at manufacturing for September shows the sector contracting. Th e ISM manufacturing index registered 43.5 for September, where an index value below 50 indicates contrac-tion. September’s reading of 43.5 was well below August’s (49.5) and the lowest since 2001.
Th e softening in the goods sector has also been evident in the retail sector. Both July and August showed month–over–month declines in retail sales of −0.6 percent and −0.3 percent, respectively.
Residential construction continued to be weak, as both housing starts and new-home sales hit lows not seen since the recession in the early 1990s. Th is represents year–over–year declines of almost 35 percent for each series, and month-over-month declines of−1.9 percent for single–family–housing starts and −11.5 percent for new-home sales.
Rounding out the month’s data for August is this week’s report from Bureau of Economic Analysis on monthly personal income and outlays. Real personal consumption expenditures in both July and August were below the second–quarter’s levels. Th is drop refl ects, in part, the unwinding of the stimulus package, which had a much larger impact in the second quarter than in July or August. While the data for September are not yet available and the July and August data are still subject to revision, the fi rst two months of data for the third quarter indicate that real PCE growth may well be negative for the current quarter.
In short, almost all major monthly data releases describing economic activity in August show a deteriorating economic environment.
1,500
2,000
2,500
3,000
3,500
4,000
1998 2000 2002 2004 2006 2008
Unemployment Insurance: Continued ClaimsFour-week moving average (thousands)
Notes: Data are seasonally adjusted. Shaded bar indicate recession.Source: U.S. Department of Labor.
-4
-3
-2
-1
0
1
2
3
8/06 12/06 4/07 8/07 12/07 4/08 8/08Note: Data are seasonally adjusted.Source: Census Bureau.
Durable Goods: ShipmentsMonthly percent change
109
110
111
112
113
Note: Data are seasonally adjusted.Source: Federal Reserve Board
Industrial ProductionIndex, 2002 = 100
8/06 12/06 4/07 8/07 12/07 4/08 8/08
12Federal Reserve Bank of Cleveland, Economic Trends | October 2008
424344454647484950515253545556
8/06 12/06 4/07 8/07 12/07 4/08 8/08
ISM Manufacturing Index
Note: Data are seasonally adjusted.Source: Institute for Supply Management.
Composite index, 50+ = increasing
-1.5
-1.0
-0.5
0.0
0.5
1.0
1.5
2.0
8/06 12/06 4/07 8/07 12/07 4/08 4/08Note: Data are seasonally adjusted.Source: Census Bureau; Haver Analytics.
Retail SalesMonthly percent change
600650700750800850900950
1,0001,0501,1001,1501,2001,2501,3001,3501,400
8/06 12/06 4/07 8/07 12/07 4/08 8/08Note: Data are seasonally adjusted annual rates.Source: Census Bureau.
Housing StartsSingle-family units (thousands)
400450500550600650700750800850900950
1,0001,0501,100
New Homes Sales
Note: Data are seasonally adjusted annual rates.Source: Census Bureau.
Single-family units (thousands)
8/06 12/06 4/07 8/07 12/07 4/08 8/08
8,250
8,275
8,300
8,325
8,350
8,375
Real PCE2000 dollars (billions)
Note: Data are seasonally adjusted annual rates.Source: Bureau of Economic Analysis
8/06 12/06 4/07 8/07 12/07 4/08 8/08
13Federal Reserve Bank of Cleveland, Economic Trends | October 2008
Economic Activity and Labor Markets Th e Employment Situation, September
10.06.08 Murat Tasci and Beth Mowry
Nonfarm payrolls declined by 159,000 between August and September, with losses spread across a wide range of industries. Th is marks the ninth consecutive month of employment decline and a continuation of the 6.1 percent unemployment rate, which remains the highest seen since Septem-ber 2003. Revisions to July and August payrolls roughly cancelled each other out and amounted to modest additional gains of 4,000 for those two months combined. September’s decline in payrolls was larger than consensus expectations, which called for losses in the neighborhood of 105,000. Since the decline in payrolls started back in Janu-ary, the United States has shed a total of 760,000 jobs.
Th e diff usion index of employment change sank further, moving from 44.7 in August to 38.1 in September. An index reading below 50 indicates that more employers are cutting jobs than adding them, and this past month’s movement indicates that an increasing number of employers began to do so in September. Th e index has not been this low since June 2003.
Th e goods-producing sector shed 77,000 jobs last month due to losses in both manufacturing (-51,000) and construction (-35,000). Manufac-turing’s losses were felt predominantly in durable goods (-37,000), particularly in the area of motor vehicles and parts (-18,200). Residential and non-residential construction both recorded job losses in this report, unlike in August when only residential construction lost jobs. Natural resources and min-ing continued to make a lone positive contribution of 9,000 jobs to goods-producing industries.
Service-providing industries took a greater turn for the worse in September, losing 82,000 jobs, compared to August’s smaller loss of 16,000. Losses were experienced broadly in service industries, with the exception of a 25,000 gain in education and health and a 9,000 gain in the government
Labor Market Conditions
Average monthly change(thousands of employees, NAICS)
a. Includes construction of residential buildings and residential specialty trade contractors.b. Includes construction of nonresidential buildings and nonresidential specialty trade contractors.c. Includes the fi nance, insurance, and real estate sector and the rental and leasing sector.d. Professional business services, which includes professional, scientifi c, and technical services, the management of companies and enterprises, administra-tive and support, and waste management and remediation services.Source: Bureau of Labor Statistics.
14Federal Reserve Bank of Cleveland, Economic Trends | October 2008
sector. However, the gain in government was less impressive than gains in the previous two months (39,000 and 31,000). Likewise, the gain in edu-cation and health was the smallest experienced during all of this year and the last. Within services, trade, transportation, and utilities lost 58,000 jobs, professional and business services lost 27,000, and fi nancial activities and leisure and hospitality each lost 17,000. Retail trade fell further, dropping 40,100 jobs in September, compared to August’s drop of 25,400. Temporary help services, consid-ered a leading indicator of overall employment con-ditions, continued to decline, recording its eleventh consecutive month of losses with a loss this month of 24,100 jobs.
Th e three-month moving average of private-sector-employment growth dug itself deeper into the negative territory fi rst entered back in January and now sits at -126,000. Although headline payroll employment numbers for July and August were revised only modestly, private payrolls for these two months were revised downward by 40,000 and 43,000, respectively. Government payrolls were revised up 33,000 and 14,000. For the year, pri-vate payrolls are down 969,000, while government payrolls have risen by 209,000. Th ese revisions show that overall payroll decline underestimates the loss in private payrolls due to signifi cant gains in government payrolls.
Results from the government’s household sur-vey indicates that the total unemployment rate stayed steady at 6.1 percent in September. Even though the number of those employed declined by 222,000, the labor force declined by 121,000, keeping the unemployment rate where it was in August. Th ese monthly changes are common in the household survey and do not constitute a signifi -cant change.
-200
-150
-100
-50
0
50
100
150
200
250
2005 2006 2007 2008YTD
Q4 Q1 Q2 Q3 Jul Aug Sep
Average Nonfarm Employment ChangeChange, thousands of jobs
RevisedPrevious estimate
2007
Source: Bureau of Labor Statistics.
2008
Private Sector Employment Growth
-200-150-100
-500
50100150200250300350
2003 2004 2005 2006 2007 2008
Source: Bureau of Labor Statistics.
Change, thousands of jobs: Three-month moving average
3
4
5
6
7
2000 2002 2004 2006 2008
Percent
Note: This is the seasonally adjusted rate for the civilian population, age 16+.Source: Bureau of Labor Statistics.
Unemployment Rate
15Federal Reserve Bank of Cleveland, Economic Trends | October 2008
Economic Activity and Labor Markets Trend Unemployment and What It Says about Unemployment Patterns
09.19.08 Murat Tasci and Beth Mowry
Th e unemployment rate increased to 6.1 percent in September from 5.7 percent a month earlier. Just a few months ago, in May, the rate experienced another sharp rise, from 5.0 to 5.5 percent. A year ago, the unemployment rate was just 4.7 percent. Such movements in the unemployment rate are not unusual by any measure, and they have been studied for a long time. For the past 60 years, the unemployment rate has varied between 2.5 percent and 10.8, rising during recessions and falling dur-ing expansions. Th is pattern makes it what econo-mists call a countercyclical variable. Typically, the rate rises sharply at the onset of a recession, but it usually takes a while for the rate to drop back down once the recession ends. Th ese cyclical fl uctuations in the unemployment rate are a robust feature of the data, and even though the timing of the ups and downs changes somewhat across diff erent historical episodes, the clear countercyclical pattern tends to hold.
However, monthly fl uctuations in the unemploy-ment rate include a lot of cyclical movements that may be only temporary. Removing those cyclical el-ements can help to see the longer-term picture, and this we can do by smoothing the data to calculate the unemployment rate’s trend. When we look at the trend along with the monthly data for the last two recessions and the recoveries that followed, we see that the trend increased slightly in both cases, but the unemployment rate stayed above the trend for more than two years. Th is view shows that it takes a while for the unemployment rate to return to its long-run trend after recessions, but once it gets there, it stays there for the rest of the expan-sion. Th e unemployment rate returns to its trend only when the expansion is long enough, like the two that preceded the 2001 recession.
One might expect the pattern just described to be diff erent for various segments of the workforce, since workers’ desire for employment or their employability can diff er, depending on their age,
2
4
6
8
10
12
1948 1958 1968 1978 1988 1998 2008
Unemployment Rate for All Workers (Aged 16+)Percent
Monthly data
Trend
Notes: Data are seasonally adjusted. The trend was generated by using a Hodrick-Prescott filter with a smoothing parameter of 10^5. Shaded barsindicate recessions.Source: Bureau of Labor Statistics.
16Federal Reserve Bank of Cleveland, Economic Trends | October 2008
gender, or education. For instance, older workers have always had lower unemployment rates than younger workers. Because older workers are argu-ably more attached to the labor force and more experienced at their jobs, they are less likely to be let go in a downturn and more likely to be hired in a boom. Th is story likewise explains the higher unemployment rate of younger workers as well as its greater volatility. However, the trend rates for diff erent-aged workers in general follow the overall pattern of the aggregate unemployment rate. A look at the trends also suggests that most of the up-ward trend in unemployment in the late 1960s and 1970s, as well as the downward trend that followed, was led by young workers.
Education does not appear to aff ect the basic coun-tercyclical unemployment pattern either. As one might expect, years of schooling is negatively cor-related with the unemployment rate. For instance, workers with at least a college degree have the low-est unemployment rate, around 2.4 percent on av-erage since 1992. Th is compares with 3.9 percent for workers with some college, 4.8 percent for high school graduates, and 8.9 percent for high school drop outs. Even though we do not have a long enough time series to detect a clear cyclical pattern, we can see that over the last recession the behavior of the unemployment rates of workers with diff er-ent levels of education fi ts the general picture.
Th e unemployment rate for men and women also follows the countercyclical pattern, rising around the start of recessions and falling after the end of downturns. On the other hand, the overall trend in each of the two groups has been steadily changing over time. Until mid-1980s, the unemployment rate for women stayed consistently below that of men. Since then, the two unemployment rates have almost converged. One reason for this could be the higher labor force participation and higher educational attainment of women in the past two decades. Th ese two potentially related facts cre-ated a female workforce with a stronger attachment to the labor market, whose unemployment profi le increasing resembled that of men. One might even argue that the unemployment rate trend for men is now above the women’s.
2
4
6
8
10
12
14
1948 1958 1968 1978 1988 1998 2008
Trend Unemployment Rates for Workers at Various AgesPercent
Notes: Data are seasonally adjusted. The trend was generated using a Hodrick-Prescott filter with a smoothing parameter of 10^5. Shaded barsindicate recessions.Source: Bureau of Labor Statistics.
20–24
25–34
35–44
45–54
0
4
8
12
16
1948 1958 1968 1978 1988 1998 2008
Note: Data are seasonally adjusted. Shaded bars indicate recessions.Source: Bureau of Labor Statistics.
Unemployment Rates for Workers at Various AgesPercent
20–2425–3435–4445–54
17Federal Reserve Bank of Cleveland, Economic Trends | October 2008
0
2
4
6
8
10
12
14
1992 1997 2002 2007
Unemployment Rates for Workers with Different Levels of EducationPercent
Less than high school diploma
High school
Some collegeCollege and above
Note: Data are seasonally adjusted. Shaded bar indicates recessions.Source: Bureau of Labor Statistics.
0
2
4
6
8
10
12
14
1992 1997 2002 2007
Percent
Less than high school diploma
High school
Some collegeCollege and above
Notes: Data are seasonally adjusted. The trend was generated by using a Hodrick-Prescott filter with a smoothing parameter of 10^5. Shaded barsindicate recessions. Source: Bureau of Labor Statistics.
Trend Unemployment Rates for Workers with Different Levels of Education
2
4
6
8
10
12
1948 1958 1968 1978 1988 1998 2008
Unemployment Rates for Men and WomenPercent
Men
Women
Note: Data are seasonally adjusted. Shaded bars indicate recessions.Source: Bureau of Labor Statistics.
2
4
6
8
10
1948 1958 1968 1978 1988 1998 2008
Notes: Data are seasonally adjusted. The trend was generated using a Hodrick-Prescott filter with a smoothing parameter of 10^5. Shaded barsindicate recessions.Source: Bureau of Labor Statistics.
Trend Unemployment Rates for Men and WomenPercent
MenWomen
18Federal Reserve Bank of Cleveland, Economic Trends | October 2008
Economic Activity and Labor MarketsSecond-Quarter GDP, Final Revision
10.02.08 Brent Meyer
Real GDP advanced at an annualized rate of 2.8 percent in the second quarter, according to the fi nal release from the Bureau of Economic Analy-sis. Th is is a downward revision of 0.5 percentage point from the preliminary estimate, but it is still up 0.9 percentage point from the advance estimate. Th e downward adjustment (from preliminary to fi nal) was largely due to a revision to real consump-tion growth, from an increase of 1.7 percent to 1.2 percent. Exports were also revised down from an increase of 13.2 percent to 12.3 percent, while the decrease in imports was revised up from −7.5 percent to −7.3 percent. Inventories decreased by $50.6 billion, according to the fi nal estimate, down from a subtraction of $39.2 billion in the previous estimate. On a positive note, the contraction in residential investment, which has been quite a large drag on growth lately, was revised up 2.5 percent-age points, to a decrease of −13.3 percent. While still negative, this is a considerable improvement over the −25.0 percent in the fi rst quarter.
Personal consumption expenditures added 0.9 percentage point to real GDP growth in the second quarter, according to the fi nal estimate, down from 1.2 percentage points and 1.1 percentage points in the preliminary and advance estimates, respectively. Th e overall private investment picture improved somewhat, and the severity of the change in pri-vate inventories lessened from the advance to fi nal estimates. Net exports provided an unusually large boost during the quarter, adding 2.9 percentage points to real GDP growth. Given reports of weak-ness in the foreign sector and the recent reversal of the dollar’s slide, the kick from net exports seems likely to fade in the coming quarters.
Another component that seems likely to weaken over the rest of the year is consumption. Personal consumption growth has been falling since 2006. While consumption growth in the second quarter outpaced the fi rst, 1.2 percent to 0.9 percent, that was likely due to the fi scal stimulus rebate checks.
Real GDP and Components, 2008:Q2 Final Revision
Quarterly change
(billions of 2000$)
Annualized percent change, last:
Quarter Four quarters
Real GDP 81.4 2.8 2.1
Personal consumption 25.2 1.2 1.3
Durables −8.7 −2.8 −1.1
Nondurables 22.8 3.9 1.2
Services 7.8 0.7 1.7
Business fi xed investment 8.7 5 4.2
Equipment −13.9 −5.0 −0.3
Structures 14.1 18.4 13.9
Residential investment −13.4 −13.3 −21.6
Government spending 19.8 3.9 2.6
National defense 9.2 7.3 5.9
Net exports 80.7 — —
Exports 44.1 12.3 11.0
Imports −36.6 −7.3 −1.9
Private inventories −50.6 — —
Source: Bureau of Economic Analysis.
-2.5
-2.0
-1.5
-1.0
-0.5
0.0
0.5
1.0
1.5
2.0
2.5
Contribution to Percent Change in Real GDP Percentage points
Personalconsumption
Business fixed investment
Residentialinvestment
Change in inventories
Exports
Imports
Governmentspending
Source: Bureau of Economic Analysis
2008:Q2 advance2008:Q2 preliminary2008:Q2 final
19Federal Reserve Bank of Cleveland, Economic Trends | October 2008
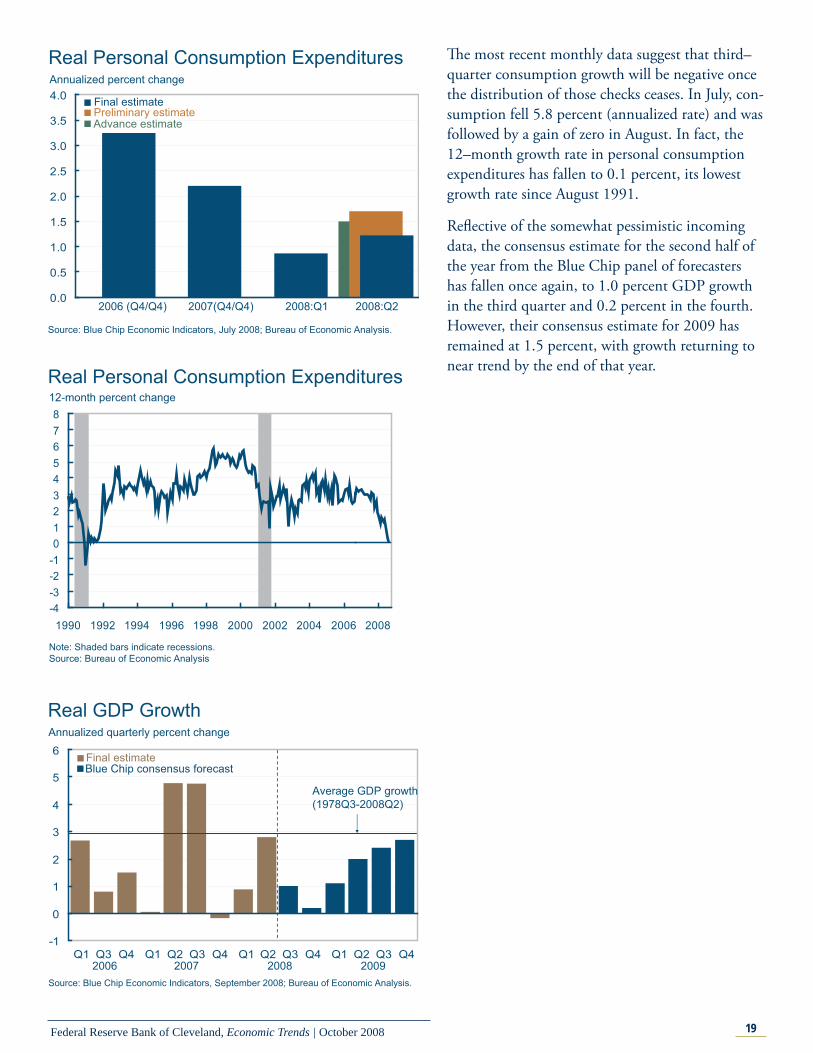
Th e most recent monthly data suggest that third–quarter consumption growth will be negative once the distribution of those checks ceases. In July, con-sumption fell 5.8 percent (annualized rate) and was followed by a gain of zero in August. In fact, the 12–month growth rate in personal consumption expenditures has fallen to 0.1 percent, its lowest growth rate since August 1991.
Refl ective of the somewhat pessimistic incoming data, the consensus estimate for the second half of the year from the Blue Chip panel of forecasters has fallen once again, to 1.0 percent GDP growth in the third quarter and 0.2 percent in the fourth. However, their consensus estimate for 2009 has remained at 1.5 percent, with growth returning to near trend by the end of that year.
-4-3-2-1012345678
1990 1992 1994 1996 1998 2000 2002 2004 2006 2008
12-month percent changeReal Personal Consumption Expenditures
Note: Shaded bars indicate recessions.Source: Bureau of Economic Analysis
-1
0
1
2
3
4
5
6
Q1 Q3 Q4 Q1 Q2 Q3 Q4 Q1 Q2 Q3 Q4 Q1 Q2 Q3 Q4
Annualized quarterly percent change
Real GDP Growth
Source: Blue Chip Economic Indicators, September 2008; Bureau of Economic Analysis.
2006 2007
Final estimate
20092008
Average GDP growth(1978Q3-2008Q2)
Blue Chip consensus forecast
0.0
0.5
1.0
1.5
2.0
2.5
3.0
3.5
4.0Annualized percent change
Real Personal Consumption Expenditures
Source: Blue Chip Economic Indicators, July 2008; Bureau of Economic Analysis.
2006 (Q4/Q4) 2007(Q4/Q4)
Final estimatePreliminary estimate
2008:Q1
Advance estimate
2008:Q2
20Federal Reserve Bank of Cleveland, Economic Trends | October 2008
Banking and Financial InstitutionsHousing and the Banking Industry
10.07.08 O. Emre Ergungor and Kent Cherny
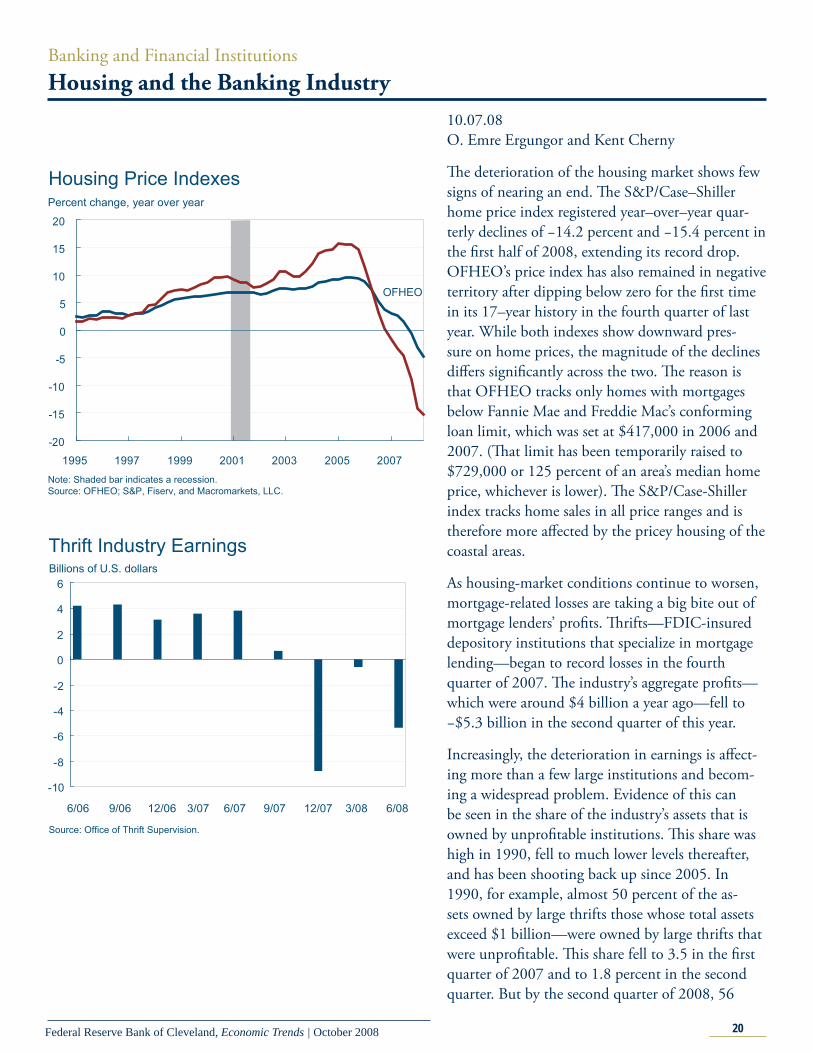
Th e deterioration of the housing market shows few signs of nearing an end. Th e S&P/Case–Shiller home price index registered year–over–year quar-terly declines of −14.2 percent and −15.4 percent in the fi rst half of 2008, extending its record drop. OFHEO’s price index has also remained in negative territory after dipping below zero for the fi rst time in its 17–year history in the fourth quarter of last year. While both indexes show downward pres-sure on home prices, the magnitude of the declines diff ers signifi cantly across the two. Th e reason is that OFHEO tracks only homes with mortgages below Fannie Mae and Freddie Mac’s conforming loan limit, which was set at $417,000 in 2006 and 2007. (Th at limit has been temporarily raised to $729,000 or 125 percent of an area’s median home price, whichever is lower). Th e S&P/Case-Shiller index tracks home sales in all price ranges and is therefore more aff ected by the pricey housing of the coastal areas.
As housing-market conditions continue to worsen, mortgage-related losses are taking a big bite out of mortgage lenders’ profi ts. Th rifts—FDIC-insured depository institutions that specialize in mortgage lending—began to record losses in the fourth quarter of 2007. Th e industry’s aggregate profi ts—which were around $4 billion a year ago—fell to −$5.3 billion in the second quarter of this year.
Increasingly, the deterioration in earnings is aff ect-ing more than a few large institutions and becom-ing a widespread problem. Evidence of this can be seen in the share of the industry’s assets that is owned by unprofi table institutions. Th is share was high in 1990, fell to much lower levels thereafter, and has been shooting back up since 2005. In 1990, for example, almost 50 percent of the as-sets owned by large thrifts those whose total assets exceed $1 billion—were owned by large thrifts that were unprofi table. Th is share fell to 3.5 in the fi rst quarter of 2007 and to 1.8 percent in the second quarter. But by the second quarter of 2008, 56
-20
-15
-10
-5
0
5
10
15
20
1995 1997 1999 2001 2003 2005 2007
Housing Price IndexesPercent change, year over year
OFHEO
Note: Shaded bar indicates a recession.Source: OFHEO; S&P, Fiserv, and Macromarkets, LLC.
-10
-8
-6
-4
-2
0
2
4
6
6/06 9/06 12/06 3/07 6/07 9/07 12/07 3/08 6/08
Thrift Industry EarningsBillions of U.S. dollars
Source: Office of Thrift Supervision.
21Federal Reserve Bank of Cleveland, Economic Trends | October 2008
percent of these institutions’ assets were owned by large thrifts that were unprofi table—a higher share than during the thrift crisis of the late 1980s. Note that we have not adjusted asset sizes for infl ation, so a $1 billion thrift in 1990 was an economically bigger institution than a $1 billion thrift today.
Further evidence of the spreading eff ects of the housing situation is the growing number of un-profi table institutions. In the fi rst quarter of 2007, about 20 percent of thrifts with assets less than $300 million and 10 percent of thrifts with assets greater than $1 billion were unprofi table. Th ose numbers jumped to 28 percent and 29 percent, re-spectively, by the fi rst half of 2008. Th e proportions of unprofi table institutions in each size category are well below the levels they reached in late 1980s, but their increases now suggest that profi tability is being squeezed across thrift institutions of all sizes as home prices fall.
Bank holding companies and fi nancial holding companies (BHCs and FHCs) seem to have fared slightly better in these diffi cult times, but their luck might be changing. Th ese holding companies own a diverse set of fi nancial institutions, ranging from depository institutions to insurance companies and investment banks. Although total holding company profi ts remained barely positive at $5.5 billion last quarter, the number of companies reporting losses has been steadily increasing over the past year. In the second quarter of 2008, about 15 percent of holding companies of all sizes were unprofi table.
As thrift and other fi nancial institutions’ profi ts have been pressured by housing declines, insured deposits across the banking system have continued to rise, reaching $4.4 trillion by the end of the fi rst half of 2008. Bank failures during early 2008 have contributed to a depletion of the Federal Deposit Insurance Corporation’s reserves, which have fallen below the target range of previous years to 1.01 percent of total insured deposits as of June 2008. What’s more, the FDIC’s data are current only as of the second quarter of this year, so they do not include the seizure of IndyMac in July. Th e larg-est thrift failure in U.S. history, IndyMac will cost the insurance fund an estimated $4 billion to $8 billion to cover. Nor does the FDIC’s data include
0
10
20
30
40
50
60
70
1985 1990 1995 2000 2005 2008
Assets of Unprofitable Thrifts
Assets under $300 million
Percent of total assets
Source: Federal Reserve Board.
Assets between $300 million and $1 billionAssets over $1 billion
0
10
20
30
40
50
60
70
1985 1990 1995 2000 2005 2008
Unprofitable Thrifts
As s ets under $300 million
Percent of total number
Source: Federal Reserve Board.
Assets between $300 million and $1 billionAssets over $1 billion
0
10
20
30
40
50
60
1985 1990 1995 2000 2005 2008
Unprofitable BHCs And FHCs
Assets between $300 million and $1 billionAs s ets under $1 billion
Assets over $1 billion
Percent of total number
Source: Federal Reserve Board.
22Federal Reserve Bank of Cleveland, Economic Trends | October 2008
the recently enacted increase in the limit of insured deposits from $100,000 to $250,000.
FDIC data on troubled banks and recent failures, like the home price indexes detailed earlier, provide little assurance that pressures on fi nancial institu-tions will ease in the near future. While the number of failed institutions remained modest up through June, the size of these banks with regard to assets is already at or near levels last seen following the 2001 recession. Before the failure of IndyMac, the num-ber of troubled institutions nearly doubled from 61 in 2007 to 117 this year.0
20
40
60
80100
120
140
160
180
200
6/06 9/06 12/06 3/07 6/07 9/07 12/07 3/08 6/08
BHC and FHC EarningsBillions of U.S. dollars
Source: Federal Reserve Board.
1,600
2,000
2,400
2,800
3,200
3,600
4,000
4,400
4,800
1995 1997 1999 2001 2003 2005 2007
Billions of dollarsFDIC-Insured Deposits
Source: Federal Deposit Insurance Corporation, Quarterly Banking Profile, Second Quarter 2008.
0.00
0.25
0.50
0.75
1.00
1.25
1.50
1.75
2.00
1995 1997 1999 2001 2003 2005 2007
Percent of insured deposits
Source: Federal Deposit Insurance Corporation, Quarterly Banking Profile, Second Quarter 2008
Fund Reserve Ratio
Targets
23Federal Reserve Bank of Cleveland, Economic Trends | October 2008
0
1
2
3
4
5
6
7
8
9
10
11
1995 1998 2001 2004 20070.0
0.5
1.0
1.5
2.0
2.5
3.0
3.5
4.0
4.5
5.0Number of institutions
Source: Federal Deposit Insurance Corporation, Quarterly Banking Profile, Second Quarter 2008.
Failed InstitutionsTotal assets, billions of dollars
0
20
40
60
80
100
120
140
160
180
1995 1997 1999 2001 2003 2005 20070
10
20
30
40
50
60
70
80
90Number of institutions
Source: Federal Deposit Insurance Corporation, Quarterly Banking Profile, Second Quarter 2008.
Problem InstitutionsTotal assets, billions of dollars
Economic Trends is published by the Research Department of the Federal Reserve Bank of Cleveland.
Views stated in Economic Trends are those of individuals in the Research Department and not necessarily those of the Fed-eral Reserve Bank of Cleveland or of the Board of Governors of the Federal Reserve System. Materials may be reprinted provided that the source is credited.
If you’d like to subscribe to a free e-mail service that tells you when Trends is updated, please send an empty email mes-sage to [email protected]. No commands in either the subject header or message body are required.