94
| Date post: | 21-Aug-2018 |
| Category: |
Documents |
| Upload: | duonghuong |
| View: | 213 times |
| Download: | 0 times |


Free State PSDF: Phase 2 Report February 2013
Department of the Premier & COGTA Department of Rural Development and Land Reform
i
Dennis Moss Partnership
TABLE OF CONTENTS
SECTION B: SUMMARY OF THE INHERENT CAPITAL OF THE FREE STATE Page B1 THE FREE STATE IN CONTEXT 2 B2 ADMINISTRATIVE FRAMEWORK 2 B3 SETTLEMENT PATTERN 4 B4 GENERAL BIOPHYSICAL CHARACTERISTICS 5 B4.1 CLIMATE 5 B5 HYDROLOGY AND WATER 6 B5.1 SURFACE WATER 7 B5.1.1 WATER MANAGEMENT AREAS OF THE FREE STATE 9 B5.2 GROUNDWATER RESOURCES 12 B5.3 WATER BALANCE 13 B5.4 STORAGE DAMS 14 B5.5 WATER QUALITY 16 B5.6 INTERNATIONAL WATER ISSUES 17 B5.7 PROVINCIAL WATER ISSUES 18 B6 BIODIVERSITY AND NATURAL RESOURCES 19 B6.1 FLORA 19 B6.1.1 GRASSLAND BIOME 19 B6.1.2 NAMA KAROO BIOME 21 B6.1.3 SAVANNA BIOME 21 B6.1.4 FOREST BIOME 22 B6.1.5 THREATS TO NATURAL FLORA 22 B6.2 FAUNA 22 B6.2.1 THREATS TO THE NATURAL FAUNA 23 B6.3 PROTECTED NATURE AREAS 23 B7 HERITAGE RESOURCES 26 B7.1.1 THE STONE AGE 26 B7.1.2 THE EARLY PASTORALISTS 27 B7.1.3 THE SOTHO 27 B7.1.4 THE EARLY SETTLERS 28 B7.1.5 HISTORIC SETTLEMENTS 28 B7.1.6 MISSIONARIES 30 B7.1.7 HERITAGE SITES 30

Free State PSDF: Phase 2 Report February 2013
Department of the Premier & COGTA Department of Rural Development and Land Reform
ii
Dennis Moss Partnership
B8 DEMOGRAPHIC PROFILE 30 B8.1 MIGRATION PATTERN 32 B9 SOCIO‐ECONOMIC STATUS 33 B9.1 POVERTY 34 B9.2 EDUCATION 35 B10 GENERAL SOCIO‐ECONOMIC STATUS 36 B10.1 SERVICE STANDARDS: HOUSING 36 B10.2 SERVICE STANDARDS: SEWAGE REMOVAL 37 B10.3 SERVICE STANDARDS: WATER RETICULATION 39 B10.4 SERVICE STANDARDS: TELECOMMUNICATIONS 41 B10.5 SERVICE STANDARDS: REFUSE REMOVAL 41 B10.6 SERVICE STANDARDS: ELECTRICITY AND ENERGY 42 B10.7 SERVICE STANDARDS: HEALTH 43 B11 LAND REFORM 44 B12 ECONOMIC PROFILE 45 B12.1 AGRICULTURE AND AGRI‐PROCESSING 47 B12.2 MINING 49 B12.3 ENERGY SECTOR 50 B12.3.1 RENEWABLE ENERGY 52 B12.3.1.1 Solar Energy 52 B12.3.1.2 Hydro Power 54 B12.3.1.3 Wind Power 54 B12.4 TOURISM 55 B12.4.1 PROMOTION AND DEVELOPMENT OF TOURISM 56 B12.4.2 THE FREE STATE AS AN ECO‐TOURISM DESTINATION 57 B12.4.3 TOURISM ATTRACTIONS AND OPPORTUNITIES (UNIQUE SELLING POINTS) 58 B12.4.4 DESIGNATED TOURIST ROUTES 59 B13 SCIENCE AND TECHNOLOGY 60 B13.1 SASOL 60 B13.2 INFORMATION AND COMMUNICATION TECHNOLOGY 62 B14 DEVELOPMENT REGIONS AND CORRIDORS 63 B15 SUPPORTING PROVINCIAL INFRASTRUCTURE AND SERVICE BASE 65 B15.1 TRANSPORT 65 B15.2 ROADS 67 B15.3 AIRPORTS 68 B15.4 RAILWAYS 68 B15.5 WATER DISTRIBUTION NETWORK 68

Free State PSDF: Phase 2 Report February 2013
Department of the Premier & COGTA Department of Rural Development and Land Reform
iii
Dennis Moss Partnership
B16 SUMMARY OF KEY STRATEGIES AND KEY CHALLENGES 70 B17 TOWARDS UNDERTAKING PHASE 3 AND PHASE 4 76 B17.1 ASPECTS TO BE ADDRESSED IN PHASE 3 AND PHASE 4 76 B17.1.1 ASPECTS DRAWN THE SERVICE LEVEL AGREEMENT 77 B17.1.2 KEY ASPECTS DRAWN FROM THE INCEPTION REPORT 77 B17.1.3 ASPECTS EMERGING FROM PHASE 2 78 B17.2 WAY FORWARD 79 B18 REFERENCES 81
LIST OF MAPS Map B1 National context of the Free State Province. 2 Map B2 Municipalities of the Free State Province. 3 Map B3 Settlements of the Free State Province. 4 Map B4 Average temperatures of the Free State Province. 5 Map B5 Mean annual rainfall of the Free State Province. 6 Map B6 Rivers of the Free State. 7 Map B7 The Orange River Basin. 8 Map B8 Water Management Areas of South Africa. 10 Map B9 Dams in the Free State Province. 15 Map B10 Status of the main rivers in the Free State Province. 17 Map B11 Biomes of the Free State. 20 Map B12 Protected areas. 24 Map B13 Priority clusters of the Grassland Biome. 26 Map B14 Population per Local Municipality. 31 Map B15 Agricultural regions of the Free State. 48 Map B16 Distribution of mineral resources and mining operations in the Free State. 49 Map B17 Levels of solar radiation in South Africa. 53 Map B18 Tourism routes and corridors of the Free State. 60 Map B19 Development regions and corridors of the Free State. 65 Map B20 Transport network of the Free State. 66 Map B21 Main routes of the Free State. 68
LIST OF TABLES
Table B1 Municipalities of the Free State Province. 3 Table B2 Water balance of the Free State. 13 Table B3 Water resources – future requirements. 18
Table B4 Free State national and provincial protected areas. 25 Table B5 Population of the Free State on Metropolitan, District and Local Municipal
level for 2001 and 2011. 31
Table B6 Estimated migration streams in the Free State. 32

Free State PSDF: Phase 2 Report February 2013
Department of the Premier & COGTA Department of Rural Development and Land Reform
iv
Dennis Moss Partnership
Table B7 Estimated emigration percentage of out‐migrants from the Free State to
other Provinces in South Africa: 2006‐2011. 33
Table B8 Percentage distribution of non‐migration and migrants based on place of birth.
33
Table B9 Education standards within the Free State in District Municipalities. 36 Table B10 Number of households in the districts of the Free State for the 2001 and
2011 Census. 36
Table B11 Percentage distribution of households by type of main dwelling in the Free State according to the 2001 and 2011 Census.
37
Table B12 Households living in formal and informal dwellings in South Africa. 37 Table B13 Household Access to appropriate sanitation per district, 2011. 39 Table B14 Standard of sewage removal per district municipality. 39 Table B15 Percentage of household access to piped water on district level, 2007. 40 Table B16 Standard of Water Reticulation (2001 and 2007). 40 Table B17 Household goods and services. 41 Table B18 Households by type of refuse disposal of district municipalities in the Free
State. 41
Table B19 Percentage of households using electricity for lighting, cooking and heating on district level.
42
Table B20 The number of public facilities in the Free State. 43 Table B21 Growth rate trends per economic sector in South Africa and the Free State in
the periods: 1996‐2003, 2003‐2010, and 1996‐2010. 47
Table B22 Main agricultural activities and production per district municipality in the Free State.
48
Table B23 Mining in the Free State. 50 Table B24 Development regions and corridors of the Free State. 63 Table B25 Primary roads in the Free State. 68 Table B26 Water distribution by each Water Management Area in the Free State. 69 Table B27 Total volume (expressed in millions) of water use by different sectors within
each Water Management Area. 70
Table B28 Percentage water distribution of household by type of water source per province.
70
Table B29 Percentage water distribution of household by type of water source per district municipality within the Free State.
70
LIST OF FIGURES
Figure B1 Employment in the Free State. 34 Figure B2 Adult Education levels of South Africa per province, 2011. 35 Figure B3 Use of energy sources in the Free State. 42 Figure B4 Economic contribution of various economic sectors in the Free State. 46 Figure B5 Process followed in the drafting of the PSDF 80

Free State PSDF: Phase 2 Report February 2013
Department of the Premier & COGTA Department of Rural Development and Land Reform
v
Dennis Moss Partnership
LIST OF ACRONYMS AND DEFINITIONS The following terms, abbreviations and acronyms have been used, or are referred to in this document. Agenda 21 Agenda 21 is an international program, adopted by more than 178
governments, to put sustainable development into practice around the world. It emerged from the United Nations Conference on Environment and Development (UNCED) held in Rio de Janeiro in 1992.
BEE Black Economic Empowerment.
Biodiversity It is an abbreviation of ‘biological diversity’ which is described as the mix of species in an ecosystem that enables the system both to provide a flow of ecosystem services under given environmental conditions, and to maintain that flow if environmental conditions change. The loss of biodiversity limits the resilience of the affected ecosystem, which in turn, may have direct negative socio‐economic implications. Furthermore, biodiversity is the degree of variation of life forms within a given ecosystem, biome, or an entire planet. Biodiversity is one measure of the health of ecosystems, and life on earth today consists of many millions of distinct biological species.
Biological resources Includes genetic resources, organisms or parts thereof, populations, or any other biotic component of ecosystems with actual, or potential, value for humanity.
Bioregional planning Land‐use planning and management that promotes sustainable development by recognizing the relationship between, and giving practical effect to, environmental integrity, human well‐being and economic efficiency within a defined geographical space, the boundaries of which were determined in accordance with environmental and social criteria.
Biosphere reserve An area of terrestrial and coastal/marine ecosystems, or a combination thereof, which is internationally recognised within the framework of the UNESCO's MAB Programme. Each biosphere reserve is intended to fulfil three basic functions, which are complementary and mutually reinforcing: 1. a conservation function ‐ to contribute to the conservation of
landscapes, ecosystems, species and genetic variation; 2. a development function ‐ to foster economic and human development
which is socio‐culturally and ecologically sustainable; 3. a logistic function ‐ to provide support for research, monitoring,
education and information exchange related to local, national and global issues of conservation and development.
BPO Business Process Outsourcing.

Free State PSDF: Phase 2 Report February 2013
Department of the Premier & COGTA Department of Rural Development and Land Reform
vi
Dennis Moss Partnership
Catchment or catchment area
The entire drainage area from which water flows into a river or other water body. Also known as a watershed, it is an extent or area where surface water from rain and melting snow or ice converges to a single point, usually the exit of the basin, where water joins on other water body such as a river, lake, reservoir, estuary, wetland, sea or ocean. Generally consisting of various smaller ‘quaternary’ catchments, or ‘sub‐catchments’.
CDM Clean Development Mechanism.
CER Certified Emission Reduction.
COGTA Department of Cooperative Governance and Traditional Affairs.
Conservation The management of human use of the biosphere to yield the greatest benefit to present generations while maintaining the potential to meet the needs and aspirations of future generations. Conservation thus includes sustainable use, protection, maintenance, rehabilitation, restoration, and enhancement of the natural and cultural environment.
Constitution Constitution of the Republic of South Africa Act 108 of 1996.
CSIR Council for Scientific and Industrial Research.
CSP Concentrated Solar Power.
DEA Department of Environmental Affairs.
DEAT Department of Environmental Affairs and Tourism.
Developmental State A development state tries to balance economic growth and social development. It uses State resources and State influence to attack poverty and expand economic opportunities.
DETEA Department of Economic Development, Tourism and Environmental Affairs.
DNA Designated National Authority.
DPLG Department of Provincial and Local Government.
DRDLR Department of Rural Development and Land Reform.
DWA Department of Water Affairs.
DWAF Department of Water Affairs and Forestry.
Ecosystem A dynamic system of plant, animal and micro‐organism communities and their non‐living environment interacting as a functional unit.

Free State PSDF: Phase 2 Report February 2013
Department of the Premier & COGTA Department of Rural Development and Land Reform
vii
Dennis Moss Partnership
Ecotourism Responsible travel to natural areas that conserves the environment and
improves the well‐being of local people. Ecotourism is about uniting conservation, communities and sustainable travel.
EIA Environmental Impact Assessment.
Endemic species Any plant or animal species confined to, or exclusive to, a particular, specified area.
Environment The surroundings within which humans exist and that are made up of: a) the land, water and atmosphere of the earth; b) micro‐organisms, plant and animal life; c) any part or combination of (a) and (b) and the interrelationships among and
between them; and d) the physical, chemical, aesthetic and cultural properties and conditions of
the foregoing that influence human health and well‐being.
Free State PSDF Provincial Spatial Development Framework for the Free State Province.
FSGDS Free State Growth and Development Strategy.
FS 2030 AdCo Free State 2030 Advisory Council.
GDP Gross Domestic Product.
GEF Global Environmental Facility.
Gini coefficient Also known as the Gini index or Gini ratio is a measurement of the income distribution of a country’s or region’s residents. This number, which ranges between 0 and 1 and is based on residents’ net income, helps define the gap between the rich and the poor, with 0 representing perfect equality and 1 representing perfect inequality.
GIS Geographical Information System or ‘a system that captures, stores, analyses, manages and presents data with reference to geographic location data – it is a system of hardware and software used for storage, retrieval, mapping, and analysis of geographic data’’. It is the merging of cartography, statistical analysis and database technology.
HDI The Human Development Index is a tool that measures and rank countries’ or region’s level of social and economic development based on four criteria: Life expectancy at birth, mean years of schooling, expected years of schooling and Gross National Income per capita. The HDI makes it possible to track changes in development levels over time and to compare development levels in different countries and regions. It is expressed as a value between 0 and 1, and the higher the number is (i.e. closer to 1), the more developed a country or region is.
HOD Head of Department.
Free State PSDF: Phase 2 Report February 2013
Department of the Premier & COGTA Department of Rural Development and Land Reform
viii
Dennis Moss Partnership
I&AP
Interested and Affected Party.
IDC Industrial Development Corporation.
IDP
Integrated Development Plan.
IRENA International Renewable Energy Agency.
IISD
International Institute for Sustainable Development.
IUCN International Union for the Conservation of Nature.
LED Local Economic Development.
MAB
Man and the Biosphere.
MaB Program Launched in 1971 by UNESCO, it is a global program of international scientific co‐operation, dealing with people‐environment interactions over the entire realm of bioclimatic and geographic situations of the biosphere.
MDGs Millennium Development Goals.
MEC Member of the Executive Council.
MW The Megawatt is equal to one million watts. The watt is a derived unit of power and is defined as one joule per second, and measures the rate of energy conversion or transfer.
NEMA National Environmental Management Act 107 of 1998.
NEPAD New Partnership for Africa’s Development.
NFSD National Framework on Sustainable Development.
NGO Non‐Governmental Organisation.
NSDP National Spatial Development Perspective.
NSSD National Strategy for Sustainable Development and Action Plan 2011‐2014.
OECD Organisation for Economic Co‐operation and Development.
ORASECOM Orange‐Senqu River Commission.
PGDS Provincial Growth and Development Strategy.
PSDF Provincial Spatial Development Framework.
Ramsar Convention on Wetlands of International Importance.

Free State PSDF: Phase 2 Report February 2013
Department of the Premier & COGTA Department of Rural Development and Land Reform
ix
Dennis Moss Partnership
RECAP Recapitalisation and Development Programme.
SADC Southern African Development Community.
SANBI South African National Biodiversity Institute.
Sasol Sasol is an integrated energy and chemical company that began in Sasolburg.
It develops and commercialises technologies and builds and operates world‐scale facilities to produce a range of product streams including liquid fuels, chemicals and electricity. In particular, Sasol produces petrol and diesel profitably from coal and natural gas.
SAWEP South African Wind Energy Programme.
SDF Spatial Development Framework.
SEA Strategic Environmental Assessment.
SOER State of the Environment Report.
SPC Spatial Planning Category.
SPISYS Spatial Planning Information System.
SPLUMB Spatial Planning and Land‐Use Management Bill 14 of 2012.
Sustainable development
Sustainable development is development that meets the needs of the present generation without compromising the ability of future generations to meet their own needs.
TEP Tourism Enterprise Partnership.
UNESCO United Nations Educational, Scientific and Cultural Organisation. It is a specialized agency of the United Nations established on 16 November 1945. Its stated purpose is to contribute to peace and security by promoting international collaboration through education, science and culture in order to further universal respect for justice, the rule of law and the human rights along with fundamental freedoms proclaimed in the UN Charter.
UNEP United nations Environmental Program.
UNIDO United Nations Industrial Development Organisation.
WASA Wind Atlas of South Africa.

Free State PSDF: Phase 2 Report February 2013
Department of the Premier & COGTA Department of Rural Development and Land Reform
x
Dennis Moss Partnership
World Heritage Site A World Heritage Site is a place (such as a desert, mountain, building,
architectural monument, etc.) that is listed by UNESCO as of special cultural or physical significance. The list is maintained by the International World Heritage Programme administered by the UNESCO World Heritage Committee. Each World Heritage Site belongs to the country in which it is located, but it is conserved for the benefit of the global community and future generations.
WMA Water Management Area.
WRI World Resource Institute

Free State PSDF: Phase 2 Report February 2013
Department of the Premier & COGTA Department of Rural Development and Land Reform
1
Dennis Moss Partnership
SECTION B: SUMMARY OF THE INHERENT CAPITAL OF THE FREE STATE
SECTION SYNOPSIS Section B is a summary of the characteristics (i.e. the inherent natural, cultural, economic, and human capital) of the Free State as a distinct place or environment1. All of these elements have to be planned and managed in an integrated manner so as to be able to achieve sustainability. The key aspects of the Free State, as the subject area of the PSDF have been categorised under the headings indicated by the figure and summarised in the various chapters of this section. The information presented in this section was drawn from existing sectoral data bases and plans, municipal Integrated Development Plans (IDPs) and Spatial Development Frameworks (SDFs), national, provincial and municipal policy, the Census reports, and the Internet and SPISYS. The main sources include: a) The Free State Provincial Growth and
Development Strategy (FSGDS) (2012). b) Information on the natural environment
and resources was mostly drawn from the State of the Environment Report for the Free State (2009), Free State Tourism Report (2011), national and provincial departmental websites; strategic plans pertaining to rivers, flora, biodiversity etc.
c) Information on the socio‐economic status of the province and its municipalities was derived from, among others, Statistics South Africa, 2001 South Africa Census, Community Survey 2007, and 2011 South Africa Census.
d) Sources such as the Guide to Business and Investment in the Free State Province (2012 and 2013), provincial departmental annual reports and plans, etc. provided information on the economic state of the Free State, mining and agricultural activities of the Free State, etc.
The purpose of Section B is to serve as an inventory of key aspects to be addressed in Section C of the PSDF (i.e. in the form of spatial plans and dedicated strategies).
1 The National Environmental Management Act describes the environment as the surroundings within which
humans exist and that are made up of: a) the land, water and atmosphere of the earth; b) micro‐organisms, plant and animal life; c) any part or combination of (a) and (b) and the interrelationships among and between them; and d) the physical, chemical, aesthetic and cultural properties and conditions of the foregoing that influence human
health and well‐being.
THE CONTEXT
• Locat ional aspects• Administrative framework• Sett lement pattern
THE PLACE
•Biophysical traits•Hydrology and water•Biodiversity matters
THE PEOPLE
•Socio‐economic status•Service provision•Land reform
THE ECONOMY
• Economic profile• Economic sectors• Supporting infrastructure

Free State PSDF: Phase 2 Report February 2013
Department of the Premier & COGTA Department of Rural Development and Land Reform
2
Dennis Moss Partnership
B1 THE FREE STATE IN CONTEXT The Orange Free State in 1910 became one of the four provinces of the Union of South Africa. The Free State is the 3rd largest province of South Africa covering approximately 129 825 km². It is located in the centre of the country and is bordered by six of South Africa’s remaining eight provinces (refer to Map B12). The bordering provinces are North West, Gauteng and Mpumalanga to the north, Kwazulu‐Natal to the east, the Eastern Cape to the south, and the Northern Cape to the west. To the south‐east, the Free State shares an international border with Lesotho.
Map B1: National context of the Free State Province.
B2 ADMINISTRATIVE FRAMEWORK The Free State, in its current jurisdictional form, was created in 1994 when the Bantustans were abolished and included into the provinces of South Africa. Bloemfontein is the capital of the province which comprises five district municipalities and nineteen local municipalities. The tables and maps below summarise and contextualise the various municipalities and their component settlements.
2 Larger scale base maps are appended under Annexure 2.

Free State PSDF: Phase 2 Report February 2013
Department of the Premier & COGTA Department of Rural Development and Land Reform
3
Dennis Moss Partnership
Map B2: Municipalities of the Free State Province.
Table B1: Municipalities of the Free State Province.
DISTRICT MUNICIPALITY LOCAL MUNICIPALITY NO. ADMIN. SEAT AREA KM² & % OF
THE PROVINCE NO. ADMIN. SEAT
Mangaung MAN Bloemfontein 6 300 (4.9%) Xhariep DC16 Trompsburg 37 800 (29.1%) Letsemeng
Kopanong Mohokare Naledi
FS161 FS162 FS163 FS164
KoffiefonteinTrompsbrug Zastron Dewetsdorp
Lejweleputswa DC18 Welkom 32 010 (24.7%) TokologoTswelopele Nala Matjhabeng Masilonyana
FS182 FS183 FS185 FS184 FS181
BoshofBultfontein Bothaville Welkom Theunissen
Fezile Dabi DC20 Sasolburg 20 020 (15.4%) MoqhakaNqwathe Metsimaholo Mafube
FS201 FS203 FS204 FS205
KroonstadParys Sasolburg Frankfort
Thabo Mofutsanyane
DC19 Phuthaditjhaba 33 700 (26.0%) MantsopaSetsoto Dihlabeng Nketoana Phumelela Maluti a Phofung
FS196 FS191 FS192 FS193 FS195 FS194
LadybrandFicksburg Bethlehem Reitz Vrede Phuthaditjhaba

Free State PSDF: Phase 2 Report February 2013
Department of the Premier & COGTA Department of Rural Development and Land Reform
4
Dennis Moss Partnership
B3 SETTLEMENT PATTERN The Free State comprises ninety urban settlements of various sizes (refer to Map B3). According to the FSGDS (2012), apartheid planning has resulted in extremely low densities, low levels of efficiency and long distances between places of employment and places of work. The largest economic contribution originates within urban settlements. It is estimated that urbanisation has increased from 70.5% in 1996 to 80% in 2006, and that approximately 40% of the Free State population reside in the large urban centres or settlements (SOER 2009). Five types of settlements are distinguished in the Free State (SOER, 2009), namely: 1 Large urban settlements: Bloemfontein, Thaba Nchu, Botshabelo, Welkom, Virginia,
Odendaalsrus, Allanridge, Henneman and Sasolburg. 2 Regional towns: Kroonstad and Bethlehem. 3 Middle Order towns: Ladybrand, Ficksburg, Puthaditjhaba, Heilbron, Frankfort,
Senekal, Parys, Bothaville, Viljoenskroon, Harrismith and Reitz. 4 Small towns: Rural and small‐farming communities. 5 Communal: Rural areas of Thaba Nchu and Maluti a Phofung.
Map B3: Settlements of the Free State Province. The current human settlement situation shows that urban areas are experiencing increasing pressures as the trend towards urbanisation leads to further depopulation of rural areas. Settlements generally have significant ecological footprints at the input and output levels (i.e.

Free State PSDF: Phase 2 Report February 2013
Department of the Premier & COGTA Department of Rural Development and Land Reform
5
Dennis Moss Partnership
waste) with environmental consequences (FSGDS, 2012). The spatial manifestation of poverty in settlements in the Free State is characterised by the following aspects: a) The two areas with the largest number of people in poverty are Mangaung and Maluti a
Phofung (both areas with former homeland settlements). b) Areas with above average number of people living in poverty are Nala, Moghaka, Setsoto
and Dihlabeng.
Welkom Welkom is South Africa’s youngest city and is the centre of the Free State Goldfields, serving several gold and uranium mines, since 1947. The planning of Welkom was undertaken by Sir Ernest Oppenheimer, the then Anglo American Chairman, and has resulted in the residential, mining and industrial areas of the city being harmoniously blended to form what has become known as the ‘Garden City’. B4 GENERAL BIOPHYSICAL CHARACTERISTICS B4.1 CLIMATE Most of the Free State is situated approximately 1 300 m above sea level and has a continental climate, characterised by warm to hot summers and cool to cold winters. The eastern parts of the province experience frequent snowfalls, especially on the higher mountain ranges, whilst the west can be extremely hot in the summer.
Map B4: Average temperatures of the Free State Province.

Free State PSDF: Phase 2 Report February 2013
Department of the Premier & COGTA Department of Rural Development and Land Reform
6
Dennis Moss Partnership
The Free State is a summer rainfall region. Aridity increases towards the west of the province. Rainfall figures average between 600 mm and 750 mm in the east to less than 300 mm in the west. Frost occurs throughout the province (particularly in the higher‐lying areas) usually from May to early September in the west up to early October in the east. Annual temperatures range from a maximum of approximately 35°C in mid‐summer to a minimum of ‐5°C in mid‐winter, with mean temperatures ranging between 15‐30°C in summer and 0‐15°C in winter.
Map B5: Mean annual rainfall of the Free State Province (Source: Department of Water Affairs).
B5 HYDROLOGY AND WATER Water is considered one of the most essential of all natural resources. Due to the nature of water resources and the importance of water for the perpetuation of life, interventions through supply or demand management are required in order to meet social and economic goals pertaining to economic efficiency, equity, environmental impacts, fiscal impacts, political and public acceptability, sustainability and administrative feasibility. Water of acceptable quality is necessary for the improvement of the quality of life and is essential for the maintenance of all forms of life. The availability of water for various uses is directly related to the management of water quantity, quality and/or the elimination of diseases (King et al, 2009). Water affects every activity and aspirations of human society and sustains all ecosystems. Freshwater ecosystems provide for many fundamental human needs, including water for drinking and irrigation, food in the form of fish, recreation, etc. Healthy ecosystems also provide important regulating ecosystem services, such as preventing floods and easing the impacts of droughts. A healthy ecosystem supports functional communities of plants and animals that are able to remove

Free State PSDF: Phase 2 Report February 2013
Department of the Premier & COGTA Department of Rural Development and Land Reform
7
Dennis Moss Partnership
excess nutrients and toxic substances from water, keeping it cleaner for drinking, irrigation and recreation. Healthy rivers, wetlands and groundwater systems also maintain water supply and buffer the effects of storms, reducing the loss of life and property to floods. Healthy river banks with natural vegetation help to trap sediments, stabilise river banks and break down pollutants draining from the surrounding lands (Driver et al, 2011). B5.1 SURFACE WATER The Orange River and the Vaal River together with their tributaries, are the main sources of surface water in the province (refer to Map B6).
Map B6: Rivers of the Free State (Source: Department of Water Affairs).
The Orange River Basin (refer to Map B7) is an international river basin straddling four Southern African countries, i.e. South Africa, Lesotho, Botswana and Namibia. It encompasses an area of 896 368 km² (Diederichs et al, 2005). In South Africa, the Orange River Basin stretches over six of the country’s nine provinces, i.e. Mpumalanga, Gauteng, North West, Eastern Cape, Free State and the Northern Cape.
The Orange River Contrary to popular belief the Orange River was not named after the reddish orange colour of its silt‐laden water. It was in fact named in 1779 by Colonel Robert Gordon, the commander of the garrison of the Dutch East India Company in Cape Town during a reconnaissance into the interior, in honour of the Dutch House of Orange. The river is also referred to as the ‘Gariep’, a Nama or Koranna name that could have meant ‘the river’, ‘our river’ or ‘the great river’. (Earle et al, 2005).

Free State PSDF: Phase 2 Report February 2013
Department of the Premier & COGTA Department of Rural Development and Land Reform
8
Dennis Moss Partnership
The Orange River System drains approximately 47% of South Africa’s total surface area and approximately 22% of the country’s mean annual rainfall run‐off. Topographically the system is divided into an upper section (origin to Orange‐Vaal confluence), a middle section, (Orange‐Vaal confluence to Augrabies Falls) and a lower section (Augrabies Falls to Orange River Mouth). Approximately 98% of the runoff of the Orange River System is generated in the upper section. The Free State province covers the majority of this section. The Orange River System is the most developed transboundary river basin in Southern Africa. It incorporates a variety of water transfer schemes that supply water to municipalities, industries and farms inside and outside the basin. It has become highly regulated by virtue of 24 major impoundments (constructed within the catchment between 1884 and 1997), numerous minor impounding structures and six inter‐basin and five inter‐water transfer schemes.
Map B7: The Orange River Basin (Source: WRP in Earl et al 2005).
The Vaal River which has its origin in the Drakensberg Mountains in Mpumalanga, flows westwards to where it joins the Orange River southwest of Kimberley in the Northern Cape. It is 1 120 km in length and forms the border between the Free State and the provinces of Mpumalanga, Gauteng and North West. Its total catchment area is in the order of 200 000 km2 and its average natural run‐off from the total basin is more than 3 900 million m3 per annum. Its tributaries include the Harts River, Vals River, Waterval River, Bamboes Spruit, Blesbokspruit, Mooi River, Vet River, Renoster River, Riet River and Wilge River.

Free State PSDF: Phase 2 Report February 2013
Department of the Premier & COGTA Department of Rural Development and Land Reform
9
Dennis Moss Partnership
The Vaal River
The name ‘Vaal’ was translated from an earlier Kora Khoi name Tky‐Gariep (meaning ‘drab’). The name alludes to the colour of the waters, especially noticeable during flood season when the river carries a lot of silt. In the mid‐19th century the Vaal River became the boundary between the then Republic of Transvaal and the Republic of Orange Free State. The geographic name ‘Transvaal’ comes from the name of this river, meaning ‘beyond the Vaal River’. The Vaal River supplies water to the Greater Johannesburg Metropolitan Area (the industrial heartland of South Africa, including Tshwane and the City of Johannesburg), and a large part of the Free State. The industrial areas supported by the Vaal River produce more than 50% of South Africa’s industrial produce and more than 80% of the country’s electricity requirements. The Vaal River is divided into an upper section (origin to Vaal‐Rietspruit Rivers confluence), a middle section (Vaal‐Rietspruit confluence to upstream of Bloemhof Dam), and a lower section (Bloemhof Dam to Kuruman). B5.1.1 WATER MANAGEMENT AREAS OF THE FREE STATE The Free State is covered by 4 Water Management Areas, namely (refer to Map B8): • Upper Vaal (WMA 08). • Middle Vaal (WMA 09). • Lower Vaal (WMA 10). • Upper Orange (WMA 13). a) Upper Vaal WMA The Upper Vaal WMA includes the Vaal, Klip, Wilge, Liebenbergsvlei and Mooi Rivers and extends to the confluence of the Mooi and Vaal River. Eight dams are located this WMA, the main ones being the Vaal Dam and the Sterkfontein Dam. The southern half of the WMA extends across the Free State, the north‐east mainly falls within Mpumalanga, and the northern and western parts cover the Gauteng and North West Provinces. From a water resource management perspective the Upper Vaal WMA is pivotal to the country. Large quantities of water are transferred into this WMA from two neighbouring WMAs, including the Upper Orange via Lesotho. Similarly large transfers occur to three other WMAs which are dependent on water from the Upper Vaal WMA to meet much of their requirements. The impacts of these transfers, however, extend well beyond the adjoining WMAs to involve a total of 10 WMAs and all the countries neighbouring South Africa. The climate over the Upper Vaal WMA is fairly uniform, with the average rainfall varying between 600 and 800 mm per year. The largest portion (46%) of the surface flow in the WMA is contributed by the Vaal River upstream of the Vaal Dam, together with its main tributary the Klip River. The Wilge River and the Liebenbergsvlei River contribute 36%, with the remaining 18% originating from the tributaries downstream of Vaal Dam (Van der Westhuizen, 2004).

Free State PSDF: Phase 2 Report February 2013
Department of the Premier & COGTA Department of Rural Development and Land Reform
10
Dennis Moss Partnership
Map B8: Water Management Areas of South Africa.
(Source: Department of Water Affairs). b) Middle Vaal WMA The Middle Vaal WMA is located downstream of the confluence of the Vaal and the Rietspruit Rivers and upstream of Bloemhof Dam and includes portions of the Free State and North West provinces. It extends to the headwaters of the Schoonspruit River in the north and the Vet River in the south. Of the eight dams located in this WMA, the main storage dams are the Bloemhof, Allemanskraal and Erfenis dams. The climatic conditions vary considerably from east to west across the WMA, with the mean annual precipitation varying from 800 mm in the east to 500 mm in the west. The average rainfall is 550 mm. This tendency is reversed as it relates to potential annual evaporation, which increases from 1800 mm in the east to 2600 mm in the dry western parts of the WMA. Key considerations regarding the Middle Vaal WMA (Basson and Rossouw, 2003): (i) Given its location between the Upper Vaal and Lower Vaal WMAs, water availability along
the Vaal River is inextricably linked to these WMAs and to water resource management in the Vaal River System.
(ii) The Middle Vaal WMA is dependent on releases from the Upper Vaal WMA for meeting the bulk of the requirements by the urban, mining and industrial sectors within its area of jurisdiction.
(iii) Water quality in the Vaal River is of serious concern because of high salinity and nutrient content, which mainly results from urban and industrial return flows as well as mining

Free State PSDF: Phase 2 Report February 2013
Department of the Premier & COGTA Department of Rural Development and Land Reform
11
Dennis Moss Partnership
activities in the Upper Vaal WMA. The closure of mines may have further water quality impacts.
(iv) Water from tributaries as well as from groundwater in the WMA is fully utilised, mainly for irrigation and for towns remote from the Vaal River.
(v) The potential decline in population in parts of the WMA needs to be addressed in the development of the catchment management strategy.
c) Lower Vaal WMA The Lower Vaal WMA is located downstream of Bloemhof Dam and upstream of the Douglas Weir. Major rivers in this WMA include the Molopo, Harts, Dry Harts, Kuruman and Vaal Rivers. It extends to the headwaters of the Harts, Molopo and Kuruman River in the north, and the Vaal River downstream of Bloemhof in the south. It lies in the North West and Northern Cape provinces, with the south‐eastern corner in the Free State. It border Botswana in the north. There are no distinct topographic features in the WMA and most of the landscape is relatively flat. There are no climatic barriers. Climate over the WMA therefore varies gradually according to the larger regional patterns. Annual rainfall ranges from approximately 500 mm in the east to as low as 100 mm in the west. Potential evaporation can be as high as 2 800 mm per annum which significantly exceeds the rainfall. Vegetation over the WMA is sparse, consisting mainly of grassland and scattered thorn trees. Alluvial diamonds are found in the vicinity of Bloemhof. Key considerations regarding the Lower Vaal WMA are (Basson and Rossouw, 2003): (i) High utilisation of the water resources which naturally occur in the WMA, both surface and
groundwater. (ii) The dominant influence of water from upstream WMAs on water resource management in
the Lower Vaal WMA. (iii) Concerns about water quality in the Vaal River as a result of upstream activities (i.e. urban,
industrial and mining), and the additional impacts of irrigation return flows on salinity concentrations.
(iv) Impacts of mining activities on groundwater as well as localised over‐exploitation of groundwater.
d) Upper Orange WMA The Upper Orange lies predominantly within the Free State, but also occupies portions of the Eastern and Northern Cape Provinces. The Caledon River is the largest tributary to the Orange River within the Upper Orange WMA. Other sizable tributaries are the Kraai and Riet Rivers. Of the twenty dams located in this WMA, the main ones are the Gariep, Vanderkloof, Kalkfontein, Krugersdrift, Rustfontein and Knellpoort dams. Hydropower for peaking purposes is generated at the Gariep and Vanderkloof Dams. Climate over the WMA is cool to temperate and ranges from semi‐arid to arid. Rainfall mainly occurs in the form of summer thunder showers and reduces dramatically from as high as 1 000 mm per year in the eastern parts to approximately 200 mm per year in the west. In Lesotho, which is the source of the most of the water in the Upper Orange WMA, rainfall varies between 600 mm per year to approximately 1 500 mm per year. Potential evaporation is well in excess of the rainfall. Key considerations regarding the Upper Orange WMA are (Basson and Rossouw, 2003):

Free State PSDF: Phase 2 Report February 2013
Department of the Premier & COGTA Department of Rural Development and Land Reform
12
Dennis Moss Partnership
(i) The yield from the Upper Orange WMA is the largest of all WMAs in the country, with significant potential for further water resource development.
(ii) The Lesotho Highlands Water Project, which is an integral and crucial component of the Vaal River System, also relies on water which, under natural conditions, would flow into the Upper Orange WMA, and therefore has a major impact on water availability in the Upper Orange WMA.
(iii) No surplus water will be available from the Orange River after completion of the Mohale Dam and the allocations made with respect to the 12 000 ha new irrigation system. A deficit situation may therefore occur before 2025.
(iv) Needs exist for increased future transfers of water to the Upper Vaal WMA and to Port Elizabeth in the Fish and Tsitsikamma WMAs.
(v) Flood management at the Gariep and Vanderkloof Dams, in concert with flood management along the Vaal River, is of major importance as it relates to the protection of river bank development along the Lower Orange River.
(vi) Hydropower generation at Gariep and Vanderkloof Dams forms an important component of Eskom’s peak generation capability. Fluctuating releases from hydropower turbines impact negatively on some uses. In turn, upstream transfers of water negatively impact on the water availability for power generation.
B5.2 GROUNDWATER RESOURCES Ground water fulfils an important function, especially in settlements far removed from the major rivers. Groundwater is currently used for rural domestic supplies, stock watering and water supply to several towns where surface water supply is inadequate or bulk water supply is not financially feasible (DETEA 2009). The total availability of groundwater in the four WMA is estimated as follows (DETEA, 2009): • Upper Vaal WMA: 32 million m3 per annum. • Middle Vaal WMA: 54 million m3 per annum. • Lower Vaal WMA: 126 million m3 per annum. • Upper Orange WMA: 65 million m3 per annum. The Water Master Plan for the Free State Province (DWA, 2012) gives a more detailed breakdown of groundwater consumption per WMA in the province: a) Upper Vaal WMA:
(i) Large dolomite aquifers extend across the north‐western parts of the WMA and large quantities of groundwater are abstracted for urban use (e.g. Rand Water) and for irrigation. There is a direct link between the dolomite aquifers and surface water, so an increase in groundwater abstraction results in a decrease in surface flow. Lowering of spring flow may also lead to the formation of sinkholes.
(ii) Extensive de‐watering of the dolomite compartments for mining purposes in the northwest, where gold ore underlies the dolomite formations, has led to temporary increases in surface flow and lowering of water levels.
(iii) The remainder of WMA is underlain mainly by fractured aquifers, which are well‐utilised for rural domestic water supplies and stock watering, with little undeveloped potential remaining. Although of specific importance in some areas, only 3% of the total water requirements in the WMA are catered for by groundwater.
(iv) The quality of groundwater is generally very good. Groundwater may be heavily polluted where it infiltrates mine caverns.

Free State PSDF: Phase 2 Report February 2013
Department of the Premier & COGTA Department of Rural Development and Land Reform
13
Dennis Moss Partnership
b) Middle Vaal WMA:
(i) The WMA is mostly underlain by fractured acquires, which are well utilised for rural supplies. Little un‐use volumes occur. The quality of groundwater is generally very good.
(ii) Approximately 11 million m3 of groundwater, which is extracted annually to de‐water mines in the Welkom‐Virginia area, are allowed to evaporate from pans.
c) Lower Vaal WMA: (i) Groundwater is the only source of water over much of the WMA. It is mainly used
for rural domestic supplies, stock watering and water supply to several towns. d) Upper Orange WMA:
(i) No large porous aquifers occur in this WMA. Relatively large quantities of groundwater can be abstracted from fracture zones along dolorite intrusions. However recharge rates and therefore sustainable yields are low. Higher recharge occurs in localised areas, e.g. where lime bogs are found.
(ii) In drier parts, groundwater constitutes the main and often the only source of water for rural domestic supplies and stock watering. Groundwater is severely over‐exploited in certain semi‐urban areas, notably at the Bainsvlei smallholdings near Bloemfontein, and at Petrusburg, where irrigation occurs from groundwater.
(iii) The quality of groundwater is naturally good in the eastern high rainfall parts, becoming more mineralised and brackish in the drier areas and in the vicinity of salt pans.
(iv) Groundwater in the Riet/Modder catchment is polluted at specific sites partly due to the use of pit latrines. Some of the boreholes in the Thaba Nchu area cannot be used for human consumption because of high nutrient and microbiological pollutants (DETEA, 2009).
B5.3 WATER BALANCE The water balance and requirements in the Free State for the year 2000 and estimated requirements in 2025 are indicated in the table below (DETEA, 2009 and DWA 2012). Table B2: Water balance of the Free State (DWA, 2012).
YEAR 2000 WATER REQUIREMENTS IN MILLION M3 PER ANNUM Area and WMA Irrigation Urban Rural Mining and
Bulk
Industrial
Power
Generation
Total Local
Needs
Transfers Out TOTAL
UPPER VAAL WMA
Wilge 18 27 15 0 0 60 0 60
Above Vaal Dam 29 32 17 99 39 216 67 283
Below Vaal Dam 67 576 11 74 41 769 1343 2112
TOTAL 114 635 43 173 80 1045 1379 2424
MIDDLE VAAL WMA
Rhenoster‐Vals 26 20 8 0 0 54 0 54
Middle Vaal 33 35 13 48 0 129 559 688
Sand/Vet 100 38 11 38 0 187 2 189
TOTAL 159 93 32 86 0 370 502 872
LOWER VAAL WMA
Harts 452 23 19 0 0 494 62 556
Vaal below Bloemhof 73 32 8 0 0 113 422 535

Free State PSDF: Phase 2 Report February 2013
Department of the Premier & COGTA Department of Rural Development and Land Reform
14
Dennis Moss Partnership
Molopo 0 13 17 6 0 36 0 36
TOTAL 525 68 44 6 0 643 0 643
UPPER ORANGE WMA
Senqu Lesotho 8 2 13 0 0 23 491 514
Caledon Lesotho 12 22 6 0 0 40 0 40
Caledon RSA 88 4 13 0 0 105 59 164
Kraai 84 6 13 0 0 103 0 103
Riet/Modder 252 87 10 2 0 351 29 380
Vanderkloof 336 5 5 0 0 346 2809 3155
TOTAL 780 126 60 2 0 968 3148 4116
YEAR 2025 WATER REQUIREMENTS IN MILLION M3 PER ANNUM
Area and WMA Irrigation Urban Rural Mining and
Bulk Industry
Power
Generation
Total Local
Requirements
Transfers Out TOTAL
UPPER VAAL WMA
Wilge 18 25 13 0 0 56 0 56
Above Vaal Dam 29 36 17 99 75 256 74 330
Below Vaal Dam 67 763 10 74 43 957 1561 2518
TOTAL 114 824 40 173 118 1269 1634 2903
MIDDLE VAAL WMA
Rhenoster‐Vals 26 19 8 0 0 53 0 53
Middle Vaal 33 48 13 48 0 142 560 702
Sand/Vet 100 39 10 38 0 187 2 189
TOTAL 159 106 31 86 0 382 503 885
LOWER VAAL WMA
Harts 452 25 19 0 0 496 60 556
Vaal below Bloemhof 73 31 8 0 0 112 422 534
Molopo 0 10 18 6 0 34 0 34
TOTAL 525 66 45 6 0 642 0 642
UPPER ORANGE WMA
Senqu Lesotho 8 2 13 0 0 23 835 858
Caledon Lesotho 12 22 6 0 0 40 0 40
Caledon RSA 88 6 10 0 0 104 118 222
Kraai 119 7 12 0 0 138 0 138
Riet/Modder 252 146 10 2 0 410 52 462
Vanderkloof 336 6 5 0 0 347 2878 3931
TOTAL 815 189 56 2 0 1062 3584 4646
B5.4 STORAGE DAMS The Free State Province has 19 big dams with a full storage capacity of 15 971.2 million m3.3 The largest irrigation dams in the Free State are as follows: a) Bloemhof Dam: This dam is located at the confluence of the Vaal River and the Vet River,
on the border between the North West and Free State Provinces. It has a capacity of 1 240 million m3 and encompasses an area of 223 km2. The dam wall is 33 m high and has a total surface length of 4 270 m. The reservoir is very shallow, and therefore needs a large area to act as a proper water storage facility. Bloemhof Dam was constructed to impound run‐off originating below the Vaal Dam to meet the needs of users in the Lower Vaal River area. The dam supplies water to various
3 http://www.dwaf.gov.za/Hydrology/Weekly/ProvinceWeek.aspx?region=FS – accessed on 9 December 2012.

Free State PSDF: Phase 2 Report February 2013
Department of the Premier & COGTA Department of Rural Development and Land Reform
15
Dennis Moss Partnership
industrial and municipal users. Most of its water is used for riparian irrigation along the Vaal River in an area of approximately 17 000 ha. Water from the Bloemhof Dam augments supplies to the Vaalharts Water Scheme where approximately 37 000 ha are under irrigation.
b) Gariep Dam: The Gariep dam (formerly known as the Hendrik Verwoerd Dam) is the largest water storage reservoir in South Africa. It has total storage capacity of 5 500 million m3 and a surface area of more than 370 km2. The dam is the central structure of the original Orange River Project which includes the supply of water to parts of the Vaal, Fish and Sundays catchments. The Gariep Dam wall stands at 88m high with a crest length of 914 m. It is situated in a valley at the entrance to the Ruigte Valley approximately 5 km east of Norvalspont. Water from the Gariep Dam is transferred to the Fish and Sundays basins via the Orange‐Fish Tunnel which is one of the longest continuous water transfer tunnels in the world with a length of more than 82 km.
Map B9: Dams in the Free State Province.
c) Sterkfontein Dam: The Sterkfontein Dam is located in close proximity to Harrismith and is
part of the Tugela‐Vaal Water Project. The dam is located on the Nuwejaarspruit, a tributary of the Wilge River in the upper catchment area of the Vaal River. The Sterkfontein Dam is a highly effective reservoir due to its depth which enables the storage of a large amount of water and little loss to evaporation. At full supply, it has a surface area of no more than 70 km2 and has a full storage capacity of 2 656 million m3.

Free State PSDF: Phase 2 Report February 2013
Department of the Premier & COGTA Department of Rural Development and Land Reform
16
Dennis Moss Partnership
d) Vaal Dam: The Vaal Dam is located on the Vaal River some 56 km south of Johannesburg. At full capacity, the dam can store 2 536 million m3 of water with a surface area of approximately 320 km2. The Vaal Dam forms the central storage reservoir for the Vaal River water supply system and is of great important to South Africa, and a key component of the water supply for Gauteng, Free State and other surrounding provinces.
e) Vanderkloof Dam: This dam is the second largest water reservoir in South Africa with a capacity of over 3 200 million m3. It is situated 130 km downstream of the Gariep Dam and forms an integral component of the Orange River Project. It supplies water to the Riet River catchment as well as to the various users along the remaining 1 400 km of the Orange River. The Vanderkloof Dam has a surface area of approximately 133 km2. Water released from the Gariep Dam flows into Vanderkloof Dam from where it is either transferred through the Orange‐Riet Canal to the Riet River basin, or released downstream through two hydro‐power generators.
B5.5 WATER QUALITY Surface water quality in the Upper Orange WMA is naturally good in those streams in the north‐western parts which receive outflow from the dolomitic aquifers (DWA 2012). However, the large quantities of urban and industrial effluent, urban wash‐off, mining and industrial abstraction have a major impact on the water quality. The build‐up of salinity is also of concern and salinity concentrations in the water body have to be carefully managed to ensure that usability of the water is maintained. Atmospheric pollution is also prevalent over parts of the WMA, and contributes to the pollution of surface water resources. The quality of surface water in the Middel Vaal WMA is good, but can be of high turbidity. Wash‐off and return flows from urban areas in the proximity of the Vaal River, and its main tributaries also impact on water quality. Water which enters the Middle Vaal WMA along the Vaal River contains a large proportion of urban and industrial return flow from the Johannesburg area. Salinity levels can be very high and need to be managed by blending with fresh water. High nutrient concentrations also occur as a result of the large domestic return flows which, together with the low turbidity of the return flows, stimulate excessive algal growth. The Skoonspruit is often polluted as a result of improper diamond mining operations on the banks of the river (DWA, 2012). The quality of surface water in the Lower Vaal WMA is generally acceptable, notwithstanding high turbidity (DWA, 2012). Water quality in the Vaal River is impacted upon by urban and industrial use as well as mining activities in the Upper and Middle Vaal WMA, and has a relatively high salinity. Water quality in the lower reaches of the Vaal River is also impacted upon by irrigation return flows from the Harts River as well as from the Riet/Modder River further downstream, necessitating further blending with low salinity water from the Orange River at the Douglas weir (DWA, 2012). In the Upper Orange WMA the quality of surface water is good, particularly the water that flows from the Lesotho Highlands. Water in the Caledon River is naturally of high turbidity and carries a high sediment load. Irrigation return flows have a major impact on salinity in the lower Riet River and water is transferred to the Riet River from Vanderkloof Dam, partly for blending and water

Free State PSDF: Phase 2 Report February 2013
Department of the Premier & COGTA Department of Rural Development and Land Reform
17
Dennis Moss Partnership
quality management purposes. A natural pan below Krugersdrift Dam also adds salinity to the Modder River (DWA, 2012).
Map B10: Status of the main rivers in the Free State Province (Source: DWA 2012).
B5.6 INTERNATIONAL WATER ISSUES The Free State borders on Lesotho. The Caledon River (i.e. Mohokare in Sotho), a tributary of the Orange River, forms a large portion of the boundary between Lesotho and the Free State. Maseru, capital of Lesotho, lies on the Caledon River and draws most of its water from the river. The river exits Lesotho near Wepener in the Free State, and joins the Orange River near Bethulie after a course of 480 km. The Caledon River Valley has one of the greatest temperatures ranges in South Africa, and is a prolific maize‐producing area. In Chapter 10 of the National Water Act 36 of 1998, issues relating to international water management are stipulated. It advocates the establishment of institutional bodies to implement international agreements as it relates to the management and development of shared water resources with neighbouring countries. The Act outlines the key governance functions, reporting requirements, and management of financial affairs. The key functions of such bodies are as follows: a) Investigating, managing, monitoring and protecting water resources. b) Regional cooperation on water resources. c) Acquiring, constructing, altering, operating or maintaining a water work. d) Allocation, use, and supply of water.

Free State PSDF: Phase 2 Report February 2013
Department of the Premier & COGTA Department of Rural Development and Land Reform
18
Dennis Moss Partnership
Bilateral arrangements on water issues by South Africa and Lesotho are addressed through the Lesotho Highlands Water Commission and in terms of the Treaty between the countries on the Lesotho Highlands Water Project. Cooperation amongst the Orange River Basin countries is facilitated through the Orange‐Senqu River Commission (ORASECOM). B5.7 PROVINCIAL WATER ISSUES The table below lists the key sectoral issues regarding the future requirements of the water resources in the four WMAs of the Free State (DWA 2012). Table B3: Water resources – future requirements (Source: DWA, 2009).
WMA FUTURE REQUIREMENTS UPPER VAAL a) Continued economic development in the Johannesburg‐Vereeniging‐
Vanderbijlpark area and increasing urbanisation could lead to a growing demand for water in the sub‐area downstream of the Vaal Dam.
b) Due to similar growth in the urban and industrial sectors in the Crocodile (West) and Marico WMAs, which to a large extent are dependent on water from the Upper Vaal WMA, large quantities of additional water will in future have to be transferred to the Crocodile (West) and Marico WMAs.
c) Additional water will be required in the sub‐area upstream of the Vaal Dam due to growth of petro‐chemical industries and increased power generation.
MIDDLE VAAL a) General trends include the expected decline in water requirements by mining sector and associated declines in urban requirements in the vicinity of mine closures. The Welkom‐Virginia area may be most affected.
b) No meaningful change is foreseen in irrigation and rural water requirements. LOWER VAAL a) Due to negligible to negative population and economic growth a small decrease in
the domestic (urban and rural) and industrial requirements for water is expected. b) No changes are foreseen for irrigation and mining requirements.
UPPER ORANGE
a) Continued economic development and population growth in the Bloemfontein region and a decline in rural population are expected.
b) Water has been allocated to a new 20 000 ha irrigation development for poverty relief covering the Free State, Northern Cape, and Eastern Cape Provinces. It is to be developed in the Upper Orange, Lower Orange and Fish to Tsitisikamma WMAs. A growth in urban/industrial water requirements can therefore be expected in the Riet/Modder sub‐area.
c) Need for the transfer of additional water to other WMAs has been identified. The following interventions are to be considered to reconcile water requirements and water availability (DETEA 2009): a) Increasing water use efficiency through the implementation of Water Conservation and
Demand Management4. b) Trading of water allocations between users from lower to higher benefit users. c) Further development of the local water resource in particular groundwater to meet local
water requirements.
4 Water demand management is defined as the adaptation and implementation of a strategy to influence the water
demand and usage of water. This could include distribution management, e.g. metering, preventive maintenance, pressure management, and consumer demand management, e.g. effective pricing and billing, regulations and social awareness and education. Water conservation is defined as the minimisation of loss or waste, the care and protection of water resources, and the efficient and effective use of water. Mechanisms include optimum water resource management, such as dam storage optimisation and removal of alien plants, and return flow management such as effluent charges and minimisation of losses.

Free State PSDF: Phase 2 Report February 2013
Department of the Premier & COGTA Department of Rural Development and Land Reform
19
Dennis Moss Partnership
B6 BIODIVERSITY AND NATURAL RESOURCES Biodiversity5 is essential to human survival. Ecosystem services such as the maintenance of soil fertility, climate regulation and natural pest control, as well as intangible benefits such as aesthetic and cultural values, all support human activity and sustain human life (Chapin et al, 2002). Biodiversity provides a variety of environmental services, including the regulation of the gaseous composition of the atmosphere, regulation of the hydrological cycle and climate, generation and conservation of fertile soils, dispersal and breakdown of wastes, pollination of many crops, and absorption of pollutants. Biodiversity is no longer an issue confined to conservation and wildlife proponents, rather its importance to farmers, to indigenous people and their livelihoods, to human rights, political dispensations and global trade issues, is now well‐recognised (CSIR, 2004). Virtually all ecosystems and habitats in South Africa have been modified or transformed by human activities. The three key, interrelated threats to biodiversity and ecosystem health are habitat removal, invasive alien species and climate change (Free State DETEA, 2009). B6.1 FLORA The three main biomes6 represented in the Free State are illustrated and described below (refer to Map B11). Within the biomes, a total of 37 vegetation units are represented in the Free State (i.e. 25 in the Grassland Biome, 5 in the Savanna Biome and 1 in the Nama Karoo Biome). Of the 37 vegetation units, 7 are categorised as ‘Endangered’, 6 as ‘Vulnerable’ and 24 as ‘Least Threatened’ (Free State DETEA, 2009). Increasing use of indigenous medicinal plants for health care has resulted in intensive harvesting, particularly by the commercial and illegal traders. The Free State has 69 plant species of medical value, 11 of which are listed in the IUCN Red Data list. With the current rate of extraction, plants that are not listed or protected are subject to extinction. With the rural poor being reliant on natural resources, the utilisation of forest resources for firewood, timber and various other uses has increased and is increasing the problem of deforestation. This is particularly apparent in the northwest region of the province, where there is a shortage of firewood resulting in Acacia karroo being over‐utilised (Free State DETEA, 2009). B6.1.1 GRASSLAND BIOME Approximately 72% of the province falls under the Grassland Biome (SOER, 2009). The grasslands in the north‐western and north‐eastern areas of the province are identified as priority conservation areas in the National Biodiversity Strategy and Action Plan (2005). It is estimated that 60% of the Grassland Biome in the Free State has been irreversibly transformed through urban settlements, mining, agriculture and industrial facilities (SOER, 2009).
5 The Convention on Biological Diversity defines it as ‘the variability among living organisms from all sources
including terrestrial, marine, and other aquatic ecosystems, and the ecological complexes of which they are part; this includes diversity within, and between, species and of ecosystems’.
6 Biomes are classified according to their prominent vegetation. Biomes are defined by factors such as plant structures (such as trees, shrubs, and grasses), leaf types (such as broadleaf and needle leaf), plant spacing (i.e. forest, woodland, Savanna, etc.), and climate.

Free State PSDF: Phase 2 Report February 2013
Department of the Premier & COGTA Department of Rural Development and Land Reform
20
Dennis Moss Partnership
Map B11: Biomes of the Free State (Source: Department of Environment and Nature
Conservation). The Grassland Biome covers primarily the high central plateau of South Africa. Its levels of biodiversity are only second to that of the Cape Floristic Region. It includes approximately 3 370 plant species of which one in six is grass. The remainder includes bulbous plants such as Arum Lilies, Orchids, Red‐Hot Pokers, Aloes, Watsonias, Galdioli and Ground Orchids7. Grasslands (also known locally as Grassveld) are dominated by a single layer of grass. The amount of cover depends on rainfall and the degree of grazing. Trees are absent, except in a few localized habitats. Geophytes (bulbs) are often abundant. Frost, fire and grazing maintain the grass dominance and prevent the establishment of trees. Eight Grassland are endemic to the Free State, namely Xhariep Karroid Grassland, Bloemfontein Dry Grassland, Central Free State Grassland, Winburg Grassy Shrubland, Western Free State Clay Grassland, Eastern Free State Clay Grassland, Frankfort Highveld Grassveld and Northern Free State Shrubland (Free State DETEA, 2009). Prominent grass species in this biome include Eragrostis chloremelas (Curly leaf, Krulhaar, Moseeka), Hyparrhenia hirta (common thatch grass, Dekgras), Eragrostis gummiflua (Gum grass), Heteropogon contortus (Spear grass, Assegaaigras), Phragmites australis (Common reed, Lehlaka), Merxmuellera drakensbergensis (Broom grass), etc. The Grassland Biome is the mainstay of the dairy, beef and wool production in South Africa. Furthermore, this biome is the cornerstone of the maize crop, and many grassland habitats have 7 http://www.wwf.org.za/what_we_do/outstanding_places/grasslands/ ‐ accessed on 3 December 2012.

Free State PSDF: Phase 2 Report February 2013
Department of the Premier & COGTA Department of Rural Development and Land Reform
21
Dennis Moss Partnership
been converted into maize fields. Sorghum, wheat and sunflowers are also cultivated on transformed Grassland habitat8. B6.1.2 NAMA KAROO BIOME Approximately 22% of the Free State is covered by the Nama Karoo Biome. The Northern Upper Karoo is the most prominent vegetation type of the Nama Karoo in the south and south‐western parts of the Free State. The Nama Karoo covers the central plateau of the western half of South Africa, at altitudes between 500 and 2 000 m above mean sea level. The dominant vegetation is a grassy, dwarf shrubland9. Grasses (Hemicryptophytes) in this biome tend to be more common in landscape depressions and on sandy soils (as opposed to clayey soils). Grazing rapidly increases the relative abundance of shrubs (Chaemaphytes). Although not exceptionally rich in species or endemism, the flora and fauna of this region are uniquely adapted to its climate extremes. Vegetation includes shrubland dominated by Karoo shrubs, grasses and Acacia mellifera subsp. detinens and some other low trees (especially on sandy soils in the northern parts and vicinity of the Orange River). Tall shrubs such as Lycium cinereun (d), L. horridum, L. oxycarpum, L. schizocalyx, low shrubs such as Gnidia polycephala (d), Pentzia calcarea (d), Rosenia humils (d), Microloma armatun, Melolobium candicans, etc. abound in the province (Mucina and Rutherford, 2006). Well‐known species found in the province are Sweet Thorn (Acacia karroo), Three Thorn (Rhigozum trichotomum) and Bitterbos (Chrysocoma ciliate). Very little of Nama Karoo is formally protected. Grazing and urbanisation are the major threats affecting this biome. B6.1.3 SAVANNA BIOME The State of the Environment Report for the Free State (2009) indicates that approximately 5.95% of the Free State is covered by the Savanna Biome.The Savanna Biome is the largest Biome in Southern Africa, occupying 46% of its area, and over one‐third the area of South Africa. It is characterized by a grassy ground layer and a distinct upper layer of woody plants. Where this upper layer is near the ground the vegetation may be referred to as Shrubveld, where it is dense as Woodland, and the intermediate stages are locally known as Bushveld. The five vegetation units found in the Free State are Gold Reef Mountain Bushveld, Andesite Mountain Bushveld, Kimberley Thornveld, Vaalbos Rocky Shrubland, and Schimdtsdrif Thornveld. Well‐known species include Common Hook‐thorn (Acacia caffra), Sweet Thorn (Acacia karroo), White Stinkwood (Celtis africana), Black Thorn (Acacia mellifera), Umbrella Thorn (Acacia tortilis), etc. Other plant species occurring in the Free State include Vangueria infausta, Athirxia elata, Personia cajanifolia, Asparangus laricinus, Euclea crispa, Lippia javanica, Teucrium trifidun, Rhus lancea, Boscia albitrunca, Crassula nudicaulis, Lycium cinereume, etc. Most of the Savanna vegetation types are used for grazing, mainly by cattle or game. The importance of tourism and plains game hunting in this biome is generally underestimated.
8 http://www.plantzafrica.com/vegetation/grassland.htm ‐ accessed on 3 December 2012. 9 http://www.plantzafrica.com/vegetation/namakaroo.htm ‐ accessed on 3 December 2012.

Free State PSDF: Phase 2 Report February 2013
Department of the Premier & COGTA Department of Rural Development and Land Reform
22
Dennis Moss Partnership
B6.1.4 FOREST BIOME The fourth biome represented in the Free State is the Forest Biome. Small pockets of forest occur in frost‐free areas with a mean annual rainfall of more than 725 mm rainfall. These are generally located in the eastern parts of the province in the Drakensberg Mountains. Taller trees such as White Stinkwood (Celtis africana), Tree Fuhsia or umBinza (Halleria lucida), Mountain Hard Pear (Olinia emarginata), Cheesewood (Pittosporum viridiflorum), Broad‐leaved Yellowwood (Podocarpus latifolius) occur (Mucina and Rutherford, 2006). This biome is threatened by wildfires that encroach from the surrounding Savanna woodlands, uncontrolled timber extraction, medicinal‐plant harvesting, and grazing in forest areas. B6.1.5 THREATS TO NATURAL FLORA The phenomena and activities below have a negative impact on the natural vegetation of the Free State (Free State DETEA, 2009): a) The alien plant invasion potential is relatively high throughout the Free State. Invading
alien plants displace indigenous plants and use more water than indigenous trees and plants.
b) It is estimated that more than 80% of South Africans rely on indigenous medicinal plants for their health care. The most frequently used medicinal plants are slow‐growing trees, bulbous and tuberous plants with bark or underground parts being the most widely utilised. In the Free State, species of particular importance include Climbing Potato, Pigs Ear, Wild Pear and Pineapple Flower. Areas of concern include the Eastern Free State on the border with Lesotho, the habitat of numerous bulbous indigenous plants. The biggest problem is not the usage of traditional healers per se, but the commercial traders that sell the plants to the traditional healers in cities and who are not concerned about the consequences of their exploitation on the sustainability of the resource.
c) Illegal trade and collection of plants species by commercial traders is based on specific targeted groups, with cycads and succulent groups being the most sought‐after groups.
d) The formal and informal curio trade industry is based on the uncontrolled utilisation of natural resources, particularly plant resources, particularly in the Eastern Free State. Due to the limited available habitat, the Resurrection Plant, Cheesewood and Wild Rhubarb are under threat.
e) The utilisation of forest resources for firewood, timber and various other uses has increased.
B6.2 FAUNA When the first Europeans arrived in the Free State, they encountered game herds so large that their numbers were beyond counting (Bulpin, 1990). Today a large variety of game species are still found throughout the Free State occurring mainly in protected areas and on game farms. The grassy plains of the province provide ideal conditions for game species such as Black Wildebeest, Springbok, Kudu, Red Hartebeest, Buffalo, Eland, Zebra and Blesbok. Two critically endangered sub‐species of Black Rhino (Diceros bicornis) are found in the Free State, namely Diceros bicormis bicormis and Diceros bicormis minor which are under severe threat of poachers. Other Red Data mammal species found in the Free State include Oribi (Ourebia ourebi),

Free State PSDF: Phase 2 Report February 2013
Department of the Premier & COGTA Department of Rural Development and Land Reform
23
Dennis Moss Partnership
White‐tailed Rat (Mystromys albicaudatus), Spotted Necked Otter (Lutra maculicolis), Temminck’s Hairy Bat (Myotis tricolor), etc. Almost 470 bird species are found in the Free State of which fifty‐two species have been recorded in the South African Red Data list. The Rudd’s Lark (Heteromirafra ruddi), White‐winged Flufftail (Sarothrura ayresi) and Wattled Cran (Bugeranus carunculatus) are critically endangered. An isolated population of the endangered Bearded Vulture or Lammergeier (Gypaetus brabatus) is found in the Golden Gate Highlands National Park. Six reptile species and one amphibian species listed in the IUCN Red Data book oocur in the Free State. Two reptiles are categorised as ‘vulnerable’, namely the Sungazer (Cordylus giganteus) and Breyer’s Long‐tailed Seps (Tetradactylus breyeri). The rivers in the Free State host a number of commercially and recreationally important fish species. The indigenous target species include the Orange Vaal Largemouth Yellowfish, Orange Smallmouth Yellowfish, Moggel fish, Orange River Mudfish and Sharptooth Catfish. The Vaal‐Orange Largemouth Yellowfish is the only fish species listed in the IUCN Red Data List. B6.2.1 THREATS TO NATURAL FAUNA According to the SOER (2009) the following issues impact the fauna in the province: a) The growing establishment of private game reserves has led to the loss of genetic integrity
of South Africa’s endemic species as a result of hybridisation. Hybridisation has occurred between the Blesbok and Bontebok, the Black and Blue Wildebeest, and the Red Hartebeest and Tsessebe.
b) Loss of fauna due to encroachment of urban development, over‐hunting and loss of land used for grazing of sheep and cattle.
c) Mallard Duck (Anas platyrhynchos) poses a significant threat to genetic integrity due to hybridisation with indigenous species, mainly the Yellow‐billed Duck (Anas undulate).
d) Inter Basin Transfer Schemes such as the Malibamatso to Ash River have impacted on the genetic integrity of fish species due to the introduction of species from historically isolated populations. Isolation of migratory species, upstream from dam or weir walls where the connectivity is separated and gene movement occurs only in a downstream direction, result in a depletion of genetic diversity and lessening of the viability of the population. None of the dams or weirs in the Free State has any fishways to maintain stream connectivity.
e) South Africa is home to 74% of Africa’s remaining rhinoceros population. Farms in the Free State have also been targeted by poachers, killing rhinos for their horns. The Free State government has made notable strides in eradicating rhino poaching.
B6.3 PROTECTED NATURE AREAS Approximately 3.4% of the land surface of the Free State is formally conserved (SOER 2009). There are currently 18 provincial nature reserves, which represents only 1.6% of the province (refer to Table B4 and Map B12). The SOER (2009) states that the reserves are fragmented areas throughout the province and were not necessarily selected for their importance with regard to biodiversity or cultural heritage.

Free State PSDF: Phase 2 Report February 2013
Department of the Premier & COGTA Department of Rural Development and Land Reform
24
Dennis Moss Partnership
Map B12: Protected areas (Source: Department of Environment and Nature Conservation).
The Maloti‐Drakensberg Transfrontier Conservation Area is located in the Free State. It is a transboundary initiative between Lesotho and South Africa. This area incorporates the Drakensberg Mountains, which support unique montane and sub‐alpine ecosystems. These ecosystems comprise a globally‐significant plant and animal biodiversity together with unique habitats and high levels of endemism. The Golden Gate National Park is the only national park in the Free State. It forms part of the Maloti‐Drakensberg Transfrontier Conservation Area. The park is located 12 km away from Clarens, at the foot of the Maluti Mountains. The park is best known for its massive, colourful sandstone formations, which shine golden‐yellow, orange, and red in the evening sun, and from which the area takes its name. Through the ages, water and wind has eroded the sandstone into spectacular formations – steep cliffs, great caves, rock shelters and many bizarre shapes. According to history, the caves and cliffs of the Maluti Mountains provided shelter for the San and other African tribes for thousands of years. Consequently, some of the best San rock art in South Africa are found in these mountains. The prominent Sentinel or ‘Brandwag’ is an imposing sandstone structure which forms a unique geomorphological feature in the park’s landscape. The park serves as a habitat for a variety of big game mammals, numerous bird species, and a variety of grassland vegetation species. The park provides numerous hiking trails and paths, and recreational opportunities such as trout fishing, hiking trails, walking routes, rock‐climbing, horse riding, swimming, etc.
Free State PSDF: Phase 2 Report February 2013
Department of the Premier & COGTA Department of Rural Development and Land Reform
25
Dennis Moss Partnership
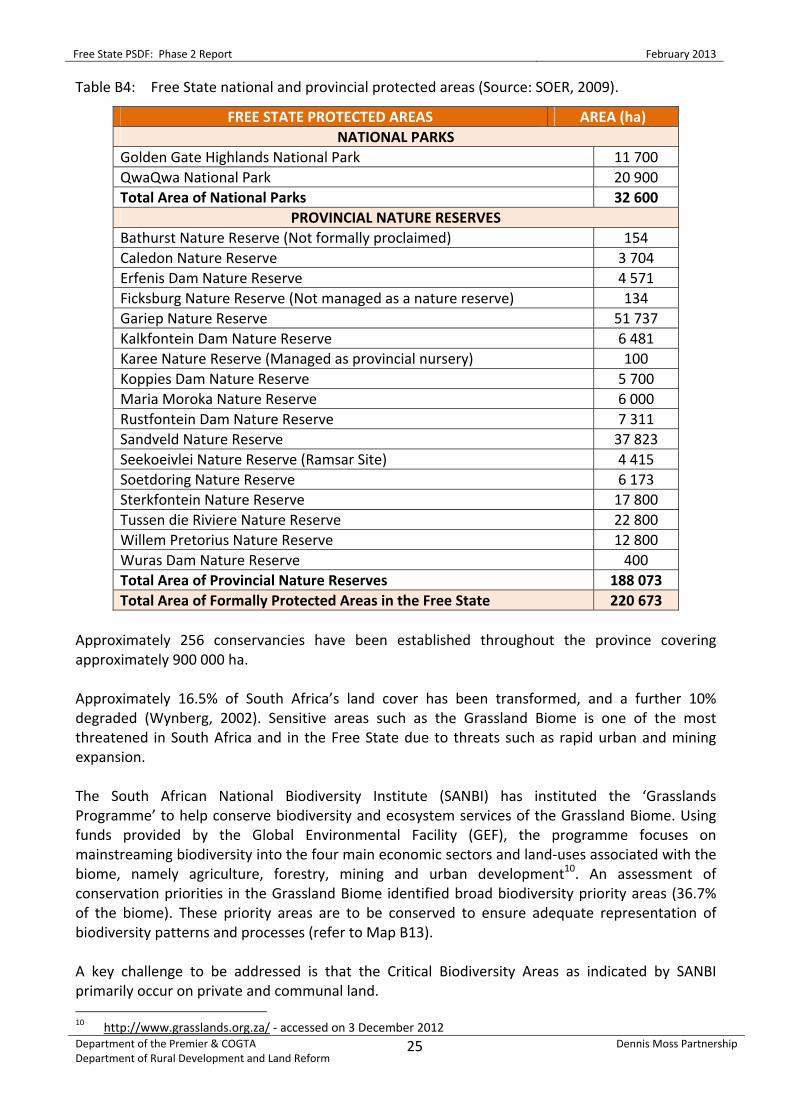
Table B4: Free State national and provincial protected areas (Source: SOER, 2009).
FREE STATE PROTECTED AREAS AREA (ha) NATIONAL PARKS
Golden Gate Highlands National Park 11 700 QwaQwa National Park 20 900 Total Area of National Parks 32 600
PROVINCIAL NATURE RESERVES Bathurst Nature Reserve (Not formally proclaimed) 154 Caledon Nature Reserve 3 704 Erfenis Dam Nature Reserve 4 571 Ficksburg Nature Reserve (Not managed as a nature reserve) 134 Gariep Nature Reserve 51 737 Kalkfontein Dam Nature Reserve 6 481 Karee Nature Reserve (Managed as provincial nursery) 100 Koppies Dam Nature Reserve 5 700 Maria Moroka Nature Reserve 6 000 Rustfontein Dam Nature Reserve 7 311 Sandveld Nature Reserve 37 823 Seekoeivlei Nature Reserve (Ramsar Site) 4 415 Soetdoring Nature Reserve 6 173 Sterkfontein Nature Reserve 17 800 Tussen die Riviere Nature Reserve 22 800 Willem Pretorius Nature Reserve 12 800 Wuras Dam Nature Reserve 400 Total Area of Provincial Nature Reserves 188 073 Total Area of Formally Protected Areas in the Free State 220 673
Approximately 256 conservancies have been established throughout the province covering approximately 900 000 ha. Approximately 16.5% of South Africa’s land cover has been transformed, and a further 10% degraded (Wynberg, 2002). Sensitive areas such as the Grassland Biome is one of the most threatened in South Africa and in the Free State due to threats such as rapid urban and mining expansion. The South African National Biodiversity Institute (SANBI) has instituted the ‘Grasslands Programme’ to help conserve biodiversity and ecosystem services of the Grassland Biome. Using funds provided by the Global Environmental Facility (GEF), the programme focuses on mainstreaming biodiversity into the four main economic sectors and land‐uses associated with the biome, namely agriculture, forestry, mining and urban development10. An assessment of conservation priorities in the Grassland Biome identified broad biodiversity priority areas (36.7% of the biome). These priority areas are to be conserved to ensure adequate representation of biodiversity patterns and processes (refer to Map B13). A key challenge to be addressed is that the Critical Biodiversity Areas as indicated by SANBI primarily occur on private and communal land. 10 http://www.grasslands.org.za/ ‐ accessed on 3 December 2012

Free State PSDF: Phase 2 Report February 2013
Department of the Premier & COGTA Department of Rural Development and Land Reform
26
Dennis Moss Partnership
Map B13: Priority clusters of the Grassland Biome (Source: http://www.grasslands.org.za/).
B7 HERITAGE RESOURCES B7.1.1 THE STONE AGE The Stone Age is particularly evident along rivers, pans and valleys in the province. The archaeological sites at Fauresmith include stone tools such as blades, points and prepared core technology dating back to at least 420 000 years ago. The world‐famous skull remains discovered at Florisbad, north of Bloemfontein, which date back to more than 260 000 years, is widely considered an archaic form of Homo sapiens (Free State Tourism, 2011 and Erasmus, 2004). Late Stone Age (the past 20 000 years) remains are associated with the Bushman or San hunter‐gatherers, and tend to be preserved mostly in the foothills and rocky outcrops. Late Stone Age deposits in the Free State are often found in conjunction with rock art. The significance of archaeological remains can fluctuate depending on the context of the deposits and the degree of preservation. The Free State has for thousands of years been inhabited by the San. Small groups of these hunter‐gatherers traversed the landscapes, collecting plants, hunting animals etc. Their most important legacy is their rock art. The Free State has some of the most valued San rock art in South Africa, including those located at11:
11 San Rock Art in the Free State: http://www.freestateonline.fs.gov.za/?page_id=1373 – accessed on 3 December
2012.

Free State PSDF: Phase 2 Report February 2013
Department of the Premier & COGTA Department of Rural Development and Land Reform
27
Dennis Moss Partnership
a) Caledon Nature Reserve: Rock paintings of Eland, Hippo, cattle, a huge snake and human figures.
b) Hoekfontein: Panel of 14 human figures dancing, 7 Steenbok figures and an Eland. c) Kiara12: South Africa’s only unequivocal example of a Dassie or Rock Hyrax. d) Moolmanshoek: A collection of 47 San rock paintings, including 2 felines, Eland, a shaman
transforming into her/his source of animal potency, seven women with weighted digging sticks and some enigmatic parallel red lines.
e) Schaapplaas, near Clarens: A collection of 35 San rock paintings that include eight paintings of part‐human, part‐animal beings that represent the San shamanistic rituals.
f) Sterkstroom: This includes an 18 m wall of baboon, eland, elephant, hartebeest, monsters, spirit‐world beings. Furthermore, there is the smallest known painting of a buck in South Africa as well as the Khoi geometric motifs.
g) Tandjesberg: One of South Africa’s 12 rock art heritage sites and has over 500 San rock art paintings. At the site bees, birds, cattle, exotic elephant, a frenetic medicine dance, animated human figures, rain‐animals and the enigmatic ‘weird white’ tradition is depicted.
Approximately 2 000 years ago the Khoi herders roamed the Free State landscape. They led a semi‐nomadic lifestyle and lived in small ‘kraals’ often with over one hundred people. The Khoi and the San competed for land as grazing herds increased. B7.1.2 THE EARLY PASTORALISTS By the nineteenth century, the Griquas were established pastoralist farmers and they lived on game, cattle, vegetables and corn of their own cultivation and had large herds of domestic stock. Griqualand consisted mainly of two areas, namely Griqualand East (in the Eastern Cape of approximately 19 000 km2), and Griqualand West (located in Northern Cape and Free State of approximately 38 000 km2)13. The Griquas or ‘Griekwas’ spoke Dutch and Afrikaans and were very successful farmers, and traded with Tswana people and other white settlers in goods such as cattle, grain, ivory, salt, horses, etc. In 1826, Griqua leader, Adam Kok, and his people settled in Philippolis, and when the government of the Orange Free State agreed to sell the land to Britain, he migrated with his people to Griqualand East14. Another Khoi group that settled in the Free State were the Korana or Kora, and during 1834 approximately 20 000 Korana grazed their livestock between the Orange and Vaal rivers. The area around Bethany was for long a Korana stronghold. B7.1.3 THE SOTHO The ancestors of the Sotho people or Basotho/Basuto have lived in Southern Africa for approximately 1 500 years. The Basotho nation emerged from the accomplished diplomacy of King Moshoeshoe I who gathered together disparate clans of Sotho‐Tswana origin that had dispersed across Southern Africa in the early 1800s after the wars started by Shaka Zulu. Their capital was at Thaba Bosiu, which means ‘Mountain of the Night’ in Sotho. Various wars and conflicts took place between the British, Boers and Basotho in the middle and late 19th century.
12 http://www.nasmus.co.za/departments/rock‐art/public‐rock‐art‐sites ‐ 3 December 2012. 13 http://www.crwflags.com/fotw/flags/za‐griqu.html ‐ accessed on 4 December 2012. 14 http://www.gophilippolis.com/ ‐ accessed on 4 December 2012.

Free State PSDF: Phase 2 Report February 2013
Department of the Premier & COGTA Department of Rural Development and Land Reform
28
Dennis Moss Partnership
The Basotho Cultural Village has been established in the Golden Gate Highlands National Park. This is essentially an open‐air museum which demonstrates the unique culture of the Sotho.
King Mashoeshoe l Although Moshoeshoe I ceded much of his territory to the Boers and British, he never suffered a major military defeat, and retained most of his kingdom and all of his culture. He remains one the rare kings of Africa, who was never defeated fully by the colonial powers. B7.1.4 THE EARLY SETTLERS The area north of the Orange River of South Africa was first visited by Europeans towards the end of the 18th century. Between 1817 and 1831, hunters and missionaries crossed the Orange River. During the Great Trek in 1836 the first party of Voortrekkers under A.H. Potgieter arrived in the Free State and farmers settled between the Vet and Vaal Rivers. Numerous settlements were established that are still functioning towns today. On 23 February 1854, the Orange Free State officially became a republic for the Voortrekkers or Boers. They fought with the Basothos and had two wars that ended in 1868. The Basotho Kingdom became a British protectorate and to appease the Boers the British granted most of Basotho’s fertile lands to the Orange Free State. This allegedly led to the current border between Lesotho and the Free State. The Free State was central to the Anglo‐Boer War (1899‐1902). Major battles and campaigns were fought in this province at Wepener, Fouriesburg, Dewetsdorp, Reddersburg, Boshof, Bulfontein, etc. Various concentration camps were erected by the British in the Free State and nearly 27 000 Boer women and children lost their lives in these impoundments.
Bethulie The concentration camp at Bethulie was the largest of the many concentration camps established by the British during the Anglo‐Boer war in the Free State. The DH Steyn Railway Bridge, which is a combined road and rail bridge, outside the town is the longest bridge in South Africa. It has a length of 2 993 m (including approaches). Large numbers of Black Africans (i.e. Zulus, Xhosas, Bakgatla, Shangaan, Sotho, Swazi and Basotho) were involved in the Anglo‐Boer war and were employed by both the Boers and the British. Thousands died in the conflict (estimated to be more than 21 000). In recent years (2011‐2012) efforts are made by heritage institutions (e.g. the Anglo‐Boer War Museum in Bloemfontein) to honour the role of the African people in the war, and the suffering they endured during these times. The British War Graves and Monument has been established at Dewetsdorp to honour the British soldiers who lost their lives during the Anglo‐Boer War. B7.1.5 HISTORIC SETTLEMENTS Bloemfontein has been South Africa’s judicial capital since 1910. The heritage of Bloemfontein (known as the ‘City of Roses’) is reflected in the many buildings of historical importance found throughout the city. These historical sites and buildings are of relevance to many facets of the South African history, including. The most prominent features are the:

Free State PSDF: Phase 2 Report February 2013
Department of the Premier & COGTA Department of Rural Development and Land Reform
29
Dennis Moss Partnership
a) Anglican Cathedral. This regarded as the spiritual heart of Bloemfontein’s Anglican community. The city’s founder, Major Henry Douglas Warden, laid the foundation stone of the church in 1850.
b) Anglo‐Boer War Museum: This is dedicated to the South African men who fought against the British in the Anglo‐Boer War and other struggles in South Africa. This Museum is a standard source of reference and material for students of the Anglo‐Boer war.
c) Appeal Court. The court was completed in 1929 and serves as the highest court in South Africa.
d) Bram Fisher House. Bram Fischer was a member of the Communist party and the lawyer who represented the ANC members accused in both the Treason and Rivonia Trails in 1960s.
e) City Hall. This building is a sandstone buildings designed by Sir Gordon Leith. It is located in President Brand Street, which has been declared a national conservation area in its entirety.
f) Digareteneng Houses. These were built in 1952 to coincide with the visit of King George V to Bloemfontein in order to conceal the squatter settlements in the area.
g) Maphikela House. Thomas Maphikela was one of the founder members of the ANC in Bloemfontein in 1912. His house, where important ANC meetings were held, has been declared a National Monument.
h) National Afrikaans Literature Museum: This Cape Dutch style building was designed by Sir Herbert Baker and houses the largest collection of Afrikaans literary heritage, as well as artefacts belonging to well‐known Afrikaans writers.
i) Old Presidency. This building dates back to the 1800s and was previously the official residence of the presidents of the former Republic of the Orange Free State.
j) Twin‐spire Church. This is the only twin‐spire Dutch Reformed Church in Southern Africa, completed in 1880.
k) Womens’ Monument: This is a monument commemorating the suffering of approximately 27 000 Boer women and children who died in British concentration camps during the Anglo‐Boer War. The ashes of Emily Hobhouse are kept at the foot of the monument.
Other historic settlements in the Free State include: (i) Harrismith which was founded in 1849 and named after Governer Harry Smith. (ii) Koffiefontein. Transport riders' habit of constantly making coffee is said to have led to the
name Koffiefontein. In 1870, one of the transport riders picked up a diamond near the fountain. This prompted a diamond rush and by 1882 Koffiefontein has become a booming town with four mining companies. Ten years later the miners' camp was proclaimed a town and the name, Koffiefontein, was retained.
(iii) Smithfield was founded in 1848 by Sir Harry Smith. Smith, governor of the Cape Colony, laid the foundation stone for a church planned as the focal point of the settlement. In 1855 the village served as the location for peace talks between Moshesh and Sir George Grey, governor of the Cape Colony.
(iv) Winburg. The trade of cattle for the land between the Vaal and Vet River, undertaken by Andries Pretorius and Bataung Chief Makwana in 1836, led to serious disputes. The settlement of these led to the proclamation of the first Voortrekker town in the Free State.
(v) Jagersfontein was established in 1870 and is South Africa’s oldest mining town. Eight of the 24 biggest diamonds ever found in the world came from this very productive diamond mine. The mine is reputed to be one of the largest, man‐made, vertical‐sided open diamond mine in the world.
Free State PSDF: Phase 2 Report February 2013
Department of the Premier & COGTA Department of Rural Development and Land Reform
30
Dennis Moss Partnership
B7.1.6 MISSIONARIES A number of mission stations were established in the Free State by various missionary societies, and some of these developed into proper settlements. These mission stations were meant to be self‐sufficient and most of them operated as small agricultural enterprises that produced fruits and vegetables for the congregation and the surrounding regions. Mission stations in the Free State include (Free State Tourism, 2011): a) Modderfontein: In 1869, a cave church was consecrated by the Anglican Society of St.
Augustine. The Society used the cave for church services and for accommodation until it could build a house (Erasmus, 2004).
b) Wesleyan: This site was established in 1833 by Reverend James Archbell. The grave of Chief Moroka is located at the mission station and it is a heritage site.
c) Bethulie: Originally a mission station of the London Missionary Society, the site later became the property of the French Missionary Society. The honourable Reverend Jean Pellissier set up his headquarters here and named the mission, meaning ‘Chosen by God’. The concentration camp at Bethulie was the largest of the many camps established by the British during the Anglo‐Boer War.
d) Philippolis: First established in 1823, this was a mission station of the London Missionary Society for the Khoisan and later for the Griquas. It is the oldest settlement in the Free State. The area is also renowned for its rich fossil finds, some dating back to 240 million years.
e) Ficksburg: A Wesleyan mission station was founded on the slopes of the Mpharane Mountains before the founding of the town in 1867. Missionaries planted willow cuttings taken from Napoleon Bonaparte’s grave on the island of St. Helena on this property.
B7.1.7 HERITAGE SITES The Vredefort Dome was listed as a UNESCO World Heritage Sites in 2005 as South Africa’s seventh World Heritage Site. The Vredefort Dome is the oldest and largest meteorite impact site in the world. It is a representative portion of a larger meteorite impact structure, or astrobleme. Dating back to more than 2 billion years ago, it is the oldest astrobleme found on earth to date. The Vredefort Dome has a radius of 190 km and is the largest and the most deeply eroded impact meteorite site on the planet. The impact crater of the Vredefort Dome bears witness to the world’s greatest known single energy release event, which caused devastating global change, including, according to some scientists, major evolutionary changes. This event provides critical evidence of the earth’s geological history and is crucial to our understanding of the evolution of the planet. B8 DEMOGRAPHIC PROFILE The Free State has the second lowest population density of all provinces with an estimated population of 2 759 644 (Stats SA, 2011). The population grew by approximately 0.14% since the 2001 census. The Black population are the largest group, representing 46% of the Free State’s population. The male/female ration is almost equal with approximately 51% (1 427 642) of the total population being female and approximately 49% (1 332 002) being male.

Free State PSDF: Phase 2 Report February 2013
Department of the Premier & COGTA Department of Rural Development and Land Reform
31
Dennis Moss Partnership
Map B14: Population per Local Municipality (2001 Census).
The South African population density increased from 33.3 persons per km2 in 1996, to approximately 42.4 persons per km2 in 2011. After the Northern Cape Province, the Free State Province has the second lowest density of 21.1 persons per km2. This has increased slightly from 20.3 persons per km2 in 2007. By contrast, the population density in Gauteng was 432 people per km2 in 1996 and 675.1 people per km2 in 2011. The estimated population size and percentage distribution of the metropole, district and local municipalities of the Free State for the 2001 and 2011 census is summarised in Table B5 (Stats SA, 2011). Table B5: Population of the Free State on Metropolitan, District and Local Municipal level for
2001 and 2011 (Source: Stats SA, 2011).
Area Population Population Growth(% p.a.)
2001 2011 2001 – 2011 SOUTH AFRICA 44 819 777 51 770 561 1.44 FREE STATE PROVINCE 2 706 775 2 745 590 0.14
MAN: Mangaung Metropolitan 645 440 747 431 1.47 DC16: Xhariep District Municipality 162 727 146 259 ‐1.07 FS161: Letsemeng Local Municipality 42 847 38 628 ‐1.04 FS162: Kopanong Local Municipality 56 079 49 171 ‐1.31 FS163: Mohokare Local Municipality 36 321 34 146 ‐0.62 FS164: Naledi Local Municipality 27 479 24 314 ‐1.22 DC18: Lejweleputswa District Municipality 657 012 627 626 ‐0.46 FS181: Masilonyana Local Municipality 64 409 63 334 ‐0.17

Free State PSDF: Phase 2 Report February 2013
Department of the Premier & COGTA Department of Rural Development and Land Reform
32
Dennis Moss Partnership
B8.1 MIGRATION PATTERN Migration is defined as the change of people’s place of residence, which involves the crossing of some kind of boundary such as an international or provincial border15. Migration is, in many ways, a response to structural disequilibria between and within sectors of the economy, or between regions. Deepening and widening inequality of income and opportunities within provinces, and an absolute increase in the numbers of people enduring poverty and extreme hardship, add to the pressure for people to migrate. The Free State has experienced a change in its economic sectors over the recent decades specifically in the primary sectors of agriculture and mining. This presented many challenges for the Free State economy of which unemployment is one of the most concerning. Over the last 15 years (prior to 2012) 200 000 jobs in the primary and secondary sectors were lost (FSGDS 2012). The estimated migration stream for the population of 2001‐2006 in the Free State had a net‐migration of minus 45 740 people, of which 147 329 were out‐migrants and 101 589 in‐migrants. The estimated migration stream for the population of 2006‐2011 in the Free State had a net‐migration of minus 25 892 people, of which 118 640 were out‐migrants and 92 748 in‐migrants (refer to Table B6). Table B6: Estimated migration streams in the Free State (Source: SA Stats, 2011). Estimated provincial Migration Stream, 2001 – 2006 Province Out‐Migration In‐Migration Net Migration Free State 147 329 101 589 ‐ 45 740 Estimated provincial Migration Stream, 2006 – 2011 Free State 118 640 92 748 ‐ 25 892 The majority of people migrating out of the province (34%) tend to move to the Gauteng, followed by 18% to Eastern Cape, 14% to the North West and 10% to the Northern Cape (Stats SA,
15 http://www.commerce.uct.ac.za
FS182: Tokologo Local Municipality 32 455 28 986 ‐1.13 FS183: Tswelopele Local Municipality 53 714 47 625 ‐1.20 FS184: Matjhabeng Local Municipality 408 170 406 461 ‐0.04 FS185: Nala Local Municipality 98 264 81 220 ‐1.90 D19: Thabo Mofutsanyane District
Municipality 782 302 736 238 ‐0.61
FS191: Setsoto Local Municipality 123 194 112 597 ‐0.90 FS192: Dihlabeng Local Municipality 129 338 128 704 ‐0.05 FS193: Nketoana Local Municipality 61 951 60 324 ‐0.27 FS194: Maluti a Phofung Local Municipality 360 549 335 784 ‐0.71 FS195: Phumelela Local Municipality 51 928 47 772 ‐0.83 FS196: Mantsopa Local Municipality 55 342 51 056 ‐0.81 DC:20 Fezile Dabi District Municipality 459 294 488 036 0.61 FS201: Moqhaka Local Municipality 167 892 160 532 ‐0.45 FS202: Ngwathe Local Municipality 118 810 120 520 0.14 FS203: Metsimaholo Local Municipality 115 955 149 108 2.51 FS204: Mafube Local Municipality 56 637 57 876 0.22

Free State PSDF: Phase 2 Report February 2013
Department of the Premier & COGTA Department of Rural Development and Land Reform
33
Dennis Moss Partnership
Community Survey 2007). The table below indicates the estimated percentage of out‐migrants from the Free State to the various provinces in South Africa. Table B7: Estimated emigration percentage of out‐migrants from the Free State to other
Provinces in South Africa: 2006‐2011 (Source: FSGDS, 2012).
PROVINCE % OF OUT‐MIGRANTS Western Cape 6 % North West 14 % Mpumalanga 4 % Limpopo 4 % KwaZulu‐Natal 8 % Gauteng 34 % Eastern Cape 18 % Northern Cape 6 %
Table B8 summarises the distribution of non‐migrants and migrants based on place of birth in South Africa. The figures indicate that approximately 21.5% of people born in the Free State reside in different provinces. Approximately 14.4% of in‐migrants were born outside the Free State. Table B8: Percentage distribution of non‐migrants and migrants based on place of birth (Source:
Community Survey, 2007).
PROVINCE % OF POPULATION BORN IN THE PROVINCE
% OF IN‐MIGRANTS (RESIDENT POPULATION
NOT BORN IN THE PROVINCE)
% OF OUT‐MIGRANTS (POPULATION BORN IN THE PROVINCE RESIDING
ELSEWHERE) Eastern Cape 93.4 6.6 23.0 Free State 85.6 14.4 21.5 Gauteng 58.1 41.4 21.5 KwaZulu‐Natal 93.5 6.5 9.4 Limpopo 93.6 6.4 22.9 Mpumalanga 76.3 23.7 20.0 Northern Cape 84.4 15.6 29.3 North West 76.9 23.1 16.6 Western Cape 71.7 28.3 8.1 B9 SOCIO‐ECONOMIC STATUS Over the past decade there has been little to no variance in the Human Development Index (HDI)16 figures for the Free State, indicating no increase or decrease in the overall standard of living. This trend is unlikely to change in the foreseeable future, mainly due to the marginal economic base of the poorer areas, the decline of the primary sector and the consolidation of the economic base in the relatively better‐off areas, and the increase in HIV and AIDS. The estimated HDI for the Free State is 0.54 (2010) almost equal to the South African figure of 0.56 (2010).
16 The (HDI) provides a method to measure the relative socio‐economic development of an area and is seen as a
measure of people’s ability to live a long and healthy life, to communicate, to participate in the community and have sufficient means to be able to afford a decent living.

Free State PSDF: Phase 2 Report February 2013
Department of the Premier & COGTA Department of Rural Development and Land Reform
34
Dennis Moss Partnership
B9.1 POVERTY As with most of South Africa, poverty is a major problem in the Free State with a high number of households living below the poverty line17. At the national level, 48% of households live on less than R322 a month. Approximately 50% of South Africa’s population lives on 8% of national income. The Gini coefficient18 has increased from 0.59 in 1996 to 0.64 in 2010, which implies that income distribution has deteriorated (FSGDS, 2012). The total number of grants in the province increased from approximately 98 000 in 1995 to almost 850 000 in 2010. The latter figure amounts to approximately 30% of the Free State’s total population. Income inequality in the province has deteriorated from 0.59 to 0.64 over the same period. An assessment of poverty in the broader sense reveals that 51% of the Free State’s population lives in poverty. This means that approximately 1 122 500 people were living in poverty in the province in 2010 compared to 1 393 891 people in 2000. The high levels of poverty, low incomes and an increase in inequality in income distribution make it difficult for many people to have access to basic services (FSGDS, 2012). Unemployment in the Free State presents a major challenge as indicated by the 2011 Census. The unemployed level in the Free State is higher than the national average. Lejweleputswa District Municipality has the highest unemployment rate (36.5%) in the province followed by Thabo Mofutsanyane District Municipality at 35.1%. Mangaung has the lowest unemployed rate (27.7%) in the province.
Unemployment Rate - Free State Province (2001 and 2011)
40.1
35.6
44.8
46.9
41.3
43.0
41.6
27.7
26.8
36.5
35.1
33.9
32.6
29.8
0.0 5.0 10.0 15.0 20.0 25.0 30.0 35.0 40.0 45.0 50.0
Mangaung Metropol Municipality
Xhariep District Municipality
Lejweleputswa District Municipality
Thabo Mofutsanyane DistrictMunicipality
Fezile Dabi District Municipality
FREE STATE PROVINCE
SOUTH AFRICA
Reg
ions
Percentages
20112001
Figure B1: Employment in the Free State (Source: Stats SA, 2011).
17 The poverty line is the average sum of money (R1600 per month) that a household or individual needs to survive.
Of the employed sector, 51% earn between R401 ‐ R1600 per month. Meaning some 51% of the employed labour sector thus earn less than R1600 per month and therefore live in poverty.
18 This is the measurement of the income distribution of a country's residents. This number, which ranges between 0 and 1 and is based on residents' net income, helps define the gap between the rich and the poor, with 0 representing perfect equality and 1 representing perfect inequality.

Free State PSDF: Phase 2 Report February 2013
Department of the Premier & COGTA Department of Rural Development and Land Reform
35
Dennis Moss Partnership
B9.2 EDUCATION In the Free State, the educational profile from pre‐1994 years has significantly improved. Functional literacy has increased from 64% in 1994 to approximately 80% in 2010. The Grade 12 pass rate has increased from 56% to 71% in 2010. Notwithstanding these improvements, only 23% of the Free State population have a Grade 12 qualification and only 8% a tertiary qualification. There are concerns regarding the ability of the education system to support early childhood development. Although there has been an increase of 40% in the number of Grade R classes in the Free State since 2004, only 58% of potential Grade R learners at the age of 5 years are enrolled in school. In 2010 only 50% of the Grade 3 learners achieved a satisfactory level of competency and this subsequently continued into secondary education. The problems associated with the Grade R, Primary and Secondary school attendance hamper the educational system in that approximately 50% of the Free State pupils leave secondary school before matriculating. Of those passing Grade 12, only 35% continue with tertiary education. The percentages of learners who complete matriculation with university exemption, mathematics and physical science remain low. These processes drive the unemployment problem nationally, and especially in the Free State. According to the 2011 Census, only 27.1% of the Free State population (aged 20+) matriculated, with only 9.5% continued further with tertiary education. Approximately 7.1% of the Free State adults have no schooling (refer to Figure B2). Mangaung Metropolitan Municipality has the highest attainment level of matriculation with the Thabo Mofutsanyane District with the lowest matriculation rate and in the same stance the highest no schooling level and highest unemployed region.
Education Levels of South Africa per Province (Stats SA, 2011)
2.7
10.5 11.3
7.1
10.811.8
3.7
14.1
17.3
8.6
28.6
20
23
27.1
31.2
25.4
34.8
29.5
22.7
28.9
14.1
8.57.2
9.5 9.17.5
17.7
9.2 9.2
11.8
0
5
10
15
20
25
30
35
40
Western Cape Eastern Cape NorthernCape
Free State KwaZulu-Natal
North West Gauteng Mpumalanga Limpopo South Africa
%
No Schooling Matriculated Tertiary Education
Figure B2: Adult Education levels of South Africa per province, 2011 (Source: Stats SA, 2011).

Free State PSDF: Phase 2 Report February 2013
Department of the Premier & COGTA Department of Rural Development and Land Reform
36
Dennis Moss Partnership
Table B9: Education standards in district municipalities (Source: Stats SA, 2011).
EDUCATION (aged 20+)
No Schooling
Primary Educational Enrolement Matric Higher Education
Aged 6‐13
2001 2011 2001 2011 2001 2011 2001 2011 SOUTH AFRICA 17.9 8.6 91 93.1 22.1 28.9 8.4 11.8
FREE STATE 16.0 7.1 91.2 94.4 18.8 27.1 6.3 9.5 Mangaung Metro 10.9 4.2 92.1 94.0 23.5 29.2 9.1 8.1
Xhariep 21.5 12.4 88.2 93.2 13.1 18.5 4.5 3.2 Lejweleputswa 15.3 6.5 88.8 93.7 16.8 24.8 4.8 3.6 Thabo Mofutsanyane 21.7 9.0 92.5 95.7 17.3 24.4 5.5 4.0
Fezile Dabi 13.8 6.9 92.1 94.1 19.4 26.2 6.3 4.1 B10 GENERAL SOCIO‐ECONOMIC STATUS B10.1 SERVICE STANDARDS: HOUSING Housing is one of the basic human needs that has a profound impact on the health, welfare, social attitudes and economic productivity of the individual. It is also one of the best indicators of a person’s standard of living and place in society. In terms of the Millennium Development Goals, the South African government is to ensure that its citizens have proper housing. In order to achieve this goal, the government aims to eliminate all informal dwellings, bucket type toilets, and ensure that all citizens have access to electricity for lighting, and access to clean, safe water within a reasonable distance (Stats SA, 2007). According to the 2011 Census, the Free State has 823 316 households and in 2009 the province had a housing backlog of 160 000 dwelling units (Stats SA, 2009) (also refer to Table B10). Table B10: Number of households in the districts of the Free State for the 2001 and 2011 Census
(Source: Stats SA, 2011). REGION CENSUS 2001 CENSUS 2011
South Africa 11 205 706 14 450 162 Free State 733 302 823 316 Mangaung Metro 185 013 231 921 Xhariep 46 454 453 68 Lejweleputswa 184469 183 163 Thabo Mofutsanyane 197 018 217 884 Fezile Dabi 120 347 144 980
Table B11 illustrates the percentages of households within the Free State living in formal19, informal20, traditional21 or other22 forms of dwellings.
19 Formal dwellings:
• House build with brick/ concrete on a separate stand or yard or farm.
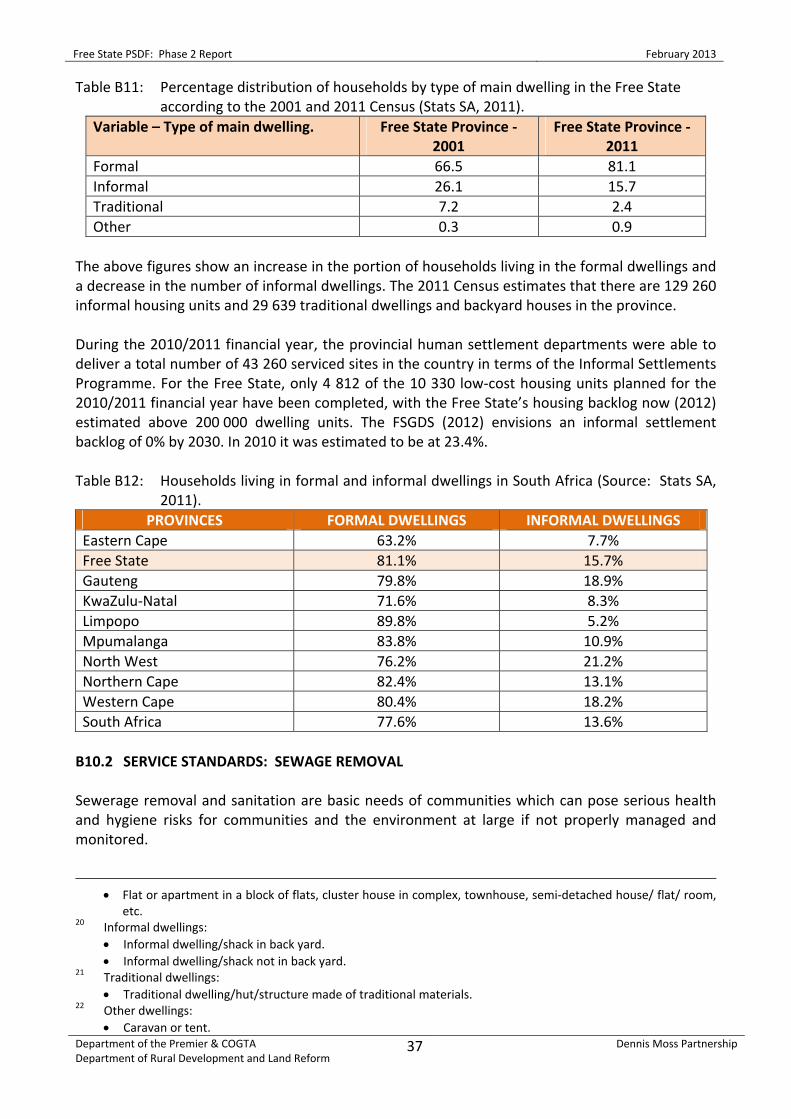
Free State PSDF: Phase 2 Report February 2013
Department of the Premier & COGTA Department of Rural Development and Land Reform
37
Dennis Moss Partnership
Table B11: Percentage distribution of households by type of main dwelling in the Free State according to the 2001 and 2011 Census (Stats SA, 2011).
Variable – Type of main dwelling. Free State Province ‐ 2001
Free State Province ‐ 2011
Formal 66.5 81.1 Informal 26.1 15.7 Traditional 7.2 2.4 Other 0.3 0.9
The above figures show an increase in the portion of households living in the formal dwellings and a decrease in the number of informal dwellings. The 2011 Census estimates that there are 129 260 informal housing units and 29 639 traditional dwellings and backyard houses in the province. During the 2010/2011 financial year, the provincial human settlement departments were able to deliver a total number of 43 260 serviced sites in the country in terms of the Informal Settlements Programme. For the Free State, only 4 812 of the 10 330 low‐cost housing units planned for the 2010/2011 financial year have been completed, with the Free State’s housing backlog now (2012) estimated above 200 000 dwelling units. The FSGDS (2012) envisions an informal settlement backlog of 0% by 2030. In 2010 it was estimated to be at 23.4%. Table B12: Households living in formal and informal dwellings in South Africa (Source: Stats SA,
2011). PROVINCES FORMAL DWELLINGS INFORMAL DWELLINGS
Eastern Cape 63.2% 7.7% Free State 81.1% 15.7% Gauteng 79.8% 18.9% KwaZulu‐Natal 71.6% 8.3% Limpopo 89.8% 5.2% Mpumalanga 83.8% 10.9% North West 76.2% 21.2% Northern Cape 82.4% 13.1% Western Cape 80.4% 18.2% South Africa 77.6% 13.6% B10.2 SERVICE STANDARDS: SEWAGE REMOVAL Sewerage removal and sanitation are basic needs of communities which can pose serious health and hygiene risks for communities and the environment at large if not properly managed and monitored.
• Flat or apartment in a block of flats, cluster house in complex, townhouse, semi‐detached house/ flat/ room,
etc. 20 Informal dwellings:
• Informal dwelling/shack in back yard. • Informal dwelling/shack not in back yard.
21 Traditional dwellings: • Traditional dwelling/hut/structure made of traditional materials.
22 Other dwellings: • Caravan or tent.
Free State PSDF: Phase 2 Report February 2013
Department of the Premier & COGTA Department of Rural Development and Land Reform
38
Dennis Moss Partnership
Proper sanitation is essential for the dignity, health and well‐being of people (CPSI 2004)23. Proper sanitation extends beyond access to an acceptable toilet and the safe disposal of human waste, it includes practices that support good hygiene and a healthy living environment. Sanitation improvement is about more than just providing a toilet or sewage infrastructure. It has a major public and primary health component, and calls for close co‐ordination between technical, health and social development personnel. Sanitation straddles several sectors, including housing and settlement development, water services, water resource and environment management, primary and preventative health care, education, local economic development, and municipal finance. Proper toilets are necessary, but not sufficient, for managing human waste safely. Cholera, for example, can be spread through poor hygiene, even where there are good water and sanitation facilities. Diarrhoeal diseases spread through poor sanitation and hygiene kill more children under five than just about any other single cause. Worms, parasites and faecal‐oral diseases cause lasting damage to the growth and development of small children, and undermine the development potential of our country. Poor sanitation raises particular risks for people who are HIV positive as their immune systems are less resistant to infections and disease. Good sanitation is about putting barriers in place to prevent the transmission of disease‐causing organisms found in waste (CPSI, 2004). The right of access to a basic level of sanitation service is enshrined in the Constitution of South Africa Act 108 of 1996. The leading policy document in the water sector, the 2003 Strategic Framework for Water Services of the Department of Water Affairs and Forestry, approved by Cabinet in 2003, states that all South Africans are to have access to basic sanitation facilities by 2010. This target has more recently been superseded with the 2014 target for universal access to basic services (including sanitation). The programme of eradicating the bucket sanitation system has been a national priority in South Africa, since its affront to human dignity associated with it and the health risks involved, because these toilets basically comprise of insanitary buckets which are collected by the municipality or a contracted service provider on a regular basis. As from February 2005 roughly 60% of the entire national backlog of bucket toilets existed in the Free State, and over the past four years the overall Free State backlog of 150 415 households originally using the bucket toilet system has been reduced by 87% (roughly 130 811 households). As from April 2008 the official bucket backlog in the Free State was recorded to affect 19 604 households (SALGA, 2009). The district and local municipalities are primarily responsible for the delivery of bulk infrastructure, such as water services, sanitation, waste water treatment works, and reticulation systems and electrification. With the eradication of bucket systems various challenges arose such as to accelerate and enhance the capacity of sewerage treatment plants, extent sewerage infrastructure in rural areas and to make efficient use of the scare water resources. The population of the Free State which is mainly rural in nature, still experiences delays due to the lack of bulk infrastructure in their areas. A key assumption informing the review of the inter‐governmental fiscal system is that resource allocation of local government is not sufficient. In the Free State, approximately 89% of all households have access to a flush or chemical toilet. Fezile Dabi District has the highest number of households to have access to appropriate sanitation,
23 CPSI, 2004: Sanitation: Innovation Insights. www.cpsi.co.za

Free State PSDF: Phase 2 Report February 2013
Department of the Premier & COGTA Department of Rural Development and Land Reform
39
Dennis Moss Partnership
whilst Thabo Mofutsanyane District has the lowest at 48.9% and Mangaung Metropolitan Municipality has the second lowest number (60.7%) of households with proper sanitation services. Table B13: Household Access to appropriate sanitation per district, 2011 (Source: Stats SA,
2011).
AREA PERCENTAGE OF APPROPRIATE SANITATION
South Africa 90.6% Free State 89.9% Mangaung Metro 60.7% Xhariep 77.5% Lejweleputswa 75.5% Thabo Mofutsanyane 48.9% Fezile Dabi 78.2%
Table B14: Standard of sewage removal per district municipality (Source: Community Survey,
2007). SEWAGE REMOVAL
SANITATION AVAILABILITY PER HOUSEHOLD Flush
Toilet Dry Toilet Pit
Latrine Chemical Bucket None
Free State 60.5 1.5 22.0 7.6 12.7 3.2 Mangaung Metro 53.0 2.6 28.5 17.3 11.9 3.9 Xhariep 70.4 0.7 11.3 5.8 10.6 6.9 Lejweleputswa 69.0 0.4 7.7 1.3 20.0 2.8 Thabo Mofutsanyane
38.9 2.1 42.4 6.5 12.7 3.7
Fezile Dabi 84.7 0.8 8.7 3.3 4.4 1.3 Approximately 3.2% of all households in the Free State have no sewage removal facilities. Lejweleputswa has the highest number of households with the bucket system. Flush and chemical toilets have shown an increase from 45.4% to nearly 70% during the period of 1996 to 2009 . B10.3 SERVICE STANDARDS: WATER RETICULATION Water services delivery is performed by twenty Water Services Authorities in Free State via 76 drinking water supply systems. Bloem Water and Sedibeng Water Boards are the main Water Services Providers in the Free State. The latter abstracts, treats and supplies drinking water to municipal networks via a number of bulk water schemes. A small portion in the Northern Free State is supplied with water by Rand Water. A total design capacity of 219 water systems is available for drinking water supply in Free State Province. Operational data is not available for all systems, but the average operating capacity appears to be between 69% and 81%. This indicates an average output volume (final water) of 165 Ml/day (DWA, 2011).

Free State PSDF: Phase 2 Report February 2013
Department of the Premier & COGTA Department of Rural Development and Land Reform
40
Dennis Moss Partnership
The provincial Blue Drop Score24 stands at 64.01% which reflect an average quality and performance. On the national overview, the Free State’s Drinking Water Quality scored an average of 73.6%. The two top rating provinces are Gauteng rating 98.1% and the Western Cape rated 94.2%, Mpumalanga’s Drinking Water Quality rated the lowest of all nine provinces at 60.9%. (Blue Drop, 2012). Matjhabeng Local Municipality is the best performing municipality in the Free State Province with support from Sedibeng Water Board as their Service Provider. The Municipal Blue Drop Score of 94.72% was achieved (Blue Drop, 2012). According to the Community Census of 2007, approximately 97.3% of households have access to piped water within the Free State. The national average was 84.5% in 2001 and 88.6% in 2007. Table B15: Percentage of household access to piped water on district level, 2007 (Source:
Community Survey, 2007).
AREA PERCENTAGE OF PIPED WATER South Africa 81.3 Free State 97.3 Mangaung Metro 98.8 Xhariep 92.5 Lejweleputswa 97.4 Thabo Mofutsanyane 96.4 Fezile Dabi 97.1
Table B16: Standard of Water Reticulation (2001 and 2007) (Source: Community Survey, 2007).
WATER RETICULATION NUMBER OF PERCENTAGES OF HOUSEHOLDS WITH ACCESS TO RUNNING WATER
Free State Mangaung Metro
Thabo Mofutsanya
ne
Lejweleputswa
Xhariep Fezile Dabi
CENSUS 2001 Piped water
inside dwelling 22.8 24.4 17.2 22.0 24.3 29.3
Piped water inside yard
47.7 45.0 43.4 48.8 56.4 54.6
Public tap < 200 m
13.7 14.2 19.5 11.9 9.0 8.2
Public tap >200 m
11.4
12.2 13.6 12.9 7.1 6.1
TOTAL Piped water
95.7 95.8 93.8 95.6 96.7 98.1
COMMUNITY SURVEY 2007 Piped water
inside dwelling 46.2 46.5 36.1 54.8 48.5 46.4
Piped water inside yard
40.6 36.4 46.9 36.3 35.3 46.1
24 Assessments are conducted by a panel consisting of a qualified drinking water quality professional as Lead
Inspector, 2‐4 Inspectors (Assessors) and a Learner Assessor who also coordinates the logistical arrangements of the assessments. The team selection is done based on the outcomes of a Blue Drop Examination which tests the assessor’s knowledge and competence in the subject field. Virtual assessments were done in cases where municipalities uploaded their Portfolio of Evidence (or parts of) onto the Blue Drop System.

Free State PSDF: Phase 2 Report February 2013
Department of the Premier & COGTA Department of Rural Development and Land Reform
41
Dennis Moss Partnership
Piped water form point
outside the yard
10.5 16.0 13.3 6.3 8.6 4.7
TOTAL Piped water
97.3 98.8 96.4 97.4 92.5 97.1
B10.4 SERVICE STANDARDS: TELECOMMUNICATIONS Telkom’s strategy over the past few years has been to focus on its delivery only in the ‘high growth residential areas’. It could be argued that until the capital costs of establishing fixed‐line infrastructure were reduced, the province will continue to suffer from poor access to fixed lines and the local population will continue to rely on cell phone providers for communication (refer to Table B17). Table B17: Household goods and services (Source: Stats SA Census, 2011).
HOUSEHOLD GOODS AND SERVICES Access to Cell phone Access to Land‐line Access to Internet Free State 732 317 82 434 823 316 South Africa 12 850 874 2 088 147 14 450 161 B10.5 SERVICE STANDARDS: REFUSE REMOVAL Refuse removal and management are of the most critical issues in municipal service delivery and can have seriously adverse implications for the environment if refuse were not collected and disposed of properly. It entails the collection of household and industrial refuse and the management thereof to such a standard that no negative environmental influences occur. Legislation, defining refuse types, e.g. hazardous and non‐hazardous, and their management, the selection criteria for establishing waste disposal erven, site registration, etc., needs to be strictly adhered to. Refuse not disposed of at a recognised (registered) waste disposal site is considered illegal dumping. According to the 2011 Census, approximately 62.1% of households in South Africa have refuse removed by a local authority or private company. In 2007, the Free State refuse removal average was 14.4% higher than the National average of 61.6%. Thabo Mofutsanyane currently has the lowest level of refuse removal in the province (49.2%) with Fezile Dabi being the best performer at 81.7% (refer to Table B18) (Stats SA, Census 2011). Table B18: Households by type of refuse disposal of district municipalities in the Free State (2001
and 2007) (Source: Community Survey, 2007).
DISTRICT MUNICIPALITIES
REMOVED BY LOCAL AUTHORITY/PRIVATE COMPANY
NO REFUSE DISPOSAL
CENSUS 2001 COMMUNITY SURVEY 2007
CENSUS 2001 COMMUNITY SURVEY 2007
Free State 61.7 76.0 9.5 5.2 Mangaung Metro 62.3 82.4 11.3 5.2 Xhariep 67.5 76.2 3.9 4.0 Lejweleputswa 72.0 82.8 6.8 2.5 Thabo Mofutsanyane
43.8 49.6 13.7 10.5
Fezile Dabi 70.5 90.4 6.2 2.5

Free State PSDF: Phase 2 Report February 2013
Department of the Premier & COGTA Department of Rural Development and Land Reform
42
Dennis Moss Partnership
B10.6 SERVICE STANDARDS: ELECTRICITY AND ENERGY Since 1994 there has been a significant increase in the provision of electricity to all the provinces of South Africa. The FSGDS (2012) indicates an increase in electricity usage from 57% to nearly 90% from 1994 to 2007. The 2011 Census reveals that 89.9% of all households in the Free State have access to electricity for lighting, higher than the national average of 84.7%. According to the 2001 Census and the 2007 Community Survey, Thabo Mofutsanyane has the lowest percentage of household access to electricity for the usage of lighting, cooking and heating and Fezile Dabi the highest (see Table B19). Table B19: Percentage of household using electricity for lighting, cooking and heating on district
level (Source: Community Survey, 2007). PERCENTAGE OF HOUSEHOLD USING ELECTRICITY FOR LIGHTING, COOKING AND HEATING
Municipalities Lighting Cooking Heating Census
2001 CS 2007 Census
2001CS 2007 CS 2007 CS 2007
Free State 74.4 86.6 47.0 75.2 40.5 54.6Mangaung Metro 84.0 87.2 58.0 78.4 51.7 56.0Xhariep 76.2 85.1 39.1 65.1 30.1 43.0Lejweleputswa 70.1 87.9 46.1 75.6 41.8 56.8Thabo Mofutsanyane 63.4 80.9 34.5 64.5 27.6 40.8Fezile Dabi 80.3 91.4 51.2 85.9 42.0 69.7 Figure B3 illustrates the percentage of energy usage in the Free State Province. It is evident that electricity is the dominant sources of energy usage for household lighting, cooking and heating followed by the usage of paraffin. (Community Survey, 2007)
0
10
20
30
40
50
60
70
80
90
100
Electricity Gas Paraffin Candles Wood Coal Animal dung Solar Other
Energy Source
Perc
enta
ge o
f Ene
rgy
Sour
ce
Lighting Cooking Heating
Figure B3: Use of energy sources in the Free State (Source: Community Survey, 2007)

Free State PSDF: Phase 2 Report February 2013
Department of the Premier & COGTA Department of Rural Development and Land Reform
43
Dennis Moss Partnership
B10.7 SERVICE STANDARDS: HEALTH The health sector of South Africa is most concerned with communicable, non‐communicable, prenatal and maternal, and injury‐related conditions. Additionally, the morbidity and mortality profiles of the Free State Province, as in South Africa, are dominated by HIV/AIDS. The HIV prevalence among the general population in the Free State at 19.5% is substantially higher than the countrywide average of 17.8%, and the third highest of the nine provinces (FSGDS, 2012). HIV/Aids leads to both persistent communicable diseases and increasing chronic diseases. In its enormity, HIV/AIDS eclipses all other health problems. The first four of the top six specific causes of death in the Free State are directly related to HIV. The top six specific causes of death in the Free State include pneumonia (unspecified), other ill‐defined and unspecified causes of morality, pulmonary TB, unspecified HIV disease, diarrhoea and gastroenteritis of presumed infection origin, and bronchopneumonia (unspecified) (FSGDS, 2012). There are 236 clinics, 13 community health care centres, 99 mobile services, 25 district hospitals, five regional hospitals, one central hospital, and three specialized hospitals in the Free State. This translates into 4868 public health facility beds, i.e. 2.1 public sector beds per 1000 population in the Free State, compared to 2.4 beds per 1000 population nationally. Additionally, stark spatial disparity is reflected across the Free State’s Districts (FSGDS, 2012). The shortage of skilled health professionals in the public health sector presents a serious challenge in the Free State, as it does nationally. Not only does it impact on the quality of the service, it also impacts negatively on the management of infrastructure and hospitals. Related concerns include the representivity of skilled personnel in relation to service needs based on the burden of disease, and the ability of the Free State to attract and retain scarce skills. When frozen/non‐financed posts are included in analysis as per Health Systems Trust data, the picture looks bleak. In the Free State (2010), 48.7% of professional health worker posts were vacant compared to 42.5% nationally. In the Free State Province there are particularly acute shortages of doctors (medical practitioners) and nurses. As per Health System Trust data, a high 42.5% of medical practitioner posts and even higher 47.4% of professional nurse posts were recorded as vacant in 2010. There were only 24.1 medical practitioners per 100 000 uninsured population in 2010 compared with 27.3 doctors per 100 000 uninsured population nationally (FSGDS, 2012). Table B20: The number of public facilities in the Free State (FSGDS, 2012).
NUMBER OF HEALTH FACILITIES AND BEDS
NUMBER OF PUBLIC SECTOR FACILITIES AND BEDS (2012)
Clinics 236 Community Health Centres 13 Mobile Services 99 District Hospital 25 Regional Hospital 5 Central Hospital 1 Specialised Hospital 3 Private hospitals 15 Total Public Health Facility Beds 4 868

Free State PSDF: Phase 2 Report February 2013
Department of the Premier & COGTA Department of Rural Development and Land Reform
44
Dennis Moss Partnership
B11 LAND REFORM The Constitution of South Africa 108 of 1996 sets out the legal basis to land reform, particularly in Section 25 of the Bill of Rights, which protects property rights from arbitrary interference but also places a clear responsibility on the state to carry out land and land‐related reforms and grants specific rights to victims of past discrimination. There are three pillars of land reform stipulated in the Constitution, namely (Kahn, 2007): • Land Redistribution: Seeks to provide the landless with productive land and residential
land. The government is providing grants to enable the poor to purchase land. According to the Chief Land Claims Commissioner, land redistribution seeks to provide land for ‘urban and rural very poor, labour tenants, farm workers as well as new entrants to agriculture’.
• Land Restitution: This seeks to return what has wrongfully been taken. This is being achieved through restitution of the land or financial compensation. Restitution covers forced removals, which took place after 1913.
• Land Tenure: Recognises communal land and also seeks to protect the rights of tenants on predominantly white‐owned farms.
According to OECD (2006) the key challenges in the land reform process in South Africa are to create stakeholder consensus around the implementation strategy and improve the procedures of land acquisition and resettlement. Land reform is a massive and complicated process, and the identification of realistic objectives and careful sequencing of activities are conditions for success. Land reform should lead to the emergence of viable farms (OECD 2006). However, a number of issues are prevalent in the current land reform process: a) Some of the beneficiaries of land reform have suffered defaults, being inadequately
prepared for commercial farming in a high risk environment, or are unable to raise sufficient capital for commercial production. Adjustment assistance therefore should be seen as an inherent component of land reform.
b) Proper selection and follow‐up beneficiaries is crucial for land reform to develop sustainable commercial farming.
c) Training and extension is essential, not only in farm technologies, but also in marketing and financial management. A large potential also rests with the mentoring by commercial farmers of new entrants. The appropriate support services need to be developed, including financial services, market information, input supply networks, transportation and storage infrastructure and extension.
d) While recognising the role of agricultural development in addressing poverty and inequalities, it is clear that the potential of agriculture and agricultural (i.e. land) reform itself to reduce poverty is limited. The long‐term solution to poverty reduction requires involving a greater part of the rural poor in economic activities generating sufficient income. The main potential to reduce rural poverty and inequity lies in the development of overall frameworks providing social security, education and training as well as health care, and in developing adequate infrastructures in rural areas.
Between 1994 and 2011, the South African government has transferred over 6.8 million ha of land to people dispossessed under apartheid. This represents 27% of the government’s target of transferring 24.5 million ha by 2014.

Free State PSDF: Phase 2 Report February 2013
Department of the Premier & COGTA Department of Rural Development and Land Reform
45
Dennis Moss Partnership
In March 2008, approximately 5.6% of agricultural land in the Free State has been transferred to Black South Africans through the land reform process (SOER 2009). The land reform process in the Free State thus far includes approximately 13 354 total number of beneficiaries and 216 309 total ha that were transferred. It should be noted that the majority of farms transferred were not performing at expected levels. However, it is also important to note that there are several successful land reform stories. To turn failing land reform projects into successful projects the Department of Rural Development and Land Reform has established the Recapitalisation and Development Programme (RECAP). RECAP is, however, not only focused on previous land reform projects, it is also an integral part of newly acquired and redistributed farms. This is to ensure that RECAP is proactive in the land reform process (Mohoebi, 2012). In the Free State province, RECAP has focused on 11 land reform projects. The Red Meat Pilot project initiated in the Free State was set up to ensure that the participation of land reform beneficiaries is not confined to farming, but is extended to the whole value chain, which includes red meat. In line with the RECAP approach the Department of Rural Development and Land Reform appointed Bloemfontein Abattoir to work with the farmers in the recapitialisation and development of these agricultural enterprises. The farms listed below have been put into a much better position to achieve their agricultural potential, fight hunger and unemployment and stimulate black participation in the rural economy (Mohoebi, 2012): (i) Valhope and Alma, Bethany. (ii) Wilgedraai and Smokkeldraai (in Xhariep district). (iii) Mieliespruit. (iv) Lower Maliki. (v) Kromspruit and Cecilia (Mangaung Mteropolitan Municipality). (vi) Zoopjiesfontein, Kromelboog and Roedeblom (Thabo Mofutsanyana District). B12 ECONOMIC PROFILE Historically, the Free State’s economic sector was essentially based on the agricultural and mining sector, contributing more than 50% to the Free State’s economy. In the period between 1997 and 2012, the Free State’s economy has experienced profound structural changes in the mining and agriculture sector. The overall decline in the agriculture and mining sector is an indication of a maturing economy and of the basic trends currently visible throughout all of South Africa’s provinces, namely growth in financial industries, expansion of technological and information‐based enterprises, increase of tourism industries, etc. This trend however holds many challenges for the Free State, such as: a) Increasing levels of unemployment in the primary sector. b) Economic growth has been occurring in knowledge‐based sectors (secondary and tertiary)
meaning the unemployed population in the primary sector finds it hard/or virtually impossible to find jobs.
c) Due an increasing secondary and tertiary sector, coupled with aspects of deregulation and improvements in general of infrastructure (i.e. transport), has placed enormous pressure on small towns which where historically linked to agricultural production and services.
d) The decrease of the economic viability of the agricultural and mining production has led to changing demographic patterns, especially pertaining to migration of people in the province. Unemployed population groups migrate from commercial farms and/or mining areas to the nearest urban areas and settlements. Furthermore, an increase has occurred

Free State PSDF: Phase 2 Report February 2013
Department of the Premier & COGTA Department of Rural Development and Land Reform
46
Dennis Moss Partnership
of the unemployed people in the Free State migrating to neighbouring provinces such as Gauteng and Mpumalanga.
The combined figure below illustrates the economic contribution of the various sectors to the Free State in 1996, 2003 and 2010.25 As indicated by the figure, the mining sector’s contribution to the province decreased from 16% to 9%, and agriculture’s economic contribution decreased from 5.3% in 1996 to below 4% in 2010. The finance sector is the only economic sector in the Free State that has shown a significant increase from 1996 to 2010, whilst the community services sector had a slight increase over the last 14 years. Furthermore, moderate increases, stagnant positions or a moderate decline were reported for manufacturing, construction, electricity and trade (FSGDS, 2012).
0
5
10
15
20
25
30
Agricu
lture
Mining
Manufac
turing
Electric
ity
Constru
ction
Trans
port
Trade
Finance
Community S
ervic
es
%
199620032010
Figure B4: Economic contribution of various economic sectors in the Free State.
The Free State’s contribution to the national economy in 2010 was estimated at approximately 5%, which is 3.8% lower than the contribution made in 1996. In fact, it is calculated that since 1996, the growth rates of the Free State’s different economic sectors had been below the national
25 Global Insight, 2011: Regional Explorer Database.

Free State PSDF: Phase 2 Report February 2013
Department of the Premier & COGTA Department of Rural Development and Land Reform
47
Dennis Moss Partnership
average26. The table below illustrates the growth rate trends per economic sector of South Africa and Free State respectively over the periods 1996‐2003, 2003‐2010, and 1996‐2010. Table B21: Growth rate trends per economic sector in South Africa and the Free State in the
periods 1996‐2003, 2003‐2010, and 1996‐2010.
Sector South Africa Free State
1996‐2003
2003‐2010
1996‐2010
1996‐2003
2003‐2010
1996‐2010
Agriculture 1.4 1.9 1.7 ‐2.0 1.7 ‐0.2 Mining 0.1 0.1 0.1 ‐0.3 ‐0.5 ‐1.8 Manufacturing 2.4 2.4 2.4 3.1 2.6 2.8 Electricity 0.0 2.6 1.3 ‐0.1 2.3 1.1 Construction 1.7 10.2 5.8 ‐1.5 7.1 2.7 Transport 3.0 3.7 3.4 1.3 2.5 1.9 Trade 5.8 4.9 5.4 3.9 3.5 3.7 Finance 4.2 6.3 5.2 2.8 5.4 4.1 Community Services 0.6 3.8 2.2 1.1 3.6 2.4
The growth rate in the tertiary sector in the Free State remains below the national average. However, the community service sector in the Free State exceeded the national growth rate for the period between 1996 and 2003 due to the expansion of governmental departments and growth in the public sector services (FSGDS, 2012). The increased growth rate of the manufacturing sector in the Free State is directly related to the expansion and growth of the petrochemical industry (i.e. manufacturing of petroleum, industrial chemicals, etc.) of Sasolburg located in the Metsimaholo Local Municipality. It is estimated that the petrochemical industry contributes more than 85% to the manufacturing sector in the Free State27. An increase in the construction sector is attributed to, among others, the infrastructure investments related to the Soccer World Cup in 2010 (FSGDS, 2012). The service sector in the Free State is predominantly concentrated in and around the Mangaung Metropolitan Municipality, whilst most of manufacturing sector is located in the Metsimaholo Municipality, and the mining sector is mostly concentrated around the Matjhabeng region (FSGDS, 2012). B12.1 AGRICULTURE AND AGRI‐PROCESSING Notwithstanding its steady economic decline over the recent past, agriculture dominates the Free State landscape, with agricultural land covering approximately 3.2 million ha, 90% of the province’s 129 825 km² land area. The agricultural sector is critical to the well‐being of the province, both as the provider of various foods and a major employer. Approximately 12% of the Free State’s working age sector is employed in the agricultural sector (Stats SA, 2011). The Free State is considered the bread‐basket of South Africa supplying significant portions of the country’s sorghum (53%), sunflowers (45%), wheat (37%), maize (34%), potatoes (40%), groundnuts (32%), dry beans (26%), wool (26%) and almost all of its cherries (90%). Red meat and 26 Global Insight, 2011: Regional Explorer Database. 27 Global Insight, 2011: Regional Explorer Database.
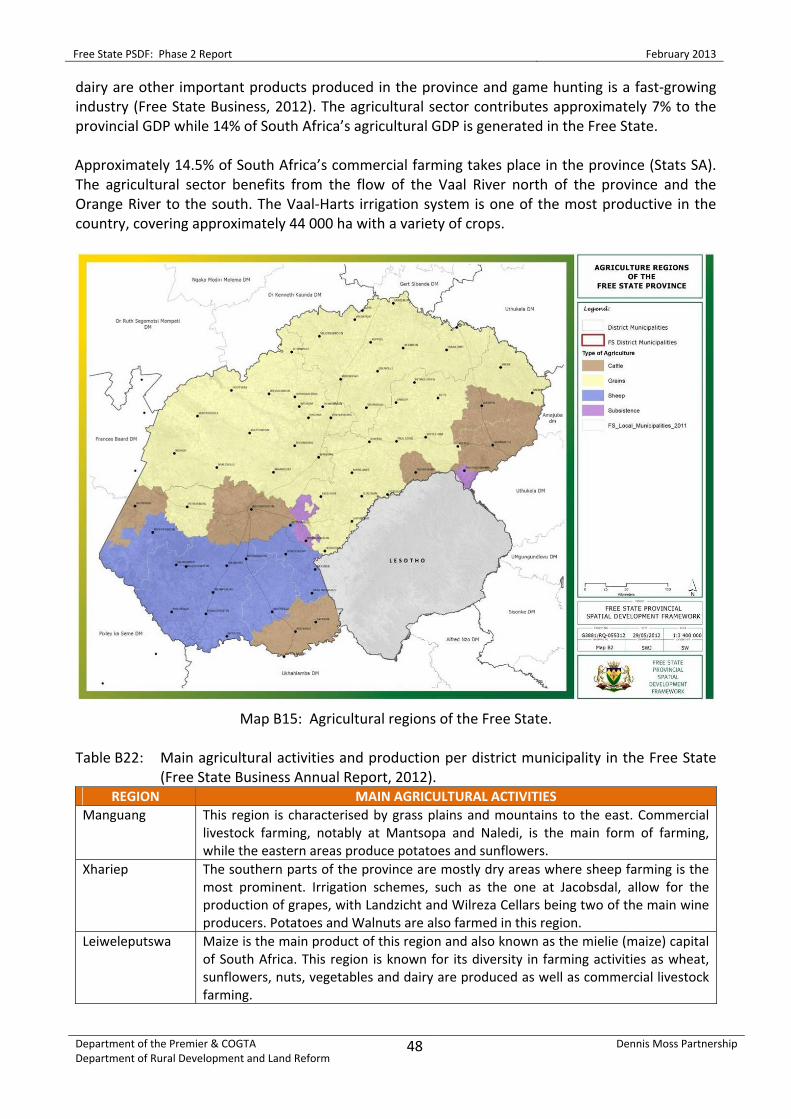
Free State PSDF: Phase 2 Report February 2013
Department of the Premier & COGTA Department of Rural Development and Land Reform
48
Dennis Moss Partnership
dairy are other important products produced in the province and game hunting is a fast‐growing industry (Free State Business, 2012). The agricultural sector contributes approximately 7% to the provincial GDP while 14% of South Africa’s agricultural GDP is generated in the Free State. Approximately 14.5% of South Africa’s commercial farming takes place in the province (Stats SA). The agricultural sector benefits from the flow of the Vaal River north of the province and the Orange River to the south. The Vaal‐Harts irrigation system is one of the most productive in the country, covering approximately 44 000 ha with a variety of crops.
Map B15: Agricultural regions of the Free State.
Table B22: Main agricultural activities and production per district municipality in the Free State
(Free State Business Annual Report, 2012). REGION MAIN AGRICULTURAL ACTIVITIES
Manguang This region is characterised by grass plains and mountains to the east. Commercial livestock farming, notably at Mantsopa and Naledi, is the main form of farming, while the eastern areas produce potatoes and sunflowers.
Xhariep The southern parts of the province are mostly dry areas where sheep farming is the most prominent. Irrigation schemes, such as the one at Jacobsdal, allow for the production of grapes, with Landzicht and Wilreza Cellars being two of the main wine producers. Potatoes and Walnuts are also farmed in this region.
Leiweleputswa Maize is the main product of this region and also known as the mielie (maize) capital of South Africa. This region is known for its diversity in farming activities as wheat, sunflowers, nuts, vegetables and dairy are produced as well as commercial livestock farming.

Free State PSDF: Phase 2 Report February 2013
Department of the Premier & COGTA Department of Rural Development and Land Reform
49
Dennis Moss Partnership
Thabo Mofutsanyane
Approximately 90% of South Africa’s cherries are produced in this region. Also to be found are two major asparagus factories where both white and green asparagus are produced. Soya, sorghum, sunflowers, potatoes, wheat and other important crops are also produced.
Fezile Dabi This northern region is at the heart of wheat and maize production in the province as the Vaal Dam provides extensive water supply throughout the region. Furthermore, sunflower, tobacco, sorghum, peanut and cattle are also farmed.
B12.2 MINING The Free State is rich in mineral resources. A gold reef of over 400 km long, known as Lejweleputswa (formerly the Goldfields), stretches across Gauteng and the Free State. The largest gold‐mining complex is the Free State Consolidated Goldfields, with a mining area of 32 918 ha. The province has twelve gold mines, operating from the towns of Welkom, Virginia and Odendaalsrus. Roughly 30% of the country’s gold is obtained from this region. Large and world‐renowned companies such as De Beers (diamonds), AngloGold Ashanti (gold mining) and Sasol (oil and chemicals) are found in the Free State.
Map B16: Distribution of mineral resources and mining operations in the Free State.
The mining sector in South Africa contributes 5% to its GDP and the Free State’s contributes 12.6% to its provincial GDP (Stats SA) respectively. Mining also represents a major employer in the province. Approximately 160 000 people are employed in the gold mining sector alone (this represents 32% of the mining sector).

Free State PSDF: Phase 2 Report February 2013
Department of the Premier & COGTA Department of Rural Development and Land Reform
50
Dennis Moss Partnership
Important minerals mined in the Free State include gold and its by‐products (uranium, silver, platinum, group metals and sulphuric acid), diamonds, coal and bentonite. Other important minerals such as sand, stone aggregate, gypsum, granite and limestone are found at various sites in the north‐western parts of the Free State. Salt production is also found north‐west of Bloemfontein around the Florisbad salt pan28. The diamond industry in the Free State ignited after the founding of Jagersfontein where the some of the first diamonds in South Africa was found. The Jagersfontein Mine was developed by De Beers in 1870’s and produced some of the world’s largest diamonds. The Excelsior, a 995.2 carat stone was the largest in the world for 12 years after it was found in 1893. Today Jagersfontein is the oldest and largest open mine in the South Africa and also a major tourism attraction29. Sasol was founded in 1950 in Sasolburg in the northern Free State where Bituminous Coal is mined and converted to petrochemicals such as oil, liquid fuels, fuel components, wax and Natural Gas (methane) is reformed into Synthesis Gas. Of South Africa’s 18 coalfields, two occur in the Free State, these being Vereeniging‐Sasolburg and Free State Coalfields. Anglo Coal runs the New Vaal Colliery Coal Field situated in the middle of the three industrial towns of Vereeniging, Sasolburg and Vanderbijlpark. Sasol contributes 5% to the National GDP30. Table B23 indicates the three main regions where mining activities are the dominant economic sectors. Table B23: Mining in the Free State (Free State Business Annual Report, 2012).
REGIONS MAIN TOWNS PRODUCTS Lejweleputswa District Municipality
Welkom Virginia Odendaalsrus
Primarily Gold Mining Also supplying considerable concentrations of silver and uranium.
Fezile Dabi District Municipality
Sasolburg Vanderbijlpark Vereeniging Kroonstad Koppies
Primarily Coal Mining Supplying the country’s largest deposits of Bentonite. The Bituminous Coal is further converted into Petrochemicals at Sasolburg. Diamond Mining Fezile Dabi is the leading Diamond Mining region in the province, operated by large companies such as Petra Diamonds, Lace Diamonds and De Beers.
Xhariep District Municipality
Jagersfontein Koffiefontein
Diamond Mining Jagersfontein is a world‐renowned site for producing some of the world’s largest diamonds.
B12.3 ENERGY SECTOR South Africa’s steady economic growth (as it increasingly focuses on industrialisation) has seen a steep increase in the demand for electricity. South Africa’s energy demand is expected to be twice the current levels by 2030. Together with Eskom, the National Department of Energy has
28 http://www.bullion.org.za/ ‐ Chamber of Mines South Africa – accessed 18 February 2013. 29 http://www.openafrica.org/participant/open‐mine‐jagersfontein ‐ accessed on 18 February 2013. 30 http://www.sasol.com/ ‐ SASOL ‐ accessed on 18 February 2013.

Free State PSDF: Phase 2 Report February 2013
Department of the Premier & COGTA Department of Rural Development and Land Reform
51
Dennis Moss Partnership
embarked on a massive programme to bring electricity supply and distribution system into balance31. Eskom is South Africa’s national electricity utility and generates approximately 95% of the country’s electricity supply. Eskom has a greater role to play than merely the supply of electricity – it generates, transmits and distributes electricity to industrial, mining, commercial, agricultural and residential customers and redistributors. Eskom with a generating capacity of 35 200 MW from 20 power stations is one of the largest utilities in the world. Power‐generation is primarily coal‐fired, but also includes a nuclear power station at Koeberg, Western Cape, two gas turbine facilities, tow conventional hydroelectric plants, and two hydroelectric pumped‐storage stations (Northern Cape PSDF, 2012). Eskom has undertaken to increase capacity to meet growing demands (Free State Business, 2012). South Africa has large coal reserves, which supply over 70% of its primary energy, large reserves of uranium, and small reserves of crude oil and natural gas (Winkler 2006)32. The country’s renewable energy reserves are smaller but nonetheless significant. Biomass is an important source of energy, both as firewood for poor households and to supply the sugar refining, pulp and paper industries. Conditions for solar and wind power are good to excellent in South Africa. Methane, natural gas, solar power and hydropower are all being used to generate the Free State’s newest power stations. In the Free State, the existing Lethabo power station (owned by Eskom) has a capacity of 3 708 MW. Eskom has rolled out several cleaner‐energy projects, such as the distribution of compact fluorescent lights and incentives for the installation of solar water geysers. Currently Eskom employs 2 467 people in the province, and will spend R2.5 billion in the Free State up to 2016 (Free State Business, 2013). The following projects are underway to increase the energy output of the province (Free State Business, 2012): a) Sasol is building a gas‐fired plant in Sasolburg. The 140 MW facility is to be built by Finnish
company, Wärtsiä and Sasol New Energy employees will receive training in how to run the plant (Free State Business, 2013).
b) Another company that will be generating some of its own power requirements is chemical manufacturer, Omnia. Its new nitric acid plant, built at a cost of R1.4 billion, will produce half the power the company needs, using excess steam given off by the manufacturing process.
c) Mining company, Gold Fields, is investigating the conversion of the methane gas produced in its mining processes to produce electricity. The company would not only be able to generate electricity, which would help reduce its input costs, but also earn an income from selling carbon credits on the international market.
d) Centlec is the electrical utility responsible for supplying services to several municipalities in central and Southern Free State. It is entirely owned by Mangaung Metropolitan Municipality and distributes electricity to 178 000 customers. Centlec owns a thermal power station but it is currently not operational and the utility is looking for a private company as a possible operator.
31 http://www.southafrica.info/business/economy/infrastructure/energy.htm#.UQfDex3qmyE – accessed on 20
January 2012. 32 Winkler, H., 2006: Energy policies for sustainable development in South Africa. Options for the future. Energy
Research Centre, UCT. Cape Town.

Free State PSDF: Phase 2 Report February 2013
Department of the Premier & COGTA Department of Rural Development and Land Reform
52
Dennis Moss Partnership
e) The ‘Go Green Go Clean’ campaign in 2010 was a well‐attended provincial waste summit, and speakers noted the vital need for all local municipalities to have proper waste management plans.
Free State Waste Summit (Go Green Go Clean), Bloemfontein, February 2010
The summit dealt with the poor state of waste service delivery by South African municipalities, and its concerns to the potential impacts on human health and the environment. At the summit issues such as recycling, energy use, landfill methane emissions, waste services delivery to households and businesses, etc. were discussed. The outcome of the summit was that municipalities and provincial governments must prepare sustainable Integrated Waste Management Plans. B12.3.1 RENEWABLE ENERGY The South African government has signed agreements with independent power producers that will see an initial 1 400 MW of renewable energy being added to South Africa’s energy grind. This will bring an estimated R47 billion in new investment into the country (SouthAfrica.info, 2012)33. These agreements refer to the following: a) Solar and wind renewable projects across some of South Africa’s most rural and least
development provinces, including the Eastern Cape, Northern Cape, Limpopo, North West, and the Free State.
b) Wind and solar projects are expected to be integrated into the country’s national energy grid during 2014.
c) Bidders and producers are obliged to support community development initiatives within a 50 km radius of each project. Bidders have collectively committed R2 billion towards socio‐economic development, and R1 billion towards empowering women in the energy field.
d) In total these bidders will spend R12 billion over the duration of the implementation agreements on South African contractors, including empowered enterprises, small and women‐owned businesses.
In the Free State renewable energy is a key focus area of the Free State Development Corporation, especially the solar energy sector (Free State Business, 2012). B12.3.1.1 Solar Energy Most areas in South Africa average more than 2 500 hours of sunshine per year, and the average solar‐radiation levels range between 4.5 and 6.5 kWh per m2 per day. The annual 24 hour global solar radiation average is approximately 220 W per m2 for South Africa, compared with approximately 150 W per m2 for parts of the USA, and approximately 100 W per m2 for Europe and the United Kingdom. This makes South Africa’s local solar resource one of the highest in the world (National Department of Energy34).
33 SouthAfrica.info, 2012: South Africa’s renewable energy shift: 6 November 2012
http://www.southafrica.info/business/economy/infrastructure/energy‐061112.htm#.UQomGR3qmyE – accessed on 20 January 2013.
34 http://www.energy.gov.za/files/esources/renewables/r_solar.html ‐ accessed on 20 January 2013.
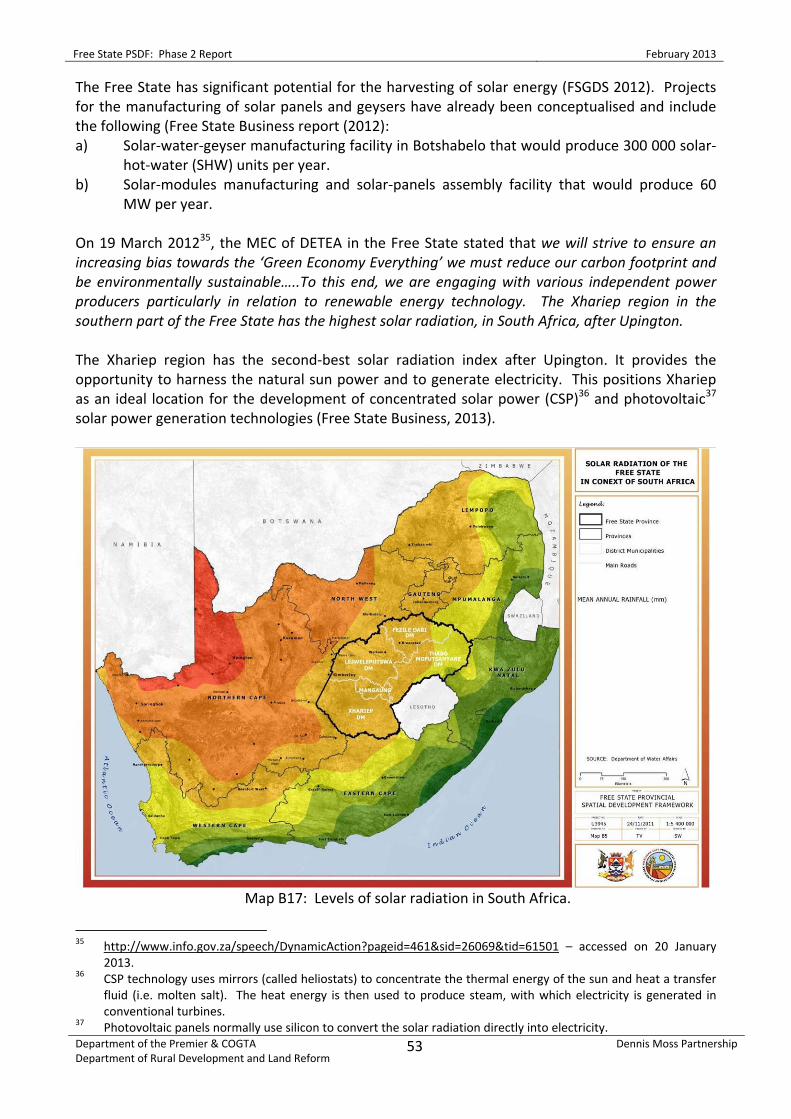
Free State PSDF: Phase 2 Report February 2013
Department of the Premier & COGTA Department of Rural Development and Land Reform
53
Dennis Moss Partnership
The Free State has significant potential for the harvesting of solar energy (FSGDS 2012). Projects for the manufacturing of solar panels and geysers have already been conceptualised and include the following (Free State Business report (2012): a) Solar‐water‐geyser manufacturing facility in Botshabelo that would produce 300 000 solar‐
hot‐water (SHW) units per year. b) Solar‐modules manufacturing and solar‐panels assembly facility that would produce 60
MW per year. On 19 March 201235, the MEC of DETEA in the Free State stated that we will strive to ensure an increasing bias towards the ‘Green Economy Everything’ we must reduce our carbon footprint and be environmentally sustainable…..To this end, we are engaging with various independent power producers particularly in relation to renewable energy technology. The Xhariep region in the southern part of the Free State has the highest solar radiation, in South Africa, after Upington. The Xhariep region has the second‐best solar radiation index after Upington. It provides the opportunity to harness the natural sun power and to generate electricity. This positions Xhariep as an ideal location for the development of concentrated solar power (CSP)36 and photovoltaic37 solar power generation technologies (Free State Business, 2013).
Map B17: Levels of solar radiation in South Africa.
35 http://www.info.gov.za/speech/DynamicAction?pageid=461&sid=26069&tid=61501 – accessed on 20 January
2013. 36 CSP technology uses mirrors (called heliostats) to concentrate the thermal energy of the sun and heat a transfer
fluid (i.e. molten salt). The heat energy is then used to produce steam, with which electricity is generated in conventional turbines.
37 Photovoltaic panels normally use silicon to convert the solar radiation directly into electricity.

Free State PSDF: Phase 2 Report February 2013
Department of the Premier & COGTA Department of Rural Development and Land Reform
54
Dennis Moss Partnership
The Free State Development Corporation is currently developing a 250 MW solar park in the Xhariep district, and is looking for investors to partner with them in the establishment of a solar park, and in the manufacturing and assembly of solar panels, solar‐water geysers and the establishment of solar‐energy‐generation plants (Free State Business, 2013). In early 2013, the first phase of construction has started with the 28 renewable energy projects across the country which includes solar and wind farms or parks. The R2.5 billion‐Letsatsi solar park is one these renewable projects and covers an area of 150 ha. Located just north of Bloemfontein, it will generate approximately 64 MW and will create approximately 50 permanent jobs and 300 construction jobs (Williams, 2013)38. The Letsatsi project consists of a consortium of international and national private firms (i.e. Solarreserve, Kensani Capital, and Intikor Energy) in partnership with Eskom and the Department of Energy. In addition to the above‐mentioned Letsatsi solar park, other solar park projects have also been proposed, as is apparent in the Environmental Impact Assessments (EIAs) undertaken by the CSIR Environmental Management Services (2012)39. This seems to suggest that the Free State is becoming a sought‐after region for solar park projects. B12.3.1.2 Hydro Power Hydro‐electricity is generated by the two hydropower stations on the Gariep and Vanderkloof Dams which have a capacity 360 MW and 240 MW, respectively, and are used during periods of peak demand. Other hydro‐power projects in the Free State include (Free State Business, 2012 and 2013): a) The Ingula pumped‐storage scheme (whereby water is pumped to reservoirs and then
released) is complete, with another 1 368 MW unit that will become available in near future. This is an Eskom project on the provincial border with KwaZulu‐Natal, and will cost approximately R16 billion. The first phase is due to come on stream in 2014.
b) A new private project at the Sol Plaatje Dam started delivering hydro power in late 2009, with NuPlanet (i.e. leading producer and developer of hydro power in South Africa) supplying electricity to the Dihlabeng Local Municipality. The project’s first 3 MW plant (i.e. Sol Plaatjie Power Station) is near Bethlehem while the second, 4 MW plant (i.e. Merino Power Station), is being built between that town and Clarens. The carbon credits derived from this project, with an estimated 33 000 tonnes per year of carbon dioxide being curbed, would be sold to Norwegian State‐owned electricity company, Stalkraft AS40.
c) Furthermore, NuPlanet has identified several sites along the As and Liebenbergsvlei Rivers for possible future sites – these sites utilise the outflow of the Lesotho Highlands Water Project.
B12.3.1.3 Wind Power The wind power industry in South Africa is poised to take off and move towards a period of rapid growth, which may make the country one of the most vibrant wind development areas on the
38 Williams, F., 2013: Groenkragprojekte: Sonplase skop landwyd af. Die Burger. 7 February 2013. 39 CSIR EMS, 2012: Experience in the wind and solar energy sector: October 2012.
http://www.csir.co.za/ems/docs/EMS%20A4%20Wind%20&%20Solar%20Energy_Nov2012_HIGH%20RES.pdf 40 http://www.tradeinvestsa.co.za/news/319706.htm ‐ accessed on 21 January 2013.

Free State PSDF: Phase 2 Report February 2013
Department of the Premier & COGTA Department of Rural Development and Land Reform
55
Dennis Moss Partnership
globe (IRENA 2012)41. The Wind Atlas of South Africa (WASA), an initiative of the National Department of Energy, was one of the key outputs of the South African Wind Energy Programme (SAWEP), and the first numerically verified wind atlas of South Africa. Phase II of WASA will cover approximately 80% of the country in order to verify its wind resources, which will include the Free State. This will create a broader spread for industrial development in wind energy in the different wind regimes across provinces in South Africa in order to have more informed data of which areas are more suitable for wind farms. When WASA has finished its wind research in the Free State, a better understanding of the feasibility of the establishment of wind farms in the province would be available. According to Van Rijswijck (2011)42 the majority of South Africa’s wind and solar energy initiatives will be in the Northern Cape, Eastern Cape and Western Cape. Moodley (2012)43 agrees and cites renewable energy consultant, Jo Reeves, that concludes South Africa’s weather offers an attractive foundation for producing a significant amount of wind energy, with Western Cape and Eastern Cape having particularly impressive wind speeds that surpass those of most European countries.’ It is proposed that more research should be done pertaining to the establishment of wind farms in the Free State, and if it is feasible or not to harbour this type of renewable energy resource. Although wind energy projects are relatively new in the Free State, a wind energy facility with 74 wind turbines is proposed at Springfield, 150km south of Bloemfontein (Heydenrych, 2012)44. Currently the Springfield Wind Energy facility is under‐going a comprehensive EIA process to conduct its feasibility in the area. B12.4 TOURISM The tourism sector is an important source of employment nationally, accounting for approximately 7% of jobs in South Africa. The National Department of Tourism plans to increase the sector’s contribution to the national economy to R338 billion by 2015, of which R125 billion will be direct (Free State Business, 2012). According to South African Yearbook (2012)45 ‘tourism is regarded as a modern‐day engine of growth and is one of the largest industries globally. In 2012, the G20 leaders of state recognised tourism as a driver of growth and development, as well as a sector that has the potential to boost global economic recovery. South Africa plans to grow tourism by allowing travellers and visitors to move more freely and efficiently. Measures would include e‐visas, regional visa schemes, and visa waiver programmes between key source markets. The National Tourism Sector Strategy, launched in 2011, aims to ensure the sector realises its full potential in terms potential in terms of job creation, social inclusion, services exports and foreign exchange earnings, fostering a better understanding between peoples and cultures, and green transformation.
41 International Renewable Energy Agency (Irena), 2012: Case study 2013: Wind Atlas for South Africa. DoE,
UNDP, GEF, WASA and Embassy of Denmark. 42 Van Rijswijck, E., 2011: South Africa’s future renewable energy mecca. 22 December 2011.
http://www.mediaclubsouthafrica.com/index.php?option=com_content&view=article&id=2714:renewable‐energy&catid= ‐ accessed on 21 January 2013.
43 Moodley, S., 2012. South Africa has attractive foundation for wind energy. http://www.engineeringnews.co.za/article/sa‐has‐attractive‐foundation‐for‐wind‐energy‐2012‐10‐05
44 Heydenrych, R., 2012: Proposed Mainstream Springfontein Wind Energy Facility, Free State Province. Visual Impact Assessment Report – EIA Phase. Prepared by Aurecon.
45 South African Yearbook, 2012: South Africa’s tourism industry. www.southafrica.info ‐ 7 December 2012.

Free State PSDF: Phase 2 Report February 2013
Department of the Premier & COGTA Department of Rural Development and Land Reform
56
Dennis Moss Partnership
The Tourism Enterprise Partnership (TEP) (2008) states that the Free State, although third largest in terms of area, is one of South Africa’s smaller tourism provinces. According to the Free State Development Corporation46, it is estimated that the tourism sector contributes approximately 3% to the province’s economy representing approximately 5% of South Africa’s tourism market. In 2010, the hotels and restaurants subsector of tourism contributed 0.4% to the provincial economy. Between 1996 and 2010, the tourism sector grew by 1.2% per annum and approximately 65 000 people were employed in the hotels and restaurants sub‐sector in 201047. The following figures reflect the tourism industry in the Free State (Tourism Talk 2009)48: a) During 2008 approximately a million foreign tourists visited the Free State, a decline of
12.6% compared to 2007. The annual compound growth rate of foreign tourists to the Free State was 12.1% between 2004 and 2008. The province’s share of foreign visitors to South Africa increased from 10.1% in 2004 to 11.1% in 2008.
b) The African and Middle East market accounted for 93.9% of foreign tourists to the Free State during 2008. This source market was dominated by short‐stay visitors from neighbouring Lesotho, who accounted for 90.5% of the foreign tourists to the province.
c) Of the 32.9 million domestic trips taken within South Africa during 2008, 1.5 million were to the Free State. During 2008, the Free State was the destination for 0.7 million (31.8%) fewer trips than in 2007, and the province’s share of domestic trips declined from 6.1% to 4.6%.
d) The total foreign direct spending excluding capital expenditure in South Africa during 2008 was R74.2 billion, of which R4.8 billion was spent in the Free State. This is 60% higher in nominal terms (48.5% in real terms) than the R3 billion spent in the province during 2007. The Free State experienced an annual compound growth rate in foreign spending of 44.5% in nominal terms (37.8% in real terms) between 2004 and 2008. Of the R25.8 billion spent by domestic tourists in South Africa during 2008, R1.4 billion was spent in the Free State. This amounted to R0.4 billion (40% in nominal terms or 28.5% in real terms) more than was spent in the province during 2007. The Free State’s share of the total spent by domestic tourists in South Africa increased from 5% in 2007 to 5.4% in 2008.
The Free State Province aims to grow its tourism sector to turn what has been called a ‘hidden treasure of South Africa’ into a popular and repeat destination for thousands of domestic and international tourists. The province certainly has the assets that make this goal achievable. B12.4.1 PROMOTION AND DEVELOPMENT OF TOURISM The Free State tourism market is mainly a domestic market with an emphasis on business tourism and weekend tourism. A much more concerted effort is required at local municipal level to plan and prioritise tourism possibilities. In addition to long‐term strategies, the Free State’s share of tourism a number of strategic interventions are required. A much more concerted effort is required at local municipal level to plan and prioritise tourism possibilities. In addition to long‐term strategies the Free State Provincial Government will facilitate improved marketing, improved marketing, improved product development (outside the domain of accommodation establishments) and the development of a tourism establishment database (FSGDS 2012).
46 http://www.fdc.co.za/ 47 http://www.freestateonline.fs.gov.za/?page_id=992 – accessed on 9 January 2013. 48 Tourism Talk, 2009: Tourism in the Free State: www.tourismtalk.co.za/2009/10/tourism‐in‐the‐free‐state/

Free State PSDF: Phase 2 Report February 2013
Department of the Premier & COGTA Department of Rural Development and Land Reform
57
Dennis Moss Partnership
The following constraints of the Free State Tourism Master Plan 2010/11‐2014/15 have been identified (Naidoo (2012)49. These should be addressed by the Free State Tourism Authority. • Poor communication between the provincial, district and local government tourism
structures. • Poor communication between the public and private sectors. • Under‐utilisation of existing provincial nature reserves and resorts. • Regulatory frameworks that impede tourism investment, e.g. rezoning. • Insufficient technical tourism resources within government structures. • Inadequate pooling of public and private sector financial resources. • Strengthened marketing of the rich provincial tourism asset and service offerings. The following priority interventions are needed in the tourism sector (Free State Tourism Master Plan 2010/11‐2014/15): a) Free State Brand and Branding Strategy:
(i) Develop an overall brand and branding strategy for the Free State. (ii) Develop brands for the district municipalities.
b) Development of an Annual Events Strategy: (i) Improve the scheduling of events to manage the pressure on accommodation.
c) Tourism Product Development: (i) Upgrade and maintain the provincial parks and resorts. (ii) Improve the quality standards and market these parks and resorts.
d) International Convention Centre (ICC) Development: (i) Assess the feasibility of an ICC to leverage the provinces business tourism potential.
e) Develop Tourism Spatial Priority Areas: (i) Develop the tourism potential of spatial priority areas.
f) Address Regulatory Constraints: (i) Address the rezoning systems and procedures and capacity to address these.
g) Infrastructure Development: (i) Address tourism signage needs in the spatial priority areas. (ii) Upgrade and maintain the provincial resorts, including road access.
h) Institutional Development: (i) Obtain technical assistance to address Human Resource constraints to public‐
private partnerships. (ii) Conduct tourism‐awareness training.
B12.4.2 THE FREE STATE AS AN ECO‐TOURISM DESTINATION The International Ecotourism Society (2012)50 defines ecotourism as ‘responsible travel to natural areas that conserves the environment and improves the well‐being of local people’. Furthermore, ‘ecotourism is about uniting conservation, communities and sustainable travel’. This means that those who implement and participate in ecotourism activities should follow the following ecotourism principles: a) Minimise impact. b) Build environmental and cultural awareness and respect. c) Provide positive experiences for both visitor and hosts.
49 Naidoo, M., 2012: Position Paper: Opportunities and Constraints for development of the tourism sector in
Mangaung and Matjhabeng Municipalities. DETEA and ILO. 50 http://www.ecotourism.org/what‐is‐ecotourism ‐ accessed on 22 January 2012.

Free State PSDF: Phase 2 Report February 2013
Department of the Premier & COGTA Department of Rural Development and Land Reform
58
Dennis Moss Partnership
d) Provide direct financial benefits for conservation. e) Provide financial benefits and empowerment for local people. f) Raise sensitivity to host countries’ political, environmental, and social climate. Three key aspects are important of ecotourism which should be promoted in the Free State Province: • Conservation: Offering market‐linked long‐term solutions, ecotourism provides effective
economic incentives for conserving and enhancing bio‐cultural diversity and helps protect the natural and cultural heritage of the Free State.
• Communities: By increasing local capacity building and employment opportunities, ecotourism is an effective vehicle for empowering local communities around the Free State to fight against poverty and to achieve sustainable development.
• Interpretation: With emphasis in enriching personal experiences and environmental awareness through interpretation, ecotourism promotes greater understanding and appreciation for nature, local society and culture.
B12.4.3 TOURISM ATTRACTIONS AND OPPORTUNITIES (UNIQUE SELLING POINTS) A broad spectrum of tourist and opportunities (unique selling points) occur. These include (Erasmus, 2004 & Free State Business, 2012): a) Bothaville is the head office to Grain South Africa and in the heart of the ‘Maize Triangle’.
The NAMPO Harvest Festival held every year in May at Bothaville is one of the biggest agricultural festivals in the world. Bothaville also plays the annual host to the Bakkiedag Musiekfees in February, and the popular Pioneer Voedsel and Witblits Festival in October.
b) Botshabelo Creation Co‐op in Botshabelo manufactures materials and articles such as traditional African dresses, weaving, silk painting and beadwork.
c) Eden Health Oil, Allanridge: This family‐run factory is one of the few in South Africa that produces virgin sunflower oils (rich in antioxidants and Vitamin E) using a technique that prevents the oil from warming up and losing its potency. Numerous Eden Health Oil Cosmetic creams and treatment oils are manufactured here and exported to other areas in South Africa.
d) Fauresmith is the second oldest town in the Free State and hosts the International Horse Endurance Race every year in July. The race covers a distance of 205 km and runs over three days.
e) Hunting is a popular tourist attraction at farms such as Driehoek, Excelsior, Hanover, Hartenbos and Holfontein near Bultfontein. Other hunting areas with packaged tours are located at Hertzogville, Wesselsbron, areas around Thaba ‘Nchu, Frankfort, Heilbron etc.
f) Koffiefontein is home to unique art works and murals painted by Italian prisoners of war of the Second World War.
g) Mine tours are offered at Virginia and Welkom which showcase some of the deepest and richest mines in the world.
h) National Hot Air Balloon Championships are annually hosted at Bethlehem. i) Thabo Mfutsanyana Region in the Eastern Free State offers mystical places for ecotourism
activities, and have numerous San rock art locations, fossils, Sotho remains, etc. j) The annual National Gliding Championships are hosted at the Gariep Dam Airfield. k) The Free State National Botanical Garden, in Bloemfontein spans over 70 ha and is home to
approximately 400 species of plants mainly from the Free State, Northern Cape and

Free State PSDF: Phase 2 Report February 2013
Department of the Premier & COGTA Department of Rural Development and Land Reform
59
Dennis Moss Partnership
Lesotho. Furthermore, approximately 124 species of birds and 54 species of reptiles inhabit the garden.
l) The Golden Gate Highlands National Park and approximately 80 provincial, municipal and privately owned nature parks, nature reserves, game reserves, game farms, etc.
m) The Hobhouse, Tweespruit, and Ficksburg (includes to provincial polo fields) districts are popular areas for polo. Harrismith is the so‐called ‘horse country’ of the Free State and annually hosts various polo tournaments. Lindley is home to the Sparta Polo Club which is renowned for its excellent fields and facilities.
n) The Northern Free State with its large water bodies is a prime destination for adventure activities such as white‐water rafting, canoeing, boating and angling.
o) The town of Clarens, known locally as ‘the jewel of the Free State’ is renowned for its location at the foothills of the sandstone Red Mountains and surrounding Maluti Mountains.
p) Vredefort Dome offers hiking, rock climbing, bird‐watching, horse‐riding etc. q) Well‐known hiking and mountaineering trails have been developed in Wepener, Caledon
Nature Reserve, Tweespruit, Ladybrand, Ventersburg, Virginia (i.e. Hammerkop and Paradise Flycather Trails), Maria Moroka National Park, Heilbron. The five‐day, 65 km Brandwater Hiking Trail close to Fouriesburg is very well‐known for its scenery and is regarded as a tough hiking trail.
B12.4.4 DESIGNATED TOURIST ROUTES The Free State Tourism Authority has identified a number of key tourist routes in the province which not only offer cultural, recreational and heritage opportunities but are aligned with important development nodes. Map B18 illustrates the spatial context of the corridors listed below. a) Active N8 Route: This Route links Bloemfontein and Lesotho, passing Ladybrand, Thaba
Nchu, and Botshabelo. From Bloemfontein westwards the N8 leads via Petrusburg to Kimberley. This route is also an alternative route for travellers from KwaZulu‐Natal to the Eastern Cape and Cape Town via Bloemfontein.
b) Battlefields Route: The central location of the Free State was a major theatre of war during the Anglo‐Boer War. There are 13 battlefield sites, two war museums, and three concentration camp and war cemeteries.
c) Bloemfontein, Botshabelo and Thaba ‘Nchu Heritage Route: This route takes visitors to all three areas and offers a variety of landscapes, Basotho traditions and other activities.
d) Friendly N6 Route: This route takes travellers through the scenic Southern Free State and towns such as Smithfield and Rouxville, and on into the Eastern Cape Province. It passes through open countryside where sheep, cattle and goats graze, Anglo‐Boer War battlefields and off‐the‐beaten track villages and towns.
e) Maluti Route: This route traverses the Maluti Mountains into Lesotho and includes dramatic scenery on the R26.
f) Mangaung Cultural Route: This initiative uses the experience of local guides in taking visitors through areas near the city of Bloemfontein. A planed eco‐park in the Mangaung area, for which the DETEA is budgeting R250 million, will include a cultural village in the second phase of development. The cultural village of Mautse is to be revitalised to allow for informal trading in arts and crafts by local artists.
g) Goldfield Route: This route passes through the Lejweleputswa Region and explores the fascinating history of gold mines in the region. It includes towns such as Virginia, Welkom, Allanridge, Odendaalrus, etc.
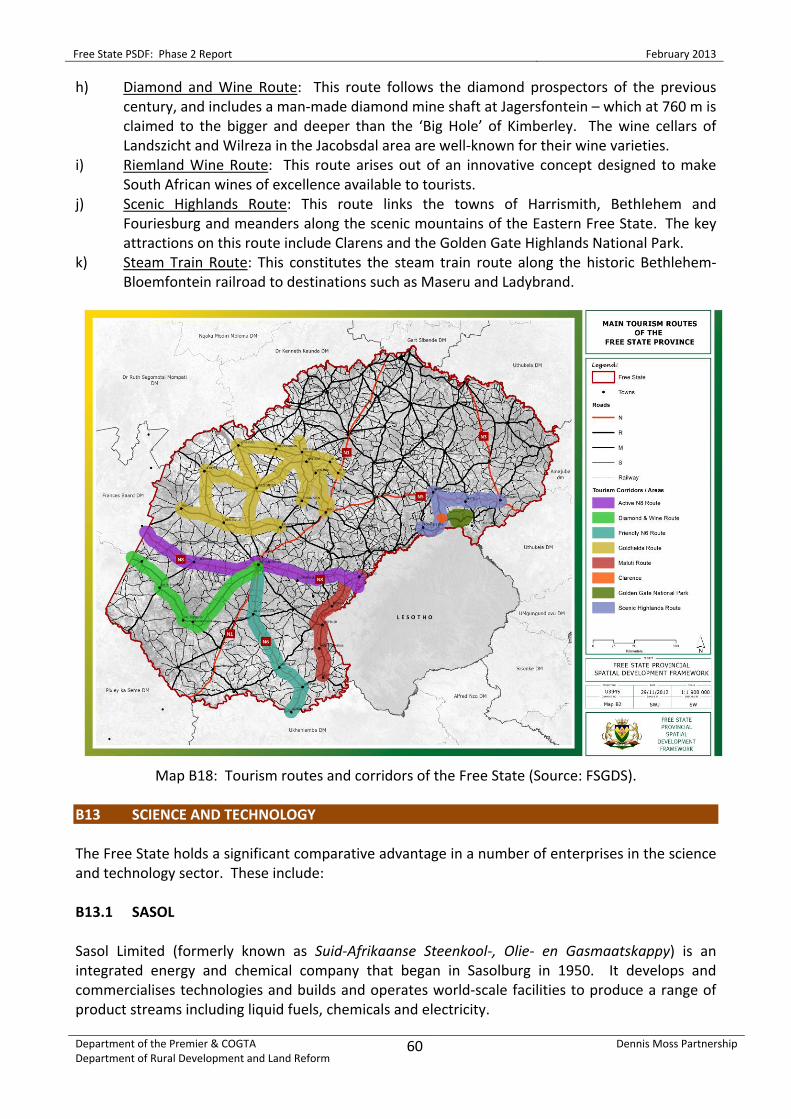
Free State PSDF: Phase 2 Report February 2013
Department of the Premier & COGTA Department of Rural Development and Land Reform
60
Dennis Moss Partnership
h) Diamond and Wine Route: This route follows the diamond prospectors of the previous century, and includes a man‐made diamond mine shaft at Jagersfontein – which at 760 m is claimed to the bigger and deeper than the ‘Big Hole’ of Kimberley. The wine cellars of Landszicht and Wilreza in the Jacobsdal area are well‐known for their wine varieties.
i) Riemland Wine Route: This route arises out of an innovative concept designed to make South African wines of excellence available to tourists.
j) Scenic Highlands Route: This route links the towns of Harrismith, Bethlehem and Fouriesburg and meanders along the scenic mountains of the Eastern Free State. The key attractions on this route include Clarens and the Golden Gate Highlands National Park.
k) Steam Train Route: This constitutes the steam train route along the historic Bethlehem‐Bloemfontein railroad to destinations such as Maseru and Ladybrand.
Map B18: Tourism routes and corridors of the Free State (Source: FSGDS).
B13 SCIENCE AND TECHNOLOGY The Free State holds a significant comparative advantage in a number of enterprises in the science and technology sector. These include: B13.1 SASOL Sasol Limited (formerly known as Suid‐Afrikaanse Steenkool‐, Olie‐ en Gasmaatskappy) is an integrated energy and chemical company that began in Sasolburg in 1950. It develops and commercialises technologies and builds and operates world‐scale facilities to produce a range of product streams including liquid fuels, chemicals and electricity.
Free State PSDF: Phase 2 Report February 2013
Department of the Premier & COGTA Department of Rural Development and Land Reform
61
Dennis Moss Partnership
Sasol One, the Sasolburg plant in Free State produces chemicals while Sasol’s two other plants in Mpumalanga make fuel. Sasol as a whole contributes 5% to the national GDP and approximately 60% of earnings are derived from exports although volumes steeply in 2008 and the first half of 2009. It is important to note, that Sasol through Sasol Chemical Industries and Sasol Polymers, plays a dominant role in terms of the Free State economy, responsible for 42% if the total manufacturing output in the country (Free State Business, 2012). The Sasol Group is a world leader in petro‐chemical productions, now has operations around the globe in South Africa, Europe, Asia and the Americas, it is listed on the JSE Limited in South Africa, and on the New York Stock Exchange. The Sasol Group has a number of international and national business units and specialised units in Sasolburg, namely (Free State Business, 2012): a) Sasol Nitro: Produces ammonia, nitric acid, industrial explosives, and fertilisers. b) Sasol Polymers: Produces ethylene, propylene, polypropylene and hydrochloric acid. c) Sasol Solvents: Produces alcohols, acrylic acid, ethyl acetate, and mining chemicals. d) Sasol Olefins and Surfactants (SO&S): Produces paraffins, olefins, zeolites and
oleochemicals. e) Sasol Technology: Manages Sasol’s research and development, technology, management
and innovation, engineering services and project management portfolios. f) Sasol Wax: It is a world‐leading supplier of hard and medium waxes, petroleum jellies and
liquid paraffins. g) Sasol Infrachem: Provides a services platform for reforming natural gas and providing
utilities, infrastructure and site support at Sasol’s Sasolburg complex. It is responsible for the Sasolburg site‐governance and provincial reputation management in the Free State.
Sasol is involved in a number of initiatives and programmes that boosts the economy of the Free State and South Africa, such as: (i) In November 2012, a new R150 million state‐of‐art Research and Technology (R&D) facility
was unveiled to boost research and technology in the Free State and in South Africa51. This new facility includes 14 laboratories, a number of piloting facilities, and houses approximately 150 PhD graduates, close to 100 engineers, over 200 scientists and over 100 chemists and technologists. Sasol’s current combined capital and operational expenditure for Sasol Technology R&D function is over R1 billion a year, of which over 90% is invested in South Africa. Sasol Technology is currently executing further capital projects having a value of more than R450 million, to support its development activities.
(ii) As the largest industrial operation in Sasolburg, Sasol makes a meaningful difference by promoting a people‐centred, needs‐driven, and sustainable development approach towards the communities in which it operates. Sasol focuses primarily on education, health and welfare, job‐creation and capacity building, sports development, and the environment (Free State Business, 2012).
(iii) The Sasol Techno Career Expo: It is an annual event held in Sasolburg that showcases and promotes science, mathematics and technology to high school learners. The Sasol Techno X 2012 attracted more than 22 000 visitors from over 300 schools from seven provinces in
51 http://www.cajnewsagency.com/index.php/energy‐and‐petrolium/1405‐sasol‐boosts‐research‐and‐technology‐
in‐south‐africa ‐ accessed on 20 January 2013.

Free State PSDF: Phase 2 Report February 2013
Department of the Premier & COGTA Department of Rural Development and Land Reform
62
Dennis Moss Partnership
South Africa. This event is a platform for science enthusiasts to engage with the real‐world applications of science, mathematics and technology in a way that benefits everyone52.
The value of Sasol and its promotion of science, technology, innovative ideas, and mathematics is immense to education in creating new scientists, engineers and technologists for the Free State and for South Africa. B13.2 INFORMATION AND COMMUNICATION TECHNOLOGY The Free State Province is planning an Information and Communication Technology (ICT) hub and Bloemfontein in May 2012 became the scene for a significant event in South Africa’s ICT history, when FibreCo Telecommunications initiated the first fibre optic network in the city (Free State Business, 2013). The South African telecommunications landscape influences the roll‐out of ICT infrastructure in local and provincial governments. Telecommunications is an essential need in social, academic and business spheres. This is why telecommunications policy and regulation is given serious attention both internationally and nationally. ICT infrastructure includes telephone (i.e. fixed or land‐line telephones), mobile cellular technology, broadband Internet access, radios, TV sets, post offices, and personal computers. Furthermore, ICT infrastructure is combined with Thusong Service Centres that offer information systems services such as typing, Internet, telecentre, photocopying, IT training, electronic library, telephone interpretation services, etc. (DBSA, 2011)53. FibreCo is a joint venture between Cell C, Investment Company Convergence Partners, and Internet Solutions. The provincial government of the Free State has undertaken to start a Techno Park in the Lejweleputswa District Municipality and envisages the Universal Service and Access Agency of South Africa (USAASA) and Seacom as partners in the R2 billion plan. An ICT Hub has already been launched in Harrismith, where young people can learn computer skills. Other ICT projects in the Free State include: a) Broadband Internet being delivered to every town in the province, and the use of this
upgraded ICT service is to improve government and municipal services. The National Department of Basic Education and Cell C are potential partners in a plan to roll out connectivity to rural areas. The ‘Ubuntu iCafe’ model envisages Internet cafes in each of the province’s 300 wards.
b) In 2010, a partnership between the provincial government, Indian company Satyam and the Central University of Technology, saw the launch of the R17 million Regional Innovation Centre. Software development and training in information technology skills are at the centre if this initiative. One of the areas where better connectivity will have an impact is in the ‘call centre industry’.
c) The Re Hodisa Moruro partnership, which has been established between Mangaung Municipality and the IT firm, Fujitsu, has created a municipal services call centre that uses one telephone number, and is intended to form the basis for a call centre industry in the province. Fujitsu has committed to investing R3.5 million in skills training. Other partners in the R50 million project are Microsoft, Cisco and Uninet.
52 http://www.skillsportal.co.za/page/education/schools/1367511‐Sasol‐Techno‐X‐2012‐attracts‐more‐than‐22‐
000‐visitors#.UQd‐AR3qmyE – accessed on 20 January 2013. 53 DBSA, 2011: Assessment of ICT infrastructure in the North West, Limpopo and Free State Provinces. Pretoria.

Free State PSDF: Phase 2 Report February 2013
Department of the Premier & COGTA Department of Rural Development and Land Reform
63
Dennis Moss Partnership
According to TradeInvest South Africa, the Free State Provincial Government is becoming more proactive in its approach to embracing the information age and in becoming a key player in the global ICT market54. The Free State Development Corporation (FDC) is currently working to attract Business Process Outsourcing (BPO) investment into the Free State, and has highlighted key reasons why the Free State is the right choice for potential investors: (i) Rental costs lower than those of Johannesburg and Cape Town. (ii) Labour costs which are lower than those in Cape Town and Johannesburg. (iii) Convenient accessibility from Johannesburg. (iv) Appropriate supporting infrastructure on a par with Johannesburg and Cape Town in
sophistication and reliability. (v) Flexible rental policy for under‐utilised business premises (i.e. warehouse, factory and
office space) in some parts of the province. (vi) Lower industry density which provides for greater accessibility to certain skill sets. (vii) English, Sotho, Tswana, and Afrikaans language skills are readily available. (viii) Availability of young matriculants and graduates. B14 DEVELOPMENT REGIONS AND CORRIDORS Economic development opportunities are the key determinant in the settlement pattern of the province. Economic development, in turn, typically responds to the availability of Environmental Capital (e.g. water, suitable agricultural soil, mining resources, etc.) and Infrastructural Capital (e.g. roads, electricity, bulk engineering services, etc.). Over time, this has resulted in the evolution of distinct development regions and corridors. The development regions and corridors constitute a clustering of nodes and the creation of a system that synergises the capacity of that would lead to regional equity. Table B24: Development regions and corridors of the Free State (Source: FSGDS, July 2011).
REGION AND CORRIDOR
DESCRIPTION
Diamond Region Most of the diamonds, gravel and clay are mined in this region of the Free State and it encompasses nodes such as Jacobsdal, Koffiefontein, Jagersfontein, Fauresmith etc. in the Xhariep District. Near Jacobsdal are the wine cellars of Landzicht and Wilreza.
Goldfields Region Mining, especially gold mining is the most important activity in this area, and is mostly confined to northern Free State. It is also the most important maize‐growing area in South Africa. The primary node is Welkom, but other important and secondary nodes include: Allanridge, Boshof, Brandfort, Bultfontein, Dealesville, Hertzogville, Hoopstad, Odendaalsrus, Theunissen, Ventersburg, Virginia, Welkom, Wesselsbron and Winburg.
Harrismith Logistical Hub (HLH) Special Economic Zone
At Harrismith and Phuthaditjhaba, the Free State Development Corporation is promoting large‐scale investments. Harrismith is the central focus of efforts to create a multinodal transport and logistics hub, known as the Harrismith Logistical Hub. This hub will be operated as a Special Economic Zone in the Free State. Harrismith is strategically located on the Durban‐Gauteng Corridor or N3 highway and the N5 corridor crosses at Harrismith. Harrismith provides an excellent opportunity to divert freight traffic from other congested routes that provide goods from Durban to Gauteng and vice versa. Furthermore, Harrismith is ideally
54 http://www.tradeinvestsa.co.za/investment_opportunities/958803.htm ‐ assessed on 20 January 2013.

Free State PSDF: Phase 2 Report February 2013
Department of the Premier & COGTA Department of Rural Development and Land Reform
64
Dennis Moss Partnership
located to host a number of economic activities associated with the freight and logistic industries. A huge food‐processing park is also planned in Harrismith and this park will host a number of companies in the food‐processing sector, and would be an integrated park with warehouses, cold storage facilities etc.
Hydropower Corridor
This corridor corresponds with border between the Free State Province and Northern Cape Province. The Vanderkloof and Gariep dams have hydropower facilities and provide a valuable source of renewable energy which is used as far as Gauteng.
Mangaung Metropolitan Municipality
This is the centre region of the Free State and includes the larger urban settlements of Bloemfontein, Thaba Nchu and Botshabelo. This region is highly urbanised and cosmopolitan and contributes approximately one third of the province’s GDP. The three nodes are connected with the so‐called ‘BBT Heritage Route’ which is a major tourism attraction. A Pharmaceutical Biomedical Park (also envisaged as a special economic zone) is planned in Bloemfontein which will increase the importance of this region as a world‐class medical research centre. Furthermore, the City of Bloemfontein has all the facilities, services and industries associated with an international city which includes an international airport.
N1 Corridor The N1 Corridor runs from Cape Town to Johannesburg through the Free State. Bloemfontein is the most prominent node on this route. Other secondary but important nodes are Winburg, Ventersburg, and Kroonstad. The N1 highway is a very busy corridor for the transport of freight goods and products from Cape Town to Johannesburg and vice versa.
N5 Tourism Corridor
This is a corridor along the N5 highway that starts at Bloemfontein, and links nodes such as Winburg, Senekal, Bethlehem, and Harrismith. It is an important scenic and tourism corridor that provides access to famous attractions such as Clarens, Ficksburg, QwaQqa, and the Golden Gate Highlands National Park. It also links the Free State with the KwaZulu‐Natal Province.
N3 Durban ‐ Gauteng Development Corridor
The Free State is an important freight link between Durban (i.e. harbour) and the Gauteng economic hub via the N3 highway or corridor. The importance and potential of the N3 Development Corridor is supported by the National Government. The planned Harrismith Logistical Hub will boost the economic potential of the area and will increase the Free State’s logistic capacity and capabilities. In the long‐term various types of investments will be promoted along the N3 Corridor to increase its potential.
Sasolburg Development Node
Sasolburg in the northern Free State is a highly industrialised and efficient economic hub of high‐level production and services. As the headquarters of Sasol with its world‐leading petrochemical industry (regarded as a major national asset); and the site of Sasol’s other industries such as wax and chemical plants, this node is a major contributor to South Africa’s manufacturing sector. Several other famous and important chemical companies also operate in Sasolburg. Sasolburg is the economic driver of the Fezile Dabi District Municipality which shares a border with the Gauteng Province along the Vaal River, and thus strategically located to the industrial hub of Johannesburg and Tshwane.

Free State PSDF: Phase 2 Report February 2013
Department of the Premier & COGTA Department of Rural Development and Land Reform
65
Dennis Moss Partnership
Tourism: ‘Friendly’ N6 Corridor
The N6 Route is major tourism corridor and is used to enter or exit the Free State from the south and ventures through the Xhariep region. It includes settlements such as Bloemfontein to Redderburg, Smithfield and Rouxville. It passes through open countryside where mainly sheep, cattle and goats are farmed, past Anglo‐Boer War battlefields and off‐the‐beaten track villages and towns of both provinces.
Tourism: ‘Active’ N8 Corridor
This tourism corridor links Bloemfontein and Lesotho, passing, among others, Ladybrand, Thaba Nchu, and Botshabelo. From Bloemfontein westwards the N8 leads via Petrusburg to Kimberley. This corridor is also an alternative route for travellers from KwaZulu‐Natal to the Eastern Cape and Cape Town via Bloemfontein.
Xhariep Solar Region
The Southern Free State, especially the Xhariep region is regarded as an ideal location to harness the natural solar energy for generating electricity. It is envisaged that in the future this region could become a major source of renewable energy for the entire South Africa.
Map B19: Development regions and corridors of the Free State.

Free State PSDF: Phase 2 Report February 2013
Department of the Premier & COGTA Department of Rural Development and Land Reform
66
Dennis Moss Partnership
B15 SUPPORTING PROVINCIAL INFRASTRUCTURE AND SERVICE BASE The province, due to its central location, provides a pass‐through system for significant volumes of freight. The quality and functionality of transport infrastructure is pivotal to the economy. In this respect it is the producers in the primary sector (agriculture) and the secondary sector (manufacturing) who are most dependant on transport. The key components are summarised and illustrated in the chapters below. B15.1 TRANSPORT Transport is a supportive sector which plays a key role in meeting objectives of economic growth, access to employment opportunities, and social integration. Transport, both public and private, is a primary spatial structuring element providing access and mobility to both urban and rural communities. One of the underlying success factors of any regional economy relates to the movement of goods, people and services. It is important that the role and functioning of the different modes of transport and the impact on the infrastructure are clearly understood in order to focus different investment on the areas of opportunity and need. The Free State is located in the centre of the country, which implies that a significant part of the freight movements on the Free State roads both originate and are destined for places outside the province. The growth in freight in the country has surpassed most of the growth forecasts. This has placed massive pressure on the available road infrastructure throughout the country and on the Free State roads.
Map B20: Transport network of the Free State.

Free State PSDF: Phase 2 Report February 2013
Department of the Premier & COGTA Department of Rural Development and Land Reform
67
Dennis Moss Partnership
The province is currently servicing four main transport routes (refer to Map B21). The N3 between Durban and Gauteng handles approximately 70% of the freight that crosses the Free State (30 million tons per annum) (FSGDS 2012). The second freight corridor is the N1 between Gauteng and the Western Cape (7.5 million tons per annum). Freight Transport on this route is expected to grow by 40% by 2020, with 85% of the transport of the transport taking place by road and the remaining 15% by rail. Approximately 90% of the freight will be for domestic purposes, while 10% will be for exports. The dominant commodities on this corridor are processed foods, coal, chemicals, beverages and fruit produce. The third route is a sub‐corridor from the Gauteng / Western Cape nexus to Port Elizabeth. Although in size this approximately 15% of the volumes expected on the Gauteng / Western Cape route, it is still expected to grow by 39% by 2020. Furthermore, 92% of the freight will be moved by road and 8% by rail. Overall, 90% will be destined for the local market and 10% for exports. The main commodities to be transported through this link are processed meats, maize, chemicals, iron, steel and ferroalloys, railway equipment and motor vehicles. The last link in the Free State is the sub‐corridor from the main Gauteng/Western Cape route to East London. This is expected to grow by 31% for export purposes, and 91% will be transport via the road. The main products are processed foods, maize, chemicals and wood products. The high percentage of chemicals to be transported across the Free State is an indication that disaster management services should be prepared in this regard. Moreover, damage to existing roads can, amongst other things, attributed to a high degree of overloading. These risks, as well as road‐use behaviour problems also require urgent attention from road management authorities. B15.2 ROADS Of the 3 305 km of main roads in the Free State (excluding the national roads), less than half (48.6% or 1609 km) has been evaluated as being in a fair, good or very good condition. Normal maintenance cost has been estimated at R4.127 billion. A total of 1731 km (52.3%) has been evaluated to be in a poor to very poor condition. The maintenance and repair cost associated with these roads have been estimated by the Department of Police, Roads and Transport to be in the order of R11.403 billion. The Free State is struggling to adhere to an international norm of resealing roads every twelve years. Based on the latest information (2005) the current rate of resealing will only ensure a resealing cycle of every 40 years. In 2005, 82% of the road network had not been sealed during the previous twelve‐year cycle. The situation with gravel roads also seems to be problematic as only 25% of these roads have acceptable norm of 50mm of gravel thickness. The parlous state of the Free State’s road network has resulted in an increase in road accidents and an increase in the number of claims against the road authorities. Important to note is that the northern Free State and especially the rural areas have problems pertaining to the increasing number of potholes in roads.

Free State PSDF: Phase 2 Report February 2013
Department of the Premier & COGTA Department of Rural Development and Land Reform
68
Dennis Moss Partnership
Map B21: Main routes of the Free State.
Table B25: Primary roads in the Free State (FSGDS, 2012).
ROUTE DESCRIPTION N1 Main route between Gauteng and the Western Cape via Bloemfontein. N3 Main route between Gauteng and KZN across the Free State. N5 Main route between KZN, Gauteng and the Free State. N6 Main route between Gauteng and the Eastern Cape via Bloemfontein. N8 Linking the Free State with the Northern Cape and Lesotho.
B15.3 AIRPORTS Bloemfontein International Airport, the third largest of Airport Company South Africa’s (ACSA) national airports, is an important gateway to the Free State. The airport handles approximately 25 000 air‐traffic movements a year, which brings approximately 400,000 passengers, the majority of whom are business travellers, through its doors. There are also a number of smaller municipal and private airfields in the province. Of particular importance are the airfield in Matjhabeng, Parys and Harrismith (the latter is of special significance for the development of the Harrismith Multimodal Logistics Hub). The private airstrip (tarred) at Ficksburg is also an important regional airfield, especially from a business travel perspective. From time to time, some of these airfields have been identified for investigating the possibility of increasing existing utilisation. A case in point is the airfield at Matjhabeng for which a pre‐feasibility study was done in 2000/1 on the possibility of developing the airfield into an international air cargo hub (FSGDS, 1012).

Free State PSDF: Phase 2 Report February 2013
Department of the Premier & COGTA Department of Rural Development and Land Reform
69
Dennis Moss Partnership
B15.4 RAILWAYS The Free State Province is served by an extensive rail network for long‐distance passengers services (Shosholoza Meyl) and freight transport. No commuter rail services are operational. Scheduled passenger trains in the Free State run over a total rail line distance of 1 187 km (the total rail line coverage for South Africa is 6 398 km). The Free State Province therefore has approximately 19% or the total rail network coverage in South Africa. B15.5 WATER DISTRIBUTION NETWORK As mentioned previously, water services delivery in the Free State is performed by twenty Water Services Authorities via 76 drinking water supply systems. Bloem Water and Sedibeng Water Boards are the main Water Services Provider in the Free State that abstract, treat and supply drinking water to municipal networks via a number of bulk water schemes (FSGDS, 2012). The table below summarizes the current water supply situation for each WMA in the province (Draft 2012 Free State Water Master Plan, DWA) (also refer to Chapter B5.1.1). Table B26: Water distribution by each Water Management Area in the Free State (Draft 2012
Free State Water Master Plan, DWA). WATER DISTRIBUTION NETWORK
WATER MANAGEMENT
AREAS:
CURRENT SUPPLY SITUATION
Upper Vaal WMA Large quantities of water are subtracted out of this WMA, not only for local use, but also transferred to surrounding WMAs. The highest percentage of water requirements in the Upper Vaal WMA is in the Sub‐Areas downstream of the Vaal Dam. Approximately 60% of local requirements are for urban use (17% for industrial and mining) and most irrigation also takes place in this Sub‐Area (downstream of Vaal Dam).
Middle Vaal WMA The majority of water requirements in the Middle Vaal WMA are transferred from the Upper Vaal WMA to the Lower Vaal WMA via the Vaal river. Approximately 40% of local water requirements are used for irrigation mainly in the Sand‐Vet Sub‐Area (supplied by Allemanskraal and Erfenis dams) and 25% of water is needed for urban and mining/industrial use respectively.
Lower Vaal WMA Water usage in the Lower Vaal Management Area is dominated by irrigation, mainly the Vaalharts Irrigation Scheme, which represents 80% of local requirements for water. Approximately 12% is for urban and industrial use, 7% for rural domestic supplies and stock watering. A substantial proportion of water used in the urban and industrial sectors is used non‐consumptively and becomes available as effluent.
Upper Orange WMA
Water requirements within Upper Orange WMA are dominated by irrigational use (80% of local requirements). Most of the urban and industrial requirements are in the Riet/Modder sub‐area, where Bloemfontein and Thaba Nchu are located. Large quantities of water used for power generation at Gariep and Vanderkloof Dams are released for downstream users.
Table B27 indicates the volume of water distributed to and used by each sector within the subject four Water Management Areas during the periods between 2007 and 2008. The Upper Orange WMA distributed most of its water for agricultural uses and the Upper Vaal WMA distributed most of its water for domestic/industrial uses. The Upper Vaal WMA was the only management area that distributed water for forestry purposes.
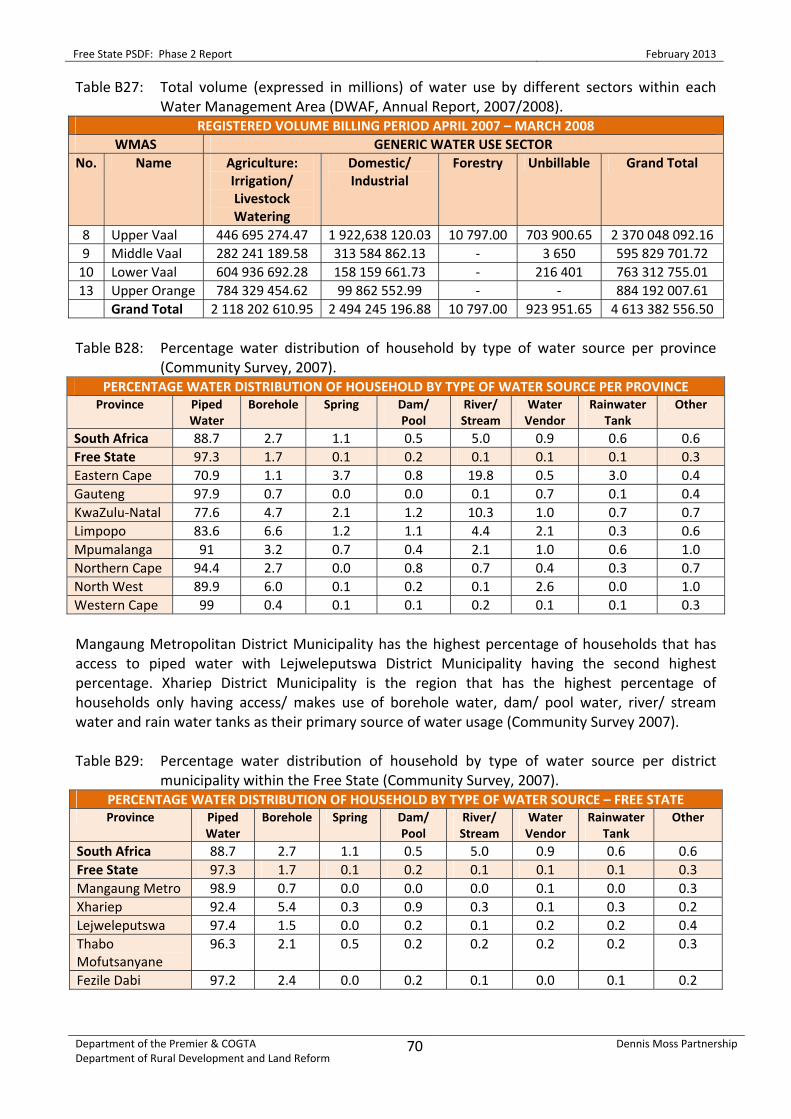
Free State PSDF: Phase 2 Report February 2013
Department of the Premier & COGTA Department of Rural Development and Land Reform
70
Dennis Moss Partnership
Table B27: Total volume (expressed in millions) of water use by different sectors within each Water Management Area (DWAF, Annual Report, 2007/2008).
REGISTERED VOLUME BILLING PERIOD APRIL 2007 – MARCH 2008 WMAS GENERIC WATER USE SECTOR
No. Name Agriculture: Irrigation/ Livestock Watering
Domestic/ Industrial
Forestry Unbillable Grand Total
8 Upper Vaal 446 695 274.47 1 922,638 120.03 10 797.00 703 900.65 2 370 048 092.16 9 Middle Vaal 282 241 189.58 313 584 862.13 ‐ 3 650 595 829 701.72 10 Lower Vaal 604 936 692.28 158 159 661.73 ‐ 216 401 763 312 755.01 13 Upper Orange 784 329 454.62 99 862 552.99 ‐ ‐ 884 192 007.61 Grand Total 2 118 202 610.95 2 494 245 196.88 10 797.00 923 951.65 4 613 382 556.50
Table B28: Percentage water distribution of household by type of water source per province
(Community Survey, 2007). PERCENTAGE WATER DISTRIBUTION OF HOUSEHOLD BY TYPE OF WATER SOURCE PER PROVINCE
Province Piped Water
Borehole Spring Dam/ Pool
River/ Stream
Water Vendor
Rainwater Tank
Other
South Africa 88.7 2.7 1.1 0.5 5.0 0.9 0.6 0.6 Free State 97.3 1.7 0.1 0.2 0.1 0.1 0.1 0.3 Eastern Cape 70.9 1.1 3.7 0.8 19.8 0.5 3.0 0.4 Gauteng 97.9 0.7 0.0 0.0 0.1 0.7 0.1 0.4 KwaZulu‐Natal 77.6 4.7 2.1 1.2 10.3 1.0 0.7 0.7 Limpopo 83.6 6.6 1.2 1.1 4.4 2.1 0.3 0.6 Mpumalanga 91 3.2 0.7 0.4 2.1 1.0 0.6 1.0 Northern Cape 94.4 2.7 0.0 0.8 0.7 0.4 0.3 0.7 North West 89.9 6.0 0.1 0.2 0.1 2.6 0.0 1.0 Western Cape 99 0.4 0.1 0.1 0.2 0.1 0.1 0.3 Mangaung Metropolitan District Municipality has the highest percentage of households that has access to piped water with Lejweleputswa District Municipality having the second highest percentage. Xhariep District Municipality is the region that has the highest percentage of households only having access/ makes use of borehole water, dam/ pool water, river/ stream water and rain water tanks as their primary source of water usage (Community Survey 2007). Table B29: Percentage water distribution of household by type of water source per district
municipality within the Free State (Community Survey, 2007). PERCENTAGE WATER DISTRIBUTION OF HOUSEHOLD BY TYPE OF WATER SOURCE – FREE STATE Province Piped
Water Borehole Spring Dam/
Pool River/ Stream
Water Vendor
Rainwater Tank
Other
South Africa 88.7 2.7 1.1 0.5 5.0 0.9 0.6 0.6 Free State 97.3 1.7 0.1 0.2 0.1 0.1 0.1 0.3 Mangaung Metro 98.9 0.7 0.0 0.0 0.0 0.1 0.0 0.3 Xhariep 92.4 5.4 0.3 0.9 0.3 0.1 0.3 0.2 Lejweleputswa 97.4 1.5 0.0 0.2 0.1 0.2 0.2 0.4 Thabo Mofutsanyane
96.3 2.1 0.5 0.2 0.2 0.2 0.2 0.3
Fezile Dabi 97.2 2.4 0.0 0.2 0.1 0.0 0.1 0.2

Free State PSDF: Phase 2 Report February 2013
Department of the Premier & COGTA Department of Rural Development and Land Reform
71
Dennis Moss Partnership
B16 SUMMARY OF KEY STRENGTHS AND KEY CHALLENGES In this final chapter, the key strengths and key challenges that were identified by the various sectors and other stakeholders and through the situational inventory and analysis are summarised in accordance with the categories indicated by the figure posed in the section synopsis. For ease of reference, the figure is repeated here. The lists of strengths and challenges cited below are not final at this stage of the PSDF project. It is envisaged that the lists would be significantly extended following on the stakeholder participation processes to be undertaken in terms of the project programme.
THE CONTEXT KEY STRENGTHS KEY CHALLENGES
a) The Free State is located in the centre of the country, which is the reason for generally beneficial freight movement through the province.
b) Due to the province’s central location, it plays a pivotal function in linking seven provinces (FSGDS 2012).
c) The Free State has a vital role to fulfil in the management of the country’s water resources. Approximately 98% of the runoff of the Orange River System is generated in the upper section (origin to Orange‐Vaal confluence). The Free State province covers the largest portion of this area.
d) Of the ten biggest dams (in terms of capacity) in South Africa, 5 are located in the Free State. The Gariep, Vanderkloof, Sterkfontein, and Vaal represent the 4 biggest dams in the country, cumalatively capable of storaging almost 14 000 million m³ of water.
a) Lack of understanding and appreciation of the critical functions of the Free State as a pivot and linkage between Lesotho and the remainder of South Africa.
b) Lack of international and national cooperation as it relates to biodiversity conservation and efficient regional planning.
c) Inadequate strategies for implementation of integrated rural development in collaboration with neighbouring provinces, i.e. inadequate cross‐border arrangements.
d) Inadequate provincial, district and local spatial planning directives.
e) Lack of sectoral cooperation, integration and corporative governance.
f) Inadequate strategies for giving effect to international protocols, agreements, and conventions.
g) A propensity to plan the province and its municipalities in isolation, i.e. ignoring vital linkages and synergies.
THE CONTEXT
• Locational aspects• Administrative framework• Settlement pattern
THE
PLACE
• Biophysical traits• Hydrology and water• Biodiversity matters
THE PEOPLE
• Socio‐economic status• Service provision• Land reform
THE ECONOMY
• Economic profile• Economic sectors• Supporting infrastructure
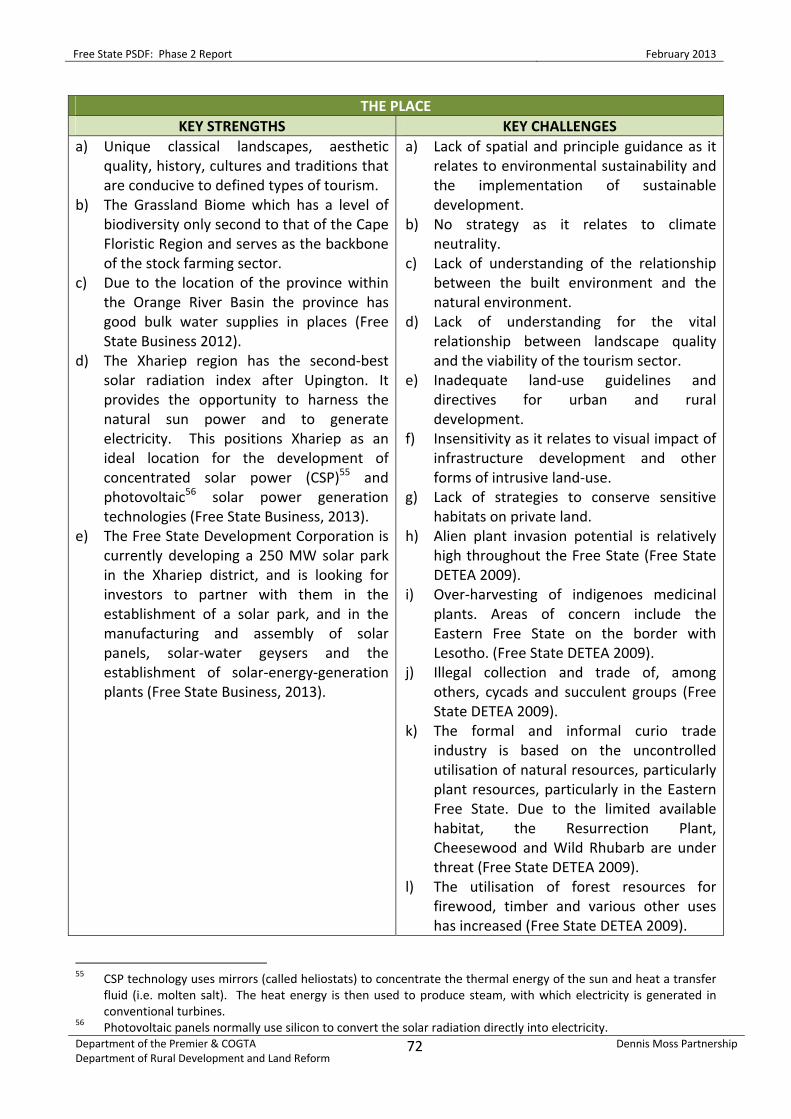
Free State PSDF: Phase 2 Report February 2013
Department of the Premier & COGTA Department of Rural Development and Land Reform
72
Dennis Moss Partnership
THE PLACE
KEY STRENGTHS KEY CHALLENGES a) Unique classical landscapes, aesthetic
quality, history, cultures and traditions that are conducive to defined types of tourism.
b) The Grassland Biome which has a level of biodiversity only second to that of the Cape Floristic Region and serves as the backbone of the stock farming sector.
c) Due to the location of the province within the Orange River Basin the province has good bulk water supplies in places (Free State Business 2012).
d) The Xhariep region has the second‐best solar radiation index after Upington. It provides the opportunity to harness the natural sun power and to generate electricity. This positions Xhariep as an ideal location for the development of concentrated solar power (CSP)55 and photovoltaic56 solar power generation technologies (Free State Business, 2013).
e) The Free State Development Corporation is currently developing a 250 MW solar park in the Xhariep district, and is looking for investors to partner with them in the establishment of a solar park, and in the manufacturing and assembly of solar panels, solar‐water geysers and the establishment of solar‐energy‐generation plants (Free State Business, 2013).
a) Lack of spatial and principle guidance as it relates to environmental sustainability and the implementation of sustainable development.
b) No strategy as it relates to climate neutrality.
c) Lack of understanding of the relationship between the built environment and the natural environment.
d) Lack of understanding for the vital relationship between landscape quality and the viability of the tourism sector.
e) Inadequate land‐use guidelines and directives for urban and rural development.
f) Insensitivity as it relates to visual impact of infrastructure development and other forms of intrusive land‐use.
g) Lack of strategies to conserve sensitive habitats on private land.
h) Alien plant invasion potential is relatively high throughout the Free State (Free State DETEA 2009).
i) Over‐harvesting of indigenoes medicinal plants. Areas of concern include the Eastern Free State on the border with Lesotho. (Free State DETEA 2009).
j) Illegal collection and trade of, among others, cycads and succulent groups (Free State DETEA 2009).
k) The formal and informal curio trade industry is based on the uncontrolled utilisation of natural resources, particularly plant resources, particularly in the Eastern Free State. Due to the limited available habitat, the Resurrection Plant, Cheesewood and Wild Rhubarb are under threat (Free State DETEA 2009).
l) The utilisation of forest resources for firewood, timber and various other uses has increased (Free State DETEA 2009).
55 CSP technology uses mirrors (called heliostats) to concentrate the thermal energy of the sun and heat a transfer
fluid (i.e. molten salt). The heat energy is then used to produce steam, with which electricity is generated in conventional turbines.
56 Photovoltaic panels normally use silicon to convert the solar radiation directly into electricity.

Free State PSDF: Phase 2 Report February 2013
Department of the Premier & COGTA Department of Rural Development and Land Reform
73
Dennis Moss Partnership
m) Loss of genetic integrity of endemic fauna as a result of hybridisation.
n) Loss of fauna due to encroachment of urban development, over‐hunting and loss of land used for grazing of sheep and cattle (Free State DETEA 2009).
o) Inter‐Basin Transfer Schemes such as the Malibamatso to Ash River have impacted on the genetic integrity of fish species through the introduction of species from historically isolated populations.
p) Isolation of migratory species, upstream from dam or weir walls where the connectivity is separated and gene movement occurs only in a downstream direction (Free State DETEA 2009).
q) Rhino poaching. r) Notwithstanding increasing access to
electricity; wood and paraffin is still an important energy source for cooking and heating in many rural households. (Community Survey 2007).
s) Water quality in the Vaal River is of serious concern because of high salinity and nutrient content, which mainly results from urban and industrial return flows as well as mining activities in the Upper Vaal WMA. The closure of mines may have further water quality impacts.
t) Water from tributaries as well as from groundwater in the WMA is fully utilised, mainly for irrigation and for towns remote from the Vaal River.
u) High utilisation of the water resources, both surface and groundwater.
v) Concerns about water quality in the Vaal River as a result of upstream activities (i.e. urban, industrial and mining), and the additional impacts of irrigation return flows on salinity concentrations.
w) Impacts of mining activities on groundwater as well as localised over‐exploitation of groundwater.
x) The Lesotho Highlands Water Project, relies on water which, under natural conditions, would flow into the Upper Orange WMA, and therefore has a major impact on water availability in the Upper Orange WMA.

Free State PSDF: Phase 2 Report February 2013
Department of the Premier & COGTA Department of Rural Development and Land Reform
74
Dennis Moss Partnership
y) No surplus water will be available from the Orange River after completion of the Mohale Dam. A deficit situation may therefore occur before 2025.
z) Flood management at the Gariep and Vanderkloof Dams, in concert with flood management along the Vaal River, is of major importance as it relates to the protection of river bank development along the Lower Orange River.
THE PEOPLE
KEY STRENGTHS KEY CHALLENGES a) Availability of a large and affordable labour
pool (Free State Business 2012). b) Between 2001 and 2011 the net‐migration
has declined, indicating that more people find jobs within the province rather than to migrate (Stats SA 2011).
c) Increase in employment opportunities in the tertiary sector (FSGDS 2012).
d) Functional literacy has increased from 64% in 1994 to 80% in 2012 (FSGDS 2012).
e) Grade 12 pass rate increased from 56% in 1994 to 71% in 2010 (FSGDS 2012).
f) Increase of 40% Grade R classes in the Free State since 2004 (FSGDS 2012).
g) Between 2001 and 2011 there has been an increase in the percentage of households living in formal housing (Stats SA 2011).
h) Approximately 87% of the backlog of bucket toilets that existed in 2005 have been reduced (SALGA, 2009).
i) Approximately 89% of households have access to appropriate sanitation (Stats SA 2011).
j) The provincial Blue Drop Score stands at 64.01%. On the national overview, the Free State’s Drinking Water Quality scored an average of 73.6% (Blue Drop System 2012).
k) The Municipal Blue Drop Score of 94.72% was achieved (Blue Drop System 2012).
l) Approximately 97.3% of households have access to piped water (Community Census of 2007).
m) More than 70% of all households in the Free State have their refuse removed on a regular basis (Community Survey 2007).
n) 89.9% of all households in the Free State
a) Lack of strategies to ensure that the quality of subsidised housing is improved.
b) Inadequate strategies to promote the establishment of sustainable communities.
c) Inadequate strategies to promote economic empowerment of local communities by means of the sustainable use of resources.
d) Free State has the 2nd lowest population density and experience more out‐migration than in‐migration (Stats SA 2012).
e) The majority of the population forming part of the out‐migration group are the knowledge‐based (tertiary educated) groups (FSGDS 2012).
f) Approximately 51% of the Free State population is living in poverty (FSGDS 2012).
g) Only 34.7% of the population is economically active (Free State Business 2012).
h) The HDI for the Free State stayed constanty over the past 8 years, indicating that the standard of living has not increased (FSGDS 2012).
i) The unemployment rate for the Free State is higher than the national average at 32.6% (2011 Census).
j) Notwithstanding significant improvements, only 23% of the Free State population have a Grade 12 qualification and only 8% tertiary qualification (FSGDS 2012).
k) In 2010, only 50% of Grade 3 learners achieved a satisfactory level of competence (FSGDS 2012).
l) The Free State housing backlog is

Free State PSDF: Phase 2 Report February 2013
Department of the Premier & COGTA Department of Rural Development and Land Reform
75
Dennis Moss Partnership
have access to electricity for lighting, the national average is 84.7% (Census 2011).
o) A Medical Biotechnology Park is proposed at Bloemfontein to provide practical research collaboration between academic researchers, pharmaceutical companies, and clinical research companies in developing innovative products and technologies (FSGDS 2012).
estimated above 200 000 (Stats SA 2009). m) With the eradication of bucket systems
various challenges arose such as to accelerate and enhance the capacity of sewerage treatment plants, extent sewerage infrastructure in rural areas and to make efficient use of the scare water resources (FSGDS 2012).
n) About 3.2% of the Free State households have no sewerage removal facilities (Stats SA 2012).
THE ECONOMY KEY STRENGTHS KEY CHALLENGES
a) Being considered the bread basket of South Africa (Free State Business 2012).
b) Supplying significant portions of the country’s sorghum (53%), sunflowers (45%), wheat (37%), maize (34%), potatoes (40%), groundnuts (32%), dry beans (26%), wool (26%) and almost all of its cherries (90%) (FSGDS 2012).
c) The Free State is the third‐largest meat producer in the country, contributing 18% of the total national production (FSGDS
d) The Free State is rich in minerals. The Free State Consolidated Goldfields has a mining area of 32 918 ha. Roughly 30% of the country’s gold is obtained from this region.
e) Large deposits of coal and the country’s largest deposits of bentonite occur in the Felize Dabi District – this bituminous coal is converted into petrochemicals at Sasolburg.
f) The Free State (in particular the Xhariep District) has great potential to be a generator of renewable energy sources, especially solar energy (i.e. CSP and photovoltaic) – after the Northern Cape Province it is the second most suitable region in South Africa for solar‐generating energy sources.
g) Sasol is funding numerous initiatives with regards to gas and methane energy sources to be implemented in the province.
h) Eskom has two hydro‐power stations at Gariep and Vanderkloof dams.
i) The Free State has excellent infrastructure (Free State Business 2012).
a) Lack of strategies to ensure that the use of resources benefits all the people of the Free State.
b) Lack of directives and policy pertaining to the prioritisation of public and private investment.
c) Lack of partnerships between the private and the public sector as it relates to the implementation of sustainable development.
d) Of the total Free State road network, 52.3% has been evaluated to be in a poor to very poor condition (FSGDS, 2012).
e) The maintenance and repair cost associated with these roads have been estimated by the Department of Police, Roads and Transport to be in the order of R11.403 billion (FSGDS, 2012).
f) The Free State is struggling to adhere to an international norm of resealing roads every twelve years (FSGDS, 2012).
g) No commuter rail services are operational (FSGDS, 2012).
h) The following aspects have a negative impact on tourism development: Poor communication between the provincial, district and local government tourism structures. (i) Poor communication between the public
and private sectors. (ii) Under‐utilisation of existing provincial
nature reserves and resorts. (iii) Regulatory frameworks that impede
tourism investment, e.g. rezoning. (iv) Insufficient technical tourism resources

Free State PSDF: Phase 2 Report February 2013
Department of the Premier & COGTA Department of Rural Development and Land Reform
76
Dennis Moss Partnership
j) As South Africa’s most centrally located province, the Free State is easily accessible.
k) Abundance of natural attractions. l) World‐famous historical and cultural sites. m) A growing tourism sector and could
provide a much‐needed income boost for the local population (FSGDS 2012).
n) The petrochemical complex at Sasolburg is a major national asset and is a world‐leader in the production of various chemical products.
o) Sasol contributes 5% to the National GDP (www.sasol.com).
p) Bloemfontein International Airport is the third largest of ACSA’s national airports (FSGDS 2012).
q) The Free State is served by an extensive rail network for long‐distance passengers services (Shosholoza Meyl) and freight transport (FSGDS 2012).
within government structures. (v) Inadequate pooling of public and private
sector financial resources. (vi) Strengthened marketing of the rich
provincial tourism asset and service offerings.
i) The FSGDS identifies the following challenges: (i) Inadequate government support
programme for tourism development and growth:
(ii) Inadequate tourism marketing. (iii) Need to expand tourism products and
product range. (iv) Need to increase and build human
capacity for tourism development and service excellence.
B17 TOWARDS UNDERTAKING PHASE 3 AND PHASE 4 B17.1 ASPECTS TO BE ADDRESSED IN PHASE 3 AND PHASE 4 The aspects to be addressed in Phase 3 and Phase 4 are summarised below. These aspects include the goals and objectives of the PSDF as stated in the Service Level Agreement and in the Inception Phase Report dated 9 November 2012. The summary should be read together with the aspects that emerged from the Phase 2 process as cited in Chapter B16 above. B17.1.1 ASPECTS DRAWN THE SERVICE LEVEL AGREEMENT In terms of the Service Level Agreement the following aspects are to be addressed in Section C and Section D: a) Provide a spatial rationale for the development of the province while taking into
consideration development potential in the adjacent provinces. b) Give spatial effect to the directive of the national sphere of government. c) Translate national socio‐economic development priorities into space. d) Spatially un‐pack the provisions of the FSGDS and guide implementation of key anchor
projects. e) Provide direction for the CRDP roll‐out in the province. f) Provide pointers for the alignment of District SDFs and where disjuncture exists. g) Provide spatial mechanisms for harnessing and exposing the competitive and comparative
advantages of the province. h) Provide guidance to public and private land / infrastructure investment in the province,
taking cognisance of the growth and development potential. i) Indicate desired or undesired planning practices in a particular area. j) Spatially co‐ordinate and direct the activities and resources of the Free State Government
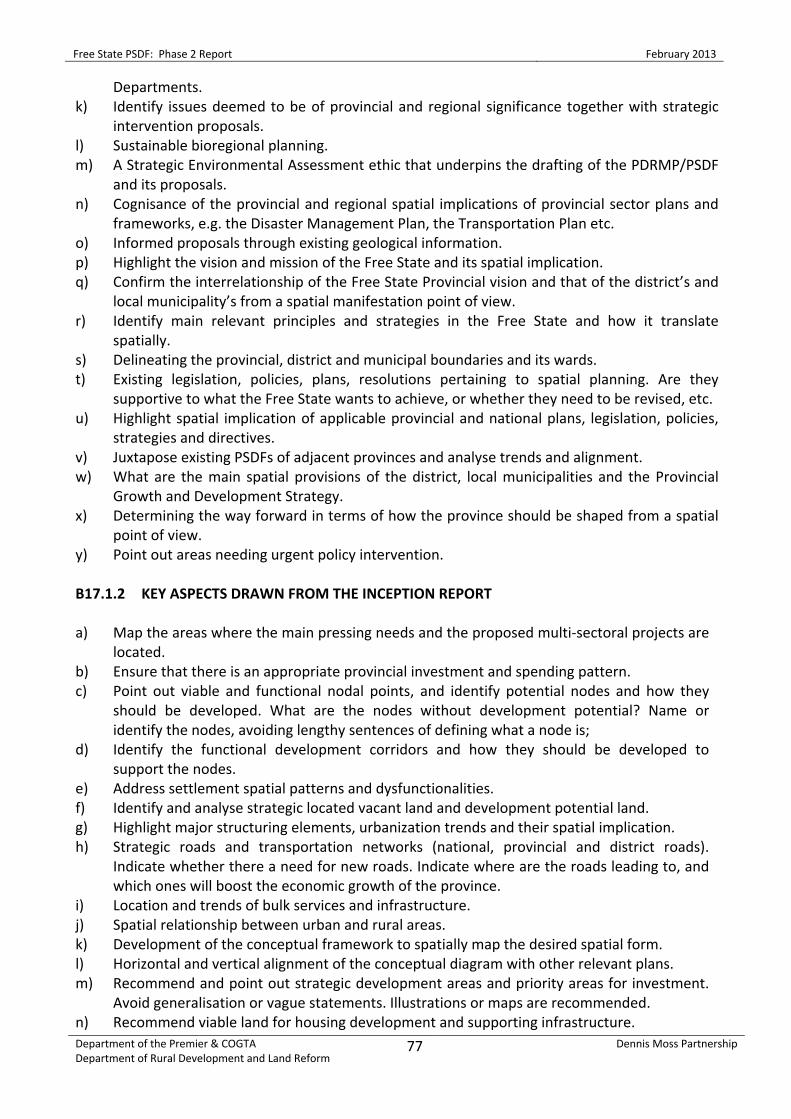
Free State PSDF: Phase 2 Report February 2013
Department of the Premier & COGTA Department of Rural Development and Land Reform
77
Dennis Moss Partnership
Departments. k) Identify issues deemed to be of provincial and regional significance together with strategic
intervention proposals. l) Sustainable bioregional planning. m) A Strategic Environmental Assessment ethic that underpins the drafting of the PDRMP/PSDF
and its proposals. n) Cognisance of the provincial and regional spatial implications of provincial sector plans and
frameworks, e.g. the Disaster Management Plan, the Transportation Plan etc. o) Informed proposals through existing geological information. p) Highlight the vision and mission of the Free State and its spatial implication. q) Confirm the interrelationship of the Free State Provincial vision and that of the district’s and
local municipality’s from a spatial manifestation point of view. r) Identify main relevant principles and strategies in the Free State and how it translate
spatially. s) Delineating the provincial, district and municipal boundaries and its wards. t) Existing legislation, policies, plans, resolutions pertaining to spatial planning. Are they
supportive to what the Free State wants to achieve, or whether they need to be revised, etc. u) Highlight spatial implication of applicable provincial and national plans, legislation, policies,
strategies and directives. v) Juxtapose existing PSDFs of adjacent provinces and analyse trends and alignment. w) What are the main spatial provisions of the district, local municipalities and the Provincial
Growth and Development Strategy. x) Determining the way forward in terms of how the province should be shaped from a spatial
point of view. y) Point out areas needing urgent policy intervention. B17.1.2 KEY ASPECTS DRAWN FROM THE INCEPTION REPORT a) Map the areas where the main pressing needs and the proposed multi‐sectoral projects are
located. b) Ensure that there is an appropriate provincial investment and spending pattern. c) Point out viable and functional nodal points, and identify potential nodes and how they
should be developed. What are the nodes without development potential? Name or identify the nodes, avoiding lengthy sentences of defining what a node is;
d) Identify the functional development corridors and how they should be developed to support the nodes.
e) Address settlement spatial patterns and dysfunctionalities. f) Identify and analyse strategic located vacant land and development potential land. g) Highlight major structuring elements, urbanization trends and their spatial implication. h) Strategic roads and transportation networks (national, provincial and district roads).
Indicate whether there a need for new roads. Indicate where are the roads leading to, and which ones will boost the economic growth of the province.
i) Location and trends of bulk services and infrastructure. j) Spatial relationship between urban and rural areas. k) Development of the conceptual framework to spatially map the desired spatial form. l) Horizontal and vertical alignment of the conceptual diagram with other relevant plans. m) Recommend and point out strategic development areas and priority areas for investment.
Avoid generalisation or vague statements. Illustrations or maps are recommended. n) Recommend viable land for housing development and supporting infrastructure.

Free State PSDF: Phase 2 Report February 2013
Department of the Premier & COGTA Department of Rural Development and Land Reform
78
Dennis Moss Partnership
o) Delineate functional and integrating municipal/district/provincial roads and public passenger transportation network.
p) Delineate proposed major bulk infrastructure for the whole province. Where appropriate recommend for new bulk infrastructure and the relevant services.
q) Point out and delineate areas with high agricultural potential and areas affected by claims which the province needs the most for developmental purposes.
r) Identify and map environmental conservation and sensitive areas are and what impact will development have on the environment. Indicate areas that should not be developed at all. Which are the areas where some kind of development through strict management should be allowed? Inter regional connectivity;
s) Point out and delineate environmental conservation and sensitive areas, major sporting nodes as well as areas with tourism potential.
t) Indicate the spatial implications of the core development objectives of the FSGDS. u) Serve as a spatial plan that will facilitate Local Economic Development (LED). v) Lay down strategies, proposals and guidelines for the future spatial development of the
province. This includes, without being limited to, development objectives, proposals for land reform, urban renewal, reconstruction, integration, environmental planning, transport planning, infrastructure planning, and urban design so that the general well‐being of the particular community and order in the area are promoted in the most efficient manner.
w) Promote the utilisation and unlocking the latent value of vacant government land through an innovative partnership approach to property development with the aim to support LED in a lasting and meaningful manner.
B17.1.3 ASPECTS EMERGING FROM PHASE 2 The following aspects were drawn from the Phase 2 process and the associated documentation. These aspects should be read together with those listed in Chapter B16. a) Enhance the quality of development throughout the province in accordance with the an
appropriate site‐specific planning approach. b) Promote the broadening of the economic base as an important principle underlying
economic development. Apart from a general higher level of output, this also implies the following: • Introducing new activities, which are not currently operational in the province. This
means an extension of the production capacity in terms of new products and services. • Application of new technologies that is not being applied in production processes. • Development of small, medium and micro‐enterprises (SMMEs) to have a broader
representation based on the size of establishments. Size can be expressed in terms of either employment or production.
• Broadening of ownership to include all members of the community. • Protecting and enhancing the interest of all property owners in the province.
c) Facilitating the preparation of provincial development plans and action plans to which financial budgets can be linked.
d) Providing a framework for undertaking performance management in terms of a set of measurable criteria, as such, promoting continual improvement of provincial and municipal functioning at all levels.
e) Supporting the district and local municipalities in the preparation of their IDPs and, in particular, their SDFs prepared in terms of the Local Government Municipal Systems Act 32

Free State PSDF: Phase 2 Report February 2013
Department of the Premier & COGTA Department of Rural Development and Land Reform
79
Dennis Moss Partnership
of 2000. f) Providing a standard format for the implementation of bioregional planning with the aim to
facilitate sustainable development throughout the Free State. g) Facilitating the land‐use classification of the entire land surface of the province in a
standard format in accordance with defined Spatial Planning Categories (SPCs), which are based on a broad spectrum of environmental parameters and a system of values and ethics.
h) Providing a framework that would inform any future municipal demarcation with the aim to reconcile future municipal boundaries with defined bioregional parameters.
i) Providing a credible context for public investments in the coming years and promoting the development of areas that have lagged behind.
j) Replacing inappropriate existing policy frameworks with a more ambitious forward‐moving, integrated approach to planning that will lead to the realisation of common goals of the province.
k) Providing clarity to guide decision‐makers in respect of development applications within the province.
l) Describing the existing and desired future spatial patterns that provide for integrated, efficient and sustainable settlements throughout the province.
m) Providing certainty to all stakeholders regarding spatial and socio‐economic implications of future development in the Free State.
n) Providing a basis for co‐ordinated decision‐making and policy‐formulation regarding future land‐use.
o) Facilitating cross‐boundary co‐operation and co‐ordination between district and local municipalities, adjoining provinces, and bordering countries in respect of issues that are of mutual interest for their respective areas of jurisdiction.
B17.2 WAY FORWARD Upon approval of this report by the Project Steering Committee, it will be distributed to all concerned with the aim to obtain input pertaining to the strengths and challenges summarised in Chapter B16. Phase 3 and Phase 4 of the PSDF process will then commence. These phases will focus on the formulation of address the spatial and strategic directives as it relates to enhancing the key strengths and resolving the key challenges identified in this situational inventory and analysis and through the stakeholder consultation. Figure B5 below illustrates the process followed in accordance with the approved Service Level Agreement and the associated programme and schedule as well as the current status of the project..
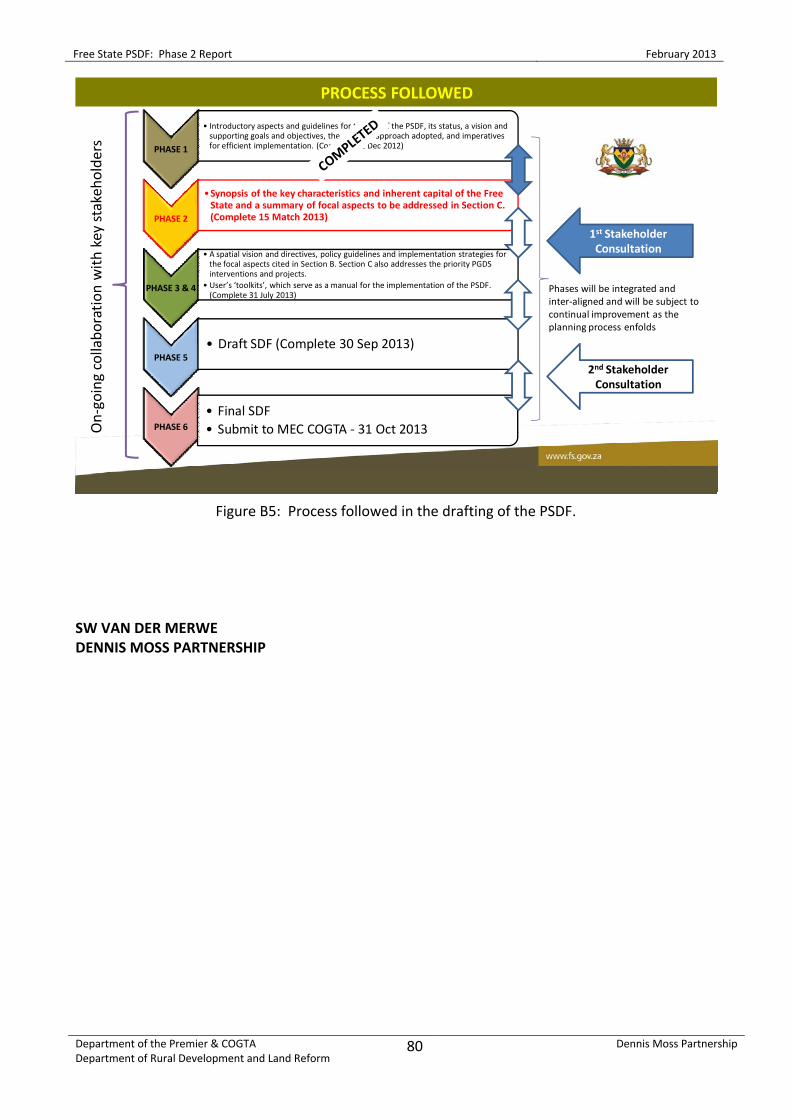
Free State PSDF: Phase 2 Report February 2013
Department of the Premier & COGTA Department of Rural Development and Land Reform
80
Dennis Moss Partnership
PROCESS FOLLOWED
PHASE 1
• Introductory aspects and guidelines for the use of the PSDF, its status, a vision and supporting goals and objectives, the planning approach adopted, and imperatives for efficient implementation. (Complete 12 Dec 2012)
PHASE 2
•Synopsis of the key characteristics and inherent capital of the Free State and a summary of focal aspects to be addressed in Section C. (Complete 15 Match 2013)
PHASE 3 & 4
• A spatial vision and directives, policy guidelines and implementation strategies for the focal aspects cited in Section B. Section C also addresses the priority PGDSinterventions and projects.
• User’s ‘toolkits’, which serve as a manual for the implementation of the PSDF. (Complete 31 July 2013)
PHASE 5• Draft SDF (Complete 30 Sep 2013)
PHASE 6
• Final SDF• Submit to MEC COGTA ‐ 31 Oct 2013O
n‐going collabo
ratio
n with
key stakeho
lders
1st Stakeholder Consultation
2nd Stakeholder Consultation
Phases will be integrated and inter‐aligned and will be subject to continual improvement as the planning process enfolds
Figure B5: Process followed in the drafting of the PSDF. SW VAN DER MERWE DENNIS MOSS PARTNERSHIP

Free State PSDF: Phase 2 Report February 2013
Department of the Premier & COGTA Department of Rural Development and Land Reform
81
Dennis Moss Partnership
B18 REFERENCES Basson, M.S., and Rossouw, J.D., 2003: Upper Orange Water Management Area: Overview of Water Resources Availability and Utilisation. National Water Resource Strategy. DWAF Report No: P WMA 13/000/00/0203. September 2003. Bulpin, T.V., 1990: Illustrated Guide to Southern Africa (4th Ed). Reader’s Digest. Cape Town. Centre for Public Service Innovation (CPSI), 2004: Sanitation: Innovation Insights. ‐ www.cpsi.co.za Chapin III, F.S., Zaveleta, E.S., Eviners, V.T., Naylor, R.L., Vitousek, P.M., Reynolds, H.L., Hooper, D.U., Lavorel, S., Sala, O.E., Hobbie, S.E., Mack, M.C., and Diaz, S. 2002: Consequences of changing biodiversity. Nature Insight, 405 (6783): 234‐242. CSIR EMS, 2012: Experience in the wind and solar energy sector: October 2012. http://www.csir.co.za/ems/docs/EMS%20A4%20Wind%20&%20Solar%20Energy_Nov2012_HIGH%20RES.pdf CSIR, 2004: State of the Environment Report (SOER): The Free State Province of South Africa. Department of Tourism, Environment and Conservation: Kimberley. DBSA, 2011: Assessment of ICT infrastructure in the North West, Limpopo and Free State Provinces. Pretoria. Department of Human Settlements: Human Settlements, Annual Report 2010/2011. ‐www.info.gov.za/ DETEA (Free State Department of Economic Development, Tourism and Environmental Affairs), 2009: Free State Environment Outlook: A report on the state of environment. Free State Department of Economic Development, Tourism and Environmental Affairs. Bloemfontein. Driver, A., Nel, J.L., Murray, K., Roux, D.J., Hill, L., Swartz, E.R., Manuel, J., and Funke, N., 2011: Implementation Manual for Freshwater Ecosystem Priority Areas. Report to Water Research Commission. WRC Report No. 1801/1/11. August 2011. DWA (Department of Water Affairs), 2012: Blue Drop Report: Chapter 4: Free State Province. DWA (Department of Water Affairs), 2011: Blue Drop Report: Chapter 4: Free State Province. DWA (Department of Water Affairs), 2012: Free State Province: Water Master Plan. Prepared in consultation with Province and Municipalities. Draft – April 2012. Earle, A., Malzbender, D., Turton, A., and Manzungu, E., 2005: A Preliminary Basin Profile of the Orange/Senqu River. INVENT. Erasmus, B.P.J., 2004: On Route in South Africa. Jeppestown: Jonathan Ball Publishers.

Free State PSDF: Phase 2 Report February 2013
Department of the Premier & COGTA Department of Rural Development and Land Reform
82
Dennis Moss Partnership
Free State Business, 2012: The Guide to Business and Investment in the Free State Province. Department of Labour. FDC, SEDA and IDC. www.freestatebusiness.co.za Free State Business, 2013: The Guide to Business and Investment in the Free State Province. Department of Labour. FDC, SEDA and IDC. www.freestatebusiness.co.za Free State Province Department of the Premier, 2012: Draft Provincial Growth and Development Strategy: Free State Vision 2030. Free State Province. Free State Tourism, 2011: Free State. Department of Tourism, Environmental and Economic Affairs. Bloemfontein. Inabus Tours: http://www.inabustours.com/Freestat.pdf. Global Insight, 2011: Regional Explorer Database. Heydenrych, R., 2012: Proposed Mainstream Springfontein Wind Energy Facility, Free State Province. Visual Impact Assessment Report – EIA Phase. Prepared by Aurecon. Home | Chamber Of Mines. 2013. Home | Chamber Of Mines. [ONLINE] Available at: http://www.bullion.org.za/. [Accessed 22 February 2013]. International Renewable Energy Agency (Irena), 2012: Case study 2013: Wind Atlas for South Africa. DoE, UNDP, GEF, WASA and Embassy of Denmark. Kahn, N., 2007: Land and Agrarian Reform in South Africa. Policy: Issues and Actors 20(12). 1‐38. Centre for Policy Studies. King, N.A., Maree, G., and Muir, A. 2009: Freshwater Systems: Chapter 13. In Fuggle, R.F, and Rabie, M.A. Environmental Management in South Africa (2nd ed). Cape Town: JUTA. Kok, P., 1999: The definition of migration and its application: Making sense of recent South African census and survey data. South Africa. SA Journal of Demography, 7(1). Marais, L., Van der Walt, K., Kooperman, C., and De Gouveia, A., 2011: Mine downscaling and growth: Lessons from the Free state Goldfields, Koffiefontein and Rustenburg. Unpublished report conducted for the IDC. Johannesburg. Mohoebi, E., 2012: Rural development: RECAP – Free State shows the way. Vuk’uzenzele. http://www.info.gov.za/vukuzenzele/2012/feb/priorities_12feb_recap_fs.htm Moodley, S., 2012. South Africa has attractive foundation for wind energy. http://www.engineeringnews.co.za/article/sa‐has‐attractive‐foundation‐for‐wind‐energy‐2012‐10‐05 Naidoo, M., 2012: Position Paper: Opportunities and Constraints for development of the tourism sector in Mangaung and Matjhabeng Municipalities. DETEA and ILO.

Free State PSDF: Phase 2 Report February 2013
Department of the Premier & COGTA Department of Rural Development and Land Reform
83
Dennis Moss Partnership
Northern Cape PSDF, 2012: Northern Cape: Provincial Development and Resource Management Plan/Provincial Spatial Development Framework. Office of the Premier of the Northern Cape. Department of Cooperative Governance, Human Settlements and Traditional Affairs. July 2012. OECD, 2006: Agricultural Policy Reform in South Africa. Policy Brief. April 2006. Open Mine Jagersfontein ‐ Horizon Route ‐ "Open Spaces and Little Places" ‐ South Africa ‐ Open Africa ‐ Development Server. 2013. Open Mine Jagersfontein ‐ Horizon Route ‐ "Open Spaces and Little Places" ‐ South Africa ‐ Open Africa ‐ Development Server. [ONLINE] Available at: http://www.openafrica.org/participant/open‐mine‐jagersfontein. [Accessed 22 February 2013]. SouthAfrica.info, 2012: South Africa’s renewable energy shift: 6 November 2012 http://www.southafrica.info/business/economy/infrastructure/energy‐061112.htm#.UQomGR3qmyE South Africa Local Government association (SALGA), 2009: Strategic sanitation review on operations, maintenance and sustainability of ventilated improved pit toilets including aspects of sustainability related to the eradication of buckets within the Free State Province. June 2009. South African Yearbook, 2012: South Africa’s tourism industry. www.southafrica.info ‐ 7 December 2012. Tourism Talk, 2009: Tourism in the Free State:www.tourismtalk.co.za/2009/10/tourism‐in‐the‐free‐state/ Van der Westhuizen, W., 2004: Internal Strategic Perspective for the Upper Vaal Water Management Area. Department of Water Affairs and Forestry: Directorate National Water Resource Planning. DWAF Report No: P WMA 08/000/00/0304. March 2004. Van Rijswijck, E., 2011: South Africa’s future renewable energy mecca. 22 December 2011. http://www.mediaclubsouthafrica.com/index.php?option=com_content&view=article&id=2714:renewable‐energy&catid Williams, F., 2013: Groenkragprojekte: Sonplase skop landwyd af. Die Burger. 7 February 2013. Winkler, H., 2006: Energy policies for sustainable development in South Africa. Options for the future. Energy Research Centre, UCT. Cape Town.


