Free tropospheric peroxyacetyl nitrate (PAN) and ozone atMount Bachelor: potential causes of variability and timescalefor trend detection
E. V. Fischer1, D. A. Jaffe1,2, and E. C. Weatherhead3
1Department of Atmospheric Sciences, University of Washington, Seattle, WA, USA2Science & Technology Program, University of Washington-Bothell, Bothell, WA, USA3Cooperative Institute for Research in Environmental Science, University of Colorado at Boulder, Boulder, CO, USA
Received: 26 October 2010 – Published in Atmos. Chem. Phys. Discuss.: 4 February 2011Revised: 9 May 2011 – Accepted: 25 May 2011 – Published: 20 June 2011
Abstract. We report on the first multi-year springtime mea-surements of PAN in the free troposphere over the US PacificNorthwest. The measurements were made at the summit ofMount Bachelor (43.979◦ N, 121.687◦ W; 2.7 km a.s.l.) bygas chromatography with electron capture detector duringspring 2008, 2009 and 2010. This dataset provides an ob-servational estimate of the month-to-month and springtimeinterannual variability of PAN mixing ratios in this region.Springtime seasonal mean (1 April–20 May) PAN mixing ra-tios at Mount Bachelor varied from 100 pptv to 152 pptv. Thestandard deviation of the three seasonal means was 28 pptv,21 % of the springtime mean. We summarize the interan-nual variability in three factors expected to drive PAN vari-ability: biomass burning, transport efficiency over the centraland eastern Pacific, and transport temperature.
Zhang et al. (2008) used the GEOS-Chem global chemi-cal transport model to show that rising Asian NOx emissionsfrom 2000 to 2006 resulted in a relatively larger positivetrend in PAN than O3 over western North America. How-ever the model results only considered monotonic changesin Asian emissions, whereas other factors, such as biomassburning, isoprene emissions or climate change can inducegreater variability in the atmospheric concentrations and thusextend the time needed for trend detection. We combined theobserved variability in PAN and O3 at Mount Bachelor witha range of possible future trends in these species to determinethe observational requirements to detect such trends. Thoughthe relative increase in PAN is expected to be larger than thatof O3, PAN is more variable. If PAN mixing ratios are cur-rently increasing at a rate of 4 % per year due to rising Asian
emissions, we would detect a trend with 13 years of mea-surements at a site like Mount Bachelor. If the correspondingtrend in O3 is 1 % per year, the trends in O3 and PAN wouldbe detected on approximately the same timescale.
1 Introduction
Ozone (O3) is regulated in the US under the Clean Air Act.Urban concentrations of O3 have been decreasing, but a sig-nificant fraction of the US population (∼40 %) is still ex-posed to harmful concentrations of this pollutant (Bell et al.,2004; Hubbell et al., 2005). The US Environmental Protec-tion Agency (EPA) revised the 8-hour O3 standard downwardto 75 ppbv in 2008. If a threshold for O3 health impacts ex-ists, it is well below this 75 ppbv (NRC, 2008), so a lowerstandard is currently under consideration. As backgroundconcentrations of this species rise, larger domestic emissionreductions will be required to offset the incremental contri-bution from non-domestic anthropogenic or natural sources(NRC, 2010; Jacob et al., 1999).
O3 concentrations have increased in the lower atmospheresince the late 1800s (Staehelin et al., 1994). The increase isprimarily attributed to a rise in precursor NOx (NO + NO2)
emissions from widespread industrialization and increasedbiomass burning, which caused tropospheric O3 productionto double (Horowitz, 2006). East Asia is currently the fastestgrowing source of O3 precursors, and emissions are projectedto continue to increase substantially through 2020 (Ohara etal., 2007). O3 concentrations in the Asian export region arerising rapidly (Lee et al., 1998), and there is evidence thatthe trend is larger toward the upper end of the O3 distribu-tion (Tanimoto, 2009). The impact of Asian emissions of O3
Published by Copernicus Publications on behalf of the European Geosciences Union.
5642 E. V. Fischer et al.: PAN and ozone at Mount Bachelor
precursors on North American O3 concentrations is twofold.O3 has a sufficient lifetime during spring (∼1 month) that O3exported directly from the Asian boundary layer (BL) canhave an impact on downwind regions (Heald et al., 2003;Jaegle et al., 2003). O3 is also produced in-transit from theexport of peroxyacetyl nitrate (PAN) (Jaegle et al., 2003).
There are multiple lines of evidence that springtime O3concentrations are increasing over western North America(Cooper et al., 2010; Chan and Vet, 2010; Parrish et al.,2009; Jaffe et al., 2003; Jaffe and Ray, 2007; NRC, 2010;Parrish et al., 2004). The most recent analysis by Cooperet al. (2010) showed a strong increase in lower free tropo-spheric (FT) springtime O3 mixing ratios from 1995 to 2008.They used a retroplume analysis to show that the rate of in-crease in O3 mixing ratios is greatest in air masses directlytransported from Asia. Parrish et al. (2009) also showed apositive trend (0.46 ppbv year−1) in springtime onshore flowof marine air along the North American west coast. HoweverO3 concentrations above the boundary layer (BL) at TrinidadHead, California do not show a significant change over thelast 10 years (Oltmans et al., 2008). As noted by Jaffe andRay (2007), the low frequency of ozonsondes limits the sta-tistical power of this dataset. Detection of O3 changes inthe northeastern Pacific FT is challenging because consistentobservations in this region are sparse. While most obser-vational studies have attributed the increase in O3 to risingAsian emissions, global chemical transport models underes-timate the observed increases in O3 (Fiore et al., 2009), un-dermining our confidence in the attribution.
There is evidence that that O3 production driven by thethermal decomposition of PAN can be significant over theeastern Pacific (Kotchenruther et al., 2001b; Fischer etal., 2010b; Yienger et al., 2000; Hudman et al., 2004).Peroxycarboxylic nitric anhydrides (PANs, chemical for-mula: RC(O)OONO2) are formed in the atmosphere throughthe same complex photochemistry that forms O3 (Roberts,2007). The formation of PANs involves several stages ofthe oxidation of non-methane volatile organic compounds(NMVOCs). Most NMVOCs can serve as PAN precur-sors though the yield varies (Roberts, 2007). The imme-diate precursors are the oxidation intermediates acetalde-hyde (CH3CHO), acetone (CH3C(O)CH3), and methylgly-oxal (CH3COCHO). Methylglyoxal is an oxidation productof isoprene (Paulot et al., 2009), a very reactive biogenicVOC with a temperature and sunlight dependent emissionrate (Guenther et al., 2006). The most abundant peroxycar-boxylic nitric anhydride is commonly called peroxyacetyl ni-trate (PAN, chemical formula: CH3C(O)OONO2).
PAN is often the most abundant member of the odd nitro-gen (NOy) family in the FT, and it is present at mixing ratiosranging from a few pptv in the remote marine atmosphereto several ppbv in polluted urban environments and biomassburning plumes (Singh and Salas, 1986; Ridley et al., 1990;Singh et al., 1990; Singh et al., 1998). The lifetime of PANis strongly dependent on air mass temperature. PAN is stable
in the mid-troposphere, which allows the compound to betransported on a hemispheric scale and serve as a reservoirfor reactive nitrogen. The main loss process for PAN below∼7 km is via thermal decomposition (CH3C(O)O2NO2 →
CH3C(O)O2 + NO2) (Talukdar et al., 1995). The dissociativelifetime of PAN is longer than 1 month at temperatures char-acteristic of the mid-troposphere in spring, but much shorter,on the order of 1 h, at 20◦C. PAN decomposes within sub-siding air masses to release NOx in remote areas, and mea-surements of PAN and NOx in the remote troposphere sup-port this view (Kotchenruther et al., 2001b; Singh and Salas,1986; Fischer et al., 2010b).
Our ability to detect trends in environmental data dependson the size of the trend, the magnitude of the variability, andthe autocorrelation of the observations (Weatherhead et al.,1998; Weatherhead et al., 2002; Tiao et al., 1990). To confi-dently detect a trend in a trace gas, it must be large relativeto both the natural variability and to the measurement uncer-tainty, or alternatively one needs many years of observations.
Jaffe et al. (2007) hypothesized that the impact of ris-ing Asian NOx emissions on US air quality should be de-tected more quickly in PAN than O3 due to the larger rela-tive change. Attribution of a trend in this species is also lesscomplicated because there is a smaller background. Basedon the GEOS-Chem calculation for the years 2000 and 2006,we expect a relatively larger percentage increase in PAN overthe eastern Pacific. The expected increase in PAN concentra-tions (∼3–5 % year−1) due to rising Asian emissions is largerthan that expected for O3 (∼0.5–1 % year−1) (Zhang et al.,2008). Therefore it may take less time to detect a trend inPAN than a trend in O3 (Jaffe et al., 2007). The current setof PAN observations over the northeast Pacific are discontin-uous and made from a range of platforms (Kotchenruther etal., 2001b; Nowak et al., 2004; Roberts et al., 2004; Wolfeet al., 2007; Zhang et al., 2008; Kotchenruther et al., 2001a).Thus, these observations are insufficient to establish a trendin this constituent or to quantify the true variability.
Here we present the first consistent multi-year spring-time measurements of PAN in the free troposphere overthe US Pacific Northwest. The measurements were madeat the summit of Mount Bachelor (43.979◦ N, 121.687◦ W;2.7 km a.s.l.) by gas chromatography with electron capturedetector during spring 2008, 2009, and 2010. These observa-tions will be an important benchmark for future observationalcampaigns targeting the influence of imported O3 precursorson air quality in this region. We also address the observa-tional requirements for detecting a rise in O3 or PAN due tochanges in Asian precursor emissions.
E. V. Fischer et al.: PAN and ozone at Mount Bachelor 5643
2 Methods
2.1 PAN measurements
Mount Bachelor Observatory (MBO) is located on the sum-mit of a dormant volcano in central Oregon (43.98◦ N121.7◦ W, 2763 m a.s.l.). The site was established in 2004.Observations from MBO have been used to explore the trans-port of CO, O3, reactive nitrogen, aerosols, and mercuryfrom Asia to the US (Fischer et al., 2010a,b, 2009; Reid-miller et al., 2010; Jaffe et al., 2005; Weiss-Penzias et al.,2006). PAN was measured at MBO by gas chromatogra-phy with electron capture detector (ECD) during four cam-paigns: 3 April–18 June 2008, 30 August–7 October 2008,26 March–20 May 2009, and 23 March–25 May 2010.
The sampling inlet is located on the roof of the MountBachelor summit lift building, and the instruments are lo-cated in two temperature controlled rooms within the build-ing, situated approximately 15 m lower than the inlet. Thegas phase species, including CO, O3, and PAN, were sam-pled through a 1/4′′ internal diameter PFA Teflon line, witha 1 µm Teflon filter located at the inlet. All instruments wereconnected to the line through a common Teflon manifold,and flow through the line was∼14 l min−1 resulting in aninlet residence time of∼2 s.
PAN was measured with a custom gas chromatograph withan electron capture detector (ECD). A detailed descriptionof this instrument is presented in Fischer et al. (2010b).Briefly, we used a 15 m Restek Rtx-200 ms (1 µm film thick-ness, 0.53 mm ID) capillary column at 20◦C, and a Shi-madzu Mini-2 ECD at 40◦C. The carrier gas and make upgas were ultra-high purity (UHP) helium (He) flowing at∼25 ml min−1 and UHP N2 flowing through the ECD at 2–3 ml min−1. Samples (1.5 ml) were injected every 10 min.Following Flocke et al. (2005), the sample loop and all con-necting tubing was 1/16′′ PEEK. The air masses encoun-tered at MBO have a similar range of water vapor mixingratios to those sampled during aircraft campaigns, thereforethe He was humidified using a hydrated salt cartridge whichminimized loss of PAN in the column, valve and connect-ing tubing (Flocke et al., 2005). This cartridge was changedmonthly.
We used a photochemical PAN calibration source simi-lar to that described by Roberts et al. (2004) and Wolfe etal. (2007). We assumed that the calibrator was 93± 7 % effi-cient in converting NO to PAN (Volz-Thomas et al., 2002;Warneck and Zerbach, 1992). Calibrations were accom-plished by manually switching the inlet line from the com-mon sampling manifold to the calibrator exhaust line. Asmall portion of the calibrator exhaust was pulled into thesample loop and calibration samples were handled similarlyto ambient samples. Multi-point calibrations were done ev-ery two weeks. We used an Airgas standard cylinder witha NO mixing ratio of 0.82± 0.01 ppm during spring 2008.This cylinder was compared to a 10.1 ppm National Insti-
tute of Standards and Technology (NIST)-traceable Scott-Marrin cylinder prior to and following the spring 2008 cam-paign. The concentration in the 10.1 ppm NO cylinder wasverified through an intercomparison with other NO cylin-ders. We used a 0.99± 0.01 ppm NO NIST-traceable Scott-Marrin cylinder during spring 2009 and 2010. Prior to eachcampaign, the NO mixing ratio was verified in this cylin-der through an intercomparison with 14 other cylinders con-taining a range of NO mixing ratios (0.5 ppmv–100 ppmv)(E. Williams, personal communication, 2010).
We estimate the accuracy of the PAN mixing ratio pro-duced by the calibrator to be 9 %. This was calculated asthe root sum of the squares of the error in all the calibrationcomponents, which includes the reported uncertainty in themixing ratios of the calibration gases (5.0 %), the uncertaintyof the flow controllers used to deliver the calibration gases tothe calibrator (1.7 %, 0.89 %, 0.29 % for the three flow con-trollers) and the uncertainty associated with the calibrator ef-ficiency (7.0 %). The estimated precision of the system is3.0 %. This is based on repeated sampling from the calibra-tor at a PAN mixing ratio of 470 pptv. At this mixing ratio,which corresponds to an average peak area of 36 area units,the standard deviation of the peak areas was 1.1 area units,or 3 % of the average area of the repeated samples.
We calculated uncertainty as the root sum of the squaresof the precision (3 %) and the accuracy (9 %). We estimatean on-site detection limit of∼15 pptv, and this correspondsto a peak height-to-baseline noise ratio of 3. The uncertaintyat levels well above the detection limit is 10 %. Since the de-tection limit is 15 pptv and the median mixing ratio for eachcampaign was>100 pptv, most observations were well abovethe detection limit. The average sensitivity throughout the2008, 2009, and 2010 campaigns was 13.9± 0.7, 14.1± 1.3,and 12.1± 0.9 (mean±1 standard deviation) pptv per areaunit.
2.2 Description of backward trajectories
We calculated backward trajectories to establish the trans-port history of the air masses impacting MBO. The resultspresented here are based on 10-day back trajectories initial-ized each hour from the summit of MBO using the HybridSingle-Particle Lagrangian Integrated Trajectory (HYSPLIT-4) model (Draxler and Rolph, 2003). These 10-day trajec-tories were calculated using global meteorological data fromthe GDAS (Global Data Assimilation System) archive, whichhas a time resolution of 3 hours, a spatial resolution of 1◦ lat-itude by 1◦ longitude, and a vertical resolution of 23 pressuresurfaces between 1000 and 20 hPa. The trajectories were ini-tialized at 1500 m above model ground level (amgl) sincethe GDAS model defines the terrain for the grid box contain-ing MBO significantly below the actual altitude of MountBachelor. Error in HYSPLIT trajectory calculations normalto the direction of flow are 10–30 % of the distance trav-eled after 24 h (Draxler and Hess, 1998). A trajectory is
5644 E. V. Fischer et al.: PAN and ozone at Mount Bachelor
30
Tables 938
Table 1: Number of springtime campaigns to detect a range of real trends in PAN or O3 in the 939
Eastern Pacific lower free troposphere with a probability of 95%. A real trend is indicated at the 940
95% confidence level. 941
Change in PAN at MBO (% / year) 1 2 3 4 5 6
Change in O3 at MBO (% / year) 0.25 0.5 0.75 1 1.25 1.5
Years of springtime observations to detect trend 31 20 15 13 11 10
942
Figures 943
944
945
Figure 1: a) Hourly average PAN mixing ratios at Mount Bachelor for three spring seasons. b) 946
Box and whisker plots of the hourly average PAN mixing ratios for the period with overlapping 947
data (April 1 – May 20). The small squares are the seasonal means. The whiskers represent the 948
5th
and 95th
percentiles, and the x’s represent the 1st and 99
th percentiles. 949
Fig. 1. (a)Hourly average PAN mixing ratios at Mount Bachelor for three spring seasons.(b) Box and whisker plots of the hourly averagePAN mixing ratios for the period with overlapping data (1 April–20 May). The small squares are the seasonal means. The whiskers representthe 5th and 95th percentiles, and the x’s represent the 1st and 99th percentiles.
not representative of the path of an air parcel within the BLbecause the parcel quickly loses its identity through mixingprocesses (Stohl, 1998). The HYSPLIT model is adequateto classify regional-scale air mass motions in the free tropo-sphere.
3 Results
3.1 PAN interannual variability at MBO
Figure 1 presents the hourly averaged PAN data for the spring2008, 2009 and 2010 campaigns. The year-to-year overlap-ping period is from 1 April–20 May. All comparisons be-tween years only use this period. General features of thePAN distribution can be seen in the time series in Fig. 1a.Fischer et al. (2010) show that synoptic scale weather sys-tems drive the bulk of the variability in observed PAN mixingratios at MBO, which occurs at a 3 to 4 day time scale. Notall episodes of elevated PAN are due to transport from Asiato North America; plumes containing elevated PAN mixingratios also originate from the North American boundary layer(Fischer et al., 2010b). Yet the highest hourly averaged PANmixing ratios observed during April 2008 and April 2009,381 and 534 pptv respectively, were associated with plumesthat originated outside of North America.
The PAN time series for April 2009 and April 2010 bothhad more structure than April 2008. The autocorrelation at1 h was 0.53 for April 2008, 0.93 for April 2009, and 0.95for April 2010. PAN mixing ratios below 75 pptv were alsomuch more frequent during April 2008 than in the followingyears. Consequently the monthly mean for April 2008 wasshifted down to 108 pptv as compared to 174 and 150 pptv,for April 2009 and April 2010 respectively. The mean PANmixing ratio for 1–20 May 2008 (91 pptv) was also lowerthan 2009 (117 pptv) and 2010 (144 pptv). To explore these
differences, we divided the data based on time of day toisolate FT/down slope influence air, (12:00 a.m.–10:00 a.m.Local Time) from BL/up slope influenced air (12:00 p.m.–06:00 p.m. Local Time). The differences in the monthlymean PAN mixing ratios were also present in these subsets,indicating that the variability in the PAN mixing ratios waspresent throughout the lower troposphere.
The box plots to the right (Fig. 1b) show the distributionof PAN for each spring. The standard deviation of the threeseasonal means was 28 pptv, or about 21 %. The mean PANmixing ratio for spring 2008 was significantly lower than in2009 and 2010, though the difference between the seasonalmean in 2009 and 2010 was not significant.
3.2 Comparison to other free tropospheric PANobservations in the Northeastern Pacific
Aircraft and surface measurements of PAN and NOy havebeen conducted over the northeast Pacific over the pastdecade. These past measurements have primarily beencampaign-based and are thus limited in temporal coverage(Kotchenruther et al., 2001b; Nowak et al., 2004; Roberts etal., 2004; Wolfe et al., 2007; Zhang et al., 2008; Kotchen-ruther et al., 2001a; Murphy et al., 2006). Figure 2 presentsthe mean PAN mixing ratios at MBO in the context of otherrecent observations over the Northeastern Pacific. Thoughaircraft observations have large advantages in understandingthe dynamics of individual plumes, which are often inten-tionally followed, they do not constitute random atmosphericsamples. The observations shown in Fig. 2 cover a long timespan, but the large latitudinal and vertical gradients in PANmixing ratios make previous data sets insufficient to deter-mine the interannual variability in PAN. Direct comparison isalso difficult because time lags between campaigns straddlethe springtime maximum in this species (Penkett and Brice,
E. V. Fischer et al.: PAN and ozone at Mount Bachelor 5645
31
950
Figure 2: Top: The location of MBO and previous airborne observations in the Eastern Pacific 951
Region (black boxes) (Roberts et al., 2004; Zhang et al., 2008; Kotchenruther et al., 2001a). 952
Bottom: Mean PAN mixing ratios during spring from MBO and previous airborne campaigns. 953
The latitude and longitude ranges shown in the map for the INTEX-B observations are associated 954
with samples collected between 2 and 3 km. The mean PAN mixing ratios observed at MBO 955
during spring 2006 was 340 pptv (Wolfe et al., 2007). 956
957
Fig. 2. Top: the location of MBO and previous airborne observa-tions in the Eastern Pacific Region (black boxes) (Roberts et al.,2004; Zhang et al., 2008; Kotchenruther et al., 2001a). Bottom:mean PAN mixing ratios during spring from MBO and previous air-borne campaigns. The latitude and longitude ranges shown in themap for the INTEX-B observations are associated with samples col-lected between 2 and 3 km. The mean PAN mixing ratio observedat MBO during spring 2006 was 340 pptv (Wolfe et al., 2007).
1986). Spring is a transitional time for PAN in the North-ern Hemisphere. PAN precursors build up in the winter andare available for PAN production during spring when photo-chemistry is more active (Roberts, 2007). Springtime tem-peratures are still cold enough to keep PAN loss rates lowerthan summertime.
Several general features can be seen from Fig. 2. (1) Thecampaign mean PAN mixing ratios observed in the easternnortheastern Pacific lower troposphere span 102–183 pptv.(2) The observed variability is due to differences in loca-tion, year, degree of plume chasing, and natural variability.(3) A consistent sampling strategy is reflected in the smallervariability at MBO compared to the overall variability in pre-vious observations.
Detecting trends in trace species amidst large underlyingvariability presents a challenge (Weatherhead et al., 2002).Later in this paper, we use the 2008–2010 MBO data to cal-culate the observational requirements for detecting a possibleincrease in PAN mixing ratios over the northeast Pacific due
to changes in Asian precursor emissions. The variability pre-sented in Fig. 2 is driven by both natural conditions and sam-pling choices. The relative standard deviation (RSD) of allthe campaign mean PAN mixing ratios presented in Fig. 2 is43 %, while the RSD of the overlapping MBO data (1 April–20 May) is 21 %. This illustrates that PAN observations col-lected at one site with one sampling method have a lowerRSD. Therefore they may be more useful for investigatorsinterested in detecting long-term changes to the photochem-ical environment over the northeastern Pacific.
As shown in Fig. 2, the DC-8 and C-130 sampled differentregions, and this clearly contributes to differences betweenthese two datasets. However, an intercomparison betweenthe DC-8 and C-130 measurements showed excellent agree-ment for O3, CO, and NO2, but the intercomparison for PANwas relatively poor. C-130 PAN measurements were 23 %higher than the DC-8. The reason for the discrepancy isnot known, and this is discussed in Chen et al. (2007) andSingh et al. (2009). Regardless, substantially higher maxi-mum PAN mixing ratios were observed during INTEX-B in2006 than at MBO during spring 2008–2010. Instrumentsonboard both the C-130 and DC-8 platforms observed PANmixing ratios over 1 ppbv between 2 and 3 km (not shown);however, the peak PAN mixing ratio observed at MBO dur-ing spring 2008–2010 was 657 pptv.
4 Drivers of PAN interannual variability
We expect that a variety of natural and anthropogenic factorscontribute to the observed PAN mixing ratios at a remote sitesuch as MBO. Sources of PAN, as well as transport patterns,are not necessarily consistent from year-to-year. This sectionexplores factors that could have contributed to observed vari-ability in PAN mixing ratios: biomass burning, transport effi-ciency over the central and eastern Pacific, and transport tem-perature. The discussion provides important contextual in-formation for future users of the MBO PAN data. In Sect. 5,we will use the variability observed in PAN at MBO to cal-culate the timeline for detecting a range of plausible trendsin this species. This calculation assumes that the MBO PANdata, collected over 3 spring seasons, does not underestimatethe true variability in this species. We show that there wereyear-to-year differences in several factors that are expectedto drive variability in PAN mixing ratios at MBO.
4.1 Variations in a PAN source: biomassburning emissions
Fires peak in southeastern Russia in spring. The annualburned area exhibits strong variability in magnitude and ge-ographical location (Vivchar, 2011). There was an early andunusually strong fire source in this region in spring 2008 dueto early snow melt, and the smoke was a source of both car-bonaceous aerosols and O3 precursors to the Arctic (Jacob et
5646 E. V. Fischer et al.: PAN and ozone at Mount Bachelor
al., 2010; Warneke et al., 2009). PAN can form rapidly inboreal smoke plumes, with approximately 40 % of the ini-tial NOx emissions converted to PAN within a few hoursof emission (Alvarado et al., 2010). Plumes from the LakeBaikal area, containing PAN mixing ratios up to∼500 pptv,were also observed at MBO during spring 2008 (Fischer etal., 2010b, see Fig. 5). Biomass burning sources in south-ern Siberia have previously been shown to be an importantsource of many trace species to the Pacific Northwest lowertroposphere (Jaffe et al., 2004). Although direct transport isless frequent, fires in Southeast Asia can also have an impacton the trace gases in the Northeastern Pacific, especially dur-ing El Nino events which typically bring drought conditionsto Southeast Asia (Jaffe et al., 2001 and references within).
Though the impact of the Russian fires is evident in severalplumes of elevated PAN (Fischer et al., 2010), mean PANmixing ratios at MBO during spring 2008 were lower thanthe following two years. Mean CO mixing ratios at MBOfor 1 April–20 May were 135, 133, and 159 ppbv for 2008,2009, and 2010, respectively. Thus the extreme fire year insoutheastern Russia also did not produce anomalously highmean springtime CO at MBO. This is in contrast to previouswork showing a strong link between seasonal mean CO atMBO and anomalously strong biomass burning in SoutheastAsia (Reidmiller et al., 2009b).
Calculations presented later in the paper (Sect. 5) implic-itly assume that the three years of PAN data from MBOrepresent the true variability in this species. The observa-tion period at MBO did coincide with an extreme fire seasonin southeastern Russia. Unless relatively weak transpacifictransport during spring 2008 acted to reduce the impact ofthese fires on western North America, the MBO PAN obser-vations do not underestimate this driver of variability.
4.2 Transport direction/efficiency
The amount of PAN observed at MBO is dependent on thetransport pathway of the air mass. Average backgroundPAN mixing ratios tend to increase with altitude and latitude,though the altitudinal dependence in the lower FT is smallcompared to the overall range (Roberts, 2007; Roberts et al.,2004). Air that has been transported through the warmerlower troposphere, especially at low latitudes, will be de-pleted in PAN. Similarly, air that has been transported athigher altitudes and colder latitudes will retain more of thePAN that has formed (Nowak et al., 2004).
A number of global chemical transport models indicatethat East Asian emissions make a substantial contribution toobserved PAN mixing ratios at MBO (Berntsen and Karls-dottir, 1999; Fiore et al., 2010). April is the month ofstrongest mid-latitude transpacific transport, and the interan-nual variability in the transport is relatively low compared toother months of the year (Liu et al., 2005). While the in-terannual variability in transport is low, it is not zero (Lianget al., 2005). LRT3 Long-Range Transport Index 3 (LRT3)
is an index based on monthly sea level pressure anomaliesover the Pacific. It was developed using a 10-year simula-tion from the global chemical transport model GEOS-Chem(Liang et al., 2005). Positive LRT3 values indicate strongPacific High and Aleutian Low pressure systems. LRT3 iscorrelated with the Pacific/ North American teleconnectionpattern (PNA) (R = 0.69) (Liang et al., 2005). This indexwas developed using a global simulation of CO, which is ex-pected to be a good marker of transpacific transport due to itslong lifetime (∼2 months).
Based on the LRT3 index, April 2008 was characterizedby weaker than average transpacific transport (LRT3 =−1.2).Transpacific transport was also relatively weak in April(LRT3 =−0.98) and May 2009 (LRT3 =−1.0), when spring-time mean PAN mixing ratios at MBO were highest. April2010 was characterized by relatively strong transpacifictransport (LRT= 1.2). A linear regression of six years ofApril and May CO at MBO versus LRT3 produces a posi-tive relationship, but the correlation coefficient is not signif-icantly different from zero. We focus the remainder of thediscussion on variability in transport over the eastern Pacific.We summarize horizontal and vertical transport to MBO dur-ing the 2008, 2009 and 2010 spring seasons using both back-ward trajectories (Draxler and Rolph, 2003) and synopticscale motion at 700 hPa geopotential height. Reidmiller etal. (2010) showed that the vast majority of air arriving atMBO during spring has travelled north of∼35◦ N.
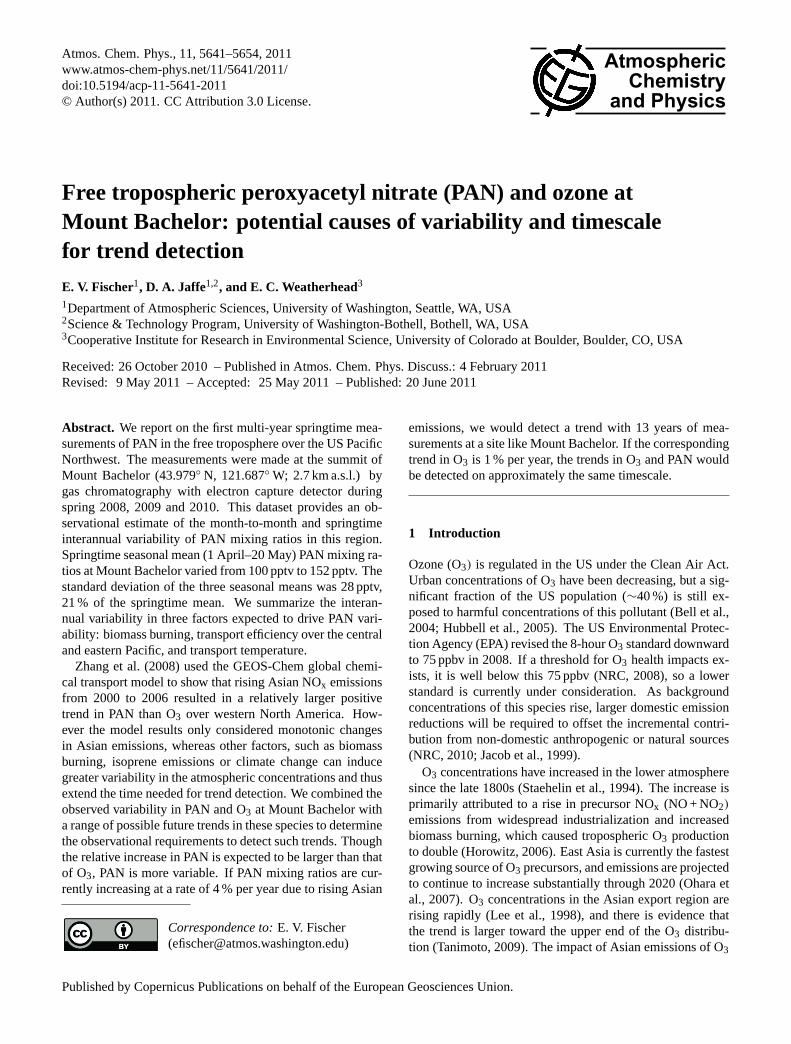
Figure 3 presents a summary of the hourly endpoints from10-day backward HYSPLIT trajectories. A trajectory wasinitialized from the summit of MBO each hour for the 50-day period of 1 April to 20 May, thus each plot represents1200 individual trajectory calculations. These trajectory den-sity plots were created by counting the number of hourlytrajectory points within 200 km of each latitude and longi-tude point. With the goal of highlighting the largest differ-ences in horizontal transport between the spring seasons, thecounts were mapped using a log scale. All trajectories wererun for the same amount of time, so trajectories crossinglonger distances represent faster moving air masses. Figure 3shows that the relatively high speed transport from the north,that was common in spring 2008 and 2009, was reduced inspring 2010. Unlike the previous years, the highest observedPAN mixing ratio (543 pptv hourly average on 11 April) dur-ing spring 2010 was associated with transport from the USboundary layer.
The broad features illustrated by the trajectory analysisin Fig. 3 are corroborated by NCEP/NCAR reanalysis fields(not shown). We examined composites of the following fieldsat 700 hPa: geopotential height, temperature, vector winds,and vertical velocity. These fields are produced using mete-orological observations from surface sites, ships, rawinson-des, aircraft, and satellites. The data assimilation system isdescribed by Kalnay (1996), and the data can be accessedat http://www.esrl.noaa.gov/psd/data/composites/day/. The700 hPa geopotential heights confirm more southwesterly
E. V. Fischer et al.: PAN and ozone at Mount Bachelor 5647
32
958
Figure 3: Horizontal distribution of air mass transport to MBO during the period 1April – 20 959
May for 2008, 2009, and 2010. These maps were created from 10-day HYSPLIT backward 960
trajectories initialized from MBO each hour. The colors represent the number of points within a 961
200 km radius of each latitude and longitude point. Note the log scale. 962
963
Fig. 3. Horizontal distribution of air mass transport to MBO during the period 1 April – 20 May for 2008, 2009, and 2010. These maps werecreated from 10-day HYSPLIT backward trajectories initialized from MBO each hour. The colors represent the number of points within a200 km radius of each latitude and longitude point. Note the log scale.
33
964
965
Figure 4: Vertical distribution of air mass transport to MBO during April and May 2008 to 966
2010. These maps are created from 10-day HYSPLIT backward trajectories initialized from 967
MBO each hour. Top: Mean trajectory temperature for April (line) with 95% confidence 968
interval (shading). Middle: Mean trajectory height for April (line) with 95% confidence interval 969
(shading). Bottom: As above, but for May 1 – 20. 970
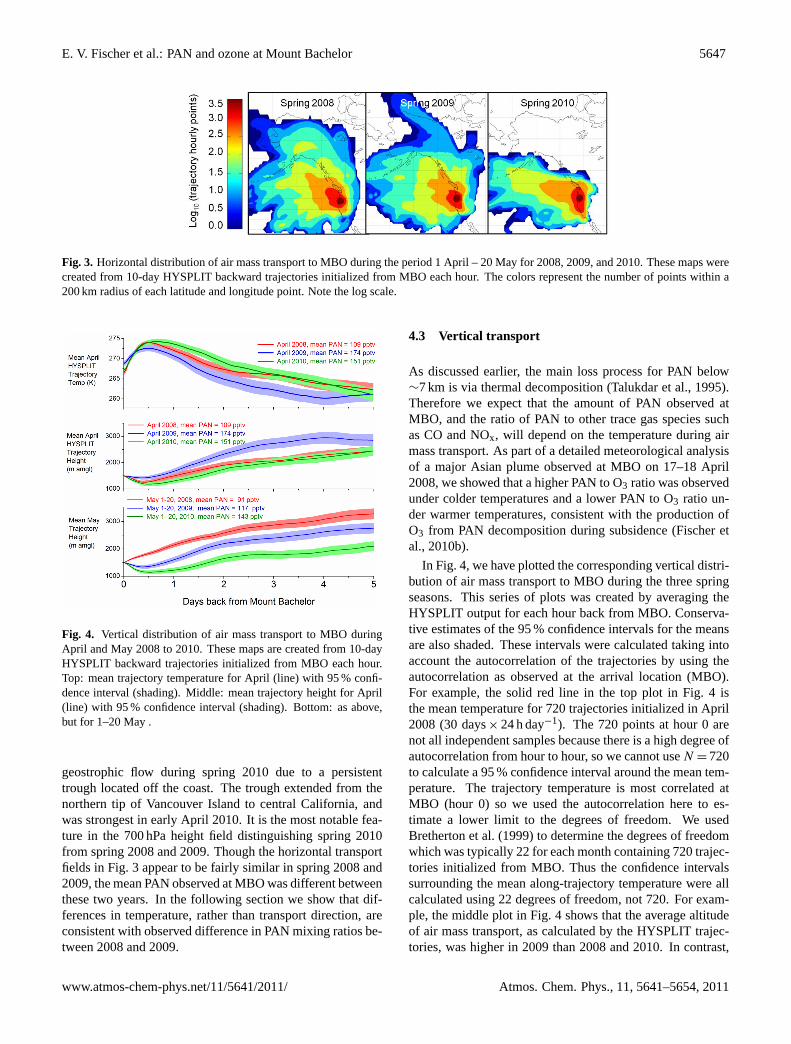
Fig. 4. Vertical distribution of air mass transport to MBO duringApril and May 2008 to 2010. These maps are created from 10-dayHYSPLIT backward trajectories initialized from MBO each hour.Top: mean trajectory temperature for April (line) with 95 % confi-dence interval (shading). Middle: mean trajectory height for April(line) with 95 % confidence interval (shading). Bottom: as above,but for 1–20 May .
geostrophic flow during spring 2010 due to a persistenttrough located off the coast. The trough extended from thenorthern tip of Vancouver Island to central California, andwas strongest in early April 2010. It is the most notable fea-ture in the 700 hPa height field distinguishing spring 2010from spring 2008 and 2009. Though the horizontal transportfields in Fig. 3 appear to be fairly similar in spring 2008 and2009, the mean PAN observed at MBO was different betweenthese two years. In the following section we show that dif-ferences in temperature, rather than transport direction, areconsistent with observed difference in PAN mixing ratios be-tween 2008 and 2009.
4.3 Vertical transport
As discussed earlier, the main loss process for PAN below∼7 km is via thermal decomposition (Talukdar et al., 1995).Therefore we expect that the amount of PAN observed atMBO, and the ratio of PAN to other trace gas species suchas CO and NOx, will depend on the temperature during airmass transport. As part of a detailed meteorological analysisof a major Asian plume observed at MBO on 17–18 April2008, we showed that a higher PAN to O3 ratio was observedunder colder temperatures and a lower PAN to O3 ratio un-der warmer temperatures, consistent with the production ofO3 from PAN decomposition during subsidence (Fischer etal., 2010b).
In Fig. 4, we have plotted the corresponding vertical distri-bution of air mass transport to MBO during the three springseasons. This series of plots was created by averaging theHYSPLIT output for each hour back from MBO. Conserva-tive estimates of the 95 % confidence intervals for the meansare also shaded. These intervals were calculated taking intoaccount the autocorrelation of the trajectories by using theautocorrelation as observed at the arrival location (MBO).For example, the solid red line in the top plot in Fig. 4 isthe mean temperature for 720 trajectories initialized in April2008 (30 days× 24 h day−1). The 720 points at hour 0 arenot all independent samples because there is a high degree ofautocorrelation from hour to hour, so we cannot useN = 720to calculate a 95 % confidence interval around the mean tem-perature. The trajectory temperature is most correlated atMBO (hour 0) so we used the autocorrelation here to es-timate a lower limit to the degrees of freedom. We usedBretherton et al. (1999) to determine the degrees of freedomwhich was typically 22 for each month containing 720 trajec-tories initialized from MBO. Thus the confidence intervalssurrounding the mean along-trajectory temperature were allcalculated using 22 degrees of freedom, not 720. For exam-ple, the middle plot in Fig. 4 shows that the average altitudeof air mass transport, as calculated by the HYSPLIT trajec-tories, was higher in 2009 than 2008 and 2010. In contrast,
5648 E. V. Fischer et al.: PAN and ozone at Mount Bachelor
the confidence intervals show that there is no significant dif-ference in transport altitude between April 2008 and April2010. Though the horizontal transport fields in Fig. 3 appearto be fairly similar in 2008 and 2009, the mean temperatureat which air was transported to MBO was different duringApril 2008 and 2009 (Fig. 4a), and this is consistent with theobserved difference in PAN mixing ratios. It is possible toestimate PAN decomposition using the temperatures alongthe HYSPLIT trajectories. The mean temperature along thetrajectories was an average of 3◦C colder during 2009 overapproximately 5 days. The lifetime of PAN is dependent ontemperature and the NO2/NO ratio because of cycling be-tween PAN and the acetyl peroxy radical (CH3CO3). Reac-tion of CH3CO3with NO2 does not lead to a net loss of PAN,while reaction with NO or with other species (e.g. HO2 orRO2) does. An adjustment accounting for the cycling be-tween PAN and CH3CO3 acts to extend the lifetime of PAN(Jacob et al., 1996; Roberts, 2007; Brasseur et al., 1999).
We used the mean temperature along the April 2008 tra-jectories with the monthly average PAN (175 pptv) duringApril 2009 to calculate the potential PAN difference due tothermal decomposition. Following Brasseur et al. (1999), weassumed a within plume NO2 to NO ratio of 1.5, based on av-erage plume statistics during ITCT 2K2 (Nowak et al., 2004),and calculated an effective average lifetime of PAN whichaccounted for cycling between PAN and CH3CO3. If all elsewas equal between April 2008 and 2009, this calculation sug-gests that more than 50 % of the difference in PAN betweenthe two months (108 versus 175 pptv) could be explained bydifferences in temperature during the last 5 days of transportto MBO. This is a coarse calculation because it uses meantemperature. For example, temperatures for a month couldbe the same, but one month could experience greater temper-ature extremes (high and low) and could experience a differ-ent amount of PAN dissociation. However, temperature is theonly factor we were able to identify that is consistent with thehigher PAN mixing ratios observed at MBO in spring 2009.
In addition to rapid transport from more northern latitudes,the HYSPLIT backward trajectories show that the air de-scended from higher altitudes (lower pressures) during April2009 as compared to the 2008 and 2010 (Fig. 4b). Therelatively stronger descent in April 2009 is corroborated by700 mb omega fields from NCEP reanalysis. Consistent withthe persistent trough off the west coast mentioned earlier, thereanalysis fields also show a large region of anomalous as-cent during April 2010 over western Oregon and NorthernCalifornia.
With the exception of the last several hours of transport,the average along-trajectory temperature profiles were notsignificantly different between May 2008, 2009 and 2010(not shown). Though the mean air mass temperatures werecomparable, the trajectories show that the air descended fromhigher altitudes (lower pressures) during May 2008 as com-pared to 2009 and 2010 (Fig. 4c). Similar to April, the tra-jectories for May 2010 show that on average the air travelled
to MBO from lower altitudes than previous years. Consis-tent with air mass transport from lower altitudes, a highermedian water vapor mixing ratio was observed at MBO dur-ing spring 2010. The trajectories are also consistent with aregion of anomalously strong ascent over Oregon present inthe 700 mb omega field during May 2010, and the region ofanomalously strong descent in the same region in May 2008.Although the air reaching MBO during May 2010 was trans-ported at significantly lower altitudes than previous years, thelower troposphere was colder than average in May 2010 overthe eastern Pacific and western North America. Because ofthis, the differences in transport height do not correspond tosignificant differences in transport temperature during May.
4.4 Other potential natural drivers of PAN variability
Isoprene photochemistry can be a strong source of PAN(Roberts et al., 2006). Fiore et al. (2010) showed that interan-nual variability in isoprene emissions, which can be as largeas 20–30 % in summer months (Palmer et al., 2006; Mulleret al., 2008), can influence seasonally averaged PAN mixingratios downwind. However this impact is most pronouncedin summer months when isoprene emissions are largest, andit is not likely to have driven the differences we observedduring spring (Fiore et al., 2011, 2010).
Another factor determining the re-distribution of NOy isthe vertical transport out of the East Asian and Europeanplanetary boundary layers. Aircraft campaigns have shownthat variability in the amount of vertical transport out ofEast Asia impacts the amount of PAN that moves down-wind (Roberts et al., 2004; Nowak et al., 2004; Russo etal., 2003). However Liang et al. (2005) suggest that transpa-cific transport is mainly dependent on the meteorology in theeastern half of the Pacific. The passage of mid-latitude cy-clones, which are thought to provide the dominant pathwaysfor pollutant export from Asia (Bey et al., 2001), constantlyreplenish the “pool of Asian pollution in the western Pacific”(Liang et al., 2005). It should be noted that certain scales ofvertical transport are difficult to simulate in global chemicaltransport models.
5 Detecting changes in PAN and O3 over NorthAmerica from Increasing Asian Emissions
Jaffe et al. (2007) hypothesized that rising NOx emissionsshould be detected more quickly in changes in PAN in theNortheast Pacific FT than changes in O3. This hypothesisfollowed from model simulations suggesting that the relativetrend in PAN caused by rising Asian NOx emissions wouldbe approximately 4 times larger than that of O3 (Zhang et al.,2007). Detecting trends in atmospheric trace species, suchas O3 or PAN, depends on the size of the trend, the magni-tude of the variability, and the autocorrelation of the observa-tions (Weatherhead et al., 1998, 2002; Tiao et al., 1990). The
E. V. Fischer et al.: PAN and ozone at Mount Bachelor 5649
Table 1. Number of springtime campaigns to detect a range of real trends in PAN or O3 in the Eastern Pacific lower free troposphere with aprobability of 95 %. A real trend is indicated at the 95 % confidence level.
Change in PAN at MBO (% year−1) 1 2 3 4 5 6
Change in O3 at MBO (% year−1) 0.25 0.5 0.75 1 1.25 1.5
Years of springtime observations to detect trend 31 20 15 13 11 10
data presented in Fig. 1 is the best dataset available to de-termine the variability and temporal autocorrelation in PANin the lower FT over the Northeastern Pacific, and we usethe MBO PAN observations to determine the observationalrequirements for the assessment of a trend in PAN due to ris-ing Asian precursor emissions. We present a parallel analysisfor O3, also using observations from MBO.
Zhang et al. (2008) assessed the impact of rising Asianemissions on PAN mixing ratios at MBO through two GEOS-Chem simulations for the INTEX-B period (April–May2006). The first simulation used a year 2000 emissions in-ventory for anthropogenic emissions for Asia (8◦ N–50◦ N,80◦ E–150◦ E) (Streets et al., 2003), and the second simu-lation used a 2006 emissions inventory for the same Asianregion which was 41 % higher for CO, 45 % higher for non-methane volatile organic compounds (NMVOCs), and 200 %higher for NOx emissions. The estimate for 2006 NOx emis-sions was constrained using OMI NO2 data. Biomass burn-ing emissions were not changed in the two different simula-tions. The higher emission scenario increased the mean PANmixing ratio at MBO for the INTEX-B period from 138 pptvto 167 pptv, or approximately 3.5 % per year. Mean O3 atMBO increased from 49.6 to 52.5 ppbv, or 0.97 % per year.The model estimate is consistent with the observed +1 % peryear O3 trend observed by Cooper et al. (2010) and Parrishet al. (2009).
The trend estimates presented in Zhang et al. (2008) areassociated with substantial uncertainty, due in a large part touncertain emission estimates. Zhang et al. (2008) discussuncertainties in the emission inventories and the availableconstraints on Asian anthropogenic NOx emissions. Thoughemission rates of O3 and PAN precursors are expected to con-tinue to increase through 2020 (Ohara et al., 2007) the exactmagnitude of the change is also highly uncertain. Past trendsare not a predictor for future trends because many factorswill influence future PAN and O3 trends including a chang-ing climate, varying stratosphere-troposphere exchange andchanges to anthropogenic and natural emissions.
Given the large uncertainty in the model-derived trend es-timate, we use a range of trends with the observed variabilityto predict the timeline for trend detection. The following sen-tences describe how we applied a simple bootstrapping pro-cedure to 4-day average PAN mixing ratios to predict when atrend in this species would be detectable at MBO. Using all
34
971
Figure 5: a) Random distribution of 4-day average springtime PAN mixing ratios at MBO for 972
the period 2008 - 2010 propagated forward with a + 4% per year trend. The R2 and p-values for 973
this example are 0.06 and 2.8*10-3
respectively. b) Random distribution of 4-day average 974
springtime O3 mixing ratios at MBO for the period 2004 - 2009 propagated forward with a + 1% 975
per year trends. The R2 and p-values for this example are 0.07 and 6.6*10
-4 respectively. The 976
time series are examples of those used to determine the probability of trend detection. Linear fits 977
are shown for each time series. See Table 1 for a range of PAN and O3 trends. 978
979
Fig. 5. (a) Random distribution of 4-day average springtime PANmixing ratios at MBO for the period 2008–2010 propagated forwardwith a +4 % per year trend. The R2 and p-values for this exampleare 0.06 and 2.8× 10⁻³, respectively.(a) Random distribution of4-day average springtime O3 mixing ratios at MBO for the period2004–2009 propagated forward with a +1 % per year trends. TheR2 andp-values for this example are 0.07 and 6.6× 10⁻⁴, respec-tively. The time series are examples of those used to determine theprobability of trend detection. Linear fits are shown for each timeseries. See Table 1 for a range of PAN and O3 trends.
available springtime PAN data from MBO, we degraded thehourly averaged PAN mixing ratios shown in Fig. 1 to a timeseries of non-overlapping 4-day averages for each season.This choice of averaging time reduces the autocorrelation inthe seasonal data sets of 4-day averages to 0.30, 0.08, and0.43 in 2008, 2009, and 2010, respectively. This timescalealso reflects the physics of the system; synoptic scale changesin transport drive 2–5 day perturbations in PAN mixing ra-tios (Bernsten et al., 1999; Fischer et al., 2010b). The timeseries in Fig. 5a was generated by randomly sampling the
5650 E. V. Fischer et al.: PAN and ozone at Mount Bachelor
4-day average PAN mixing ratios repeatedly from all threespring seasons. The randomly selected PAN averages werethen added to a hypothetical PAN trend. Thirteen 4-day aver-age points were chosen for each spring season, to be consis-tent with the length of the data from the previous springtimecampaigns. By sampling average PAN from the multi-yearMBO dataset, we are able to include both synoptic scale andinterannual variability in the calculation. We incorporate theactual variability in PAN, regardless of whether we fully un-derstand all the drivers, so we can develop a reasonable ex-pectation of when possible trends could be detected (Weath-erhead et al., 2002). We considered a range of hypotheticalfuture trends, and for each trend a time series like Fig. 5awas generated 1000 times. Figure 5a is one example. Foreach time series, we calculated the correlation coefficient forPAN against time as well and the corresponding t-statistic.We repeated the same bootstrapping procedure using spring-time MBO O3 data (Fig. 5b).
Table 1 presents the calculation described above for arange of possible PAN and O3 trends at MBO, ignoring au-tocorrelation for this exercise. For example, thirteen years ofspringtime PAN data at MBO would be required to detect areal +4 % per year trend in PAN with a probability of 95 %,where a real trend is indicated at the 95 % confidence level.The calculations show that the timescale for PAN and O3trend detection is equivalent when the PAN trend is 4 timeslarger than the O3 trend. This reflects the greater variabil-ity associated with PAN, compared to O3. Interestingly thecalculations of Zhang et al. (2008) suggest that the PAN andO3 trends between 2000 and 2006 may have been close tothis ratio. If the trends were to continue at this same rate(∼3.5 % and∼1 % per year, respectively), both trends couldbe detected in the free troposphere at MBO with about 13years of observations. However, some care should be usedin interpreting the results from the global model since thereare large uncertainties associated with the emissions of bothNOx and NMHCs (Zhang et al., 2008), non-linearities in thechemistry, and changes in natural sources and other processthat are difficult to model (Reidmiller et al., 2009a; Wu et al.,2007). Thus long term observations of both PAN and O3 areneeded to verify modeled trends. Several previous analysesof O3 and PAN trends have used data from multiple sites withcomplex data segregation schemes. This was done due to thefact that no single site existed in this region with long termdata (Parrish et al., 2004, 2009; Cooper et al., 2010). Ouranalysis suggests that if the true O3 trend over western NorthAmerica due to rising Asian precursor emissions is on theorder of 1 % per year, it could be corroborated at a site likeMBO in a relatively short timeframe with a direct analysis ofmean O3 concentrations. Further information on attributioncan be obtained with data segregation techniques and chem-ical modeling studies.
6 Conclusions
We have presented the first consistent multi-year springtimemeasurements of PAN in the free troposphere over the USPacific Northwest. These observations will be an importantbenchmark for future campaigns targeting the influence ofimported O3 precursors on air quality in this region. Spring-time average PAN mixing ratios at MBO vary by∼21 %inter-annually. We explored the impact of temperature, trans-pacific transport efficiency, and Siberian biomass burning onthe seasonally averaged PAN mixing ratios. We show thatthe observations represent a range of atmospheric conditionswhich help to understand the variability observed in the PANmixing ratios at MBO. Colder air mass transport from higheraltitudes in April 2009 is the only factor we found that is con-sistent with the higher average PAN mixing ratios observedat MBO during this season.
PAN observations can provide key information to attributechanges in O3, NOx, and NMHCs. Based on estimated,but highly uncertain, emissions changes in Asia, Zhang etal. (2008) calculate a trend in PAN and O3 in the free tro-posphere over the northeastern Pacific of 3.5 and 1.0 % peryear for 2000 to 2006. If these hypothesized trends were tocontinue, we expect that trends in both PAN and O3 can bedetected with 95 % confidence with 13 years of consistentobservations at a FT site.
Detection of changes in the reactive nitrogen and O3 bud-gets in the northeastern Pacific free troposphere will continueto be challenging without a consistent set of observations inthis region. Routine free tropospheric O3 measurements aresparse, and the longest records in western North America arefrom weekly ozonesonde profiles from three locations, onlyone of which is on the west coast. There are even fewer ob-servations of PAN, though a trend in this species is expectedto be larger and would be significantly easier to attribute. Ouranalysis shows that if O3 precursor emissions continue to risein East Asia at current rates, we are certain to detect a trend ina relatively short amount of time with a consistent set of ob-servations at higher altitudes. Understanding the precursorsto O3 and how they may be changing is critical to protectingenvironmental and human health. Estimating and attributingfuture tropospheric O3 concentrations will require continua-tion of PAN and O3 measurements at strategic locations.
Acknowledgements.Emily V. Fischer was supported by a Depart-ment of Energy Graduate Research Environmental Fellowship.Support for the Mount Bachelor Observatory was provided bythe National Science Foundation under Grant ATM-0724327. Wewould like to thank Frank Flocke for loaning us the ECD used inthe custom gas chromatograph, and Eric Williams for verifying themixing ratio in the NO tank used for calibrations. We also wishto extend our gratitude to Lynn McMurdie for helpful discussionsregarding synoptic scale transport to Mount Bachelor, to QingLiang for providing the monthly LRT3 index, and to Lin Zhangfor providing the GEOS-Chem time series of PAN at MBO. Wealso acknowledge the support provided by the Mount Bachelormaintenance staff.
E. V. Fischer et al.: PAN and ozone at Mount Bachelor 5651
Edited by: W. Ward
References
Alvarado, M. J., Logan, J. A., Mao, J., Apel, E., Riemer, D., Blake,D., Cohen, R. C., Min, K.-E., Perring, A. E., Browne, E. C.,Wooldridge, P. J., Diskin, G. S., Sachse, G. W., Fuelberg, H.,Sessions, W. R., Harrigan, D. L., Huey, G., Liao, J., Case-Hanks,A., Jimenez, J. L., Cubison, M. J., Vay, S. A., Weinheimer, A.J., Knapp, D. J., Montzka, D. D., Flocke, F. M., Pollack, I.B., Wennberg, P. O., Kurten, A., Crounse, J., Clair, J. M. St.,Wisthaler, A., Mikoviny, T., Yantosca, R. M., Carouge, C. C.,and Le Sager, P.: Nitrogen oxides and PAN in plumes from bo-real fires during ARCTAS-B and their impact on ozone: an in-tegrated analysis of aircraft and satellite observations, Atmos.Chem. Phys., 10, 9739–9760,doi:10.5194/acp-10-9739-2010,2010.
Bell, M. L., McDermott, A., Zeger, S. L., Samet, J. M., and Do-minici, F.: Ozone and short-term mortality in 95 US urban com-munities, 1987–2000, JAMA-J. Am. Med. Assoc., 292, 2372–2378, 2004.
Bergin, M. S., West, J., Keating, T. J., and Russell, A. G.: Re-gional atmospheric pollution and transboundary air quality man-agement, The Annual Review of Environment and Resources,30, 1–37, 2005.
Berntsen, T. K. and Karlsdottir, S.: Influence of Asian emissions onthe composition of air reaching the North Western United States,Geophys. Res. Lett., 26, 2171–2174, 1999.
Bernsten, T. J., Karlsdottir, S., and Jaffe, D.: Influence of Asianemissions on the composition of air reaching the north westernUnited States, Geophys. Res. Lett., 26, 2171–2174, 1999.
Bey, I., Jacob, D. J., Logan, J. A., and Yantosca, R. M.: Asianchemical outflow to the Pacific in spring: Origins, pathways, andbudgets, J. Geophys. Res., 106, 23,097–023,113, 2001.
Brasseur, G. P., Orlando, J. J., and Tyndall, G. S.: AtmosphericChemistry and Global Change, Oxford University Press, NewYork, USA, 654 pp., 1999.
Bretherton, C. S., Widmann, M., Dymnikov, V. P., Wallace, J. M.,and Blade, I.: The effective number of spatial degrees of freedomof a time-varying field, J. Climate, 12, 1990–2009, 1999.
Chan, E. and Vet, R. J.: Baseline levels and trends of ground levelozone in Canada and the United States, Atmos. Chem. Phys., 10,8629–8647,doi:10.5194/acp-10-8629-2010, 2010.
Chen, G., Kleb, M. M., Brune, W. H., and Flocke, F. M.:An Overview of INTEX-B/MILAGRO/IMPEX Instrument andMeasurement Intercomparison, Eos Trans. AGU, 88, A33A–0817, 2007.
Cooper, O. R., Parrish, D. D., Stohl, A., Trainer, M., Nedelec, P.,Thouret, V., Cammas, J. P., Oltmans, S. J., Johnson, B. J., Tara-sick, D., Leblanc, T., McDermid, I. S., Jaffe, D. A., Gao, R.,Stith, J., Ryerson, T. B., Aikin, K., Campos, T., Weinheimer, A.J., and Avery, M. A.: Increasing springtime ozone mixing ratiosin the free troposphere over western North America, Nature, 463,344–348, 2010.
Draxler, R. R. and Hess, G. D.: An overview of the HYSPLIT4modelling system for trajectories, dispersion, and deposition,Aust. Meteorol. Mag., 47, 295–308, 1998.
Draxler, R. R. and Rolph, G. D.: HYSPLIT (HYbrid Single-ParticleLagrangian Integrated Trajectory) Model access via NOAA ARLREADY Website (http://www.arl.noaa.gov/ready/hysplit4.html),NOAA Air Resources Laboratory, Silver Spring, M.D., 2003.
Fiore, A. M., Dentener, F. J., Wild, O., Cuvelier, C., Schultz, M. G.,Hess, P., Textor, C., Schulz, M., Doherty, R. M., Horowitz, L.W., MacKenzie, I. A., Sanderson, M. G., Shindell, D. T., Steven-son, D. S., Szopa, S., Van Dingenen, R., Zeng, G., Atherton, C.,Bergmann, D., Bey, I., Carmichael, G. R., Collins, W. J., Dun-can, B. N., Faluvegi, G., Folberth, G., Gauss, M., Gong, S. L.,Haugustaine, D., Holloway, T., Isaksen, I. S. A., Jacob, D. J.,Jonson, J. E., Kaminski, J. W., Keating, T. J., Lupu, A., Marner,E., Montanaro, V., Park, R. J., Pitari, G., Pringle, K. J., Pyle, J.A., Schroeder, S., Vivanco, M. G., Wind, P., Wojcik, G., Wu, S.,and Zuber, A.: Multimodel estimates of intercontinental source-receptor relationships for ozone pollution, J. Geophys. Res., 114,D04301,doi:10.1029/2008JD010816, 2009.
Fiore, A. M., Jaffe, D., Fischer, E., Staehelin, J., Pandey, S., Stein-bacher, M., Zellweger, C., and Team, H. M.: Measured and mod-eled PAN mixing ratios in the free troposphere, Symposium onAtmospheric Chemistry and Physics at Mountain Sites, Inter-laken, Switzerland, 8–10 June, 2010, 2010.
Fiore, A. M., Levy II, H., and Jaffe, D. A.: North American isopreneinfluence on intercontinental ozone pollution, Atmos. Chem.Phys., 11, 1697–1710,doi:10.5194/acp-11-1697-2011, 2011.
Fischer, E. V., Hsu, N. C., Jaffe, D. A., Jeong, M.-J., and Gong,S. L.: A decade of dust: Asian dust and springtime aerosol loadin the US Pacific Northwest, Geophs. Res. Lett., 36, L03821,doi:10.1029/2008GL036467, 2009.
Fischer, E. V., Jaffe, D. A., Marley, N. A., Gaffney, J. S., andMarchany-Rivera, A.: Optical properties of aged Asian aerosolsobserved over the US Pacific Northwest, J. Geophys. Res., 115,D20209, doi:10.1029/2010JD013943 2010a.
Fischer, E. V., Jaffe, D. A., Reidmiller, D. R., and Jaegle, L.: Me-teorological controls on observed peroxyacetyl nitrate (PAN) atMount Bachelor during the spring of 2008, J. Geophys. Res.,115, D03302,doi:10.1029/20092009JD20012776, 2010b.
Flocke, F., Weinheimer, A. J., Swanson, A. L., Roberts, J. M.,Schmitt, R., and Shertz, S.: On the measurement of PANs bygas chromatography and electron capture detection, J. Atmos.Chem., 52, 19–43, 2005.
Guenther, A., Karl, T., Harley, P., Wiedinmyer, C., Palmer, P. I.,and Geron, C.: Estimates of global terrestrial isoprene emissionsusing MEGAN (Model of Emissions of Gases and Aerosols fromNature), Atmos. Chem. Phys., 6, 3181–3210,doi:10.5194/acp-6-3181-2006, 2006.
Heald, C. L., Jacob, D. J., Fiore, A. M., Emmons, L. K., Gille, J.C., Deeter, M. N., Warner, J., Edwards, D. P., Crawford, J. H.,Hamlin, A. J., Sachse, G. W., Browell, E. V., Avery, M. A., Vay,S. A., Westberg, D. J., Blake, D. R., Singh, H. B., Sandholm, S.T., Talbot, R. W., and Fuelberg, H. E.: Asian outflow and trans-Pacific transport of carbon monoxide and ozone pollution: Anintegrated satellite, aircraft, and model perspective, J. Geophys.Res., 108, 4804,doi:10.1029/2003JD003507, 2003.
Horowitz, L. W.: Past, present, and future concentrations of tro-pospheric ozone and aerosols: methodology, ozone evaluation,and sensitivity to aerosol wet removal, J. Geophys. Res., 111,D22211,doi:10.1029/2005JD006937, 2006.
Hubbell, B. J., Hallberg, A., McCubbin, D. R., and Post, E.: Health-
5652 E. V. Fischer et al.: PAN and ozone at Mount Bachelor
related benefits of attaining the 8-hour ozone standard, Environ.Health Persp., 113, 73–82, 2005.
Hudman, R., Jacob, D. J., Cooper, O. R., Evans, M. J., Heald, C.L., Park, R. J., Fehsenfeld, F. C., Flocke, F. M., Holloway, J.,Hubler, G., Kita, K., Koike, M., Kondo, Y., Neuman, A., Nowak,J., Oltmans, S. L., Parrish, D. D., Robert, J. M., and Ryerson,T.: Ozone production in transpacific Asian pollution plumes andimplications for ozone air quality in California, J. Geophys. Res.,109, D23S10,doi:10.1029/2004JD004974, 2004.
Huntrieser, H., Heland, J., Schlager, H., Forster, C., Stohl, A.,Aufmhoff, H., Arnold, F., Scheel, H. E., Campana, M., Gilge,S., Eixmann, R., and Cooper, O.: Intercontinental air pollutiontransport from North America to Europe: Experimental evidencefrom airborne measurements and surface observations, J. Geo-phys. Res.-Atmos., 110, D01305,doi:10.1029/2004jd005045,2005.
Jacob, D. J., Heikes, B. G., Fan, S.-M., Logan, J. A., Mauzerall,D. L., Bradshaw, J. D., Singh, H. B., Gregory, G. L., Talbot,R. W., Blake, D. R., and Sachse, G. W.: Origin of ozone andNOx in the tropical troposphere: A photochemical analysis ofaircraft observations over the South Atlantic basin, J. Geophys.Res., 101, 24,235–224,250, 1996.
Jacob, D. J., Logan, J. A., and Murti, P. P.: Effect of rising Asianemissions on surface ozone in the United States, Geophys. Res.Lett., 26, 2175–2178, 1999.
Jacob, D. J., Crawford, J. H., Maring, H., Clarke, A. D., Dibb, J. E.,Emmons, L. K., Ferrare, R. A., Hostetler, C. A., Russell, P. B.,Singh, H. B., Thompson, A. M., Shaw, G. E., McCauley, E., Ped-erson, J. R., and Fisher, J. A.: The Arctic Research of the Com-position of the Troposphere from Aircraft and Satellites (ARC-TAS) mission: design, execution, and first results, Atmos. Chem.Phys., 10, 5191–5212,doi:10.5194/acp-10-5191-2010, 2010.
Jaegle, L., Jaffe, D. A., Price, H. U., Weiss-Penzias, P., Palmer, P.I., Evans, M. J., Jacob, D. J., and Bey, I.: Sources and budgetsfor CO and O3 in the northeastern Pacific during the spring of2001: Results from the PHOBEA-II Experiment, J. Geophys.Res., 108, 8802,doi:10.1029/2002JD003121, 2003.
Jaffe, D. A., and Ray, J.: Increase in surface ozone at rural sites inthe western US, Atmos. Environ., 41, 5,452–455,463, 2007.
Jaffe, D. A., Anderson, T. L., Covert, D., Trost, B., Danielson, J.,Simpson, W., Blake, D. R., Harriss, R. C., and Streets, D.: Ob-servations of ozone and related species in the northeast Pacificduring the PHOBEA campaigns. 1. Ground-based observationsat Cheeka Peak, J. Geophys. Res., 106, 7449–7461, 2001.
Jaffe, D. A., Price, H., Parrish, D., Goldstein, A., and Har-ris, J.: Increasing background ozone during spring on thewest coast of North America, Geophs. Res. Lett., 30, 8802,doi:10/1029/2003GL017024, 2003.
Jaffe, D. A., Bertschi, I., Jaegle, L., Novelli, P., Reid, J. S., Tani-mot, H., Vingarzan, R., and Westphal, D. L.: Long-range trans-port of Siberian biomass burning emissions and impact on sur-face ozone in western North America, Geophs. Res. Lett., 31,L16106, doi:1029/2004GL020093, 2004.
Jaffe, D. A., Prestbo, E., Swartzendruber, P., Weiss-Penzias, P.,Kato, S., Takami, A., Hatakeyama, S., and Kajii, Y.: Export of at-mospheric mercury from Asia, Atmos. Environ., 39, 3029–3038,2005.
Jaffe, D. A., Thornton, J., Wolfe, G., Reidmiller, D., Fischer, E. V.,Jacob, D. J., Zhang, L., Cohen, R., Singh, H., Weinheimer, A.,
and Flocke, F.: Can we detect an Influence over North AmericaFrom Increasing Asian NOx Emissions?, Eos Trans, AGU, 88,Fall Meet. Suppl., Abstract A51E-04, 2007.
Kalnay, E., Kanamitsu, M., Kistler, R., Collins, W., Deaven, D.,Gandin, L., Iredell, M., Saha, S., White, G., Woollen, J., Zhu,Y., Leetmaa, A., R. Reynolds, M. Chelliah, W. Ebisuzaki, W.Higgins, J. Janowiak, K. Mo, C. Ropelewski, J. Wang, R. Jenne,and D. Joseph: The NCEP/NCAR 40-Year Reanalysis Project,Bull. Amer. Meteor. Soc., 77, 437–471, 1996.
Kotchenruther, R. A., Jaffe, D. A., Beine, H. J., Anderson, T., Bot-tenheim, J. W., Harris, J., Blake, D., and Schmidt, R. W. H.:Observations of ozone and related species in the northeast Pa-cific during the PHOBEA campaigns: 2. Airborne observations,J. Geophys. Res., 106, 7463–7483, 2001a.
Kotchenruther, R. A., Jaffe, D. A., and Jaegle, L.: Ozone photo-chemistry and the role of peroxyacetyl nitrate in the springtimenortheastern Pacific troposphere: Results from the Photochemi-cal Ozone Budget of the Eastern North Pacific (PHOEBEA) cam-paign, J. Geophys. Res., 106, 28,731–728,741, 2001b.
Lee, S., Akimoto, H., Nakane, H., Kurnosenko, S., and Kinjo, Y.:Lower tropospheric ozone trend observed in 1989-1997 at Oki-nawa, Japan, Geophys. Res. Lett., 25, 1637–1640, 1998.
Liang, Q., Jaegle, L., and Wallace, J. M.: Meteorological in-dices for Asian outflow and transpacific transport on dailyto interannual timescales, J. Geophys. Res., 110, D18308,doi:10.1029/2005JD005788, 2005.
Liu, J., Mauzerall, D. L., and Horowitz, L. W.: Analysis of seasonaland interannual variability in transpacific transport, J. Geophys.Res., 110, D04302,doi:10.1029/2004JD005207, 2005.
Muller, J.-F., Stavrakou, T., Wallens, S., De Smedt, I., Van Roozen-dael, M., Potosnak, M. J., Rinne, J., Munger, B., Goldstein, A.,and Guenther, A. B.: Global isoprene emissions estimated usingMEGAN, ECMWF analyses and a detailed canopy environmentmodel, Atmos. Chem. Phys., 8, 1329–1341,doi:10.5194/acp-8-1329-2008, 2008.
Murphy, J. G., Day, D. A., Cleary, P. A., Wooldridge, P. J., andCohen, R. C.: Observations of the diurnal and seasonal trendsin nitrogen oxides in the western Sierra Nevada, Atmos. Chem.Phys., 6, 5321–5338,doi:10.5194/acp-6-5321-2006, 2006.
Nowak, J. B., Parrish, D. D., Newman, J. A., Holloway, J. S.,Cooper, O. R., Ryerson, T. B., Nicks Jr., D. K., Flocke, F.,Roberts, J. M., Atlas, E. L., de Gouw, J. A., Donnely, S. G.,Dunlea, E., Hubler, G., Huey, L. G., Schauffler, S. M., Tanner,D. J., Warneke, C., and Fehsenfeld, F. C.: Gas-phase chemicalcharacteristics of Asian emission plumes observed during ITCT2K2 over the eastern North Pacific Ocean, J. Geophys. Res., 109,D23S19,doi:10.1029/2003JD004488, 2004.
NRC: Estimating mortality risk reduction and economic benefitsfrom controlling ozone air pollution, National Academy Press,Washington DC, USA, 2008.
NRC: Global sources of local pollution, National Research Council,Washington DC, USA, 2010.
Ohara, T., Akimoto, H., Kurokawa, J., Horii, N., Yamaji, K.,Yan, X., and Hayasaka, T.: An Asian emission inventory ofanthropogenic emission sources for the period 1980-2020, At-mos. Chem. Phys., 7, 4419–4444,doi:10.5194/acp-7-4419-2007,2007.
Oltmans, S. L., Lefohn, A. S., Harris, J. M., and Shadwick, D. S.:Background ozone levels of air entering the west coast of the
E. V. Fischer et al.: PAN and ozone at Mount Bachelor 5653
US and assessment of longer-term changes, Atmos. Environ., 42,6,020–026,038, 2008.
Palmer, P. I., Abbot, D. S., Fu, T.-Z., Jacob, D. J., Chance,K., Kuruso, T. P., Guenther, A., Weidinmyer, C., Stanton, J.C., Pilling, M. J., Pressley, S. N., Lamb, B., and Summer,A. L.: Quantifying the seasonal and interannual variabilityof North American isoprene emissions using satellite observa-tions of formaldehyde column, J. Geophys. Res., 111, D12315,doi:10.1029/2005JD006689, 2006.
Parrish, D. D., Dunlea, E., Atlas, E. L., Schauffler, S. M., Donnely,S. G., Stroud, V., Goldstein, A., Millet, D. B., McKay, M., Jaffe,D., Price, H., Hess, P. G., Flocke, F., and Roberts, J. M.: Changesin the photochemical environment of the temperate North Pacifictroposphere in response to increased Asian emissions, J. Geo-phys. Res., 109, D23S18,doi:10.1029/2004JD004978, 2004.
Parrish, D. D., Millet, D. B., and Goldstein, A. H.: Increasingozone in marine boundary layer inflow at the west coasts ofNorth America and Europe, Atmos. Chem. Phys., 9, 1303–1323,doi:10.5194/acp-9-1303-2009, 2009.
Paulot, F., Crounse, J. D., Kjaergaard, H. G., Kroll, J. H., Sein-feld, J. H., and Wennberg, P. O.: Isoprene photooxidation: newinsights into the production of acids and organic nitrates, At-mos. Chem. Phys., 9, 1479–1501,doi:10.5194/acp-9-1479-2009,2009.
Penkett, S. A., and Brice, K. A.: The spring maximum in photo-oxidants in the Northern Hemisphere troposphere, Nature, 319,655–657, 1986.
Reidmiller, D. R., Fiore, A. M., Jaffe, D. A., Bergmann, D., Cuve-lier, C., Dentener, F. J., Duncan, B. N., Folberth, G., Gauss, M.,Gong, S., Hess, P., Jonson, J. E., Keating, T., Lupu, A., Marmer,E., Park, R., Schultz, M. G., Shindell, D. T., Szopa, S., Vi-vanco, M. G., Wild, O., and Zuber, A.: The influence of foreignvs. North American emissions on surface ozone in the US, At-mos. Chem. Phys., 9, 5027–5042,doi:10.5194/acp-9-5027-2009,2009.
Reidmiller, D. R., Jaffe, D. A., Chand, D., Strode, S., Swartzendru-ber, P., Wolfe, G. M., and Thornton, J. A.: Interannual variabilityof long-range transport as seen at the Mt. Bachelor observatory,Atmos. Chem. Phys., 9, 557–572,doi:10.5194/acp-9-557-2009,2009.
Reidmiller, D. R., Jaffe, D. A., Fischer, E. V., and Finley, B.: Ni-trogen oxides in the boundary layer and free troposphere at theMt. Bachelor Observatory, Atmos. Chem. Phys., 10, 6043–6062,doi:10.5194/acp-10-6043-2010, 2010.
Ridley, B. A., Shetter, J. D., Gandrud, B. W., Salas, L. J., Singh,H. B., Carroll, M. A., Hubler, G., Albritton, D. L., Hastie, D.R., Schiff, H. I., Mackay, G. I., Karechi, D. R., Davis, D. D.,Bradshaw, J. D., Rodgers, M. O., Sandholm, S. T., Torres, A.L., Conden, E. P., Gregory, G. L., and Beck, S. M.: Ratios ofperoxyacetyl nitrate to active nitrogen observed during aircraftflights over the Eastern Pacific Oceans and continental UnitedStates, J. Geophys. Res., 95, 10,179–110,192, 1990.
Roberts, J. M.: PAN and Related Compounds, in: Volatile Or-ganic Compounds in the Atmosphere, edited by: Koppmann, R.,Blackwell Publishing, 500, Oxford, UK, 2007.
Roberts, J. M., Flocke, F., Chen, G., De Gouw, J. A., Holloway, J.S., Hubler, G., Neuman, J. A., Nicks Jr., D. K., Nowak, J. B., Par-rish, D., Ryerson, T. B., Sueper, D. T., Warnecke, C., and Fehsen-feld, F. C.: Measurement of peroxycarboxylic nitric anhydrides
(PANs) during the ITCT 2K2 aircraft intensive experiment,J. Geophys. Res., 109, D23S21,doi:10.1029/2004JD004960,2004.
Roberts, J. M., Marchewka, M., Bertman, S. B., Goldan, P., Kuster,W., De Gouw, J. A., Warneke, C., Williams, E. J., Lerner, B.,Murphy, P., Apel, E., and Fehsenfeld, F. C.: Analysis of the iso-prene chemistry observed during the New England Air QualityStudy (NEAQS) 2002 intensive experiment, J. Geophys. Res.,111, D23S12,doi:10.1029/2006JD007570, 2006.
Russo, R., Talbot, R., Dibb, J., Scheuer, E., Seid, G., Jordan, C., Fu-elberg, H. E., Sachse, G., Avery, M., Vay, S. A., Blake, D., Blake,N. J., Atlas, E., Fried, A., Sandholm, S., Tan, D., Singh, H.,Snow, J., and Heikes, B.: Chemical composition of Asian conti-nental outflow over the western Pacific: Results from Transportand Chemical Evolution over the Pacific (TRACE-P), J. Geo-phys. Res., 108, 8804,doi:10.1029/2002JD003184, 2003.
Singh, H. B. and Salas, L. J.: Global distribution of peroxyacetylnitrate, Nature, 321, 588–591, 1986.
Singh, H. B., Condon, E., Vedder, J., O’Hara, D., Ridley, B. A.,Gandrud, B. W., Shetter, J. D., Salas, L. J., Huebert, B. J., Hubler,G., Carroll, M. A., Albritton, D. L., Davis, D. D., Bradshaw, J.D., Sandholm, S. T., Rodgers, M. O., Beck, S. M., Gregory, G.L., and LeBel, P. J.: Peroxyacetyl nitrate measurements duringCITE 2: Atmospheric distribution and precursor relationships, J.Geophys. Res., 95, 10,163–110,178, 1990.
Singh, H. B., Viezee, W., Chen, Y., Thakur, A. N., Kondo, Y., Tal-bot, R. W., Gregory, G. L., Sachse, G. W., Blake, D. R., Brad-shaw, J. D., Wang, L., and Jacob, D. J.: Latitudinal distribution ofreactive nitrogen in the free troposphere over the Pacific Ocean inlate winter/early spring, J. Geophys. Res., 103, 28,237–228,246,1998.
Singh, H. B., Brune, W. H., Crawford, J. H., Flocke, F., and Ja-cob, D. J.: Chemistry and transport of pollution over the Gulfof Mexico and the Pacific: spring 2006 INTEX-B campaignoverview and first results, Atmos. Chem. Phys., 9, 2301–2318,doi:10.5194/acp-9-2301-2009, 2009.
Staehelin, J., Thudium, J., Buehler, R., Volz-Thomas, A., andGraber, W.: Trends in surface ozone concentrations at Arosa(Switzerland), Atmos. Environ., 28, 75–87, 1994.
Stohl, A.: Computation, accuracy, and applications of trajectories -A review and bibliography, Atmos. Environ., 32, 947–966, 1998.
Streets, D. G., Bond, T. C., Carmichael, G. R., Fernandes, S. D., Fu,Q., He, D., Klimont, Z., Nelson, S. M., Tsai, N. Y., Wang, M.Q., Woo, J.-H., and Yarber, K. F.: An inventory of gaseous andprimary aerosol emissions in Asia in the year 2000, J. Geophys.Res., 108, 8809,doi:10.1029/2002JD003093, 2003.
Talukdar, R. K., Burkholder, J. B., Schmoltner, A.-M., Roberts, J.M., Wilson, R., and Ravishankara, A. R.: An investigation of theloss processes for peroxyacetyl nitrate in the atmosphere: UVphotolysis and reaction with OH, J. Geophys. Res., 100, 14,163–114,173, 1995.
Tanimoto, H.: Increase in springtime tropospheric ozone at a moun-tainous site in Japan for the period 1998–2006, Atmos. Environ.,43, 1583–1363, 2009.
Tiao, G. C., Reinsel, G. C., Daming, X., Pedrick, J. H., Zhu, X.,Miller, A. J., DeLuisi, J., Mateer, C. L., and Wuebbles, D. J.:Effects of autocorrelation and temporal sampling schemes on es-timates of trend and spatial correlation, J. Geophys. Res., 95,20,507–520,517, 1990.
5654 E. V. Fischer et al.: PAN and ozone at Mount Bachelor
Vivchar, A.: Wildfires in Russia in 2000–2008: estimates of burntareas using the satellite MODIS MCD45 data, Remote SensingLetters, 2, 81–90, 2011.
Volz-Thomas, A., Xueref, I., and Schmitt, R.: An automatic gaschromatograph and calibration system for ambient measure-ments of PAN and PPN, Environmental Science and PollutionResources, Special Issue 4, 72–76, 2002.
Warneck, P. and Zerbach, T.: Synthesis of peroxyacetyl nitrate byacetone photolysis, Environ. Sci. Technol., 26, 74–79, 1992.
Warneke, C., Bahreini, R., Brioude, J., Brock, C. A., de Gouw, J.A., Fahey, D. W., Froyd, K. D., Holloway, J. S., Middlebrook,A., Miller, L., Montzka, S., Murphy, D. M., Peischl, J., Ryerson,T. B., Schwarz, J. P., Spackman, J. R., and Veres, P.: Biomassburning in Siberia and Kazakhstan as an important source forhaze over the Alaskan Arctic in April 2008, Geophys. Res. Lett.,36, L02813,doi:10.1029/2008GL036194, 2009.
Weatherhead, E. C., Reinsel, G. C., Tiao, G. C., Meng, X.-L., Choi,D., Cheang, W.-K., Keller, T., DeLuisi, J., Wuebbles, D. J., Kerr,J. B., Miller, A. L., Oltmans, S. J., and Frederick, J. E.: Fac-tors affecting the detection of trends: Statistical considerationsand applications to environmental data, J. Geophys. Res., 103,17,149–117,161, 1998.
Weatherhead, E. C., Stevermer, A. J., and Schwartz, B.: Detectingenvironmental changes and trends, Phys. Chem. Earth, 27, 399–403, 2002.
Weiss-Penzias, P., Jaffe, D., Swartzendruber, P., Dennison, J. B.,Chand, D., Hafner, W., and Prestbo, E.: Observations of Asianair pollution in the free troposphere at Mount Bachelor Obser-vatory during spring of 2004, J. Geophys. Res., 111, D10304,doi:10.1029/2005JD006522, 2006.
Wolfe, G. M., Thornton, J. A., McNeill, V. F., Jaffe, D. A., Reid-miller, D., Chand, D., Smith, J., Swartzendruber, P., Flocke, F.,and Zheng, W.: Influence of trans-Pacific pollution transport onacyl peroxy nitrate abundances and speciation at Mount Bache-lor Observatory during INTEX-B, Atmos. Chem. Phys., 7, 5309–5325,doi:10.5194/acp-7-5309-2007, 2007.
Wu, S., Mickley, L. J., Jacob, D. J., Logan, J. A., Yantosca, R. M.,and Rind, D.: Why are there large differences between modelsin global budgets of tropospheric ozone?, J. Geophys. Res., 112,D05302,doi:10.1029/2006JD007801, 2007.
Yienger, J. J., Galanter, M., Holloway, T. A., Phadnis, M. J., Gut-tikunda, S. K., Carmichael, G. R., Moxim, W. J., and Levy II, H.:The episodic nature of air pollution transport from Asia to NorthAmerica, J. Geophys. Res., 105, 26,931–926,945, 2000.
Zhang, L., Jacob, D. J., Bowman, K. W., Jaffe, D. A., Boersma,F., and McMillan, W. W.: Recent increases in Asian emissionsand consequences for transpacific ozone pollution in the UnitedStates: INTEX-B and Aura observations, Eos Trans. AGU, 88,Abstract A53H-04, 2007.
Zhang, L., Jacob, D. J., Boersma, K. F., Jaffe, D. A., Olson, J. R.,Bowman, K. W., Worden, J. R., Thompson, A. M., Avery, M.A., Cohen, R. C., Dibb, J. E., Flock, F. M., Fuelberg, H. E.,Huey, L. G., McMillan, W. W., Singh, H. B., and Weinheimer,A. J.: Transpacific transport of ozone pollution and the effect ofrecent Asian emission increases on air quality in North Amer-ica: an integrated analysis using satellite, aircraft, ozonesonde,and surface observations, Atmos. Chem. Phys., 8, 6117–6136,doi:10.5194/acp-8-6117-2008, 2008.