FREEZE-THAW FREQUENCIES AND MECHANICAL WEATHERING IN CANADA* J. Keith Fraserf T HE repeated freezing and thawing of water in rock crevices and soil material is recognized as an important factor in mechanical weather- ing. The comparative importance of the process in northern and southern Canada has been examined in this preliminary study, which is not concerned with weathering under alpine conditions, and only indirectly with the role of freezing and thawing in the creation of patterned ground. Mechanical weathering is defined as the disintegration of rock in place, as opposed to chemical decomposition or to erosion, which requires a transporting agent. The freeze-thaw frequency at a particular station is the annual number of times the recorded temperature falls below the point of effective freeze following a period whenthetemperature was at or above the point of effective thaw. Scatteredthrough the descriptive literature pertaining to arcticand subarctic regions are references (Tarr 1897, Eakin 1916, Jenness 1952, Bird 1955) to the widespread occurrence of frost-riven rock materials. rock deserts (felsenmeere), talus concentrations and comminuted erratics. This obvious and widespread mechanical weathering is attributed to frost action, eitherbyextreme cold, by repeated freezing and thawing, or by both, leaving the impression that such predominant rock disintegration is char- acteristic of high latitudes simply because low temperatures and repeated freezes occur there.Thereappears to havebeenlittle effort to compare the frequency of freezes and thaws in high with that in middle latitudes. Although some observers have noted that freezing and thawing is less frequent in high than in middle latitudes, these observations were of short term nature and more concerned with soil structures than with rock weathering (Hogbom1914, Elton 1927, Black 1954). Accordingly, it seems worth while to examine the importance of freezing andthawingby in- vestigating thefrequency of freeze-thaw cycles bytheuse of Canadian meteorological records. It has been shown (Reiche 1950, p. 10) that rocks do not effectively disintegrate due to climatic temperature changes only (quite apart from the effect of freezing water) either by the difference in volume change of the outside and the inside of the rock, or by the differential change in volume * Published with the permission of the Director, Geographical Branch, Department t Northern Canada Research Section, Geographical Branch, Ottawa. of Mines and Technical Surveys, Ottawa. 40
Transcript
FREEZE-THAW FREQUENCIES AND MECHANICAL WEATHERING IN CANADA*
J. Keith Fraserf
T HE repeated freezing and thawing of water in rock crevices and soil material is recognized as an important factor in mechanical weather-
ing. The comparative importance of the process in northern and southern Canada has been examined in this preliminary study, which is not concerned with weathering under alpine conditions, and only indirectly with the role of freezing and thawing in the creation of patterned ground. Mechanical weathering is defined as the disintegration of rock in place, as opposed to chemical decomposition or to erosion, which requires a transporting agent. The freeze-thaw frequency at a particular station is the annual number of times the recorded temperature falls below the point of effective freeze following a period when the temperature was at or above the point of effective thaw.
Scattered through the descriptive literature pertaining to arctic and subarctic regions are references (Tarr 1897, Eakin 1916, Jenness 1952, Bird 1955) to the widespread occurrence of frost-riven rock materials. rock deserts (felsenmeere), talus concentrations and comminuted erratics. This obvious and widespread mechanical weathering is attributed to frost action, either by extreme cold, by repeated freezing and thawing, or by both, leaving the impression that such predominant rock disintegration is char- acteristic of high latitudes simply because low temperatures and repeated freezes occur there. There appears to have been little effort to compare the frequency of freezes and thaws in high with that in middle latitudes. Although some observers have noted that freezing and thawing is less frequent in high than in middle latitudes, these observations were of short term nature and more concerned with soil structures than with rock weathering (Hogbom 1914, Elton 1927, Black 1954). Accordingly, it seems worth while to examine the importance of freezing and thawing by in- vestigating the frequency of freeze-thaw cycles by the use of Canadian meteorological records.
It has been shown (Reiche 1950, p. 10) that rocks do not effectively disintegrate due to climatic temperature changes only (quite apart from the effect of freezing water) either by the difference in volume change of the outside and the inside of the rock, or by the differential change in volume
* Published with the permission of the Director, Geographical Branch, Department
t Northern Canada Research Section, Geographical Branch, Ottawa. of Mines and Technical Surveys, Ottawa.
40
FREEZE-THAW FREQUENCIES IN CANADA 41
of the different component materials. The experiments involved in these studies were concerned mainly with the effect of a rise of temperature, as in hot deserts, but a drop of temperature would have as little effect. It may thus be assumed that extreme low temperatures by themselves are of little importance in rock weathering.
The disruption of rocks by the freezing of water contained in joints, cracks or bedding planes is recognized as an important process in landform destruction. Water experiences a 9.05 per cent volume increase on freezing and exerts tremendous pressure when freezing in a confined space. This force is at its maximum only under certain conditions. “This is because the water in most rocks forms a system open to the atmosphere, or is in communication downward with a zone of saturation which remains un- frozen, or includes air pockets (i.e. fails completely to saturate the ma- terial). In these cases, fluid expulsion commensurate with the expansion of freezing may occur, or the volume increase may be taken up by com- pression of air . . . Nevertheless, water-filled cracks or joints which ter- minate downward and which are narrow and perhaps irregular may be converted into essentially closed systems by preliminary freezing of the water in their superficial parts. In such cases the combination of expansion and low compressibility may exert a disruptive force which, if the temper- ature continued to fall and rock pressure permitted, would approach 30,000 pounds to the square inch at “22°C.” (Reiche 1950, p. 12). As Grawe points out, this temperature (-7.6”F.) is not excessively low or uncommon in temperate climates (Grawe 1936, p. 179).
Previous studies
The work of Russell (1943, Visher 1954) is probably the most thorough of the few studies of the distribution of freeze-thaw frequencies. It con- cerns only the continental United States and is based on the records of the daily maximum and minimum temperature at 863 stations over 18 years. Russell’s map shows a zone of highest freeze-thaw frequency in the Rocky Mountains in Colorado and Wyoming, from which frequencies decrease outward in all directions; a belt of comparatively high frequencies extends northeastward to the Great Lakes. In the central United States, where temperatures are affected less by altitude than by latitude, frequencies decrease southward, and there is also an indication of a decrease northward in Minnesota. If Russell’s methods were extended into central Canada, the frequencies would likely decrease northward in a manner somewhat similar to their decrease in the southern states.
Visher (1945, 1954) included in a series of climatic maps of the United States two maps of freeze-thaw frequencies. The first map (Visher 1945, p. 730, Fig. 23) shows the average number of days per year when the temperature fluctuated between freezing and thawing, and was based on the difference between the annual number of nights with frost and the number of days with temperatures continually below freezing. This map shows an increase
42 FREEZE-THAW FREQUENCIES IN CANADA
northward from the Gulf of Mexico to the southern part of the Great Lakes and the beginning of a decrease into Canada. The second map (Visher 1945, p. 731, Fig. 24) shows potential freeze-thaw frequencies as indicated by the number of days per year when the daily mean temperature was between 20°F. and 50”F., thus assuming that with a normal daily range of 25°F. (the average for the United States) the daily maxima or minima could rise or fall to 32°F. This map also indicates an increase northward from the Gulf of Mexico and a corresponding decrease near the Great Lakes. As will be shown, Visher’s use of the mean daily range of 25°F. is inapplicable to arctic stations.
Peltier worked out a theoretical relationship between climatic factors and mechanical weathering as represented by frost action (Peltier 1950, p. 219, Fig. 2). He plotted mean annual temperature against mean annual rainfall to illustrate the regional importance of mechanical weathering. His zone of “strong” frost action occupies the space on his graph betweqn the mean annual temperatures of 0°F. and 23°F. and between the mean annual rainfalls of 10 inches and 50 inches. In applying Peltier’s zone of maximum frost action to a map of Canada, these temperature limits confine it to an area extending roughly from the southern coasts of the Queen Elizabeth Islands to a line from James Bay to Great Slave Lake. The zone is further restricted by rainfall limits (total precipitation used here) to Canada south of the 10-inch isohyet, which runs from Chesterfield Inlet west to Great Slave Lake and thence northwest along the Mackenzie River. Peltier’s zone of maximum frost action therefore does not agree with the maps of Russell and Visher, or with the findings of the present study.
Limitations of the present study
Before examining the meteorological records and counting the freeze- thaw cycles, it is necessary to decide what to consider as the limits of effective freeze and thaw. Russell considered that a drop in temperature to 28°F. or less in the instrument shelter should indicate an effective freeze at ground surface. A thaw was counted at 32°F. or more, as Russell rea- soned that air temperatures may lag behind ground temperatures, and that, when an instrument 5 feet above the ground recorded 32”F., it was likely that the ground temperature was higher. The cooling effect of permanently frozen subsoil and rock in northern regions may partly cancel this disparity and in such regions an effective thaw may not take place until the temper- ature rises a few degrees above 32°F. A range of 10 degrees, from 25°F. to 35”F., was used by D. W. Boyd (personal communication) in some un- published work on Canadian stations. For the purpose of the present study it was decided that a freeze-thaw cycle is represented by a rise to 34°F. following a drop to 28°F. By using Russell’s four-degree range a somewhat higher, by using Boyd’s ten-degree range a somewhat lower number would have been obtained (Table 1).
FREEZE-THAW FREQUENCIES IN CANADA 43
Table 1. Number of cycles at three stations based on different temperature ranges.
Station Latitude Number of cycles recorded in 1949
40F. range 6 o F . range 10°F. range (32' - 28 ' ) (34' - 28 ' ) (35' - 2 5 ' )
Eureka 80"WN. Port Radium 66"05' Regina 50"27'
15 39 83
9 29 74
18 5
54
In this study an attempt is made to stress the importance of the lati- tudinal influence in determining the frequency of freeze-thaw cycles and to disregard the influence of altitude. Of the 42 stations examined 29 are located below 900 feet above sea-level, 8 between 900 feet and 1,600 feet above sea-level, and 5 between 1,600 feet and 3,000 feet above sea-level (Table 2). Russell points out that in general freeze-thaw frequencies in- crease at higher altitudes, there being cycles in all months of the year in
Table 2. Average annual freeze-thaw frequencies at 42 Canadian stations.
Station Latitude Average annual
freeze-thaw frequency
Altitude (feet)
Alert, N.W.T. Eureka, N.W.T. Isachsen, N.W.T. Mould Bay, N.W.T. Resolute, N.W.T. Holman Island, N.W.T. Cambridge Bay, N.W.T. Aklavik, N.W.T. Coppennine, N.W.T. Port Radium, N.W.T. Norman Wells. N.W.T. Baker Lake, N.W.T. Frobisher, N.W.T. Reliance, N.W.T. Yellowkhife, N.W.T. Ennadai, N.W.T. Fort Smith, N.W.T. Churchill, Man. Port Harrison, Que. Fort Chimo, Que. Brochet, Man. McMurray, Alta. Knob Lake, Que. The Pas, Man. Trout Lake, Ont. Edmonton, Alta. Prince Albert, Sask. Biggar, Sask. Moosonee, Ont. Regina, Sask. Winnipeg, Man.
Lethbridge, Alta. Dryden, Ont.
Estevan, Sask. Timmins, Ont. Arvida, Que. Fort William, Ont.
contrast to stations at lower altitudes where higher summer temperatures prevail.
Most of the station records examined cover a period of 5 years, but the comparatively recent establishment of stations in the Queen Elizabeth Islands and several incomplete records reduced some periods to only 3 or 4 years. The average annual frequency of freeze-thaw cycles was deter- mined for each of the 42 stations (Table 2) by examining the daily recorded maximum and minimum temperatures (Anon. 1949-53).
It is recognized that the figures resulting from this study are unlikely to indicate the complete effect of frost action in arctic regions. The tem- peratures recorded are not ground temperatures, but air temperatures in instrument shelters 5 feet above ground. Most of the stations, especially in the north, are on sea or lake coasts or in river valleys. Freezes and thaws may well be more frequent even at short distances inland or upland from the stations. For instance, Churchill at the mouth of the Churchill River on Hudson Bay has a much lower freeze-thaw frequency than Brochet, 270 miles inland at about the same latitude (Table 2). Mathews's data (Fig. 6) in British Columbia show similar trends although there, of course, altitude affects the frequencies. Slopes facing south or southwest are likely to have melting well before the air temperature rises above 34'F. Dark-coloured rocks may absorb enough heat during the period of high sun in May and June to melt the water contained in their crevices, even when the thermometer still indicates a temperature below freezing point. In such instances even the clouding over of the sky may result in refreezing of this water. Grawe notes that there is less rock-shattering effect with slow freezing than with a sudden drop in temperature (Grawe 1936, p. 178). This disparity between recorded temperatures and actual ground temper- atures may be offset as far as the number of freeze-thaw cycles is concerned by the probable lag of the melting of ice in deep rock crevices behind the seasonal rise of air temperatures.
Freeze-thaw frequency distribution
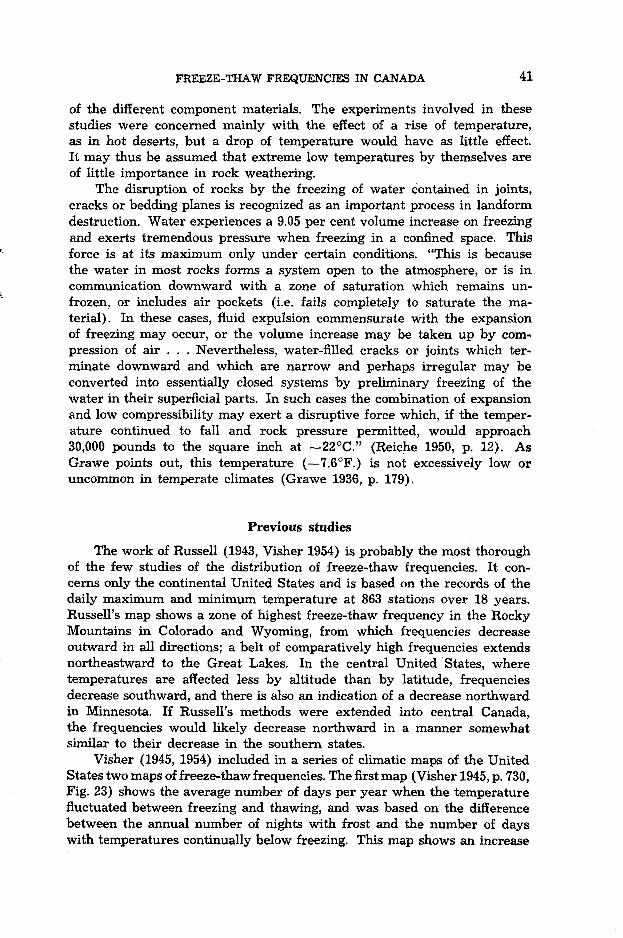
Examination of the temperature records shows conclusively that the average annual frequency of freeze-thaw cycles increases steadily from north to south in central Canada (Fig. 1). Despite the limitations just dis- cussed, the difference between frequencies in the High Arctic and southern Canada is sufficiently great to make this observation valid.
In the five stations in the Queen Elizabeth Islands frequencies average 15 cycles per year. Alert, at the northern coast of Ellesmere Island, appears to be anomalous with 22 cycles, possibly the result of a foehn effect of the nearby mountains. Frequencies increase at stations on Victoria Island, along the arctic coast, and at Great Bear Lake near the Arctic Circle. They increase rapidly near the sixtieth parallel, Fort Smith and Fort Mc- Murray having 48 and 64 cycles per year respectively. The rest of southern Canada has frequencies of over 40, with several stations averaging over 60
FREEZE-THAW FREQUENCIES IN CANADA 45
CYCLES 75 - 70 - 6 5 -
60 -
55 - 50 -
45 -
40 -
3 5 -
30 -
2 5 -
2 0 -
15 -
IO -
PER YEAR LETHBRI DGE.
MCMURRAY,
34O F. T O 2BoF. ./ 0.. . .WINNIPEG
.ALERT
CAMBRIDGE BAY . . NORTH LATITUDE
I I I I I I I 75 70 65 60 55 50 45 40
Fig. 1. Scattergram of average annual freeze-thaw frequencies plotted against latitude for 42. stations in Canada.
cycles per year, but a decrease appears near the international boundary. The effect of the Great Lakes may partly account for this reversal in east-central Canada and, as the maps of Russell and Visher show, there is another in- crease in frequency across the central United States before the trend is affected by the warmer southern areas.
The lines of equal annual freeze-thaw frequency in Canada according to the criteria used in this study are plotted on the map (Fig. 6). The data for western Canada are from W. H. Mathews, University of British Columbia (personal communication). The term isopalimpex lines is suggested for the isograms (Gr. isos, equal; palim, recurring; pesis, freezing).
Freeze-thaw frequency regimes
The freeze-thaw frequency regimes for a number of stations are shown in Fig. 2. As would be expected, most stations have a pronounced double maximum, occurring in the spring and in the fall when the daily mean temperature is passing the freezing point. The graphs of the far northern stations illustrate their short summer, which is indicated merely by a drop in frequency in July between their peak months of June and August. The long winter when no thawing occurs is shown by the 7 months during which no cycles are recorded. Toward the south the stations exhibit more summer
46 FREEZE-THAW FREQUENCIES IN CANADA
Eureka, N.W.T. 80000'
c IO
- 5
Coppermine, N.W.T. - 15 67O47' v) 21 J 0
0
Churchill. Man
28 I5 5 8 0 4 5 '
VI
J
5 IO
Reglna, Sask.
Mould Boy, N.W.T. 76O16'
12
JA J J
Port Radium, N.W.T. 66O05'
28
JL J J
Brochet. Man 57053'
J J
Lethbridge, Alta,
76 49038'
J u . J J
Resolute, N.W.T
13 7 4 0 4 3 '
J / l l l J J
Baker Lake. N.W.T. 6 4 O 1 8 '
2 9
Jh J J
The Pas, Man
Fort William. Ont.
J J
Cambridge Boy, N W.T 69O07'
16
JAo J J
Yellowknife, N.W.T. 62O28'
27
J I L A J J
Edmonton, Alta 5 3 0 3 4 '
5 9
?!L! J J
North Bay, Ont. 46O22'
5 2
J J 0
FREEZE-THAW FREQUENCIES IN CANADA 47
- 1 5 62'43' Reliance, N W.T.
3 4 Ln
J J
Biggar, Sask 52O03'
J J D
Ennadai, N.W.T. 61°08'
2 6
Malton, ?nt 43041
60
J J J a
Windsor, ?nt. 42O17
51
J J J
Tlmrntns, Ont. 48O30'
Ai J J
39 stations Canada
39
months without cycles, and the peaks spread farther apart and increase in amplitude. In southern Canada, represented by Malton (Toronto) and Windsor, the graphs become monocyclic with a single peak in January. At most stations cycles are more frequent in the spring than in the fall. The flurries of freeze-thaw cycles occur during the periods when the mean daily temperatures are passing the freezing point, which in the spring co- incide with the periods of high sun and maximum insolation. The frequency depends on the daily amplitude of the air temperature and on the angle at which the trace of the mean temperature crosses the horizontal repre- senting the freezing point. Greater insolation accompanying clear days in the spring results in greater daily amplitude, thus providing greater op- portunity for cycles to occur. Less insolation in the fall results in a larger crossing angle and a smaller number of cycles.
The daily temperature trends for 1949 are shown in Figs. 3 and 4 for two stations, Regina, Saskatchewan, 50'27'N. and Eureka, Ellesmere Island, 80'00'N. These two stations show a remarkable contrast in their regimes. At Regina two cycles occurred in January and none in February. Four cycles occurred early in March and later in the same month the daily mean temperature passed the freezing point. Between March 23 and April 27 the day and night temperatures fluctuated across the freeze-thaw zone 24 times. Only three more freezes took place before rising summer temper- atures became dominant. In the middle of September a marked flurry of fall cycles began, with sporadic freezes occurring in late September and early October. During a total of 55 days between October 8 and December
48 FREEZE-THAW FREQUENCIES IN CANADA
Freeze- T h a w Cycle ...... x
Freeze- Thaw Cycle ........ x
Fig. 3. Diurnal trend of temperature (OF.) for Regina, Sask. for January 1 to May 31 and September 11 to December 31,1949. During the omitted summer period the temper-
ature was consistently above the freeze-thaw range.
FREEZE-THAW FREQUENCIES IN CANADA 49
MAY ‘ F
eo
50
40
Y)
20
10
0
JUNE i 4 (5 .eo i5 d i io l(5
J LILY
I5 20 25
x x x x
I 5 ;o ;5 210 25
AUGUST 1; 5 io tb 20 25 i 0
SEPTEMBER
x x x x X
Freeze -Thaw Cycle ........ X
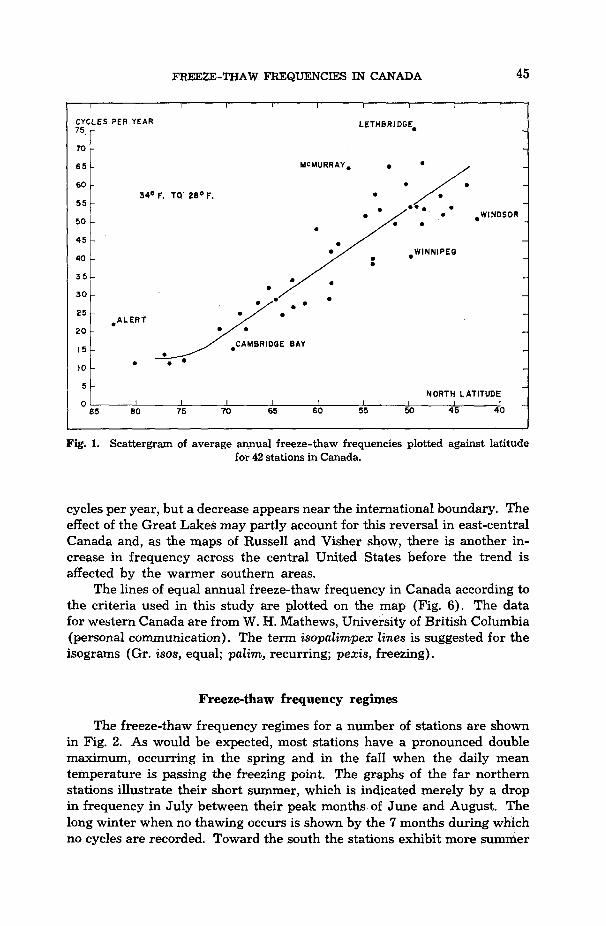
Fig. 4. Diurnal trend of temperature (OF.) for Eureka, N.W.T. for May 15 to September 30,1949. The omitted winter period had temperatures consistently below the freeze-thaw
range.
2 there were no less than 37 cycles, and after December 2 the temperature remained below the limit of effective thaw. The total number of cycles for Regina in 1949 amounted to 74.
During the same year Eureka experienced only 9 cycles, which occur- red in two groups, 4 in late May and 5 in late August and early September. The temperature remained above 28°F. from May 31 to August 24, a period of 85 days, and it may be noted that it dropped to 32°F. or less, but not below 28”F., only 14 times during this period. These observations disagree with the statement of Jenness (1952, p. 246), referring to the arctic islands, that “alternate freezing and thawing takes place almost daily from May to October. . . .”
It is immediately evident from a comparison of the graphs that Regina has a much greater diurnal range than Eureka. According to the meteor- ological records the average difference between the mean annual maximum and minimum temperatures for Regina is 24°F. and for Eureka 12°F. Referring to Resolute in the Queen Elizabeth Islands, Cook (1955, p. 239) observes that “the amplitude of the daily variation changes with the season of the year, achieving maximum range in summer. However, summer diurnal variation is much less than in non-permafrost regions to the south. This is due to the greater uniformity of the mean surface air temperature, resulting from continuous daylight and the relatively weak circulation pre- vailing at this time of year.” It is natural to expect that the greater the
50 FREEZE-THAW FREQUENCIES IN CANADA
I I I I I I I
MEAN ANNUAL DIURNAL RANGE 26 - 24
- 16
- 18
- 20
- 22
-
14 -
y 1 2 -
10 - X 4 .8 Y- 46 Y = 9.6 + .21 X
4 l
2
0 . AVERAGE NUMBER OF CYCLES PER ANNUM
I I 1 I I I I I 0 10 20 30 4 0 50 60 70 80
X
Fig. 5. Scattergram of average annual freeze-thaw frequencies plotted against average annual diurnal temperature (”F.) ranges for selected stations in Canada.
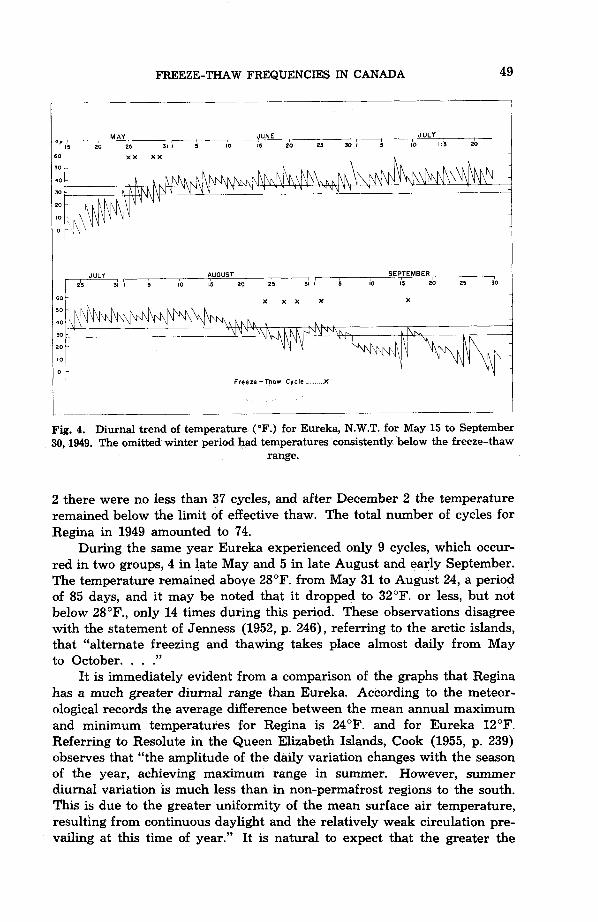
diurnal range, the more opportunity there would be for the night temper- atures to fall below freezing and the day temperatures to rise above. Fig. 5 indicates some correlation between diurnal range and freeze-thaw frequency. A simple regression curve equation (Y = 9.6 + 0.21X or X = 4.8Y - 46, where X equals the annual freeze-thaw frequency, and Y equals the mean annual diurnal range in degrees F.) allows a rough pre- diction of freeze-thaw frequencies from a knowledge of the diurnal range.
Availability of water
Peltier (1950, p. 218) states that there should be “a maximum zone of frost action located in the relatively humid subarctic regions”. The high latitudes admittedly have a low annual precipitation, but this is partly offset by a low evaporation ratio and the holding of ground-water above the permafrost layer. In many places rock surfaces on slopes are kept con- tinually moist throughout the summer by the melting of ice in the adjacent overburden. Precipitation records are invariably lower than the actual amounts. Meteorologists freely admit the difficulties of accurately meas- uring snowfall in the Arctic because of drifting; the occurrence of snow often coincides with winds. Furthermore, it is the author’s experience that
FREEZE-THAW FREQUENCIES IN CANADA 51
there is considerably more precipitation in July and August than is record- ed in the gauges. There is much fine rain that appears in the records as a trace only, yet may continue for 24 hours and be sufficient to drip from tent eaves and to moisten previously desiccated clay patches. Fog and dew are other significant sources of precipitation that are not included in the annual totals. The first few autumn snowfalls, recorded as snow, often melt rapidly, thus providing additional available water. The precipitation limit imposed by Peltier, therefore, has less significance than might be ex- pected if the nature of the precipitation records and the above-mentioned additional sources of moisture are taken into account.
Conclusion
Whereas the concept of strongly predominant mechanical weathering in northern regions has been accepted, this paper has attempted to show that the fact that frost-riven rock is more evident in northern than in southern Canada is not the result of the lower temperatures or the freeze- thaw frequency, even taking into account the small number of stations examined, the brief periods of records, and the disparity between shelter recordings and ground temperatures.
A point that has not been discussed but that may be of prime im- portance in some arctic areas is that some fezsenmeere may have been created under periglacial conditions. Climatic differences between peri- glacial periods and the present may well have included a more severe freeze-thaw regime, possibly approaching that of southern Canada today. Much of the shattered rock composing arctic landscapes undoubtedly is related to former conditions, although this point is seldom referred to by those who stress the importance of freezing and thawing in high latitudes.
It is suggested that the evident abundance of shattered rock derives from the absence of a concealing and insulating mantle of snow and vegeta- tion in the north, and is therefore a secondary effect of the climatic factors of low precipitation and low mean annual temperatures. Mackay (1958, p. 46) points out that in northern Canada “weathering appears relatively more important, because of the lack of the thick vegetation mantle of the temperate areas. The role of mechanical weathering, especially the freeze- thaw cycle, may easily be overemphasized.’’ Talus concentrations and fezsenmeere are more visible to the observer, even in winter. Most of the light snowfall is blown by wind into gullies or into the lee of hills, in con- trast to recorded depths of snow of 40 to 60 inches in southern Canada (Thomas 1953, p. 105), where more favourable temperatures and a greater precipitation combine with organic activity to promote the formation of a mantle of soil and vegetation, which helps both to conceal the results of frost action, and to insulate subsurface rock from low temperatures and from changes in temperature.
52 FR
EE
ZE
-TH
AW
FRE
QU
EN
CIE
S
IN
C
AN
AD
A
0
*
FREEZE-THAW FREQUENCIES IN CANADA 53
It is hoped that this preliminary examination of freeze-thaw cycles in Canada will encourage quantitative studies on rock weathering as well as the accumulation of more widespread surface temperature recordings and the possible development of an air-surface temperature formula or cor- rection factor applicable to northern latitudes.
References
Anon. 1949-53. Canada Department of Transport Meteorological Division, Toronto.
Bird, J. B. 1955. Terrain conditions in the central Canadian Arctic. Geog. Bull. NO.
Black, R. F. 1954. Permafrost: a review. Bull. Geol. Soc. Am. 65:839-56. Cook, F. A. 1955. Near surface soil temperature measurements at Resolute Bay,
Crawford, C. B. and R. F. Legget. 1957. Ground temperature investigations in Canada.
Eakin, H. M. 1916. The Yukon-Koyukuk region, Alaska. U.S. Geol. Surv. Bull. 631,
Elton, C. E. 1927. The nature and origin of soil polygons in Spitzbergen. Quart. J.
Grawe, 0. R. 1936. Ice as an agent of rock weathering: a discussion. J. Geol. 44:173-82. Hogbom, B. 1914. Uber die geologische Bedeutung des Frostes. Bull. Geol. Inst.
Jenness, J. L. 1952. Erosive forces in the physiography of the western arctic islands.
Mackay, J. R. 1955. Physiography in Geography of the Northlands. New York: The
1958. The Anderson River map-area, N.W.T. Geog. Branch, Dept. Min.
Peltier, L. C. 1950. The geographic cycle in periglacial regions. Annals Assoc. Am.
Reiche, P. 1950. A survey of weathering processes and products. Univ. New Mexico
Russell, R. J. 1943. Freeze-and-thaw frequencies in the United States. Trans. Am.
Tarr, R. S. 1897. Rapidity of weathering and stream-erosion in the arctic latitudes.
Thomas, M. K. 1953. Climatological atlas of Canada. Ottawa: Natl. Res. Council and
Visher, S. S. 1945. Climatic maps of geologic interest. Bull. Geol. SOC. Am. 56:713-36. 1954. Climatic atlas of the United States. Cambridge: Harvard Univ.
Monthly Records.
7:l-16.
Northwest Territories. Arctic 8:237-49.
Engineering J. 40:263-9.
85 PP.
Geol. SOC. Lond. 83:163-92.
Upsala. 12:257-389.
Geog. Rev. 42:238-52.
Am. Geog. SOC. pp. 11-35.
Techn. Surv. Geog. Mem. No. 5, 137 pp.
Geog. 40: 214-36.
Pubs., Geol. Ser. No. 3, rev. ed., Albuquerque: Univ. New Mexico Press, 95 pp.
Geophys. Union. Part 1, pp. 125-33.
The Am. Geologist, February, pp. 131-6.
Canada Dept. of Transport. 253 pp.
Press, 403 pp. (contains a generalized reproduction of Russell’s map on p. 136).