Freezing and Melting Outcomes: • Explain the process of freezing/melting, and sublimation/ deposition in terms of KMT. Include: Freezing point • Use KMT to describe the process of evaporation/ condensation. Include: IMF’s, random motion, volatility, dynamic equilibrium. . http://www.800mainstreet.com/08/0008-001-state-changes.html
Transcript
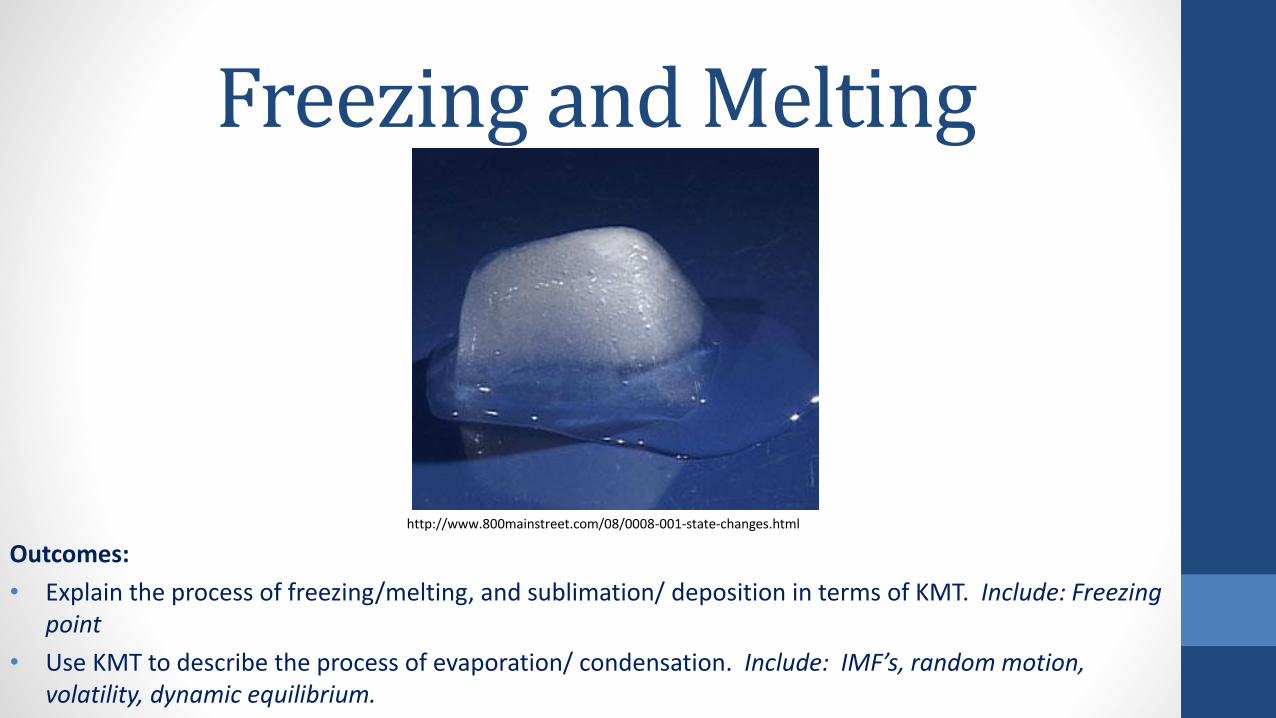
Freezing and Melting
Outcomes:
• Explain the process of freezing/melting, and sublimation/ deposition in terms of KMT. Include: Freezing point
• Use KMT to describe the process of evaporation/ condensation. Include: IMF’s, random motion, volatility, dynamic equilibrium.
• Solids have VAPOR PRESSURES just like liquids, only usually much, much LOWER.
• Solids with HIGH VAPOUR PRESSURES have WEAK INTERMOLECULAR FORCES, and SUBLIMErelatively EASILY. (solid air fresheners)
• We see sublimation and deposition in winter:
• Snow can sublimate even below 0 °C
• Water vapour undergoes deposition to become snow and frost
Heating & Cooling Curves:
A heating graph is a Temp vs. Time graph that shows a CHANGE IN STATE from solid to liquid to gas (or part thereof).
• Flat spots show the changes of state.
• Slopes show a specific phase (state)
A cooling graph is the same as a heating graph, but at time 0 min, you start with a gas, then condense to liquid, then freeze to a solid (the SLOPE is REVERSED).
Heating Curve
0
2
4
6
8
10
12
1 3 5 7 9 11 13 15
Time (min)
Te
mp
era
ture
( C
)
Legend:
1. Solid
2. Melting
3. Liquid
4. Boiling
5. Gas
21
34
5
Heating & Cooling Curves:
Heating Curves Applet Questions
1. Why are there regions where the temperature does not change with time, despite the fact that heat is being added to the system?
2. What is the melting point of the substance?
3. What is the boiling point of the substance?
4. How does the heating curve for a 400 W heating rate compare with that obtained using a 200 W heating rate? (Be quantitative in your answer.)
5. Do the melting point and boiling point depend upon the heating rate?