Page 1
Armando Ferreira Wenceslao Canet
María Dolores Alvarez
María Estrella Tortosa
Freezing, thawing and cooking effects on quality profile assessment
of green beans (cv. Win)
A. Ferreira
Departamento Tecnologia dos Produtos Agrários,
Estação Agronómica Nacional
Quinta do Marquês
2784-505 Oeiras, Portugal
W. Canet M. D. Alvarez ()
Department of Plant Foods Science and Technology,
Instituto del Frío-CSIC,
José de Novaís no.10, 28040 Madrid, Spain
e-mail: [email protected]
Tel.: +34-91-549-23-00
Fax: +34-91-549-36-27
M. E. Tortosa
Department of Plant Biology,
Escuela Técnica Superior de Ingenieros Agrónomos,
U.P.M.Ciudad Universitaria,
28040 Madrid, Spain
Page 2
Abstract Results are presented of the effect of freezing followed by thawing (air and water
immersion, both at environmental temperature) and cooking (traditional boiling in a covered pot)
on quality profile (in terms of objective texture, colour, chlorophylls and pheophytins and sensory
attributes) and structure of green beans (cv. Win). Freezing was carried out at three different rates
by forced convection with liquid nitrogen vapour. Kramer shear cell (KSC) and Warner-Bratzler
(WB) tests were used for objective assessment of the texture. The highest parameter values
occurred in beans frozen at the highest rate and air-thawed at the slowest rate. Also, minimum
alteration of the rheological behaviour of cooked beans was achieved by freezing at the highest
rate. The best parameter for assessing the texture of frozen green beans after thawing and cooking
was the Warner-Bratzler slope (SWB). Coefficients of softening estimated for SWB in the thawed
beans showed that the texture of the beans frozen at –24 °C was almost 4 and almost 5 times
softer than that of the beans frozen at –70 °C, for air and water thawing respectively. Frozen and
thawed green beans were darker than fresh control, whereas freezing prior to cooking produced
lighter-coloured beans than direct cooking. The freezing rate affected colour parameters
differently depending on the process that followed. When beans were thawed, increasing the
freezing rate produced lighter-coloured beans, whereas when beans were cooked, increasing the
rate produced darker-coloured beans. No difference was found in sensory assessments between
cooked samples frozen at –24, -35 and -70 °C, which probably reflects the panellists’ mixed
preferences for quickly and slowly frozen samples. Scanning electron microscopy (SEM) revealed
different degrees of mechanical damage to tissue structure, which accounted for the rheological
behaviour of the beans.
Keywords Phaseolus vulgaris L. Freezing and thawing rates Cooking Mechanical tests
Quality profile Sensory analysis Structure
Page 3
Introduction
Green beans (Phaseolus vulgaris, L.) are one of the most important vegetables produced in
Portugal, where they are much appreciated for their high quality, both in nutritional (e.g. vitamins,
fibber and starch) and sensory properties (e.g. colour, texture and flavour). Green beans are mostly
grown outdoors and harvested seasonally, which makes freezing very important process
preservation for extending their availability throughout the year [1]. However, the market for
ready meals in Europe expanded rapidly in the period 1995-1999, with growth underpinned by
beneficial macroeconomic conditions and increasing demand for convenience foods [2]. Frozen
ready meals are the largest sector in terms of volume and value, and there is an increasingly wide
variety of frozen ready meals available. A whole range of frozen vegetable-based ready meals has
been launched by the industry in the last few years in Spain [3]. Marketing is focused on
convenience, as these products require only 5-10 min preparation.
The beneficial effects of rapid freezing rates on structure and texture are reflected by the
results of various methods of texture analysis (i.e. histological, sensory imitative and objective
techniques) in studies by Gutschmidt, Brown and Canet on green beans [4, 5, 6]. Using objective
methods of texture analysis, Brown [7] successfully detected the positive effect of rapid freezing
rates, even after cooking, in green beans. More recently, Chourot et al. [8] have shown that frozen
beans were frozen up to four times faster by immersion freezing than by air-blast freezing, and
sensory panellists preferred the former because of their texture. Vegetable colour is also an
important sensory property and may be used as a criterion of vegetable quality [9]. For this reason,
other studies have focused on the effects of freezing on the pigment content (mainly chlorophylls)
Page 4
in green beans, which are a major source of dietary magnesium [10]. The predominant
chlorophylls in green beans are chlorophylls a and b, which generally occur at a ratio of about 3:1
[11].
There are several different stages in the production of frozen vegetables during which
significant loss of product quality can occur: initial processing (blanching) and preparation prior to
freezing; freezing; frozen storage following freezing; and above all, final cooking prior to
consumption [3, 12]. For example, it is known that the main loss of nutrients in frozen vegetables
typically occurs during blanching, a high temperature process which inactivates enzymes that
cause deterioration in colour, flavour and odour [6, 13, 14]. Also, recent studies have shown that
blanching was accompanied by a decrease in green bean firmness at 85, 90 and 97 ºC following
simple first-order kinetic models [15]. Once it was accepted that vegetable freezing was
influenced by other stages of the thermal treatment (such as blanching and cooking), and other
factors such as product type, packaging, and storage time, the freezing rate ceased to be
considered the prime factor affecting final quality [6]. However, this is not meant to suggest that
the freezing rate does not in fact affect quality, since it is true that most fruits and vegetables lose
quality when frozen slowly.
The texture and the consumer quality of frozen green beans may ultimately be determined in
the final stage of the overall process: that is the way they are cooked. For example, beans lose less
pigmentation when boiled in a covered pot, pressure cooked or microwaved than when steamed.
Pressure cooking also generally entails little loss of nutritious components and is therefore
recommended in preference to the traditional method of boiling in a covered pot [16]. However,
the study was conducted on fresh green beans, and so the results may not be applicable to
previously processed beans. Thawing of frozen green beans is another operation that significantly
Page 5
compromises quality. Thawing properly is essential to maximise quality retention and safety of
frozen vegetables [17]. Thawing inside a refrigerator at temperatures below 5 ºC or as a part of the
cooking process, are considered microbiologically safe procedures. Simple direct cooking is
recommended as part of any meal preparation, since thermal processing assures microbiological
safety as compared to thawing inside a refrigerator or at ambient temperatures. In contrast,
thawing inside a refrigerator or at ambient temperature is important during preparation stages (e.g.
for salads and pies) and where processing and/or loss of soluble solids by water immersion
thawing are not desired. And thawing may ultimately nullify the effect of controlling temperature
throughout the frozen foods distribution chain, since quality can be severely affected at this final
stage [17]. As noted earlier, retention of quality in frozen beans is also influenced by packaging
materials, and computational models have shown that a good insulating material can significantly
reduce the effect of temperature abuses by increasing thawing times by up to 190% [1].
Those processes that can contribute to loss of final quality of frozen vegetables therefore need
to be studied separately; however, it must be borne in mind that there are significant interactions
between them. The objective of this work was to determine how freezing rate, either after thawing
at ambient temperature in two different media (with a view to producing frozen beans for salads
and pies) or after cooking (recommended as part of any meal preparation) affects the quality and
structure of Win green beans. A secondary aim was to determine what rheological parameters will
best account for the mechanical behaviour of the tissue in response to structural damage caused by
a variety of freezing conditions.
Materials and methods
Test material
Page 6
The raw material, supplied by the industry (Carreira, Portugal), consisted of 70 kg of fresh green beans (Phaseolus
vulgaris L.) of the variety cv. Win, which is round. The fresh material was kept at 4 ºC and 90-95 % relative humidity
throughout the experiment. In each experimental unit (sample subjected to each different freezing and thawing or
cooking combination), undamaged pods at the optimum stage of maturity were gauged and only pods having a
diameter ranging from 9.5 to 11 mm (medium calibre) were selected for use in this study [18]. Green bean pods were
hand washed after removal of the tips and cut into pieces 4 cm long.
Freezing, thawing and cooking processes
The experimental units were frozen by forced convection with liquid nitrogen vapour in an Air Liquide CCF 40
cabinet until their thermal centres reached -18 °C. Three different freezing rates were assayed: at –24 °C (Rf =
1.50.05 °C min-1
, the slowest freezing rate), -35 °C (Rf = 2.70.10 °C min-1
, an intermediate freezing rate), and –70
°C (Rf = 5.40.10 °C min-1
, the fastest freezing rate). Freezing rates were calculated to be the difference between
initial temperature and final temperature divided by freezing time, freezing time being defined as the time elapsing
from the start of the pre-freezing stage until the final temperature (-18 °C) has been attained [19]. After freezing, the
samples were packed into stratified polyethylene bags (500 g/bag) and sealed under slight vacuum (–0.05 MPa) in a
Multivac packing machine to prevent oxidation and surface dehydration damage, and then stored at –22 °C until
thawing or cooking. Green beans were thawed at two different rates, slowly by air thawing at ambient temperature
(+202 °C) (Rt = 0.350.05 °C min-1
), and quickly by water immersion thawing at ambient temperature (+201 °C)
(Rt = 8.400.15 °C min-1
), until their thermal centres reached ambient temperature. Thawing rates were calculated to
be the difference between initial temperature (-22 °C) and final temperature (+20 °C) divided by thawing time,
thawing time being defined as the time elapsing from the start of the thawing until the ambient temperature has been
attained. Since frozen vegetables are traditionally designed to be cooked and then cooled to a temperature suitable for
consumption, frozen beans were cooked by traditional boiling procedure [20]. In this case, 400 ml of water with 2 g of
salt was brought to the boil; 500 g of beans was then added and the beans were boiled for a further 15 min. For
Page 7
calculation of the freezing and thawing rates in the different modes [19], media and green beans temperatures were
monitored by T-type thermocouples using a hardware and software system (Campbell Scientific, PS 40) that permitted
data gathering and storage. The freezing and thawing rates given are the mean values of four different processes
conducted under the same conditions.
Instrumental texture measurements
For objective assessment of texture, tests simulating chewing with a Kramer Shear Cell (KSC), and empirical Warner-
Bratzler tests were performed, using a Lloyd Instruments mod T5K texturometer (J.J. Lloyd Instruments Ltd.,
Southampton, UK) [21]. KSC tests were performed with a 5000 N-load cell, whereas Warner-Bratzler tests were
performed with a 10 N-load cell for cooked samples and a 50 N-load cell for all other freezing and thawing
combinations. Kramer shear tests (n=6) were carried out with a Kramer shear cell 10 blade (Fig. 1a) on 100±1 g
samples of green beans placed on the cell base. The deformation rate was 400 mm min-1
. Warner-Bratzler tests (n=20)
were carried out with a Warner-Bratzler shear blade (Fig. 1b) on samples consisting of one bean, which was placed
horizontally on the slotted blade insert. The bean was then cut across its longitudinal axis by the Warner-Bratzler
blade at a deformation rate of 400 mm min-1
. The Kramer shear force-deformation curves were used to determine the
maximum force, FKSC (N per g of dry matter) and energy (area beneath the curve up to the maximum force), EKSC (J
per g of dry matter). The Warner-Bratzler shear force-deformation curves were used to determine the maximum force,
FWB (N), the maximum energy (area beneath the curve up to maximum force), EWB (J) and the curve slope in the linear
zone, SWB (N mm-1
) (Fig. 1).
Dry matter content
Determinations were made on 20 g of green beans by drying samples in a microwave oven (Sanyo Electronic Co, Ltd.
United Kingdom) with output power at 70% and set at position 2 (900W). Samples were weighed every 5 min until a
constant weight was attained [22]. Ten determinations (n=10) were performed for each experimental unit.
Page 8
Structural examination
Tissue structure was examined by SEM using a Hitachi model S-2500 microscope [23, 24]. Tissue samples were fixed
in FAA 50 or 70% ethyl alcohol (90 ml), glacial acetic acid (5 ml) and formaldehyde (5 ml) for 2 h and dehydrated
in increasing concentrations of ethanol, from 70% to 100%. The samples were immersed once for 15 min in ethanol
concentrations of 70, 80 and 90% and twice for 1 h in 100% ethanol. Finally, the specimens were preserved in acetone
until processed in a critical-point drier, then mounted and sputter-coated with platinum (400-Å) in a P-S1 diode
sputtering system metallizer. Photomicrographs were taken with a Mamiya camera using Ilford 6x9 cm FF-4 film.
Films were processed following the standard method; magnifications were ×150 and ×118 (1 cm=66.7 m, 1 cm=85.2
m, respectively).
Objective colour measurements
Colour was measured in the surface of the green beans with a Minolta, CR 200b colorimeter (Minolta Corp, Tokyo,
Japan). Thirty measurements per treatment (n=30) were recorded on the surface of the beans. The CIE L*a*b* colour
notation system was applied to determine the parameters L*, a* and b*; where L* indicates the luminescence
(lightness), a* means the colour axis from green to red and b* the blue-yellow one. Cartesian coordinates were
transformed into polar coordinates and the saturation index (r) and coloration () were calculated [25-27]. Green
bean chlorophylls and pheophytins (n=2) were determined by spectrophotometry (Unicam 8700 UV/VIS
Spectrometer) [28].
Sensory analysis
An eight-member panel trained for frozen vegetables conducted sensory analyses for texture, taste and colour
following a descriptive quantitative method adapted for green beans [29]. Scores were awarded on a scale of 1-5, in
Page 9
which 1 indicated total absence of the sensory attribute and 5 a very definite attribute. Prior to testing, fresh and
frozen green beans were cooked following the method described above [20].
Statistical analysis
Individual experiments were performed in duplicate, so that data represent the mean of two independent assays. Two-way
analysis of variance was conducted to determine the combined effect of the different freezing and thawing rates on the
mechanical properties and colour parameters of the beans, taking fresh green beans as control. The least significant
difference test (LSD) was used for comparison of means, with a 99% confidence interval for quality parameters. One-way
analysis of variance was conducted to determine the effect of the freezing rate on the mechanical properties, colour
parameters and sensory attributes of the green beans after final cooking, taking cooked unfrozen green beans as control.
The least significance difference test (LSD) was used for comparison of means, with a 99% confidence interval for
objective parameters and 95% for sensory attributes. MSTAT Version 4.0 (Michigan State University, USA) was used
in this study.
Results and discussion
Effect of freezing and thawing rates
Figure 2 shows the mean values and LSD (99%) of the several mechanical parameters derived
from KSC and Warner-Bratzler tests for the green beans frozen and thawed at the rates stated in
Materials and methods section. Freezing rates significantly affected the values of all the KSC
(FKSC, EKSC) and Warner-Bratzler parameters (FWB, SWB, EWB) (P 0.001). Texture parameter
values were highest in the samples frozen at the fastest freezing rate. This means that green beans
frozen at –70 °C required greater force and energy for sequential compression, shear and
Page 10
extrusion, and greater force and energy for shearing, than beans frozen at -35 and -24 °C. Also,
beans frozen at –35 °C presented significantly higher mechanical resistance than those frozen at –
24 °C (as evidenced from both KSC and WB maximum forces). Using programmed freezing,
Fuchigami et al. [30-32] also found that –5 °C min-1
was the optimum freezing rate to preserve
texture and structure of carrots and Chinese cabbage. Of all the objective texture parameters, WB
slope (SWB) (Fig. 2b) presented the widest least significant difference (LSD) range when compared
relatively (relative to the absolute values of the texture parameters) in relation to freezing rate
effect. This result justifies that differences between WB slope values corresponding to the beans
frozen at –35 and -24 °C were non-significant.
The thawing rate had a highly significant (P 0.001) effect on the values of Warner-Bratzler
maximum force and slope (FWB, SWB) (Fig. 2b) and a slight significant (P 0.05) effect on KSC
maximum force and Warner-Bratzler energy (FKSC, EWB) values. Parameter values were highest
for air thawing at the slowest rate used (Rt= 0.35 °C min-1
). In relation to the thawing rate effect,
FWB presented the lowest LSD range when compared relatively, and therefore higher differences
between thawed green beans could be found. All the parameters of the mechanical tests used in
this research discriminate between freezing rates, but not all permit an assessment of the effect of
thawing on these. KSC test did not explain the variations in textural characteristics resulting from
the thawing process. Besides, other results suggested that any mechanical tests used should be
independent of sample weight and volume, and the sample preparation should be as non-
destructive as possible [33]. Although the Warner-Bratzler method is destructive in sample
preparation, it is independent of the weight factor. On the other hand, the maximum force and
energy parameters of the Warner-Bratzler test are dependent on sample volume. The slope
parameter in this test, interpreted as increase in force/increase in deformation, has the advantage
Page 11
of being less dependent on sample volume, and therefore it should be recommended that the best
parameter for assessing the firmness of frozen green beans thawed at ambient temperature is the
Warner-Bratzler slope (SWB).
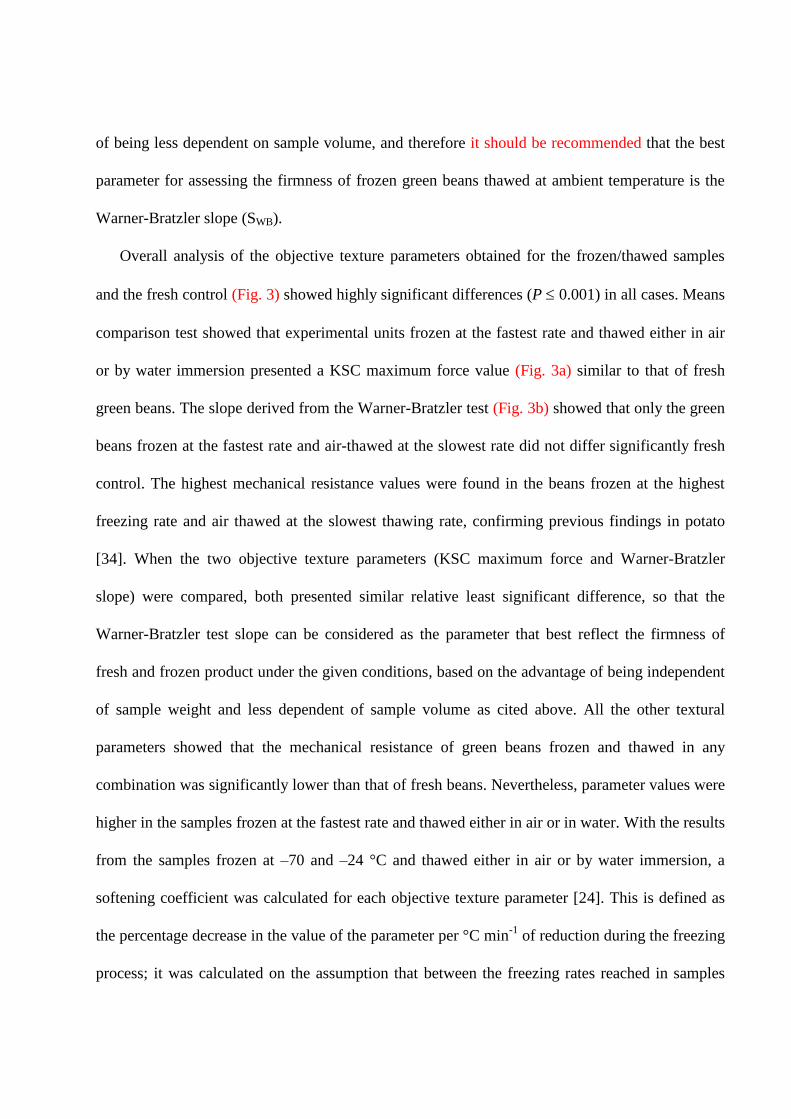
Overall analysis of the objective texture parameters obtained for the frozen/thawed samples
and the fresh control (Fig. 3) showed highly significant differences (P 0.001) in all cases. Means
comparison test showed that experimental units frozen at the fastest rate and thawed either in air
or by water immersion presented a KSC maximum force value (Fig. 3a) similar to that of fresh
green beans. The slope derived from the Warner-Bratzler test (Fig. 3b) showed that only the green
beans frozen at the fastest rate and air-thawed at the slowest rate did not differ significantly fresh
control. The highest mechanical resistance values were found in the beans frozen at the highest
freezing rate and air thawed at the slowest thawing rate, confirming previous findings in potato
[34]. When the two objective texture parameters (KSC maximum force and Warner-Bratzler
slope) were compared, both presented similar relative least significant difference, so that the
Warner-Bratzler test slope can be considered as the parameter that best reflect the firmness of
fresh and frozen product under the given conditions, based on the advantage of being independent
of sample weight and less dependent of sample volume as cited above. All the other textural
parameters showed that the mechanical resistance of green beans frozen and thawed in any
combination was significantly lower than that of fresh beans. Nevertheless, parameter values were
higher in the samples frozen at the fastest rate and thawed either in air or in water. With the results
from the samples frozen at –70 and –24 °C and thawed either in air or by water immersion, a
softening coefficient was calculated for each objective texture parameter [24]. This is defined as
the percentage decrease in the value of the parameter per °C min-1
of reduction during the freezing
process; it was calculated on the assumption that between the freezing rates reached in samples
Page 12
frozen at –70 and –24 °C there was a difference of 4 °C per min. These coefficients are shown in
Table 1. The highest coefficients were given by Warner-Bratzler slope (SWB) and energy (EWB) for
water and air thawing respectively. In the case of the coefficient obtained for the Warner-Bratzler
slope in the green beans thawed in water (4.725%), for example, this means that the texture of the
beans frozen at –24 °C was almost 5 times softer than that of the beans frozen at –70 °C.
[Insert Table 1]
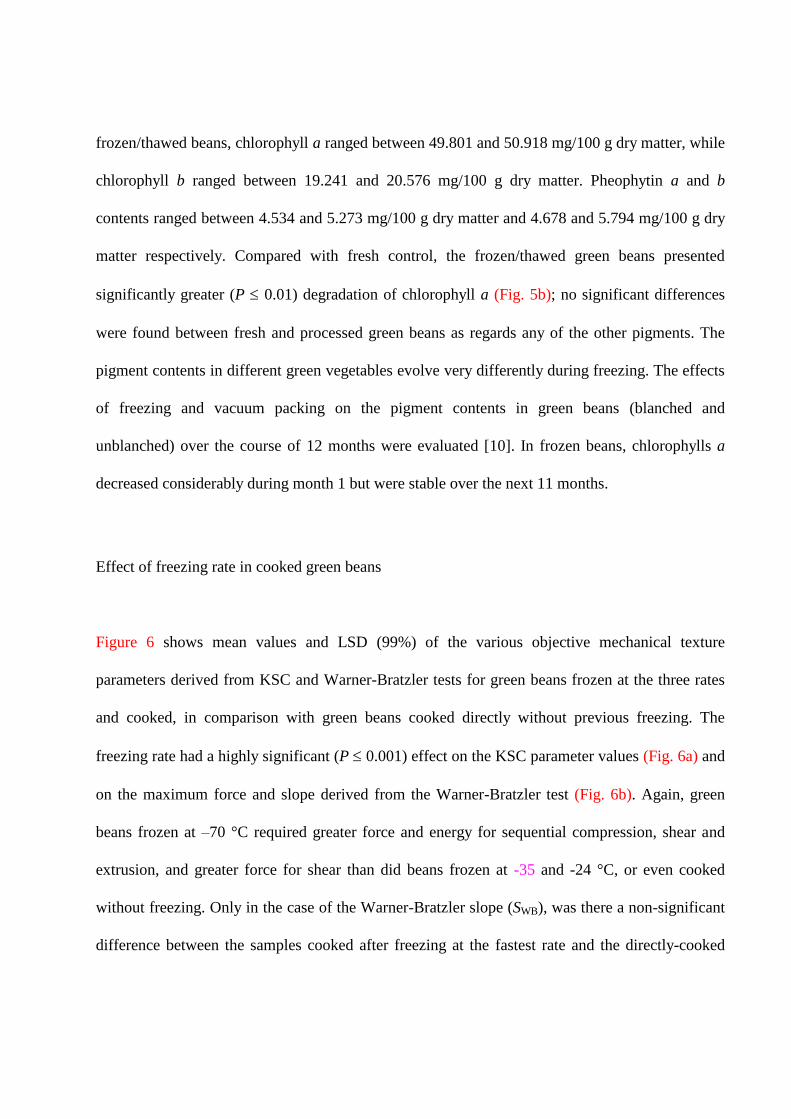
Brown [5] showed that different freezing rates (for freezing times of 1, 5, and 20 or more min)
affected the tissue structure of green beans differently. Ice crystals grow larger at slower freezing
rates, causing more damage to the cell structure. Fig. 4 shows microphotographs of outer
parenchyma from either fresh or frozen green bean tissues (cv. Win). The fresh tissue (Fig. 4a)
consists of relatively large cells with thick cell walls and large intercellular spaces, showing an
undamaged cell structure with numerous chloroplasts and starch granules [35]. The existence of
large intercellular spaces is consistent with previous findings, in contrast with the inner
parenchyma [15]. The tissue frozen at –24 °C (1.5 °C min-1
) presents apparent cell wall
breakdown, and the cell damage is quite appreciable (Fig. 4b,c). In both thawing modes, tissue
tearing is very apparent with a high incidence of cell and cell wall rupture. Cells appear to be
contracted and dehydrated by loss of internal cell pressure. To the contrary, there are practically no
appreciable differences in morphology between fresh and frozen beans at –70 °C (5.4 °C min-1
),
which exhibit an undamaged structure where the thick cell walls appear to be in a state of stress
even after thawing (Fig. 4d,e). There are no appreciable differences between the morphology of
beans thawed in air and by water immersion at any of the freezing rates (Fig. 4b,c and Fig. 4d,e).
Microphotographs confirmed that the damage to the cell structure was more dependent on freezing
rate than on the thawing mode, as several of the objective texture parameters indicated.
Page 13
Both textural and structural results suggest that the freezing rate is inversely related to the
degree of structural damage caused in a vegetable product, since the freezing rate determines the
size and location of the ice crystals that form [6]. A slow freezing rate (1.5 °C min-1
) alters the
cellular structure of the beans, producing migration of water molecules from their normal location
to the crystallization sites. The result is an increase in internal tension, giving rise to cell
separation, collapse, and rupturing of cell walls and loss of turgidity after thawing. In contrast,
quick freezing (5.4 °C min-1
) increases the number and reduces the size of the ice crystals,
reducing the mechanical damage to the tissue structure, as reflected in the texture of the product.
Fig. 5a illustrates the effect of freezing and thawing rates on the various colour parameters.
The effect of both rates was highly significant for all colour parameters (P 0.01) except
saturation, where the effect of the freezing rate was only significant at (P 0.05). Interaction
between the two effects was not significant, which is indicative of the significance of each main
effect studied independently of the other one. Luminescence values (L*) were significantly lower
at the lowest freezing rate and higher at the highest freezing rate, whereas coloration values ()
were highest at the lowest freezing rate and lowest at the highest freezing rate, indicating that the
quickest freezing rendered this bean variety less green than the slowest freezing. Freezing at an
intermediate rate induced luminescence and coloration values intermediate between those found at
extreme freezing rates. Luminescence (L*) and saturation (r) values were highest when frozen
beans were thawed in air, whereas coloration values () were highest at the fastest thawing rate
determined by water immersion, indicating that the slowest thawing rendered this bean variety less
green than did the quickest thawing. Irrespective of the thawing medium, increased freezing rates
produced a lighter-coloured product, confirming previous findings [36]. This author stated that
Page 14
vegetable tissues that are frozen at slow rates and thawed commonly present darkening similar to
that found after blanching. This fact is due to the changes caused in the slowly frozen tissue by the
presence of extra-cellular water, which alters the reflectance surface as well as the light
penetration depth. Overall analysis of the colour parameters for the frozen/thawed samples and the
fresh control revealed highly significant (P 0.001) differences in all cases. For the sake of
brevity, plots are not shown. Comparison of the mean values of luminescence (LSD, 99%=2.54)
and coloration (LSD, 99%=0.021) showed that frozen/thawed samples presented lower
luminescence and higher coloration, i.e., had a darker green colour, than fresh control. Green
beans frozen at –24 °C and thawed in water presented the lowest luminescence and the highest
coloration values. With respect to saturation (LSD, 99%=0.169), all the frozen/thawed samples
had significantly higher values than the fresh control, except the beans frozen at –24 °C and
thawed in water; in this case, although they also presented higher saturation than the fresh control,
the differences were not statistically significant. Such a result was to be expected when comparing
a fresh product with its frozen/thawed counterpart. However, as noted above, with the quickest
freezing and air thawing, the beans were less green than with the slowest freezing and the quickest
thawing; the difference from the colour of fresh beans can therefore be expected to decrease.
Results show that the quickest freezing and the slowest thawing had the least negative effect on
the greenness of beans.
Nevertheless, freezing and thawing rates and their interaction had non-significant effects on
chlorophylls a and b and pheophytins a and b, confirming previous findings (plots are not shown
for the sake of brevity). Also, chlorophylls a and b were retained during thawing at ambient
temperatures, with retentions averaging 93.78% and 93.41%, respectively [17]. In the
Page 15
frozen/thawed beans, chlorophyll a ranged between 49.801 and 50.918 mg/100 g dry matter, while
chlorophyll b ranged between 19.241 and 20.576 mg/100 g dry matter. Pheophytin a and b
contents ranged between 4.534 and 5.273 mg/100 g dry matter and 4.678 and 5.794 mg/100 g dry
matter respectively. Compared with fresh control, the frozen/thawed green beans presented
significantly greater (P 0.01) degradation of chlorophyll a (Fig. 5b); no significant differences
were found between fresh and processed green beans as regards any of the other pigments. The
pigment contents in different green vegetables evolve very differently during freezing. The effects
of freezing and vacuum packing on the pigment contents in green beans (blanched and
unblanched) over the course of 12 months were evaluated [10]. In frozen beans, chlorophylls a
decreased considerably during month 1 but were stable over the next 11 months.
Effect of freezing rate in cooked green beans
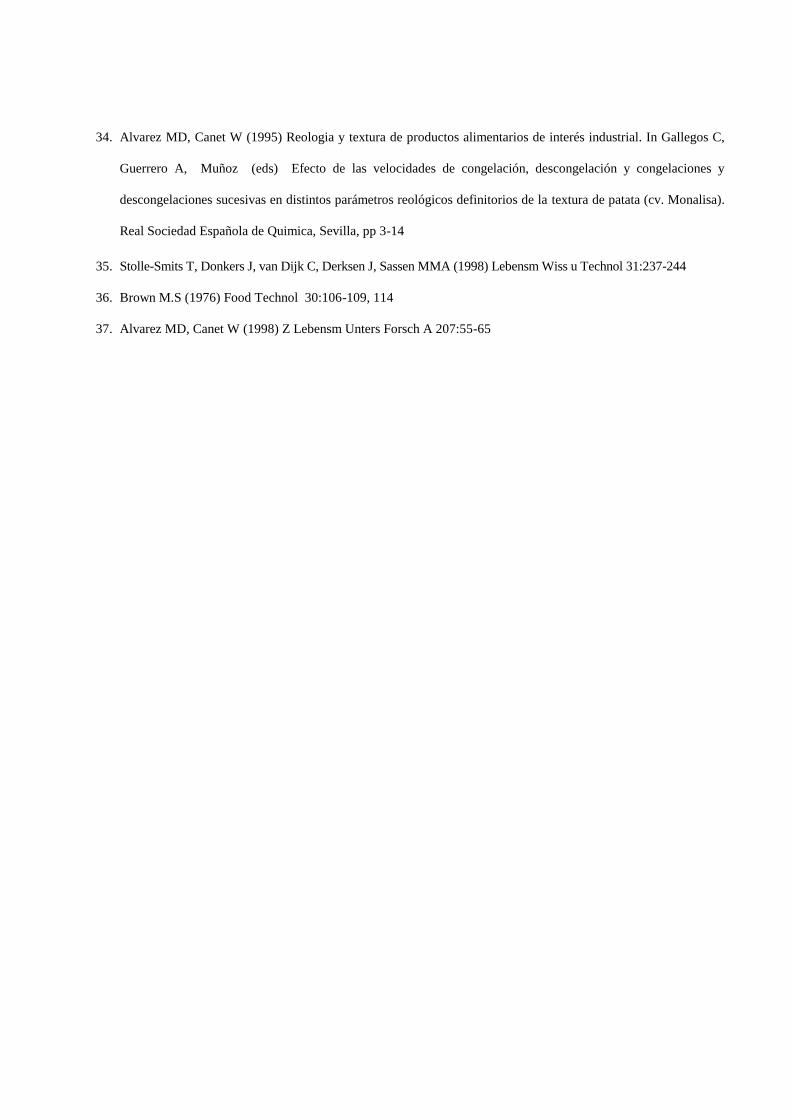
Figure 6 shows mean values and LSD (99%) of the various objective mechanical texture
parameters derived from KSC and Warner-Bratzler tests for green beans frozen at the three rates
and cooked, in comparison with green beans cooked directly without previous freezing. The
freezing rate had a highly significant (P 0.001) effect on the KSC parameter values (Fig. 6a) and
on the maximum force and slope derived from the Warner-Bratzler test (Fig. 6b). Again, green
beans frozen at –70 °C required greater force and energy for sequential compression, shear and
extrusion, and greater force for shear than did beans frozen at -35 and -24 °C, or even cooked
without freezing. Only in the case of the Warner-Bratzler slope (SWB), was there a non-significant
difference between the samples cooked after freezing at the fastest rate and the directly-cooked
Page 16
control. The results indicate that the fastest freezing produced the least damage to green bean; this
effect was detectable even after cooking the product. Of the objective parameters used to detect
the effect of the freezing rate on thawed and cooked samples, KSC maximum force (Fig. 6a) and
Warner-Bratzler slope (Fig. 6b) presented the lowest values of relative LSD, which means that
more significant differences can be found using these parameters, and the latter (SWB) having the
advantage of being independent of sample weight.
Fig. 7 shows microphotographs of outer parenchyma of either directly-cooked beans or
beans cooked after freezing at the three rates. Note how the direct relationship between the
freezing rate and the degree of structural damage is quite evident in the beans frozen and
subsequently thawed by traditional boiling in water. Unlike the cooked control (Fig. 7a), freezing
caused rupturing of some cell walls, which displayed fissures resulting from internal tensions in
the tissue caused by the change of phase from water to ice. However, increasing the freezing rate
(Fig. 7b-d) reduced the damage induced by freezing. Gelatinised starch granules are visible in all
the microphotographs of samples after cooking. It is known that both freezing and cooking
processes soften green bean tissue although in different manners. While freezing causes cell wall
rupture, cooking mainly causes solubilisation of intercellular pectin and extensive cell separation.
Some cell rupture was apparent in the cooked control (Fig. 7a). The rupture of cells as a
consequence of boiling in water appeared to be due to distension of the cell wall [37].
Overall analysis of the objective colour parameters from the frozen and cooked samples and
the cooked control (Fig. 8) revealed highly significant differences in luminescence (L*) and
coloration () (P 0.001), and significant differences in saturation (r) (P 0.01). Freezing prior to
cooking significantly increased the luminescence of the beans with respect to the unfrozen control,
Page 17
while the differences between samples frozen at different rates were not significant. Frozen and
cooked beans presented the same colour saturation, while the samples frozen at –35 °C presented
the highest saturation value. The coloration of all the frozen and cooked beans was significantly
weaker than that of the directly-cooked beans, indicating that freezing prior to cooking produces
lighter-coloured beans than does direct cooking. When beans were thawed after freezing, a faster
freezing rate produced lighter-coloured beans, while when beans were cooked after freezing; a
faster freezing rate produced darker-coloured beans. Samples frozen at –24 °C and cooked
presented the lowest greenness, which may be ascribed to chloroplast degradation due to superior
cellular damage caused by slow freezing; this can cause pigments to migrate to the inner
parenchyma, hence producing a lower chlorophyll concentration in the outer epidermis,
hypodermis and outer parenchyma.
Comparison of the pigment contents of the frozen and cooked samples with those of cooked
control (data not shown) showed non-significant differences for the different pigments (P > 0.05).
Chlorophyll a ranged between 15.180 and 15.999 mg/100 g dry matter, whereas chlorophyll b
ranged between 13.344 and 14.399 mg/100 g dry matter. With respect to pheophytins a and b,
values ranged between 39.639 and 41.181 and between 12.144 and 13.072 mg/100 g dry matter
respectively. Note that in the case of pigment values of frozen samples thawed at ambient
temperature, cooking decreased chlorophyll content, mainly chlorophyll a, and noticeably
increased both types of pheophytin, mainly pheophytins a. Pheophytisation is enhanced by the
increase in H+ concentration, in which the centre magnesium of chlorophylls is replaced by
hydrogen, forming pheophytine. Pheophytine gives an olive-brown colour to green beans [17].
Page 18
The effect of freezing rate on the average scores given by the panellists to all the sensory
attributes in the cooked beans was not significant (P 0.05). In other words, in sensory terms
panellists found the colour, texture and flavour of the directly-cooked beans and of beans
previously frozen at any freezing rate, to be equally acceptable. With respect to colour attributes,
the cooked green beans scored intermediate for greenness (average score 3), with high uniformity
(average score 4), no off-colours (average score 5) and with a moderately low shine (average score
3). Also, the cooked beans scored as acceptable for tenderness and firmness (average scores 4),
with no fibrosity (average score 1), moderate for sweet taste (average score 3), high for authentic
taste (average score 4) and low for a bitter or off-taste (average score 1). The results for the effect
of the freezing rate on sensory texture attributes (tenderness and firmness) and sensory colour
attributes (greenness, shine, uniformity) of cooked beans do not corroborate the results for the
objective texture (FKSC, EKSC, FWB, SWB) and colour (L*, r, ) parameters, which indicated a
significant difference as shown above. These discrepancies demonstrate the effect adverse of
cooking on sensory attributes, masking the different structural alterations caused by rapid or slow
freezing. Sensory properties are generally used to quantify the shelf-life of frozen vegetables, and
properties such as the perception of colour, texture and flavour have been used to quantify quality
as perceived by the consumer. However, Martins and Silva [1] found that sensory parameters may
not be the most suitable shelf-life limiting factors in frozen vegetables, as our results confirm. To
the contrary, they corroborate other studies in which objective texture analysis methods have been
successfully used to detect the effect of rapid freezing rates, even after cooking in the case of
green beans [7].
Page 19
Conclusions
Tissues of green beans frozen at the fastest rate (5.4 °C min-1
) and air-thawed at the slowest rate
(0.35 °C min-1
) presented the highest mechanical resistance, with the freezing rate causing more
mechanical damage to the tissue structure than the thawing rate. Objective texture tests detected
the positive effect on the texture of the green beans of increasing the freezing rate, even after
cooking. Cell damage caused to frozen and cooked beans correlated inversely with the freezing
rate, i.e., a higher freezing rate reduced the damage to texture and tissue structure. All the
parameters of the mechanical tests used in this research discriminate between beans frozen at
different freezing rates, but not all permit an assessment of the effect of thawing on the tissue. The
slope is the parameter of the Warner-Bratzler test curve that best reflects the changes occurring in
the texture and structure of the tissue as a result of freezing in the case of both thawed and cooked
beans, being independent of the sample weight. Frozen and thawed green beans were darker than
fresh control, whereas frozen and cooked beans were lighter than directly cooked controls. When
the beans were thawed, a higher freezing rate reduced the greenness of the samples; water thawing
produced darker samples than air-thawing, while in cooked beans a higher freezing rate increased
greenness.
Page 20
Acknowledgements The authors wish to thank the Instituto Nacional de Investigação Agrária (INIA Proj Piddac
117/97), the Consejo Superior Investigaciones Científicas (CICyT, Project ALI98-1055) (Spain) and Junta Nacional de
Investigacão Científica y Tecnológica de Portugal (Proc nº 423/CSIC), which financially supported this cooperative
research.
Page 21
References
1. Martins RC, Silva CLM (2004) J Food Eng 64:481-488 (DOI: 10.1016/j.foodeng.2003.11.015)
2. Euromonitor (2000) Market Res Eur 32:69-110
3. Canet W, Alvarez MD, Luna P, Fernández C (2004) Eur Food Res Technol 219:240-250. (DOI: 10.1007/s00217-
004-0953-y)
4. Gutschmidt J (1968) In Hawthorn J, Rolfe EJ (eds) Low Temperature Biology of Foodstuffs. Pergamon Press,
London, pp 299
5. Brown MS (1967) J Sci Food Agric 18:77-81
6. Canet W (1989) Quality and stability of frozen vegetables. In: Thorne S (ed) Developments in food preservation,
Chap 5. Elsevier, London, pp 1-50
7. Brown MS (1973) Texture of frozen vegetables: effect of freezing rate on softening during cooking. In
International Institute of Refrigeration (ed) Proceedings of 13th
International Congress of Refrigeration. Vol 3 pp
491-497
8. Chourot JM, Lauwers J, Massoji N, Lucas T (2001) Int J Food Sci Technol 36:179-187
9. Chen BH, Peng HY, Chen HE (1995) J Agric Food Chem 43:1912-1918
10. Oruña MJ, González MJ, López J, Simal J (1997) Z Lebensm Unters Forsch A 205:148-152
11. Belitz HD, Grosch W (1988) Lehrbuch der Lebensmittelchemie. Acribia, Zaragoza, Chapter 17, p 813
12. Alvarez MD, Morillo MJ, Canet W (1999) J Sci Food Agric 79:1237-1248
13. Alvarez MD, Canet W (1999) Eur Food Res Technol 210:102-108
14. Canet W, Alvarez MD (2000) Congelación de alimentos vegetales. In: Madrid A, Mundi-Prensa (eds) Aplicación
del frío a los alimentos, Chap 7. Mundi-Prensa, Madrid, pp 201-258
15. Canet W, Alvarez MD, Luna P, Fernández C, Tortosa ME (2005) Eur Food Res Technol 220:421-430. (DOI:
10.1007/s00217-004-1051-x)
16. De la Cruz C, González MJ, Oruña MJ, López J, Simal JA, Simal J (1997) Food Res Int 30:787-791
17. Martins RC, Silva CLM (2004) J Food Eng 64:455-464 (DOI: 10.1016/j.foodeng.2003.11.012)
18. IPQ-NP-2447 (1993) Feijão Verde Ultracongelado: Definição, Características, Classificação, Acondicionamento
e Marcação. Direcção Geral da Qualidade, Lisboa
Page 22
19. International Institute of Refrigeration (1986). Recommendations for the processing and handling of frozen foods
(ed by International Institute of Refrigeration), 3rd
edn.
20. FAO-WHO (1972) Standard Procedure for Cooking of Quick Frozen Vegetables (CAC/RN 33 -- 1970). In FAO;
WHO (eds) - Recommended International Standard Procedures for Thawing of Quick-Frozen Fruits and
Vegetables and Cooking of Quick-Frozen Vegetables for Examination Purposes, FAO-WHO Food Standards
Programme, FAO, Roma, pp 8-9
21. Ferreira A, Abano R, Mota T, Canet W (1995) Reologia y textura de productos alimentarios de interés industrial.
In Gallegos C, Guerrero A, Muñoz (eds) Evaluación objectiva de la textura de judía verde (cv. Win). Efecto del
escaldado y las velocidades de congelación y descongelación. Real Sociedad Española de Quimica, Sevilla, pp
27-37
22. Canet W (1988) J Microwave Power 23:231-235
23. Canet W, Tortosa ME (1990). In: Sociedad Española de Ciencias Hortícolas (ed). Estudio de las modificaciones
estructurales y de textura debidas a la congelación de guisante. Actas de Horticultura. Sociedad Española de Ciencias
Hortícolas, Córdoba, pp 480-485
24. Alvarez MD, Canet W, Tortosa ME (1997) Z Lebensm Unters Forsch A 204:356-364
25. Little AC (1975) J Food Sci 40:410-411
26. Clydesdale FM (1991) J Food Quality 14:61
27. Mcguire RG (1992) HortSci 27:1254-1255
28. Vernon LP (1960) Anal Chem 32:1144-1150
29. Adams MJ, Bedford LV, Geering J (1981) QAV – A method for the sensory appraisal of quality processed
vegetable varieties. Technical memorandum, 278. The Campden Food Preservation Research Association,
Chipping Campden
30. Fuchigami M, Hyakumoto N, Miyazaki K, Nomura T, Sakaki J (1994) J Food Sci 59:1162-1167
31. Fuchigami M, Hyakumoto N, Miyazaki K (1995) J Food Sci 60:132-136
32. Fuchigami M, Hyakumoto N, Miyazaki K, Nomura T, Sakaki J (1995) J Food Sci 60:1260-1264
33. Alonso J, Canet W (1994) J Sci Food Agric 66:1-7
Page 23
34. Alvarez MD, Canet W (1995) Reologia y textura de productos alimentarios de interés industrial. In Gallegos C,
Guerrero A, Muñoz (eds) Efecto de las velocidades de congelación, descongelación y congelaciones y
descongelaciones sucesivas en distintos parámetros reológicos definitorios de la textura de patata (cv. Monalisa).
Real Sociedad Española de Quimica, Sevilla, pp 3-14
35. Stolle-Smits T, Donkers J, van Dijk C, Derksen J, Sassen MMA (1998) Lebensm Wiss u Technol 31:237-244
36. Brown M.S (1976) Food Technol 30:106-109, 114
37. Alvarez MD, Canet W (1998) Z Lebensm Unters Forsch A 207:55-65
Page 24
Figure legends
Fig. 1 Mechanical force-deformation curves and test cells used in the rheological characterisation of green beans. a 10
Kramer shear cell. b Warner-Bratzler shear blade
Fig. 2 Effect of freezing and thawing rates on the mechanical properties of green beans (cv. Win). a KSC test, b
Warner-Bratzler test
Fig. 3 Comparison between fresh and frozen/thawed green bean mechanical properties a KSC test, b Warner-Bratzler
test
Fig. 4 Microphotographs of fresh and frozen green bean tissues (cv. Win) thawed at ambient temperatures A Fresh
control, B Frozen at -24 °C and air thawed; C Frozen at -24 °C and water thawed, D Frozen at -70 °C and air thawed;
E Frozen at -70 °C and water thawed (1cm=66.7 m) CW cell wall, IS intercellular space, St starch
Fig. 5 a Effect of freezing and thawing rates on the Cartesian and polar colour coordinates, b Comparison between
fresh and frozen/thawed green bean chlorophylls and pheophytins
Fig. 6 Effect of freezing rate on the mechanical properties of cooked green beans (cv. Win). a KSC test, b Warner
Bratzler test
Fig. 7 Microphotographs of cooked and frozen green bean tissues (cv. Win) thawed by direct cooking A Cooked
control (1cm=66.7 m); B Frozen at -24 °C and cooked (1cm=85.2 m), C Frozen at -35 °C and cooked (1cm=85.2
m), D Frozen at -70 °C and cooked (1cm=85.2 m)
Fig. 8 Effect of freezing rate on the Cartesian and polar colour coordinates of cooked green beans (cv. Win)
Page 25
Table 1 Softening coefficients of objective texture parameters per °C min-1
reduction during freezing process
Thawing mode FKSC EKSC FWB SWB EWB
(N/g d.m) (J/g d.m) (N) (N mm-1
) (J 10–3
)
Air at +20 °C 2.329 1.883 3.296 3.877 4.661
Water at +20 °C 3.030 2.392 3.062 4.725 2.176
Page 26
Figure 1
A
B
AA
BB
Page 27
Figure 2
Freezing at -24°C Freezing at -35°C Freezing at -70°C
Air thawing Water thawing
250
270
290
310
Treatments
KS
C m
ax
imu
mfo
rce
(N/g
d.m
)
LSD,99%=7.550
Freezing Thawing5.00
5.50
6.00
6.50
7.00
KS
C e
ner
gy
(J/g
d.m
)
LSD,99%=0.194
A
Treatments
Freezing Thawing
B
Freezing at -24°C Freezing at -35°C Freezing at -70°C
Air thawing Water thawing
24
25
26
27
28
29
30
Treatments
WB
ma
xim
um
force
(N)
LSD,99%=0.970 LSD,99%=0.790
Freezing Thawing
6.50
6.75
7.00
7.25
7.50
7.75
8.00
WB
slo
pe
(N/m
m)
LSD,99%=0.461
LSD,99%=0.377
50
55
60
65
70
WB
en
erg
y(J
x1
0 ) LSD,99%=3.45
TreatmentsFreezing Thawing
TreatmentsFreezing Thawing
Freezing at -24°C Freezing at -35°C Freezing at -70°C
Air thawing Water thawing
250
270
290
310
Treatments
KS
C m
ax
imu
mfo
rce
(N/g
d.m
)
LSD,99%=7.550
Freezing Thawing5.00
5.50
6.00
6.50
7.00
KS
C e
ner
gy
(J/g
d.m
)
LSD,99%=0.194
A
Treatments
Freezing Thawing
Freezing at -24°C Freezing at -35°C Freezing at -70°C
Air thawing Water thawing
250
270
290
310
Treatments
KS
C m
ax
imu
mfo
rce
(N/g
d.m
)
LSD,99%=7.550
Freezing Thawing5.00
5.50
6.00
6.50
7.00
KS
C e
ner
gy
(J/g
d.m
)
LSD,99%=0.194
A
Treatments
Freezing Thawing
B
Freezing at -24°C Freezing at -35°C Freezing at -70°C
Air thawing Water thawing
24
25
26
27
28
29
30
Treatments
WB
ma
xim
um
force
(N)
LSD,99%=0.970 LSD,99%=0.790
Freezing Thawing
6.50
6.75
7.00
7.25
7.50
7.75
8.00
WB
slo
pe
(N/m
m)
LSD,99%=0.461
LSD,99%=0.377
50
55
60
65
70
WB
en
erg
y(J
x1
0 ) LSD,99%=3.45
TreatmentsFreezing Thawing
TreatmentsFreezing Thawing
Page 28
Figure 3
250
270
290
310
Treatments
KS
C m
axim
um
forc
e(N
/g d
.m)
LSD,99%=10.04
5.00
5.50
6.00
6.50
7.00
Treatments
KS
C e
ner
gy
(J/g
d.m
)
LSD,99%=0.314
Fresh control Freezing at -24°C/Air thawing Freezing at -24°C/Water thawing
Freezing at -35°C/Air thawing Freezing at -35°C/Water thawing Freezing at -70°C/Air thawing
Freezing at -70°C/Water thawing
A
50
55
60
65
70
75
80
85
Treatments
WB
en
erg
y(J
x1
0-3
) LSD,99%=5.51
6.50
7.00
7.50
8.00
8.50
9.00
9.50
Treatments
WB
slo
pe
(N/m
m) LSD,99%=0.646
22
24
26
28
30
32
34
Treatments
WB
ma
xim
um
forc
e(N
)
LSD,99%=1.38
Fresh control Freezing at -24°C/Air thawing Freezing at -24°C/Water thawing
Freezing at -35°C/Air thawing Freezing at -35°C/Water thawing Freezing at -70°C/Air thawing
Freezing at -70°C/Water thawing
B
250
270
290
310
Treatments
KS
C m
axim
um
forc
e(N
/g d
.m)
LSD,99%=10.04
5.00
5.50
6.00
6.50
7.00
Treatments
KS
C e
ner
gy
(J/g
d.m
)
LSD,99%=0.314
Fresh control Freezing at -24°C/Air thawing Freezing at -24°C/Water thawing
Freezing at -35°C/Air thawing Freezing at -35°C/Water thawing Freezing at -70°C/Air thawing
Freezing at -70°C/Water thawing
A
50
55
60
65
70
75
80
85
Treatments
WB
en
erg
y(J
x1
0-3
) LSD,99%=5.51
6.50
7.00
7.50
8.00
8.50
9.00
9.50
Treatments
WB
slo
pe
(N/m
m) LSD,99%=0.646
22
24
26
28
30
32
34
Treatments
WB
ma
xim
um
forc
e(N
)
LSD,99%=1.38
Fresh control Freezing at -24°C/Air thawing Freezing at -24°C/Water thawing
Freezing at -35°C/Air thawing Freezing at -35°C/Water thawing Freezing at -70°C/Air thawing
Freezing at -70°C/Water thawing
B
Page 29
Figure 4
66.7 m
St
CW
IS
66.7 m66.7 m66.7 m
St
CW
IS
Page 31
Figure 6
Freezing at -70°C+
cookingTes temunha Cong. -24°C/Coz. Cong. -35°C/Coz. Cong . -70°C/Coz.
0,80
1,00
1,20
1,40
1,60
Tratam e n tos
Tr
ab
alh
o (
J/g
m.s
.) LS D
40
50
60
70
80
Tratam e n tos
Fo
rç
a M
áx
ima
(N
/g m
.s.)
LS D
KS
C m
ax
imu
mfo
rce
(N/g
d.m
)
KS
C e
ner
gy
(J/g
d.m
)
Treatments Treatments
LSD,99%=2.50 LSD,99%=0.08
Freezing at -24°C+
cooking
Freezing at -35°C+
cookingCooked control
Freezing at -70°C+
cooking
0.80
1.00
1.20
1.40
1.60
A
B
T e s te mu n h a Co n g . -24°C/Co z. Co n g . -35°C/Co z. Co n g . -70°C/Co z.
2
3
4
5
6
7
Tra ta m e n to s
Fo
rç
a M
áx
ima
(N
)
LS D
5
7
9
11
13
15
Tra ta m e n to s
Tr
ab
alh
o (
Jx
10
-3 )
0,60
0,80
1,00
1,20
1,40
1,60
1,80
2,00
Tra ta m e n to s
Pe
nd
en
te (
N/m
m) LS D
LSD,99%=0.30
LSD,99%=0.136
Treatments
Treatments Treatments
Freezing at -24°C+
cooking
Freezing at -35°C+
cookingCooked control
Freezing at -70°C+
cooking
WB
ma
xim
um
force
(N)
0.60
2.00
WB
slo
pe
(N/m
m)
WB
en
erg
y(J
x1
0-3
)
0.80
1.00
1.20
1.40
1.60
1.80
Freezing at -70°C+
cookingTes temunha Cong. -24°C/Coz. Cong. -35°C/Coz. Cong . -70°C/Coz.
0,80
1,00
1,20
1,40
1,60
Tratam e n tos
Tr
ab
alh
o (
J/g
m.s
.) LS D
40
50
60
70
80
Tratam e n tos
Fo
rç
a M
áx
ima
(N
/g m
.s.)
LS D
KS
C m
ax
imu
mfo
rce
(N/g
d.m
)
KS
C e
ner
gy
(J/g
d.m
)
Treatments Treatments
LSD,99%=2.50 LSD,99%=0.08
Freezing at -24°C+
cooking
Freezing at -35°C+
cookingCooked control
Freezing at -70°C+
cooking
0.80
1.00
1.20
1.40
1.60
A
B
T e s te mu n h a Co n g . -24°C/Co z. Co n g . -35°C/Co z. Co n g . -70°C/Co z.
2
3
4
5
6
7
Tra ta m e n to s
Fo
rç
a M
áx
ima
(N
)
LS D
5
7
9
11
13
15
Tra ta m e n to s
Tr
ab
alh
o (
Jx
10
-3 )
0,60
0,80
1,00
1,20
1,40
1,60
1,80
2,00
Tra ta m e n to s
Pe
nd
en
te (
N/m
m) LS D
LSD,99%=0.30
LSD,99%=0.136
Treatments
Treatments Treatments
Freezing at -24°C+
cooking
Freezing at -35°C+
cookingCooked control
Freezing at -70°C+
cooking
WB
ma
xim
um
force
(N)
0.60
2.00
WB
slo
pe
(N/m
m)
WB
en
erg
y(J
x1
0-3
)
0.80
1.00
1.20
1.40
1.60
1.80
Page 32
Figure 7
85.2 m 85.2 m 85.2 m
66.7 m
85.2 m85.2 m 85.2 m85.2 m 85.2 m85.2 m
66.7 m66.7 m