99
FREIGHT PLANNING GUIDANCE | October 2020 PUB 790 (10-20) www.penndot.gov

FREIGHT PLANNING
GUIDANCE
| October 2020
PUB 790 (10-20)
www.penndot.gov

Epigraph
EPIGRAPH
“
”
As the global supply chain continues to grow and evolve, innovations and new technologies will continue to shift the landscape of how goods are moved across the world and delivered to our doorstep. While national and state level freight planning efforts are critical at a global and national level, regional freight planning is equally vital and more aligned to the context of local communities. PennDOT has developed a valuable firstofakind resource of bestpractices for regional freight planning and a great tool for planners across the nation.
PennDOT Secretary Yassmin Gramian, P.E.
i

Epigraph
“
”
In the I95 Freight Academy classes we intentionally do not focus on long range planning and public policy, but rather work to provide a context of how the goods movement industry functions in an operational, 24/7/365 environment. We want to help public agency staff understand the everyday challenges freight operators are faced with in doortodoor supply chain, network reliability, and realworld operations and costs. This is intended to encourage them to incorporate this understanding of goods movement/supply chains into planning, policy, and system operations within their agencies and to encourage greater collaboration internally with other public agency staff whose work impacts goods movement, as well as to external stakeholders. Each region must understand the context of who they are and how they fit into the larger geographical supply chain. When it comes to moving freight, a local region is only one piece of many puzzles along a supply chain. Any one region is not the sum of all parts but the sum of many parts. That’s a great place to start for making changes within their region and collaboratively with others, that will improve the larger network and daytoday operations.
Mary Grace Parker, The Eastern Transportation Coalition
ii
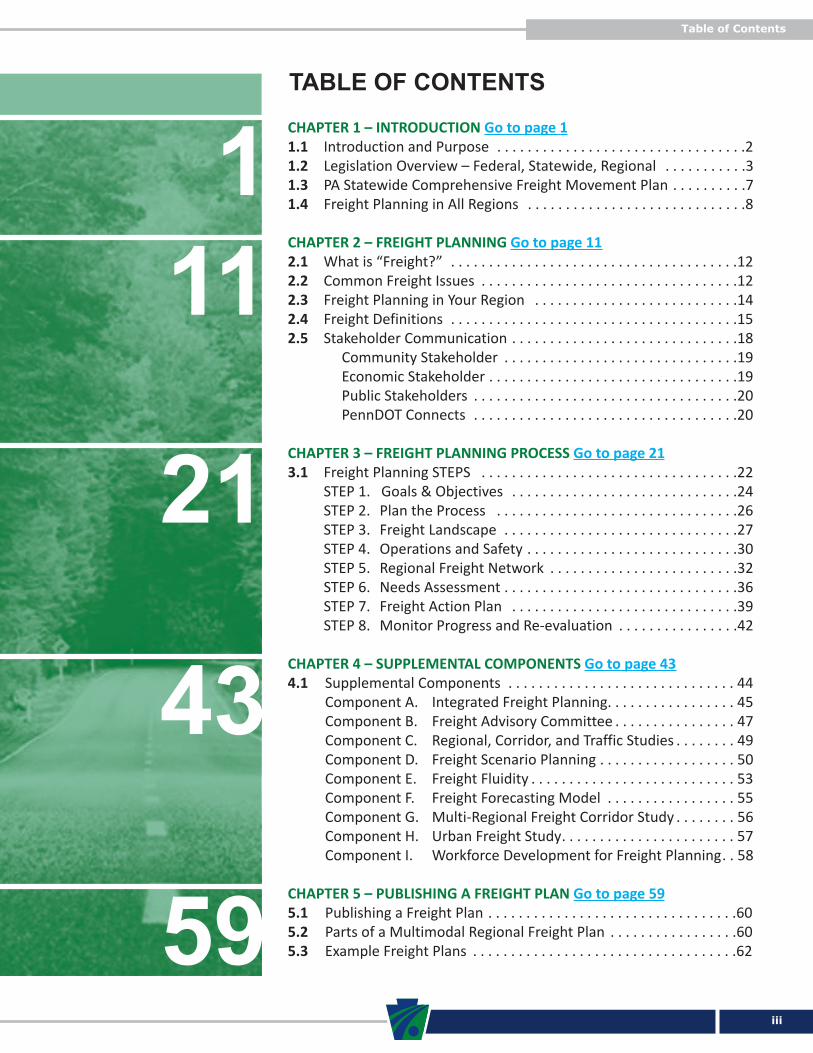
Table of Contents
CHAPTER 1 – INTRODUCTION Go to page 1 1.1 Introduction and Purpose . . . . . . . . . . . . . . . . . . . . . . . . . . . . . . . . .2 1.2 Legislation Overview – Federal, Statewide, Regional . . . . . . . . . . .3 1.3 PA Statewide Comprehensive Freight Movement Plan . . . . . . . . . .7 1.4 Freight Planning in All Regions . . . . . . . . . . . . . . . . . . . . . . . . . . . . .8 CHAPTER 2 – FREIGHT PLANNING Go to page 11 2.1 What is “Freight?” . . . . . . . . . . . . . . . . . . . . . . . . . . . . . . . . . . . . . .12 2.2 Common Freight Issues . . . . . . . . . . . . . . . . . . . . . . . . . . . . . . . . . .12 2.3 Freight Planning in Your Region . . . . . . . . . . . . . . . . . . . . . . . . . . .14 2.4 Freight Definitions . . . . . . . . . . . . . . . . . . . . . . . . . . . . . . . . . . . . . .15 2.5 Stakeholder Communication . . . . . . . . . . . . . . . . . . . . . . . . . . . . . .18 Community Stakeholder . . . . . . . . . . . . . . . . . . . . . . . . . . . . . . .19 Economic Stakeholder . . . . . . . . . . . . . . . . . . . . . . . . . . . . . . . . .19 Public Stakeholders . . . . . . . . . . . . . . . . . . . . . . . . . . . . . . . . . . .20 PennDOT Connects . . . . . . . . . . . . . . . . . . . . . . . . . . . . . . . . . . .20 CHAPTER 3 – FREIGHT PLANNING PROCESS Go to page 21 3.1 Freight Planning STEPS . . . . . . . . . . . . . . . . . . . . . . . . . . . . . . . . . .22 STEP 1. Goals & Objectives . . . . . . . . . . . . . . . . . . . . . . . . . . . . . .24 STEP 2. Plan the Process . . . . . . . . . . . . . . . . . . . . . . . . . . . . . . . .26 STEP 3. Freight Landscape . . . . . . . . . . . . . . . . . . . . . . . . . . . . . . .27 STEP 4. Operations and Safety . . . . . . . . . . . . . . . . . . . . . . . . . . . .30 STEP 5. Regional Freight Network . . . . . . . . . . . . . . . . . . . . . . . . .32 STEP 6. Needs Assessment . . . . . . . . . . . . . . . . . . . . . . . . . . . . . . .36 STEP 7. Freight Action Plan . . . . . . . . . . . . . . . . . . . . . . . . . . . . . .39 STEP 8. Monitor Progress and Reevaluation . . . . . . . . . . . . . . . .42 CHAPTER 4 – SUPPLEMENTAL COMPONENTS Go to page 43 4.1 Supplemental Components . . . . . . . . . . . . . . . . . . . . . . . . . . . . . . 44 Component A. Integrated Freight Planning. . . . . . . . . . . . . . . . . 45 Component B. Freight Advisory Committee . . . . . . . . . . . . . . . . 47 Component C. Regional, Corridor, and Traffic Studies . . . . . . . . 49 Component D. Freight Scenario Planning . . . . . . . . . . . . . . . . . . 50 Component E. Freight Fluidity . . . . . . . . . . . . . . . . . . . . . . . . . . . 53 Component F. Freight Forecasting Model . . . . . . . . . . . . . . . . . 55 Component G. MultiRegional Freight Corridor Study . . . . . . . . 56 Component H. Urban Freight Study. . . . . . . . . . . . . . . . . . . . . . . 57 Component I. Workforce Development for Freight Planning. . 58 CHAPTER 5 – PUBLISHING A FREIGHT PLAN Go to page 59 5.1 Publishing a Freight Plan . . . . . . . . . . . . . . . . . . . . . . . . . . . . . . . . .60 5.2 Parts of a Multimodal Regional Freight Plan . . . . . . . . . . . . . . . . .60 5.3 Example Freight Plans . . . . . . . . . . . . . . . . . . . . . . . . . . . . . . . . . . .62
iii
TABLE OF CONTENTS
11
21
1
43
59

Table of Contents
iv
LIST OF FIGURES Figure 1 – Supply Chain Function . . . . . . . . . . . . . . . . . . . . . . . 18 Figure 2 – Shared Interests . . . . . . . . . . . . . . . . . . . . . . . . . . . . 18 Figure 3 – Community Vision . . . . . . . . . . . . . . . . . . . . . . . . . . 23 Figure 4 – National Multimodal Freight Network . . . . . . . . . . 33 Figure 5 – Pennsylvania Multimodal Freight Network . . . . . . 34
18
LIST OF TABLES Table 1 – Federal Freight Planning Evolution . . . . . . . . . . . . . . . 3 Table 2 – Freight Matrix . . . . . . . . . . . . . . . . . . . . . . . . . . . . . . . 13 Table 3 – Supply Chain Function . . . . . . . . . . . . . . . . . . . . . . . . 17 Table 4 – Components . . . . . . . . . . . . . . . . . . . . . . . . . . . . . . . . 44 Table 5 – FreightCompatible Development. . . . . . . . . . . . . . . 46
3
APPENDICES Appendix A – Freight Glossary and Acronyms. . . . . . . . . . . . . 65 Appendix B – Data Resources and Analysis . . . . . . . . . . . . . . . 88 Appendix C – Citations. . . . . . . . . . . . . . . . . . . . . . . . . . . . . . . . 92
65

Chapter 1 - Introduction
1
CHAPTERINTRODUCTION

Chapter 1 - Introduction
2
1.1 INTRODUCTION AND PURPOSE
Throughout history, entire communities have grown up around modes of transportation that could support the movement of goods and commodities from one market to another. Pennsylvania was home to the first “paved” road in America between Philadelphia and Lancaster. The Philadelphia Lancaster Turnpike was built in 1795 and, like any project, required significant planning, private funding, engineering, and skilled construction to realize the more efficient transfer of people and goods between the two markets 67 miles apart. The transportation infrastructure inherited from previous generations was built to improve efficiency and serve the needs of the past. In today’s global economy, freight movement is a complex and competitive component that is integral in all parts of society. Freight planning is an essential element of a region’s Transportation Planning effort to ensure transportation is safe and efficient for all aspects of the community. Efficient movement of freight between markets is critical to the success and livelihood of Pennsylvania’s economy. Freight movement takes on many forms and directly influences the culture and economic competitiveness of the region. Products purchased by an end user represent an accumulation of invested time, natural resources, development, manufacturing, transporting, marketing, warehousing, and selling along a complex supply chain network that reaches around the world. Even in recent years, the expansion of distribution warehouses has changed how and where people buy and sell goods. One thing that history teaches us is that the supply chain will continue to evolve with the advance of technology and efficient mobility of goods. The challenge of every region is to responsibly direct their transportation resources towards initiatives and projects that promote the vision and vitality of the region and their unique contributions within the freight economy. Regional freight planning is a community based, data driven, multimodal planning process specific to freight movement that delivers an intentional and implementable strategy for improving freight mobility and safety. Key factors include identifying the origins, routes, and destinations of freight movement; assessing the existing multimodal infrastructure; stakeholder communication; and making informed decisions to support the region’s vision for safety and the growth of its communities. The purpose of this document is to compile the best practices, resources, tools, and ideas for regional freight planning gathered from MPOs/RPOs, research, and agency guidance. Although every region and its infrastructure are unique, there are many shared best practices, lessons learned, and innovations occurring nationally that provide an opportunity for all regions to benefit. This guidance will help planners to:
• Improve the understanding of what freight planning is and how it can impact a region • Develop common language and definitions for freight planning • Follow a data driven process • Engage stakeholders • Identify freight movement within the region • Identify data resources and analysis tools • Develop an integrated multimodal Regional Freight Network specific to a region • Develop policies, land use, projects, and other initiatives to enhance the safety, mobility, and preservation of freight movement • Develop and monitor a plan for evaluating and improving performance measures that support the safe, efficient, and reliable movement of freight • Identify potential funding or grant programs to assist with projects
This regional freight planning guidance includes research, firsthand experiences, freight planning steps, resources, and examples, which serve as a “toolbox” that can be implemented in any region.
PUBLICATION 790

1.2 LEGISLATION OVERVIEW – FEDERAL, STATEWIDE, AND
REGIONAL
Freight planning has been moving to the forefront of transportation planning at the federal and state level for many years. A brief summary of the legislative requirements at the federal, state, and regional level is provided in this section. The evolution of freightrelated federal regulations is outlined in Table 1.
Chapter 1 - Introduction
3
Table 1: Federal Freight Plannning Evolution
1991Intermodal Surface Transportation Efficiency Act (ISTEA) legislation, which required metropolitan planning organizations (MPOs) and state DOTs to conduct freight planning as one of 15 factors to be considered as they developed the state and local transportation plans. This was mirrored in the two subsequent reauthorization acts.
1999 Transportation Equity for the 21st Century (TEA21).
2005 Safe, Accountable, Flexible, Efficient Transportation Equity Act: A Legacy for Users (SAFETEALU). Although it was a required consideration, freight planning was not a critical planning effort for most state and regional MPOs/RPOs.
2012 Moving Ahead for Progress in the 21st Century Act (MAP21), which included two provisions requiring the U.S. secretary of transportation to encourage states to establish state freight plans and state freight advisory committees.
2015Fixing America’s Surface Transportation Act (FAST Act) moved these provisions from Title 23 to Title 49 (Multimodal Freight Transportation) and, for the first time, required that states complete a state freight plan in order to obligate freight formula funds as provided under 23 U.S.C. 167.
2020 Multiple versions of reauthorization have been proposed which include freight related incentives and funding.
FIXING AMERICA’S SURFACE
TRANSPORTATION ACT

Chapter 1 - Introduction
4
The FAST Act, in 49 U.S.C. 70202, lists 10 required elements that all state freight plans must address for each of the transportation modes:
1. Significant freight system trends, needs, and issues; 2. Freight policies, strategies, and performance measures that will guide the freightrelated transportation
investment decisions of the state; 3. When applicable, a listing of –
• Multimodal critical rural freight facilities (National Multimodal Freight Network); • Critical rural and urban freight corridors designated within the state under section 167 of Title 23
(National Highway Freight Program); 4. Ability of the state to meet the national multimodal freight policy goals; 5. Innovative technologies and operational strategies; 6. Reducing deterioration on roads used for natural resource development; 7. An inventory of facilities with freight mobility issues, such as bottlenecks; 8. Strategies to mitigate significant congestion caused by freight movements; 9. A freight investment plan including a list of priority projects and funding; 10. Consultation with the state freight advisory committee, if applicable.
More information regarding the goals, grant programs, performance measures and other provisions of the FAST Act, can be found on the FHWA website. Regional Freight Planning Requirements MAP21 and FAST Act established performancebased planning and programming (PBPP) requirements as part of the transportation performance management rules. Title 23 Part 450 of the Code of Federal Regulations (23 CFR 450) Subpart C requires state departments of transportation, Metropolitan Planning Organizations and Rural Planning Organizations (MPOs/RPOs), and operators of public transportation to jointly agree upon and develop written provisions for how they will cooperatively develop and share information related to five key elements of PBPP:
• Transportation performance data • The selection of performance targets • The reporting of performance targets • The reporting of performance to be used in tracking critical outcomes for the region of the MPO • The collection of data for the state asset management plan for the national highway system (NHS)
In regard to transit, the Federal Transit Administration’s (FTA) Transit Asset Management Final Rule [81 FR 48890] requires public transportation providers to develop and implement a transit asset management (TAM) plan. TAM plans must include an asset inventory, condition assessments of inventoried assets, and a prioritized list of investments to improve the state of good repair of their capital assets. Pennsylvania has jointlywritten agreements between PennDOT, MPOs/RPOs, and operators of public transportation. These written provisions outline how information will be cooperatively developed and shared for the entire range of performance measures PennDOT and the MPOs/RPOs are required to maintain.

Chapter 1 - Introduction
5
Freightspecific requirements and performance metrics provide states and regions system performance information. The key element for freight planning discussed further in Chapter 3 is to dedicate the necessary time and resources toward freight planning in the MPOs/RPOs federally mandated Unified Planning Work Program (UPWP).
Illustration of the magnitude of the number of municipalities statewide
Pennsylvania’s MPOs and RPOs Map

Chapter 1 - Introduction
6
County and Municipality Planning Pennsylvania has 67 counties, 56 cities, 959 boroughs, and 1,546 townships. Each of these entities has its own laws, ordinances, and policies that define how it manages and makes decisions related to the infrastructure within its jurisdiction. As may be expected, each entity has its own operating procedures and priorities for planning and future growth. The “first and last mile” of freight delivery frequently occur on roads owned by local municipalities. Municipalities in Pennsylvania own almost twice as many roadway miles as PennDOT does and local governments control all land use and zoning ordinances. Therefore, freight mobility is highly influenced by the local governance of roads and land use. The laws and regulations in Pennsylvania were intentionally designed to empower local communities with this authority. Specifically, the intent of Section 105 of the Pennsylvania General Assembly Act 247 of 1968, known as the “Municipalities Planning Code” (MPC), was to give municipalities a broad range of authority: In this regard, the MPC vests municipalities as the primary governmental decisionmaker for local landuse, zoning, and infrastructure decisions within their jurisdiction. This authority intentionally grants municipalities a high degree of influence over, and the management of, a community’s growth, which directly impacts the demand for goods and the mobility and safety of moving freight. Ideally, through communication and planning with a common vision, communities will effectively work together for the mutual benefit of the entire region. County comprehensive plans and statewide plans can help facilitate the common vision from a broader perspective and context. The successful collaboration of all levels of government with the support and cooperation of local stakeholders and communities is the primary design and objective of the planning laws that govern the commonwealth.
“
”
It is the intent, purpose and scope of this act to: • Protect and promote safety, health and morals • Accomplish coordinated development • Provide for the general welfare by guiding and
protecting amenity, convenience, future governmental, economic, practical, and social and cultural facilities, development and growth, as well as the improvement of governmental processes and functions
• Guide uses of land and structures, type and location of streets, public grounds and other facilities
• Promote the conservation of energy through the use of planning practices and to promote the effective utilization of renewable energy sources
• Promote the preservation of this Commonwealth’s natural and historic resources and prime agricultural land
• Encourage municipalities to adopt municipal or joint municipal comprehensive plans generally consistent with the county comprehensive plan
• Promote small business development and foster a businessfriendly environment in this Commonwealth
• Ensure that municipalities adopt zoning ordinances which are generally consistent with the municipality’s comprehensive plan
• Encourage the preservation of prime agricultural land and natural and historic resources through easements, transfer of development rights and rezoning
• Ensure that municipalities enact zoning ordinances that facilitate the present and future economic viability of existing agricultural operations in this Commonwealth and do not prevent or impede the owner or operator’s need to change or expand their operations in the future in order to remain viable
• Encourage the revitalization of established urban centers
• Permit municipalities to minimize such problems as may presently exist or which may be foreseen and wherever the provisions of this act promote, encourage, require or authorize governing bodies to protect, preserve or conserve open land, consisting of natural resources, forests and woodlands, any actions taken to protect, preserve or conserve such land shall not be for the purposes of precluding access for forestry
Section 105, Municipalities Planning Code of 1968

Chapter 1 - Introduction
7
1.3 PA STATEWIDE COMPREHENSIVE
FREIGHT MOVEMENT PLAN
PennDOT published its first statewide freight plan entitled Pennsylvania Comprehensive Freight Movement Plan (CFMP) in 2016. This plan was developed by PennDOT in conjunction with PennDOT’s LongRange Transportation Plan (LRTP). By taking an integrated multimodal approach, both plans share a common vision and highlevel goals for Pennsylvania’s transportation infrastructure. The following goals guide PennDOT and the MPOs/RPOs in addressing transportation priorities:
• Safety – Improve statewide safety for all modes and all users. • System preservation – Preserve transportation assets using sound asset management practices within the
limitations of available resources. • Personal and freight mobility – Expand and improve system mobility and integrate modal connections. • Stewardship – Increase efficiency through modernization of assets and streamlining of processes.
The intention of the CFMP is to:
• Identify strategies, policies, and locations to improve freight access, interconnectivity, and mobility on Pennsylvania’s multimodal freight transportation system — improving its competitive position by attracting, retaining, and expanding industries and jobs.
• Help guide the state’s investment decisions regarding the infrastructure that supports freight movements. The CFMP met the December 4, 2017 deadline for FAST Act Compliance and addresses the following goals of MAP 21 and the FAST Act:
• Improve the contribution of the multimodal freight transportation system to economic efficiency, productivity, and competitiveness.
• Reduce congestion on the multimodal freight transportation system. • Improve the safety, security, and resilience of the multimodal freight transportation system. • Improve the stateofgood repair of the multimodal freight transportation system. • Use advanced technology, performance management, innovation, competition, and accountability in
operating and maintaining the multimodal freight transportation system. • Reduce adverse environmental and community impacts of the multimodal freight transportation system.
The importance of establishing common objectives and goals for freight planning is recognized by private sector transportation groups as well. The American Transportation Research Institute notes that “Freight plans are critical blueprints for how the public sector will develop, manage and maintain public elements of freight networks...Freight plans also provide an understanding of how safe, efficient and productive freight systems benefit local and state economics and help meet local, regional, and national goals for safety and productivity.” [Identifying State Freight Plan Best Practices, February 2018] PennDOT’s CFMP also points out that “combined individual‐ and multi‐jurisdictional perspective allows better identification of vital freight improvement projects, sustaining an economically robust freight system for supply chains moving within Pennsylvania and beyond. In the development of this freight plan, PennDOT recognizes and supports the need for collaboration in freight planning within regional jurisdictions and across economic corridors, enhancing mobility at the local, state, multi‐state, and national level.” In this regard, the CFMP can be utilized by PennDOT’s MPOs/RPOs to understand how statewide freight movement impacts the region and establish its own goals that compliment and align with the state and surrounding regions. The CFMP is required by law to be updated on a 5year cycle .

Chapter 1 - Introduction
8
1.4 FREIGHT PLANNING IN ALL REGIONS
Every region has a unique composition of land use, culture, economy, geographic position, and supporting infrastructure. Freight planning is equally unique in how it can best be utilized in a meaningful way with a region. Decisions that impact freight movement are made every day by people in response to constantly changing industry needs, economic growth, development, expectations of buyers and sellers, infrastructure needs, innovations, and other factors. As noted in the National Cooperative Highway Research Program (NCHRP) – 16 quote (below), there is a critical link between daily local land use decisions and increasing the number of conflicts with freight movement. While local governments do have a significant influence on future growth and landuses, they are equally challenged to balance the management of the existing landuses and infrastructure that have been inherited from previous generations. Freight related complaints raised by residents and municipalities are evidence that freight traffic is an increasingly visible issue impacting the quality of life and culture of local communities. Freight planning on a regional level provides communities with the opportunity to inventory and assess how multimodal freight movement is occurring within its region and to prioritize policies, multimodal infrastructure projects, land uses, and other initiatives that will support the community’s vision for growth and safety. As such, land use control is a critical factor in determining how a region will grow and be impacted by the movement of freight. For example, if a 5acre parcel of land is changed from an agricultural zone to an industrial or commercial zone, the decision will directly impact the level of freight traffic generated by the parcel of land. In this example, an area of the community previously generating small amounts of agriculturalrelated freight traffic could potentially become a significant element of the region’s freight supply chain. Zoning and freight planning are highly connected sensitive issues that must be closely evaluated with the demands of the region’s supply chain. The supply chain starts with natural resources, raw materials, and agriculture products and ends with finished commodities, products, and goods in the homes and businesses across the street and around the world. Freight movement does not stop at any political, regional, or geographical boundary. Importing and exporting goods from around the world and into the local community is directly tied to the efficiency of the multimodal freight network internationally, nationally, statewide, regionally, and along the last mile. Therefore, it is increasingly important to cooperatively plan how freight will move safely, reliably, and efficiently between markets.
“
”
The primary forum where conflicts between freight and other land uses are either avoided or
created is the landuse planning area. As a general rule, nothing is built in America unless and
until the use of the land involved has been approved in a city or county general plan, the property
has been specifically zoned for that use, a development site plan has been approved, and a
building permit issued. These are all local government functions. Almost all issues about future
land uses that may affect the present or future viability of ports, rail lines, airports, highways,
and other freight facilities arise – or come to a head – in the context of zoning or development
site plan approvals.
NCHRP16

Chapter 1 - Introduction
9
To provide some perspective on the value of transportation in the U.S. economy, the Bureau of Transportation Statistics reported in its Transportation Economic Trends published in 2018 (TET 2018) that 9 cents of every dollar of output produced by the U.S. economy is categorized as “transportation.” The same report states that “Transportation Related Final Demand” is the fourth largest category of the Gross Domestic Product (GDP) expenditure at $1,489.7 billion, or 8.9% of the GDP behind Housing (19.3%), Healthcare (16.5%), and Food (9.7%). Freight movement is a significant cost impacting every part of life. Investing in the freight assets within a region is critical to every person in every region. PA’s Rail Freight Planning Guidance can help a region identify opportunities to improve its freight planning program to better educate decision makers and make informed decisions for freight movement within the region.
“
”
Transportation directly contributes to the economy by enabling the production of goods
and services. In 2016 wholesale and retail trade used the most transportation services at
$277.9 billion and required 9 cents of transportation services to produce one dollar of output.
US DOT, Bureau of Transportation Statistics

CHAPTER
Chapter 2 - Freight Planning
11
FREIGHT PLANNING

Chapter 2 - Freight Planning
12
2.1 WHAT IS “FREIGHT?”
Freight is defined in the dictionary as “goods that are transported from one place to another by ship, aircraft, train, or truck.” PennDOT’s CFMP enhances the definition as “cargo being transported for commerce, manufacturing, or personal use, usually via commercial vehicles.” The infrastructure utilized to move freight is comprised of an extensive network of multimodal transportation facilities requiring significant funds both to build and maintain. Multimodal freight transportation facilities are truly a vital asset allowing all levels of the global economy to function. Pennsylvania is a transportation keystone with respect to its multimodal assets and geographic location. According to PennDOT’s 2018 Pennsylvania Highway Statistics, there are 41,643 miles of highway owned by various Pennsylvania state agencies, with PennDOT owning 39,737 of those miles. Pennsylvania municipalities own an additional 78,145 miles of highway. According to the 2015 Pennsylvania State Rail Plan, there are 60 owners of over 5,604 miles of railroad in Pennsylvania. Pennsylvania is the only state with all three types of ports (deep water, inland waterway, and Great Lakes) and is the only state that has access to the Atlantic Ocean, the Gulf of Mexico and the Great Lakes. It is home to four of the top 100 cargo airports in the U.S. including Philadelphia International Airport, Lehigh Valley International Airport, Pittsburgh International Airport, and Harrisburg International Airport (source “2019 Top 50 Global Freight Carriers”). These assets create a multimodal freight network system carrying 7.5% of the goods and materials produced, used, or exported in the nation. These goods and materials are traveling through local towns, communities, regions, and across the state and are vital to the local, regional, state, national, and global economies. As owners and operators of the transportation infrastructure, local, state and federal governments, local authorities, and private operators facilitate the safe and efficient movement of freight across the supply chain. Partnership and collaboration between freight movers and transportation facility owners is at the center of all freight planning.
2.2 COMMON FREIGHT ISSUES
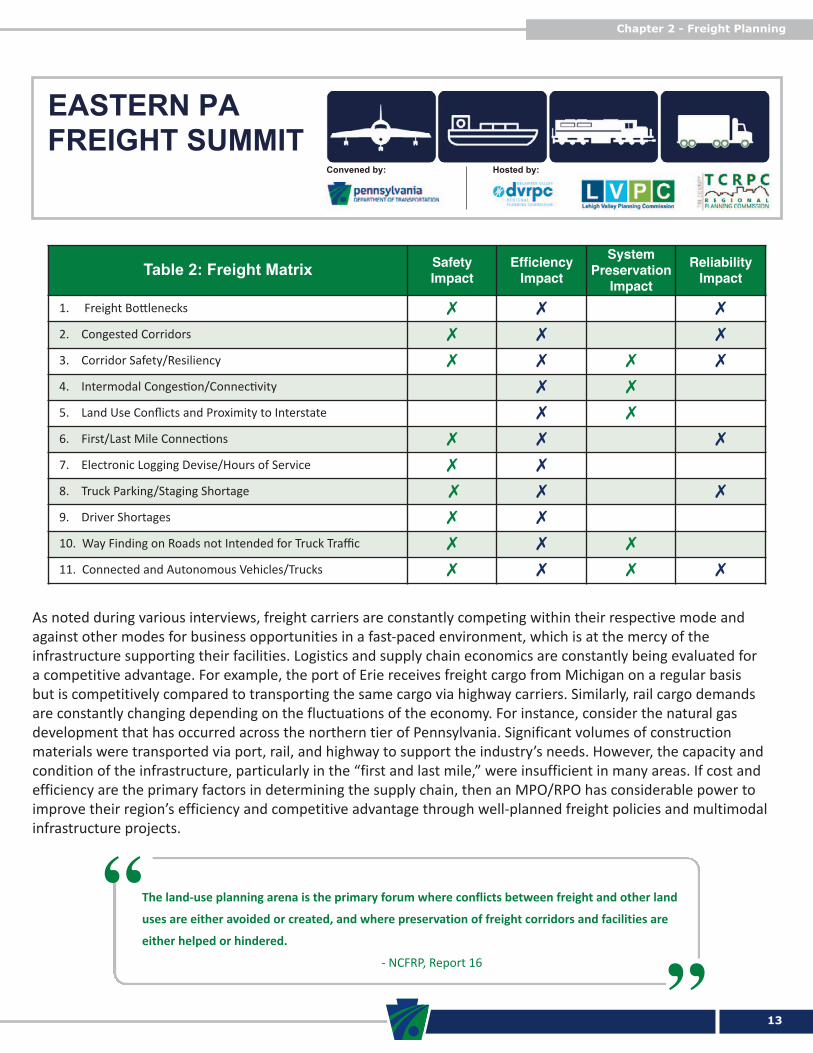
The competitive nature of freight movement, logistics, and business models drive efficiency and innovation on a daily basis. On an aging transportation network this presents many challenges. Chief among these challenges are land use and congestion. Ideally, local governments should work together to develop land use ordinances that coincide with commercial and industrial areas and freight corridors. Land uses that are more sensitive to freight traffic might include schools, residential areas, and hospitals. Where possible, these facilities should be located in areas that are not adjacent to freight corridors and freight centers. Working together to establish a longterm vision for the community, future development, and preserving infrastructure can help enhance a region’s economic competitiveness. The challenge of each planner and owner is to identify and prioritize infrastructure improvements that will be of the most benefit to the region as a whole. Table 2 on the next page provides a list of commonly described freight issues compiled from research, interviews, the Eastern PA Freight Summit, and various reference materials. These issues are critically important as business interests and industry leaders make investment decisions based on the positive and negative characteristics of each region’s infrastructure and how efficiently and reliably they can move their products to market. Businesses locate and sometimes relocate to improve their proximity and access to markets and the supply chain.
Chapter 2 - Freight Planning
13
As noted during various interviews, freight carriers are constantly competing within their respective mode and against other modes for business opportunities in a fastpaced environment, which is at the mercy of the infrastructure supporting their facilities. Logistics and supply chain economics are constantly being evaluated for a competitive advantage. For example, the port of Erie receives freight cargo from Michigan on a regular basis but is competitively compared to transporting the same cargo via highway carriers. Similarly, rail cargo demands are constantly changing depending on the fluctuations of the economy. For instance, consider the natural gas development that has occurred across the northern tier of Pennsylvania. Significant volumes of construction materials were transported via port, rail, and highway to support the industry’s needs. However, the capacity and condition of the infrastructure, particularly in the “first and last mile,” were insufficient in many areas. If cost and efficiency are the primary factors in determining the supply chain, then an MPO/RPO has considerable power to improve their region’s efficiency and competitive advantage through wellplanned freight policies and multimodal infrastructure projects.
Convened by: Hosted by:
Table 2: Freight MatrixSafety Impact
Efficiency Impact
System Preservation
Impact
Reliability Impact
1. Freight Bottlenecks 7 7 7
2. Congested Corridors 7 7 7
3. Corridor Safety/Resiliency 7 7 7 7
4. Intermodal Congestion/Connectivity 7 7
5. Land Use Conflicts and Proximity to Interstate 7 7
6. First/Last Mile Connections 7 7 7
7. Electronic Logging Devise/Hours of Service 7 7
8. Truck Parking/Staging Shortage 7 7 7
9. Driver Shortages 7 7
10. Way Finding on Roads not Intended for Truck Traffic 7 7 7
11. Connected and Autonomous Vehicles/Trucks 7 7 7 7
“”
The landuse planning arena is the primary forum where conflicts between freight and other land
uses are either avoided or created, and where preservation of freight corridors and facilities are
either helped or hindered.
NCFRP, Report 16
FREIGHT SUMMITEASTERN PA

Chapter 2 - Freight Planning
14
2.3 FREIGHT PLANNING IN YOUR REGION
The objective of regional freight planning is to understand the existing conditions and performance of the multimodal freight network within the region as well as infrastructure needs and goals of the community. This enables local decision makers to direct funding for performancebased projects to the most beneficial areas. How this is accomplished varies greatly from region to region. “One size does not fit all” with respect to regional freight planning. Throughout Pennsylvania, each MPO/RPO has a unique context of geography, culture, industry characteristics, and a long list of infrastructural deficiencies to address with limited resources directed by equally unique policies and leadership of the region. Freight planning should reflect the needs, characteristics, and purposes of each unique region and economy but should also consider how it fits into the overall larger region. This guidance provides a common reference of definitions, freight concepts, and terminology to facilitate collaboration between regions as well as the state. In 2003, The Transportation Research Board (TRB) through the NCHRP, published the NCHRP, Synthesis 320Integrating Freight Facilities and Operations with Community Goals. As the title suggests, this synthesis focuses on freight facilities and operations within communities and how freight facilities can be “a good neighbor.” According to the NCHRP Synthesis 320 survey, the key community issues include:
• Communication • Traffic flow and congestion • Safety and security • Air quality • Noise and vibrations • Land use and value
Establishing a common longterm vision with strategies and goals can help bring consensus to all stakeholders and the support of the public. Chapter 3 provides freight planning STEPS that can be utilized for developing and enhancing a regional freight planning program.
“
”
Accordingly, in many parts of the country and
overseas, efforts are underway to balance the
movement of freight with community goals – in
essence making freight transportation operations
and facilities “good neighbors.”
NCHRP, Synthesis320
“
”
Continuously engaging the public and elected
officials – The best practices of integrating freight
operations and facilities with community goals
contain continuous engagement of the
communities and elected officials in planning,
project development, and facility operations.
NCHRP, Synthesis320

Chapter 2 - Freight Planning
15
2.4 FREIGHT DEFINITIONS
Freight Network – The physical highways, railroads, airports, waterways and intermodal facilities that exist primarily for the movement of freight. The freight network does not include the actual freight or freight carriers. Freight Mobility – The ability of goods to move freely on and between transportation facilities including highways, railroads, airports, and water. Freight Economy – An interconnected network enabling the movement of food, energy, fabricated goods, and raw materials to keep citizens employed, communities healthy, and the nation competitive on a global scale. Together, these components make up the freight economy. More information can be found on FHWA’s website. Reliability – The degree of variance experienced in the actual travel times compared to the expected travel times of a shipment. Variances, or changes, in travel times arise due to capacity, congestion, and traffic incidents. National Highway System (NHS) – 220,169 miles (2018) of federally funded highways including:
• Interstate System – 48,741 miles of controlled access highways funded through the Highway Trust Fund established by the FederalAid Highway Act of 1956 under President Eisenhower.
• Other Principal Arterials – 171,428 miles of highways in rural and urban areas which provide access between an arterial and a major port, airport, public transportation facility, or other intermodal transportation facility.
• Strategic Highway Network (STRAHNET) – 62,769 miles of highways which are important to the United States’ strategic defense policy and which provide defense access, continuity and emergency capabilities for defense purposes.
• Major Strategic Highway Network Connectors – These are highways which provide access between major military installations and highways which are part of the Strategic Highway Network.
• Intermodal Connectors – These highways provide access between major intermodal facilities and the other four subsystems making up the National Highway System.
National Highway Freight Network (NHFN) – 51,023 miles of highway eligible for Federal Funding through the National Highway Freight Program (NHFP) consisting of the following elements:
• Primary Highway Freight System (PHFS) – This is a network of highways identified as the most critical highway portions of the U.S. freight transportation system determined by measurable and objective national data. The network consists of 41,518 centerlines miles, including 37,436 centerline miles of interstate and 4,082 centerline miles of noninterstate roads.
• Other Interstate portions not on the PHFS – These highways consist of the remaining portion of interstate roads not included in the PHFS. These routes provide important continuity and access to freight transportation facilities. These portions amount to an estimated 9,511 centerline miles of interstate nationwide and will fluctuate with additions and deletions to the interstate highway system.
• Critical Rural Freight Corridors (CRFCs) – These are public roads not in an urbanized area that provide access and connection to the PHFS and the Interstate with other important ports, public transportation facilities, or other intermodal freight facilities.
• Critical Urban Freight Corridors (CUFCs) – These are public roads in urbanized areas which provide access and connection to the PHFS and the Interstate with other ports, public transportation facilities, or other intermodal transportation facilities.
• Intermodal Connectors – These are roads that provide access between major intermodal facilities and other elements of the National Highway System.
More information on NHFN can be found on FHWA’s website.

Chapter 2 - Freight Planning
16
Interim National Multimodal Freight Network (FHWA) – Established by Federal Register Notice under 49 U.S.C. 70103, the National Multimodal Freight Network includes the following:
• The National Highway Freight Network that U.S. DOT established under the National Highway Freight Program (23 U.S.C. 167).
• The freight rail systems of class I railroads. • U.S. public ports that have total annual foreign and domestic trade of at least two million short tons. • U.S. inland and intracoastal waterways. • The Great Lakes, the St. Lawrence Seaway, and coastal and ocean domestic freight routes. • The 50 U.S. airports with the highest annual landed weight. • Other strategic freight assets, including strategic intermodal facilities and other freight rail lines.
Freight Center – One or more facilities that “attracts and produces trips of freight carrying vehicles.” NCFRP – 13 Regional Freight Center – A geographical area identified by the MPO/RPO to have regionally significant freight activity from one or more freight facilities and is in close proximity to the regional freight network. It may include multimodal or intermodal facilities for rail, port, or airport locations. Regional Freight Network – The multimodal freight transportation infrastructure that connects regional freight centers to one another and the Interim National Multimodal Freight Network and the local freight network. It may include candidate CUFC/CRFC highways. Local Freight Center – A freight generating location identified by county and local planners to have locally significant freight activity and is not already identified as a regional freight center. This should include multimodal or intermodal facilities for rail, port, or airport locations not already identified as a regional freight center. Local Freight Network – The multimodal freight transportation infrastructure that connects one or more local freight centers to the regional freight network. Freight Corridor – A geographical area identified by adjacent MPOs/RPOs to have significant freight activity affecting the respective MPOs/RPOs. The freight corridor contains multiple regional and local freight centers in close proximity to one another and accessed by regional and local freight networks, all of which are accessed by one or more facilities on the Interim National Multimodal Freight Network. May cross jurisdictional boundaries and MPO/RPO regions. Supply Chain – Entire network of entities, directly or indirectly interlinked and interdependent in serving the same consumer or customer. It consists of vendors that supply raw material, producers who convert the material into products, warehouses that store, distribution centers that deliver to the retailers, and retailers who bring the product to the ultimate user. Supply chains underlie valuechains because, without them, no producer has the ability to give customers what they want, when and where they want it at the price they want. Producers compete with each other only through their supply chains, and no degree of improvement at the producer’s end can make up for the deficiencies in a supply chain which reduce the producer’s ability to compete. Supply chain definition.

TYPES OF FREIGHT Freight Center Typology – The economic, land use, transportation, and business characteristics that are typically attributable to a type of freightintensive industry. There are existing systems utilized to categorize and quantify industrial activity – the types of land uses, tax assessments, business activities, expected traffic, work force characteristics, travel patterns, and other relevant metrics. According to NCHRP739/NCFRP19 Freight Generation and Land Use, three groups of classification codes have generally been utilized for analyzing freight trip generation including:
• Site and Structure descriptions (ITE Manual, Tax Assessor Code) • Industry Sector Codes (SIC, NAICS) • Land Use/Planning Codes (LBCS and NYCZR)
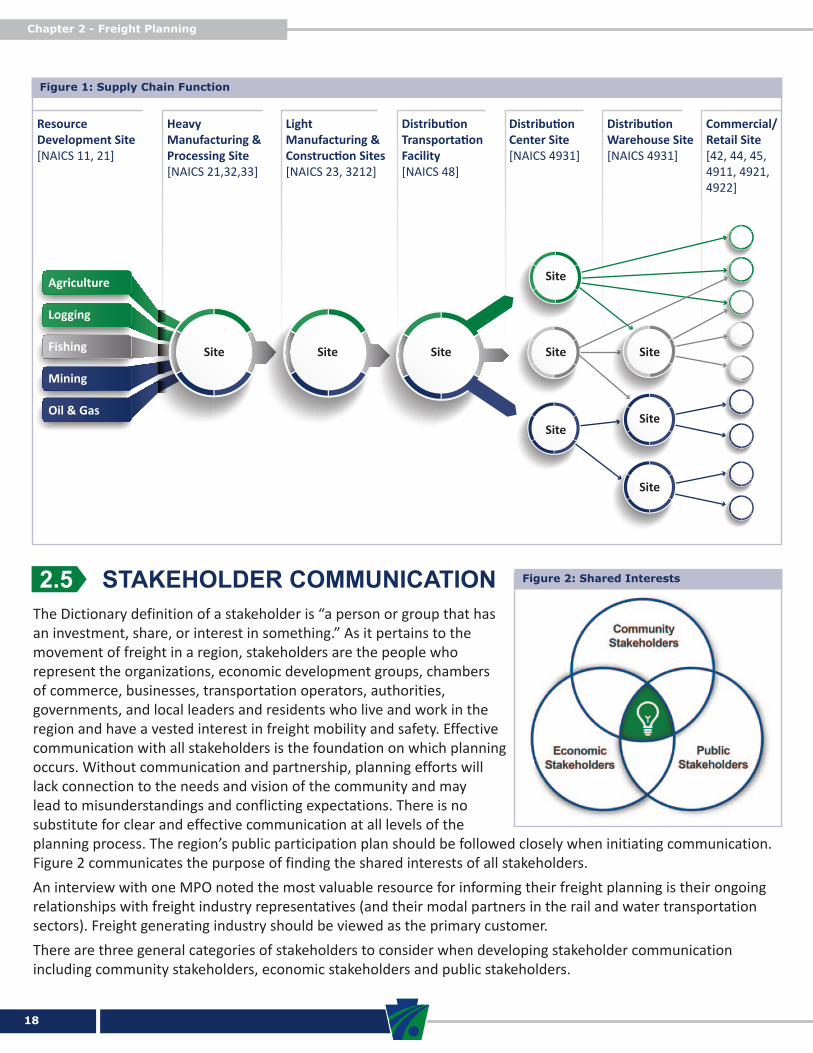
While none of these strategies are integrated and designed specifically for freight analysis, the same report found that industry sector codes provide the most accurate analysis for the purposes of determining freight generating business activity. This approach is consistent with FHWA’s Publication “Quick Response Freight Methods” Chapter 10 Freight Supply Chain Forecasting. In Table 3 (see below) of this guidance, the following freight centers typologies are recommended as a starting point for categorizing the types of freight centers within a region. Each category generates its own pattern of type, size, and volume of freight traffic unique to the region. Therefore, each region should customize the categories and create subcategories as may be helpful to differentiate the highlevel patterns of freight movements in their region. An illustration of the supply chain function is provided in Figure 1.
Chapter 2 - Freight Planning
17
Table 3: Supply Chain Function
Freight Center Typology
Land Use/ Facility Use
NAICS Code
SIC Code
ITE Land Use Code
LBCS Functional Code
Value Added Freight
Resource Development
Agricultural and Natural Resource Development
11, 21
0109 1014
8000, 9000
YES
Manufacturing – Heavy
Converting raw resources into products
31, 32, 33
22, 24, 26, 28, 29, 30, 33
140
3210, 3310, 3320, 3330, 3340
YES
Manufacturing – Light Converting products into deliverable goods, and construction
23, 3212
15, 16, 17, 20, 21, 23, 25, 31, 32, 34, 35, 36, 37, 38, 39
110, 130 3100, 3220, 3230, 3350, 3360, 3370, 3400, 7000
YES
Distribution – Transport Transfer of products and goods between carriers or modes. Short Term
48 4049 000099 4100 NO
Distribution – Center Large scale Ware housing or storage of deliverable goods. Typically supplying Distributionwarehouses
4931 4225, 4226 150, 154, 156
3600 NO
Commercial – Warehouse Warehousing prior to point of sale distribution
4921 4225, 4226 151, 155, 157
3500 NO
Commercial/Retail
End User & Point of Sale 42, 44, 45, 4911, 4921, 4922
50, 51, 5259 800899 2000 NO
“
”
The core function of freight centers is to provide a
better understanding of the land use and economic
development patterns as they relate to freight
activities in the region.
Delaware Valley Regional Planning Commission
Chapter 2 - Freight Planning
18
2.5 STAKEHOLDER COMMUNICATION
The Dictionary definition of a stakeholder is “a person or group that has an investment, share, or interest in something.” As it pertains to the movement of freight in a region, stakeholders are the people who represent the organizations, economic development groups, chambers of commerce, businesses, transportation operators, authorities, governments, and local leaders and residents who live and work in the region and have a vested interest in freight mobility and safety. Effective communication with all stakeholders is the foundation on which planning occurs. Without communication and partnership, planning efforts will lack connection to the needs and vision of the community and may lead to misunderstandings and conflicting expectations. There is no substitute for clear and effective communication at all levels of the planning process. The region’s public participation plan should be followed closely when initiating communication. Figure 2 communicates the purpose of finding the shared interests of all stakeholders. An interview with one MPO noted the most valuable resource for informing their freight planning is their ongoing relationships with freight industry representatives (and their modal partners in the rail and water transportation sectors). Freight generating industry should be viewed as the primary customer. There are three general categories of stakeholders to consider when developing stakeholder communication including community stakeholders, economic stakeholders and public stakeholders.
Figure 2: Shared Interests
Figure 1: Supply Chain Function
Resource Development Site [NAICS 11, 21]
Heavy Manufacturing & Processing Site [NAICS 21,32,33]
Light Manufacturing & Construction Sites [NAICS 23, 3212]
Distribution Transportation Facility [NAICS 48]
Distribution Center Site [NAICS 4931]
Distribution Warehouse Site [NAICS 4931]
Commercial/ Retail Site [42, 44, 45, 4911, 4921, 4922]
Agriculture
Logging
Fishing
Mining
Oil & Gas
Site Site Site
Site
Site
Site
Site
Site
Site

Chapter 2 - Freight Planning
19
COMMUNITY STAKEHOLDERS Community stakeholders are people who live and/or work within the community, share the transportation system, and are directly impacted by the economic, political, and financial decisions of the transportation network and surrounding areas. This group includes but is not limited to:
• Local residents of the community • Commuters entering the region for work or education • Community groups, advocacy groups, community leaders • Private organizations, associations, and societies • May include people outside the region with vested interested in the community
Community stakeholders do not typically make decisions on behalf of the community and region. They directly influence economic and public stakeholders through their voting and economic choices. Communication with the general public and leaders of the community is necessary for two reasons. First, residents of the local community are directly impacted by transportation planning issues including freight. Theirfirsthand experience regarding problem areas, community needs, policy issues, traffic concerns, or even a pothole can help elevate concerns that might not otherwise be communicated. Second, it is a best practice to inform and solicit feedback from the residents of the communities of a region. The MPO/RPO should provide the opportunity for feedback and comment on all transportationrelated projects and likewise, manage the expectations of community stakeholders regarding the vision and growth of the community. ECONOMIC STAKEHOLDERS Economic stakeholders are people who own and operate private businesses or actively petition their investments within the region. They depend on the transportation system, and are directly impacted by the economic, political, and financial decisions of the transportation network and surrounding areas. This group includes but is not limited to:
• Local business owners • Larger businesses/corporations (local operational representatives who are not decision makers) • Outside business representatives who utilize the supply chain inside the region (includes shippers, receivers,
carriers, warehousing, and other freight generating businesses) • Chambers of commerce • Community/Economic development groups
Economic stakeholders make or solicit economic investments, decisions and provide private sector leadership to the community and region. They directly influence the community and public stakeholders through their economic decisions and business activities. As noted from multiple interviews, there is an ongoing challenge to identify economic sector stakeholders and engage them on a regular basis in a mutually beneficial way. If freight transportation is the fourth largest expenditure in the nation (and likewise within the region), building relationships with economic stakeholders to understand their practical transportation needs is a vital process. Time and efforts to engage economic stakeholders the most critical task of the freight planning process.

Chapter 2 - Freight Planning
20
PUBLIC STAKEHOLDERS Public stakeholders are people who are employed by a government, public agency, or authority within the region and are responsible for the lands and infrastructure. They are directly responsible for the political and financial decisions of the transportation network and surrounding areas. This group includes but is not limited to:
Public stakeholders make policy, economic, regulatory, and financial decisions for the community and region. They directly influence community and economic stakeholders through their economic, regulatory, policy and financial decisions. They are public decision makers. Most MPOs and RPOs utilize their technical and coordinating committee meetings for the purpose of obtaining feedback and concerns from the local and state officials who are members of the committee. Additional outreach to noncommittee members may be required depending on the issue being discussed. Significant issues and decisions before the MPO or RPO and its committees should be discussed during the meetings, with personal invitations given to local and state officials and other stakeholders who are directly impacted. Good communication and managing the expectations of public stakeholders benefits everyone. Because of their position, they have a unique ability to influence the expectations of the community and economic stakeholders. Included in the public sector stakeholders’ group is the internal communications occurring between the project team and the decision makers. The value of clear communication throughout the planning process in this regard cannot be understated. Certain items to avoid in communication include wasting time, delegating relationships, and over promising. In the end, the desired outcome of the communication is the cooperation and partnership with the significant freight generating establishments and decision makers investing in the local economy with a clear understanding of the transportation challenges and how they impact local freight movement and the economy. PennDOT CONNECTS The PennDOT Connects policy is a top priority for PennDOT. Initiated in 2016 by Pennsylvania Secretary of Transportation, Leslie S. Richards, the policy makes changes to the project development process to enhance transportation planning. The policy requires communities to have meaningful opportunities for engagement in the initial stages of the planning process with PennDOT and the regional MPOs/RPOs. During the project development and scoping process, communities are engaged and invited to provide their insights and needs of the project. The purpose of the dialogue is to listen to the concerns and suggestions of the people the project is impacting the most. The PennDOT Connects approach to communication can facilitate communication with all stakeholders in one setting. According to one project leader, during the PennDOT Connects meeting, “We don’t say ‘yes,’ and we don’t say ‘no.’ All options are on the table.” This quote is most applicable early in the “planning process.” As the project moves to the delivery stage, we need to make decisions, and communicate that message clearly to local governments and the MPOs/RPOs. A more strategic approach to engagement will ensure that local priorities and issues are effectively considered as transportation needs and investments are planned and developed. The result is improved decision making, better investments, and greater local impacts. Several MPOs/RPOs have noted their optimism for applying this approach more broadly through their planning practices. Excellent results can be obtained when multijurisdiction or regional planning and communication occurs as well. Planning projects and studies of corridors that cross jurisdictional boundaries can be a major benefit to the larger region. Chapter 3 provides suggestions for how communication can be accomplished in each STEP of the freight planning process.
• Politicians and elected officials and their staff (state, county, municipal government)
• Departments of transportation
• MPOs/RPOs Staff • Rail owners/operators • Airport owners/operators • Port owners/operators
• Transit owners/operators • Pipeline owners/operators • The FHWA/FTA

Chapter 3 - Freight Planning Process
21
CHAPTERFREIGHT PLANNING
PROCESS

Chapter 3 - Freight Planning Process
22
3.1 FREIGHT PLANNING STEPS
There are numerous ways to approach freight planning given the needs and resources of each individual MPO or RPO. Based on interviews with MPOs/RPOs across Pennsylvania and in other states, there are several significant elements that comprise most freight plans and various additional studies that can add value to freight planning efforts. Chapter 3 utilizes this information and describes the STEPS for developing a regional freight plan, and Chapter 4 describes additional studies, or “COMPONENTS,” that can be added to further enhance the freight plan. The primary goal of Chapter 3 is to outline a practical process for developing a freight plan resulting in a product that will inform and educate decision makers with databased, performancedriven, and stakeholdersupported projects to enhance the region’s freight network. The process revolves around communication and collaboration with the stakeholders and the vision they desire for their own community. Each STEP requires connection and integration with the vision of the community. Following these STEPS will help a MPOs/RPOs to consider the major factors that influence freight mobility in the region. At times, the STEPS may overlap in their scope and schedule. However, the objective of each STEP is separate and individually significant. Each of the STEPS provided in this chapter are organized into sections to describe WHY the step should be completed, HOW it could be completed, the COMMUNICATION that should be anticipated, things to generally AVOID, and most significantly, the desired OUTCOME of the step. The HOW section provides a starting point for the current ideas, resources, strategies, and suggestions for accomplishing each task, but not all suggestions are required to achieve the OUTCOME of the STEP. It is worth noting that the OUTCOME of each STEP should remain constant over time, even as the methodology may change. Future innovations and resources will change HOW the OUTCOME of each STEP is accomplished. As in any planning project, the process naturally evolves with the availability of resources, new technology, better data, and the needs of the region. The freight planning process must be reevaluated on a regular basis to maintain the most current and relevant information possible, ensuring all stakeholders are adequately informed to do their job and make decisions.
“”
Begin with the end in mind.
Steven Covey

Chapter 3 - Freight Planning Process
23
Figure 3: Community Vision

GOALS AND OBJECTIVES
WHY: Establish the vision. Before anything moves forward in freight planning, the higherlevel “goals” of regional freight planning should be developed through collaboration and approved by decision makers. Ideally, the freight planning goals would be integrated with the goals for the community and other planning efforts of the region including the Long Range Transportation Plan. Goals are a general desirable condition aligned with the vision community that is able to be achieved but typically too general to be quantified. Freight planning goals should not be directly connected to any one project or issue that can be completed. Goals should be a continuous inspiration that can only be attained by implementing good policies and good freight planning practices over a long period of time. On the other hand, “Objectives” are shorterterm, measurable outcomes that will allow accountability and progress to be measured. Freight planning objectives should be implementable, easily measured, and resulting in progression of the freight planning goals. The objectives should be related to projects, performance metrics, initiatives, and policies that will affect how the region’s infrastructure and growth are managed. Quantitative targets or standards are sometimes required by law or regulation and should be known and incorporated into the objectives for freight planning where applicable. HOW: A helpful starting point is considering the U.S. department of transportation and the statewide freight plan goals. A few examples of longterm goals from various freight plans are summarized below:
• Safety – Identify improvements that reduce unsafe conditions on the regional freight network. • Support datadriven, performancebased decisions making to improve safety/system preservation/
mobility/stewardship of all freight modes through TIP projects and discretionary funding. • System preservation – Identify improvements that achieve and preserve a stateofgoodrepair on
the regional freight network. • Mobility – Improve regional freight network connectivity and mobility between all modes • Stewardship – Utilize the best available information and revitalized partnership with regional industry
leaders to develop a data supported understanding of the current transportation network. These goals are consistent with PennDOT’s CFMP, PennDOT’s LRTP, and the goals of MAP21 and FAST Act. However, each MPO/RPO should consider their own unique characteristics and longterm vision for their communities and develop their own freight planning goals.
Chapter 3 - Freight Planning Process
24
STEP 1:GOALS AND OBJECTIVES
ESTABLISH THE VISION Determine the longterm
goals and objectives for freight movement
in the region.
Communication
“”
If a goal defines the longterm destination, then the objectives are the road that will take
you there.
Business Coach

Chapter 3 - Freight Planning Process
25
COMMUNICATION: • Economic stakeholders – Request collaboration from key economic stakeholders, business partners,
economic development groups, and other planners within the region. Their goals and interests should inform the goals of the freight planning process.
• Public stakeholders – Review stakeholder feedback, collaborate, and approve the goals and objectives of the regional freight planning program. Hold a public stakeholders freight meeting including local, county, and district transportation representatives and elected officials to gain concurrence on the vision of for freight planning and the objectives that will result.
• Community stakeholders – Notification of the freight planning efforts, high level goals, and opportunityto provide feedback.
AVOID: Unrealistic and unachievable goals and objectives; objectives that do not move closer to the longterm vision of the region; and lengthy and/or vague language. OUTCOME: The longterm goals and objectives for freight mobility and safety in the region. Achievable freight planning objectives that, if achieved, will make progress toward the vision and goals of the region.

Chapter 3 - Freight Planning Process
26
PLAN THE PROCESS
WHY: Resource allocation. Managing any type and size of project requires understanding the goals of the project, the available resources, and the schedule. In freight planning, the goal is to develop a program that produces a regional freight network and an effective freight action plan that can be incorporated into all aspects of a region’s projects, policies, and planning initiatives. The purpose of this step is to define who will do the work, how much it will cost, and when it should be done. HOW:
• Utilize past freight plans and programs within the region, example freight plans, state freight plans, and this guidance, to determine the desired outcome of the freight planning project.
• Determine the project’s available budget. • Determine the people involved and percentage of time they are
available for development: • Internal project manager and freight champion • Internal support staff • Consultant support
• Consider the responsible people involved and determine how long the process should reasonably take to establish the desired start and finish dates.
• Incorporate the desired freight planning efforts into the UPWP to establish the available budget each year and future update years.
COMMUNICATION:
• Public stakeholders – Discuss and agree to the budget, scope, and schedule. • Project team – Develop team and establish expectations. The project team will be responsible
for coordinating all future communication efforts in each STEP. • Economic stakeholders – Notification of process and anticipation of requesting industry participation
in plan development. • Community stakeholders – Consolidation of past issues. No formal outward communication.
AVOID: Skipping this step. Changing the scope without revisiting the schedule and budget as changes arise. OUTCOME: A reasonable plan for the scope, schedule and budget required to develop or update a regional freight plan. A list of participating stakeholders, project management team, significant milestone or events being considered.
STEP 2:PLAN THE PROCESS
RESOURCE ALLOCATION Develop a reasonable plan
for the scope, budget, and schedule for freight planning.
Communication

FREIGHT MOVEMENT
LANDSCAPE WHY: Data matters. The residents of a region generally have a sense of where large amounts of freight traffic is coming from or going to within their region. The actual numbers and contents of the containers are less commonly known and may even be protected information. Datadriven decisions require planners to quantify freight movement with numbers that can be objectively analyzed to help establish a basis for making informed decisions. Many freight planners have noted the first task towards a freight planning program is to document where freight activity is presently occurring within their region. This information will establish a basis for understanding the unique freight landscape of the region. HOW: Utilize the best available information and data resources possible to analyze the current freight centers and freight movement patterns occurring within the region. Verify and supplement the data by discussing the results with stakeholders including local industry representatives, public officials, real estate agents, developers, and other business leaders that engage freight generating industries. Conducting field views to contextualize local complaints/issues can also help validate freight movement patterns. In this regard, FHWA’s publication entitled “Quick Response Freight Methods, Third Edition” provides extensive background on methods for evaluating and validating freight movement data. Likewise, NCHRP Report 739/NCFRP Report 19 entitled “Freight Trip Generation and Land Use” also provides valuable context for developing freight related data into a useful tool. The information should be compiled into a regional map which can be understood in the geographical context with various land uses, modes, and connections. Utilizing the resources and data noted below will provide the building blocks and methodology for creating a regional freight network and also projecting future freight traffic. Below are several examples of data resources and performance metrics that can be utilized to identify the movement of freight traffic in a region:
• Truck Travel Time Reliability (TTTR) [Required Interstate Performance Metric] Data Source: • National Performance Management Research Data Set (NPMRDS), truck travel times in fiveminute
data collection cycle. • Average Truck Speed [Required Interstate Performance Metric]
Data Source: • National Performance Management Research Data Set (NPMRDS), truck travel times in fiveminute
data collection cycle
Chapter 3 - Freight Planning Process
27
STEP 3:FREIGHT LANDSCAPE
DATA MATTERS Freight movement patterns
of the regions supported by data and validated by
firsthand knowledge.
Communication

Chapter 3 - Freight Planning Process
28
• Average Daily Truck Volumes by classifications on all roadways within the regionData Source: • PennDOT truck traffic data (useful for state routes) • Local traffic counts on local roads. Stateowned bridges on local roads • ATRI GPS data
• Average Daily Truck Volumes at Freight CentersData Source: • ATRI GPS data • Request average volumes from large freight generating businesses (trucks/day, trucks/week,
trucks/month at any scale they are willing to offer and then calculate the perday average) • Freight Bottlenecks. [State Performance Metric]
Data Source: • PennDOT’s top 100 list • FHWA Freight Bottleneck Reporting Guidebook • ATRI GPS data • TomTom data • Regional validation of PennDOT’s list and add supplemental locations as appropriate (1020 top sites)
• Regional and Local Freight Centers – Freight generating origins and destinations Data Source: • North American Industry Classification System (NAICS) – Industry codes assigned to all businesses.
Proprietary development of NAICS data can be obtained through various providers including Global Insights Freight Finder and National Establishment TimeSeries (NETS).
• Standard Industrial Classification (SIC) – Industry codes assigned to all businesses. Proprietary development of NAICS data can be obtained through various providers including Global Insights Freight Finder and National Establishment TimeSeries (NETS).
• Land Based Classification Standards (LBCS) – utilized in local planning and zoning • ITE Trip Generation Codes • CoStar – realtor’s database that can supplement and help identify the size and types of buildings on
a property. • ATRI GPS data • Freight Analysis Framework (FAF) provides freight movement data for all modes of transportation
including commodity types, commodity flows, tonnage and value by region, origin and destination. • Multimodal Volumes – Port, rail, aviation, intermodal and commodity volumes
Data Source: • Rail characteristics including rail type, rail sidings, intermodal locations, rail bridges, rail crossings,
number of trains per day, etc. • Rail Volumes/Tonnages – Surface transportation Board (STB) waybill data for rail car volumes,
tonnages, and commodities. Intermodal truck volumes if applicable. • Water Port characteristics, sidings, intermodal yards, ships per day, etc. • Water Port – Request volumes from operators within the region and neighboring regions.
Intermodal truck volumes if applicable.

Chapter 3 - Freight Planning Process
29
• Airport characteristics, locations, runway lengths, freight planes per day, etc. • Aviation – Request volumes from operators within the region and neighboring regions. Intermodal
truck volumes if applicable. • Pipeline – Request pipeline infrastructure maps, flow rates, and volumes from pipeline operators
and the Public Utility Commission. Locate and verify pipeline terminal facilities which may be utilized to transfer from pipeline to truck transportation. Intermodal truck volumes if applicable.
• Obtain pass through volumes, commodity tonnages, and intermodal truck volumes. Utilize the data increments they are willing to share (annually, monthly, weekly, daily) and convert it to average daily values so it can be compiled with other data sets.
• Commodity Flows/Tonnage/Values Data Source: • IHS Global Insights TRANSEARCH through PennDOT’s Commodity Flow Tool.
• Level of Service (LOS) Data Source: • INRIX travel time data. Evaluate using Regional Integrated Transportation System (RITIS). Traffic
counts and analysis could be utilized on routes of significance where other data sets are lacking. • Field Evaluation
Data Source: • Locally validated freight activity through field visits, street view mapping, and local knowledge,
reports of safety issues, vehicle crash data, etc.
COMMUNICATION: • Public stakeholders – Assist in contacting the correct people for data and validation. Provide progress
updates. • Economic stakeholders – Request freight generation and routing information. Request data validation
from freight centers. • Community stakeholders – Request feedback on freight mobility issues and data validation where
possible.
AVOID: Assuming freight activity without supporting data or firsthand knowledge.
OUTCOME: Data and mapping of the existing freight centers and movement patterns. Freight movement statistics supported by data and validated by firsthand knowledge to depict the current freight movement patterns within the region.

Chapter 3 - Freight Planning Process
30
OPERATIONS AND SAFETY
WHY: Integrate Operations and Safety. Each MPO/RPO is already evaluating transportation operations, congestion, safety, incident management, intelligent transportation systems and other related operational initiatives on some level. Connecting these efforts with freight planning is a practical and prudent step to mutually integrate the objectives of each program with freight planning where possible. HOW: If available, each of the following transportation operation and safety elements should be evaluated to identify impacts to freight planning objectives:
• Safety Data – Vehicle and truck crash data, rail crossing crashes, and other types of crashes are all recorded by the police department and maintained in a statewide database. Although this information is not public, it can be requested for use by MPOs/RPOs to evaluate high incident locations. Freight planning should evaluate all highcrash locations on the regional freight network (whether freight carriers are involved or not) and conversely, any incidents involving freight carriers that are not on the regional freight network.
• Emergency Services – Discuss the transportation system and the operational needs, safety concerns, and recommendations from each emergency provider in the region. Discuss upcoming projects and how they could be improved to better support emergency services providers.
• Traffic Incident Management Plan – A traffic incident management plan is critical for planning ahead for incidents on major routes. Incidents require safety precautions and traffic control to be implemented,
traffic to be diverted on a detour, and emergency services to quickly access the site. Improvements to the designated detour route should be able to reasonably accommodate the same types of traffic and truck traffic as the incident route. In most cases, routes with a traffic incident management plan are heavily utilized by freight carriers. Freight planning should evaluate the incident management needs of the freight corridors within the region.
• Congestion Management Process – A congestion management process (CMP) is a systematic and regionally accepted approach for managing congestion that provides accurate, uptodate information on transportation system performance and assesses alternative strategies for congestion management that meet state and local needs. By nature, this includes, but is not limited to, freight mobility. CMP strategies and objectives should be evaluated and integrated into freight planning.
• Intelligent Transportation System Infrastructure – An intelligent transportation system infrastructure manages and communicates in order to monitor congestion and respond in real time to improve traffic flow and safety, especially during peak travel periods. An ITSP should be integrated into freight planning for improving communication on freight corridors.
STEP 4:OPERATIONS AND SAFETY
INTEGRATE OPERATIONS AND SAFETY
Documentation of the regions operations and safety systems,
and on freight movement.
Communication

Chapter 3 - Freight Planning Process
31
• Regional Operations Plans – a regional operations plan (ROP) is intended to recommend and prioritize projects, programs, and strategies for managing traffic operations on a region’s transportation system.A ROP may vary from one region to another depending on the context and characteristics of the region. The objectives already evaluated and established by a ROP for improving the operational needs of a region should be carefully evaluated and incorporated into freight planning objectives were possible.
• Oversize and Overweight Hauling Permits – An oversize and overweight hauling (APRAS) permit is utilized for truck traffic which is either over the size or weight allowed by law. These permits are issued on a case by case basis and only on routes that are preapproved by PennDOT. In many instances, a particular type of business is known to generate regular oversize or overweight freight traffic. Identify routes that are typically utilized by oversize and overweight vehicles in the region. Are additional monitoring efforts required in these areas? If possible, identify locations frequently utilizing oversize and overweight loads.
• Hazardous Materials – The Federal Motor Carriers Safety Administration provides nine classifications of hazardous materials that require special processes and documentation to be transported. In many instances, a particular type of business is known to generate regular “hazardous” freight traffic. Freight planners should be aware of and consider impacts to freight network.
• Restricted and Posted Areas – Truck restrictions including posted roads, posted bridges, no truck traffic, no parking, and other types of posted truck restrictions should be evaluated for consistency with freight mobility in the region and the needs of each community.
• Project Planning – When any type of construction project is underway, there are often direct impacts to the local transportation network. Nearby routes to the project site may be closed or restricted during construction and detour route may not accommodate all types of movements. When provided the opportunity, operations and safety topics of this section can be evaluated for reducing the impacts to the local community and the regional freight network.
• Multimodal – Determine the operational, safety concerns and conflicts from multimodal operators of all kinds within the region including, but not limited to, highway, rail, transit, port, airport, bicycle, pedestrian, trails, and horse drawn carriages. Issues can only be recognized through open dialogue with representatives from each mode. Consider the following multimodal interests when developing this STEP: • Short and longterm rail plans • Short and longterm pipeline plans • Short and longterm airport plans • Short and longterm transit plans • Short and longterm port plans • Bike and pedestrian trail plans
COMMUNICATION: • Public stakeholders – Status updates including initial results of the inventory. • Economic stakeholders – Followup with key stakeholders regarding issues discovered related to
operations and safety. • Community stakeholders – Request feedback related to operations and safety issues.
AVOID: Unnecessary and alarming language that might incite fear or unwarranted attention to otherwise normal operational practices.
OUTCOME: Document the operation and safety systems within the region. A current understanding of how operations and safety systems are impacting freight mobility in the region and any pertinent issues that could be improved.

Chapter 3 - Freight Planning Process
32
REGIONAL FREIGHT NETWORK
WHY: A map is worth 1,000 words. A wellcrafted map facilitates a common understanding of the region’s multimodal freight network and requires minimal explanation. Ideally, a geographical information system (GIS) map of the regional freight network that can be overlaid with other helpful maps and information should be utilized and promoted for local communities, developers, land use planners, zoning committees, private industry, agencies, intermodal operators, and many others to improve projects and the compatibility of initiatives. Communicating an integrated, resilient, an efficient freight network on a map can be a powerful method to retain and attract businesses. Most importantly, a map of the regional freight network will solidify the freight vision, manage expectations, and help planners in the project development process.
HOW: Start with the national and state multimodal freight networks. • National Highway Freight Network: As required by FAST Act, in 2016 the U.S. department of
transportation established an Interim National Multimodal Freight Network (NMFN) as shown in Figure 2. This network includes the following infrastructure for all states: • National Highway Freight Network established under the National Highway Freight Program (Title
23U.S.C. 167); • The freight rail systems of class I railroads; • U.S. public ports that have total annual foreign and domestic trade of at least two million short tons;
STEP 5:REGIONAL FREIGHT
NETWORK
A MAP IS WORTH 1,000 WORDS Develop a map of the
regional freight network.
Communication

Chapter 3 - Freight Planning Process
33
Figure 4: National Multimodal Freight Network
• U.S. inland and intracoastal waterways; the Great Lakes, the St. Lawrence Seaway, and coastal and ocean domestic freight routes;
• The 50 U.S. airports with the highest annual landed weight; and • Other strategic freight assets, including strategic intermodal facilities and other freight rail lines. The U.S. department of transportation and U.S. department of commerce have monitored and analyzed majortrade gateways and freight corridors for decades, but the NMFN combines what are considered the most critical modal components and displays the connections between them.
• PennDOT’s multimodal freight network includes the national multimodal freight network. A map of PennDOT’s multimodal freight network is provided in Figure 3. GIS layers of PennDOT’s mapping are available upon request.
• Identify regionally significant freight activity. Utilize results from the STEP 3 to determine the most significant freight centers. Identify characteristic freight center typologies for the region may help provide context for developing and standardizing a regional freight network.
• Utilize the results from the freight movement inventory in STEP 3 to determine which routes are the most significant and heavily utilized by regional freight centers. Determine the routes which will comprise the regional freight network and local freight network. Coordination with local representatives may be required to provide context and justification for local freight networks.

Chapter 3 - Freight Planning Process
34
I2
I2
I2 ")Î
")Î")Î
")Î
")Î
o e
o e
o e
HarrisburgPittsburgh
Philadelphia
0 30 Miles
Jxo e
Airport
")Î Port
I2 Rail connector
Railway
Highway
Marine highway
Urbanized area
Border crossing
Pennsylvania Multimodal Freight Network - Draft Representation
Note: For information on methodology used for feature selection in this map, please see U.S. Department of Transportation, National Freight Strategic Plan, Appendix D, 2015.
Figure 5: Pennsylvanial Multimodal Freight Network
• Consider CUFC/CRFC Criteria – Routes not currently included in the National Highway Freight Network can become eligible for federal funding by obtaining a federally defined designation as a critical urban freight corridors (CUFC) and critical rural freight corridor (CRFC). Each state has an allotted number of miles which may be designated as CUFC or CRFC routes. In turn, each MPO/RPO only has a proportional number of miles which might be accepted by the state for designation as a CUFC/CRFC route. However, each MPO/RPO likely has many routes that meet the minimum criteria of a CUFC/CRFC route established by FAST Act. Each region should evaluate the criteria of both CUFC and CRFC routes and utilize their own additional criteria for prioritizing which routes they might submit to PennDOT for consideration for the federal designation of CUFC/CRFC. Logically, these routes would likely be included in the regional freight network.
• Review zoning maps to ensure they reflect where future freightgenerating development is desired or likely to occur.
• Consider feedback from stakeholder engagement regarding their needs and concerns with connections to higher level classifications.
• Consider the information gathered from the region’s operations and safety plans and operators (STEP 4) • Consider the federal functional classifications of the routes in the region. •. Consider the characteristics and context of each community and subregion within the region. • Consider utilizing regional judgment and commonsense connections based on local knowledge and
feedback from stakeholders. • Logically connect and fill in the missing links to complete the region’s regional multimodal freight
network. The completed network should connect all the most significant freight centers to the national multimodal freight network and to oneanother as may be appropriate. Coordination with neighboring MPOs/RPOs is important to create a seamless freight network system which logically connects across jurisdictions.
• Reevaluate the regional freight network map with the mobility goals identified in STEP 1 to ensure consistency and progress can be achieved over a longterm period.

Chapter 3 - Freight Planning Process
35
COMMUNICATION: • Economic stakeholders – Request comments and validation on a summary of the findings of the
inventory and operations and safety step. Request comments on the draft regional freight network map.
• Community stakeholders – Request comments on a summary of the findings of the inventory and operations and safety step.
• Public stakeholders – Provide a status update, and a summary of the results of the freight inventory and operations and safety evaluations. Review and approve the proposed regional freight network mapping.
AVOID: A regional freight network that does not connect with neighboring MPO or RPO networks and multimodal operations.
OUTCOME: A map of the regional freight network which identifies the regionally significant multimodal freight network connecting the regional freight centers to one another and to the higher level multimodal national freight network.
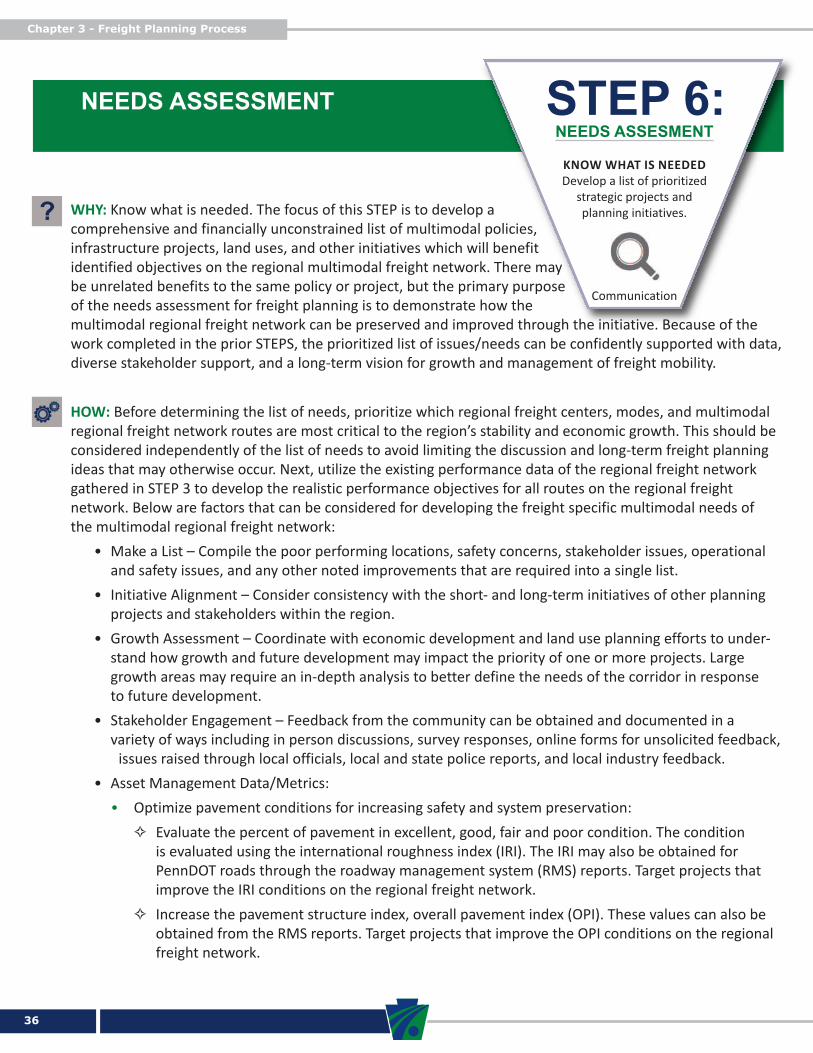
Chapter 3 - Freight Planning Process
36
NEEDS ASSESSMENT
WHY: Know what is needed. The focus of this STEP is to develop a comprehensive and financially unconstrained list of multimodal policies, infrastructure projects, land uses, and other initiatives which will benefit identified objectives on the regional multimodal freight network. There may be unrelated benefits to the same policy or project, but the primary purpose of the needs assessment for freight planning is to demonstrate how the multimodal regional freight network can be preserved and improved through the initiative. Because of the work completed in the prior STEPS, the prioritized list of issues/needs can be confidently supported with data, diverse stakeholder support, and a longterm vision for growth and management of freight mobility. HOW: Before determining the list of needs, prioritize which regional freight centers, modes, and multimodal regional freight network routes are most critical to the region’s stability and economic growth. This should be considered independently of the list of needs to avoid limiting the discussion and longterm freight planning ideas that may otherwise occur. Next, utilize the existing performance data of the regional freight network gathered in STEP 3 to develop the realistic performance objectives for all routes on the regional freight network. Below are factors that can be considered for developing the freight specific multimodal needs of the multimodal regional freight network:
• Make a List – Compile the poor performing locations, safety concerns, stakeholder issues, operational and safety issues, and any other noted improvements that are required into a single list.
• Initiative Alignment – Consider consistency with the short and longterm initiatives of other planning projects and stakeholders within the region.
• Growth Assessment – Coordinate with economic development and land use planning efforts to understand how growth and future development may impact the priority of one or more projects. Large growth areas may require an indepth analysis to better define the needs of the corridor in response to future development.
• Stakeholder Engagement – Feedback from the community can be obtained and documented in a variety of ways including in person discussions, survey responses, online forms for unsolicited feedback,
issues raised through local officials, local and state police reports, and local industry feedback. • Asset Management Data/Metrics:
• Optimize pavement conditions for increasing safety and system preservation: G Evaluate the percent of pavement in excellent, good, fair and poor condition. The condition
is evaluated using the international roughness index (IRI). The IRI may also be obtained for PennDOT roads through the roadway management system (RMS) reports. Target projects that improve the IRI conditions on the regional freight network.
G Increase the pavement structure index, overall pavement index (OPI). These values can also be obtained from the RMS reports. Target projects that improve the OPI conditions on the regional freight network.
STEP 6:NEEDS ASSESMENT
KNOW WHAT IS NEEDED Develop a list of prioritized
strategic projects and planning initiatives.
Communication

Chapter 3 - Freight Planning Process
37
• Reduce the number of structurally deficient bridges to increase freight mobility: G Reduce the percent of structurally deficient bridges
by deck area. The pertinent structures and rankings within in a region can be obtained for PennDOT bridges from PennDOT’s bridge management system (BMS).
G Reduce the number of load restricted bridges. The location of load restricted bridges can be obtained by requesting the information from the PennDOT BMS, or through the PA One Map portal, which can be accessed by the public at no cost.
• Reduce the number of weight restricted roads and bridges: G PennDOT weight restricted roads can be identified using RMS data or PA One Map.
Locallyowned, weightrestricted roads must be obtained from the respective owner. G PennDOT weight restricted bridges can be determined by BMS data and PA One Map.
Locally owned, weightrestricted bridges must be obtained from the respective owner. • Rail asset management metrics • Port asset management metrics • Airport asset management metrics • Pipeline asset management metrics
• Safety/Crash Data – Pennsylvania State Police and local police records can provide vehicle crash data (number, types, locations). Specific crash information is not public and should not be published in a freight plan or any other publiclyavailable documents. Additionally, the National Highway Traffic Safety Administration provides annual public reporting of crash statistics including Fatality Analysis Reporting System (FARS) and the National Automotive Sampling System (NASS). The data is utilized only as a resource for determining crash rates and identifying areas of safety concern.
• Congestion Data, Capacity, Bottlenecks – National Performance Management Research Data Set (NPMRDS). There is a great deal of data provided by the FHWA through this tool. Access to this data is available to state DOTs, MPOs, and RPOs upon request.
• First/Last mile and connectivity – This information can be obtained through stakeholder meetings and data analysis of freight movements obtained in STEP 2 and 3. First/Last mile connectivity from the regional freight network to freight facilities often use smaller, local streets and can present challenges for prioritizing the needs and resources of local governments.
• Engineering/Mobility study (as needed) – A specific study may be warranted to provide a more detailed evaluation that might not otherwise be possible. A study should be broad enough to capture the true nature of freight movement in a defined corridor and should reflect the longterm goals and vision of the region for the corridor. If desired, the study can determine specific scope and costs for projects that will improve mobility, capacity, geometric constraints, bridge conditions, weight restrictions, and many other factors.
• Prioritize Freight Initiatives – Utilize PennDOT’s project evaluation process and other evaluation tools and systems already utilized by other agencies to evaluate each route and facility for the specific needs that arise. After adequate data is obtained, determine how each project will be prioritized based on the location on the regional freight network, safety benefits, freight mobility benefits, other project benefits, alignment with the community goals and vision, and other appropriate factors.

Chapter 3 - Freight Planning Process
38
• Example Policies and Initiatives – Policy needs and program initiatives can be original to the region or could also be modeled after other regions that have successfully addressed the same issue.
COMMUNICATION:
• Economic stakeholders – Request suggestions for improving freight mobility, safety, and preservation of the regional freight network including how the suggestion would impact their operations.
• Community stakeholders – Request suggestions for improving freight mobility, safety, and preservation of the regional freight network including how the suggestion would impact their travel.
• Public stakeholders – Provide a status update and a summary of needs developed by the project team including any modifications to the regional freight network.
AVOID: Prioritizing a freight project that, by itself, has no chance of obtaining funding.
OUTCOME: Prioritized list of infrastructure improvements which enhance the safety and mobility of the regional freight network. “
”
Low cost, simple projects identified by stakeholders should be highly prioritized for fast
implementation.
Sara Walfoort, Freight Planning Manager

Chapter 3 - Freight Planning Process
39
FREIGHT ACTION PLAN
WHY: Take Action. The work involved in the previous STEPS should culminate in STEP 7 through actions of policy implementation, improved land uses, infrastructure projects, effective communication, educating stakeholders, and a common vision for freight mobility in the future. The work involved to this point does not achieve its full potential unless there is collective stakeholder support for actions that improve the multimodal regional freight network. A datadriven recommended plan of action with associated performance objectives addressing multiple issues is more easily supported and moved forward. Without the invested time and energy in the previous STEPS, the stewardship and potential partnership with the freight community is greatly reduced. HOW:
• Methodology – Establish the guiding principles and policies for how freight mobility, safety and preservation will be evaluated the multimodal regional freight network.
• Freight Recommendations – Develop recommendations and templates for local land use ordinances which preserve and protect the regional freight network.
• Proposed Schedule – Determine the relative time frame for each policy, project, and initiative. Lowcost, simple policies, projects, and initiatives identified by stakeholders should be highly prioritized for fast implementation.
• Proposed Funding – Develop available funding sources for each project. Research and solicit industry partnership and grants: • InfraGrants – Infrastructure for Rebuilding America (INFRA) is a federal discretionary grant program
that dedicated $856 million to both large and small infrastructure projects that promote innovation and partnership.
• CMAQ – Congestion Mitigation and Air Quality (CMAQ) Improvement Program. The FAST Act continued the CMAQ program to provide a flexible funding source to state and local governments for transportation projects and programs to help meet the requirements of the Clean Air Act. Funding is available to reduce congestion and improve air quality for areas that do not meet the National Ambient Air Quality Standards for ozone, carbon monoxide, or particulate matter (nonattainment areas) and for former nonattainment areas that are now in compliance (maintenance areas).
• State Rail Freight Assistance – The Rail Freight Assistance Program (RFAP) provides financial assistance for investment in rail freight infrastructure. The intent of the program is to preserve essential rail freight service where economically feasible and preserve or stimulate economic development through the generation of new or expanded rail freight service. The maximum state funding for a RFAP project is 70% of the total project costs, not to exceed $700,000.
STEP 7:FREIGHT ACTION PLAN
TAKE ACTION Develop a list of projects that could be implemented via the
TIP, LRTP or other planning strategiesor funding
programs
Communication

Chapter 3 - Freight Planning Process
40
• P3 Projects – Public Private Partnerships • BUILD Grant – The Better Utilizing Investments to Leverage Development, or BUILD Transportation
Discretionary Grant program, provides a unique opportunity for the DOT to invest in road, rail, transit and port projects that promise to achieve national objectives. Previously known as Transportation Investment. Generating Economic Recovery, or TIGER Discretionary Grants, Congress has dedicated nearly $7.1 billion for ten rounds of national infrastructure investments to fund projects that have a significant local or regional impact.
• ATCMTD Grant – The FAST Act established the Advanced Transportation and Congestion Management Technologies Deployment Program to make competitive grants for the development of model deployment sites for large scale installation and operation of advanced transportation technologies to improve safety, efficiency, system performance, and infrastructure return on investment.
• National Highway Freight Program (NHFP) Funds – A proportionate share of each state’s NHFP funds is set aside for the state’s metropolitan planning program. This occurs prior to apportionment, and the setaside funds are combined with the state’s regular metropolitan planning program funds. (See “Apportionment” fact sheet for a description of this calculation)
• National Highway Performance Program (NHPP) Funds – The FAST Act directs FHWA to apportion funding as a lump sum for each state then divide that total among apportioned programs. Within this process, a state’s NHPP apportionment is calculated based on a percentage specified in law.
• Air Grants and Funding – Includes competitive grant funding announcements for projects and programs relating to air quality, transportation, climate change, indoor air and other related topics.
• Brownfields Grants and Funding – Existing facilities where redevelopment is complicated by real or perceived contamination.
• Office of Land and Emergency Management (OLEM) Grants and Funding – Includes competitive grant funding announcements for projects and programs relating to Brownfields, Federal Facilities Restoration and Reuse, Solid Waste management, resource conservation and recovery, Underground Storage Tanks and other related topics.
• Action Plan – Based on the prioritized needs assessment list, guiding freight policy, available funding, and project time frames develop a realistic plan for implementing projects, policies, and initiatives that enhance the multimodal regional freight network.
• Educate – Educate decision makers on the proposed freight action plan. • Integrate – TIP project scoring process. • Creative Thinking – After the TIP is adopted, reevaluate the policies, projects, funding, and plan of
action for future opportunities and additional support. • Success Factors – Measures of effectiveness for the freight action plan:
• Number of multimodal projects on multimodal regional freight network • Freight mobility on the multimodal regional freight network • Safety performance on the multimodal regional freight network • Additional funding sources and partnerships • Number of freight policies and ordinances implemented • Improved coordination with multimodal operators • Number of respondents from communication efforts with key stakeholders

Chapter 3 - Freight Planning Process
41
COMMUNICATION: • Economic stakeholders – Collaborate to develop the prioritized and fiscally constrained policies,
projects, and initiatives to be considered for implementation. Seek partnership on projects that have a high benefit to local freight industry.
• Community stakeholders – Request comments on the prioritized and fiscally constrained policies, projects, and initiatives.
• Public stakeholders – Provide a status update. Collaborate to develop the prioritized and fiscally constrained policies, projects, and initiatives to be considered for implementation. Review and approve the final freight action plan.
AVOID: Over promising. Inaction.
OUTCOME: A prioritized list of implementable projects, policies, and initiatives, which can be tracked by performance metrics. This STEP is the last and most significant step to influence decision makers in implementing policies, projects, and initiatives that protect, preserve, and enhance the multimodal regional freight network.

Chapter 3 - Freight Planning Process
42
MONITOR PROGRESS AND
RE-EVALUATION
WHY: Change is inevitable. Along with the economic demands and culture of the region, the freight movement industry is constantly innovating and improving daytoday business. People and businesses change locations, improve efficiencies, go out of business, change uses of buildings and property, and the region adjusts accordingly. The priorities and funding of a freight action plan are influenced by factors that are often outside the control the MPO/RPO. To remain relevant and up to date, the freight action plan should be reevaluated annually for minor updates and a full update should be considered with updates to the TIP and LRTP. A maximum fiveyearcycle is recommended for a full update to reevaluate each of the regional freight planning STEPs HOW:
• Monitor Effectiveness – Utilize the list of priority projects in the freight action plan to determine the number of projects that have been incorporated in the TIP and moved to construction.
• Reevaluate Objectives – Utilize the goals and objectives established in STEP 2 as a means for evaluating the anticipated benefits of projects implemented on the regional freight network.
• Update STEP 7 and Validate – Look for projects and policies that were not a part of the regional freight action plan but have a direct positive or negative impact to the regional freight network. Consider how the next freight action plan update can incorporate these topics in the future. Reprioritize and/or remove initiatives that have changed since the previous Freight Action Plan.
• Make it Better – Consider the additional information needed to improve the quality and accuracy of the freight action plan. Consider the information that was least informative for developing the freight action plan and consider reducing the level of effort in the next freight action plan update.
COMMUNICATION:
• Economic stakeholder – Annual report of progress being made on the freight action plan. Include recommendations for minor updates to the freight action plan and start of the next proposed full update (a fiveyear minimum cycle is recommended).
• Community stakeholders – Annual report of progress being made on the freight action plan. • Public stakeholder – Annual report of progress made on the freight action plan.
AVOID: Unmeasurable objectives.
OUTCOME: A progress report of the freight action plan and performance metrics. Recommendations for minor updates and full updates and suggestions for improving the freight planning process in the future.
STEP 8:MONITOR & RE-EVALUATE
CHANGE IS INEVITABLE Annual evaluation of the progress
of the freight action plan. Recommend minor updates,
additional components, and schedule for full
update.
Communication

Chapter 4 - Supplemental Components
43
CHAPTERSUPPLEMENTAL COMPONENTS

Chapter 4 - Supplemental Components
44
4.1 SUPPLEMENTAL COMPONENTS
After the initial STEPS of freight planning are established, additional tasks can be undertaken to enhance and supplement the freight planning process. Each additional component adds value to one or more of the STEPS and thereby increases the clarity and resources available to decision makers. While the components in this chapter are not an identified freight planning STEP, Component A and B are highly recommended best practices to help make the all planning processes complimentary and united with the vision of the community. Components C through I are very useful as the appropriate need and justification becomes apparent during the freight planning STEPS.
Table 4: Components
A Integrated Freight Planning. Go to page 45
B Freight Advisory Committee. Go to page 47
C Regional, Corridor, and Traffic Studies. Go to page 49
D Freight Scenario Planning. Go to page 50
E Freight Fluidity. Go to page 53
F Regional Freight Forecasting Model. Go to page 55
G MultiRegional Freight Corridor Study. Go to page 56
H Urban Freight Study. Go to page 57
I Workforce Development for Freight Planning. Go to page 58

Chapter 4 - Supplemental Components
45
INTEGRATED FREIGHT PLANNING WHY: This component connects disparate planning efforts at a higher level by combining the stated goals and objectives of each into a united, shared vision. Integration will allow projects, policies, and initiatives that impact freight mobility and safety to balance the same shared goals and objectives that are critical to all stakeholders. One example is the “Complete Streets” designs. Although difficult, working toward the same goals will help all planning efforts and decisions to be informed, prioritized, and complimentary to the overall vision for the region. Conversely, developing projects and initiatives that are detrimental to the vision of the community is an avoidable waste of time and resources. Table 5 below indicates tools for achieving freightcompatible development. HOW: Integrated planning should involve as many significant planning efforts as may be practical. Some planning efforts however must be a secondary, rather than a primary, influence. Each MPO/RPO must determine how to establish its own priorities for creating an integrated vision focused on engaging people, creating shared policy, understanding and managing stakeholder expectations, and developing compatible products. Allow the merits and measurable objectives of each planning process to be considered aside from the personalities of those advocating on their behalf. Below is a list of planning efforts which directly impact freight mobility to consider for integration:
• Long range transportation planning • County comprehensive plans • Economic development, land use planning, and zoning • Rail planning, ports planning, airports planning • Bike/Ped planning, trail planning, complete streets projects [not very compatible with freight mobility] • Statewide planning • Neighboring regions’ planning • Municipal planning • Highway Occupancy Permit Applications • Environmental Studies • Highway Occupancy Permit Applications
COMMUNICATION:
• Public stakeholders – Collaborate with decision makers across the region to develop and approve a collective integrated vision for the region including regional freight planning initiatives. Integration requires compromise and managing expectations. Focus on how the measurable objectives will contribute to the community’s vision.
• Economic stakeholders – Utilize the public participation plan to request feedback regarding an integrated comprehensive approach to the longterm vision of the region including initiatives for regional freight planning. Request feedback from key industry stakeholders, public agencies, municipal planners, chambers of commerce, economic development groups, professional societies, community groups, and any other organization interested in the longterm vision of the region. Integration requires compromise and managing expectations. Focus on how the measurable objectives will contribute to the community’s vision.
COMPONENT A

Chapter 4 - Supplemental Components
46
• Community stakeholders – Request feedback regarding an integrated comprehensive approach to the long term vision of the region including initiatives for regional freight planning. Utilize the public participation plan. Integration requires compromise and managing expectations. Focus on how the measurable objectives will contribute to the community’s vision.
AVOID: Loosing focus of the most relevant higherlevel planning influences in the overall scheme of the region and community. Surprise projects and initiatives that are contrary to the shared vision of the region/community. Personalities being more influential rather than data driven achievable objectives.
OUTCOME: A common published vision with shared goals by all major planning efforts in the region for the purpose of guiding the respective decision makers towards a fully informed intentional longrange vision for the community.
Table 5: Freight-Compatible Development
Long-Range Planning Zoning & Design Mitigation Education & Outreach
State Enabling Acts Zoning Standards Buffer Areas Informal Negotiations
Regional Visioning
Buffer Areas
Noise and Vibration Treatment
Public Involvement
Comprehensive Plans
Overlay Districts
Track Treatment
MultiJurisdictional Agreements
Freight Facility Inventories Official Maps
Lot Orientation Property Design
Yard ReAlignment Grade Crossing Management
Stakeholder Round Tables and Freight/Community
Purchase and Advance Acquisition
Construction Standards Sound Proofing Standards
Port Gate Management Environmental Measures
Land Swaps Zoning Measures
Protective Condemnation Public Outreach and Education
Permit Development Relocation
Access Rights

Chapter 4 - Supplemental Components
47
FREIGHT ADVISORY COMMITTEE WHY: This component is intended to enhance and supplement the efforts of the stakeholder engagement already occurring as a normal process of freight planning. The American Transportation Research Institute in its Identifying State Freight Plan Best Practices, February 2018 defines a freight advisory committee (FAC) as “A group of individuals representing various public and private sector stakeholders.” The purpose of this committee is to act in a consultative role regarding freightrelated prioritizing, projects, issues, and funding. While the function of the committee will vary between regions, it could serve as a forum for freightrelated discussions to communicate and coordinate priorities with other organizations and neighboring regions, and to promote the sharing of freight information between the region and private and public sectors. A freight advisory committee should be comprised of public and private freight representatives including local governments, state and federal agencies, colleges and universities, supply chain managers, railroads, trucking and airport officials, thirdparty logistics providers (3PLs), developers, chambers of commerce, and community improvement districts. This committee can allow a more collaborative approach between numerous stakeholders for issues and projects that are important to all operations and to the MPO/RPO. Many MPOs/RPOs in Pennsylvania have used at one time, or are currently using, some form of a FAC to gain more direct and intentional feedback from local industry. For instance, the Delaware Valley Regional Planning Commission (DVRPC) has a “Goods Movement Task Force” that has been meeting for 26 years and has very strong participation. They typically structure their large group meetings around a specific topic which is announced prior to the meeting. Many attendees utilize the meeting as a means of networking and business development. In addition to the larger more public meeting, DVRPC also meets with an executive committee. This group is much smaller and less public, which allows attendees to be more candid in their discussions and demonstrating less concern with sharing proprietary information in the smaller group. A recurring theme for establishing and maintaining a FAC is to engage business leaders in a meaningful intentional way, provide them with relevant information and resources that are useful to them, and help them understand the process for addressing their issues through the planning process. HOW:
• Establish the purpose of the FAC and communicate it to potential stakeholder participants. Be able to communicate the practical purposes and need for the FAC meetings above and beyond the normal stakeholder communication process.
• Invite the key stakeholders from within the region to participate. Schedule the meetings around times that work best for the schedule and expectations of the key stakeholders.
• Invite selected stakeholders to attend who may be able to add value and different perspectives to thediscussions.
• Reestablish the purpose and goals of the FAC with the entire group. • Set the meeting schedules and possible agenda topics for the next two or three meetings. FAC meetings
are recommended twice a year at a minimum and no more than monthly when pressing issues are being evaluated.
• Invite additional attendees as they become available to provide additional insights There are four MPO Freight Advisory Committees in Pennsylvania including DVRPC, LVPC, NEPA, and SPC. These committees should be utilized as a resource and example for best practices.
COMPONENT B

Chapter 4 - Supplemental Components
48
Two examples of from a FAC purpose statement is as follows:
• For each meeting, know the takeaway feedback that is desired from the committee • Provide updates and information to the FAC. Be a resource for them. • Followup onetoone as needed to clarify comments and obtain additional feedback.
COMMUNICATION:
• Public stakeholders – Request insights on which stakeholders should be invited to participate in the FAC. Invite all regional decision makers to the FAC meetings.
• Economic stakeholders – Invite the key industry stakeholders to participate. Schedule around the people most desired to attend. Send regular notifications about when and where the meetings will be held including an agenda and handouts for review prior to the meeting.
• Community stakeholders – FACs are typically not open to the public so that discussion topics can be focused on the issues pertinent to the freight industry leaders. Public participation is welcome at MPO and RPO meetings and through the various methods of gathering public opinions and feedback. Selected community stakeholders could be invited to inform and debate the group on particular issues.
AVOID: Meetings that do not accomplish anything. Wasting time.
OUTCOME: A group of the leading freight influencers and stakeholders in a region engaged in mutually beneficial discussions to share ideas, issues, solutions, partnerships, and the overall progress of transportation and the freight movement industry.
“
”
It is the intent of this Committee to promote and develop a functional and efficient regional
freight system and advise on all goods movement issues including relevant studies and
projects. The Committee will consider the movement of freight to and from manufacturing
sites, cities/downtown areas, intermodal facilities, warehouses, and utilities, as well as the
region’s freight transportation network (i.e., highways, railroads, ports, airports, and
pipelines). The Freight Advisory Committee will meet quarterly to maximize the region’s
goods movement capability by sharing information and technology between public and private
freight interests, promoting the region’s intermodal capabilities and capacity, and developing
and implementing a regional goods movement strategy.
Lehigh Valley Planning Commission
“”
Maximize the Delaware Valley’s position in the global economy by promoting a regional goods movement strategy and balancing freight operations with community goals.
DVRPC purpose

Chapter 4 - Supplemental Components
49
REGIONAL, CORRIDOR, AND
TRAFFIC STUDIES WHY: This component is utilized to obtain greater knowledge and possible solutions for a specific performance metric or area of interest of the regional freight network. HOW: This effort is a shortterm project that will require the dedication of additional resources and staff. Many MPOs/RPOs conduct various studies that inform and educate their decision makers and the public. The purpose of the study should be strongly aligned with improving one or more performance metrics of the transportation system. A few examples of studies include:
• Freight corridor study (within the region) • Commodity flow study • Congested corridor study • Employment quotient study • Economic trends study (natural resources, distribu
tion facilities, emerging industries, etc.) • Truck parking study • Regional freight supply chain study • Employment commute study • Roadside delivery study • Urban delivery • Intelligent transportation system (ITS) study • Connected and autonomous vehicle study • Mobility/Way finding study
COMMUNICATION:
• Public stakeholders – Collaborate to develop the scope, budget, and schedule for the desired study including the intended objectives and how the study will improve the decisionmaking process.
• Economic stakeholders – As needed, depending on the study being conducted. • Community stakeholders – As needed, depending on the study being conducted.
AVOID: Any study without a clear scope and correlation to specific performance metrics related to the regional freight network. OUTCOME: A study that quantifies the multimodal needs of a defined area to meet the performance metric goal(s) of an integrated transportation plan. The study will support decision makers in developing the TIP and be incorporated into transportation action plans.
COMPONENT C

Chapter 4 - Supplemental Components
50
FREIGHT SCENARIO PLANNING WHY: Things don’t usually go according to “Plan A.” Scenario planning is a process of thoughtfully considering the options to achieve a desired target/scenario (normative scenario planning) or to mitigate against risks (exploratory scenario planning). The scenarios typically involve circumstances that are mostly outside the control of the MPO/ RPO but have significant impacts to the community and transportation infrastructure. A region could investigate the positive and negative circumstances actually experienced by another community to help them make better informed decisions. Depending on the amount of associated risk and the overall objectives of the region, scenario planning may influence how planning and programing occurs presently in order to mitigate against risk in the future. The purpose of scenario planning is not to accurately define the problem or solution at a finite level, but rather to understand the possible scenarios, higherlevel risks, and to take practical steps for achieving a more desirable future. HOW:
• Direction Setting – Determine if the scenario planning effort will be “normative” or “exploratory” in nature. Normative scenario planning has a known outcome or target but various pathways or scenarios that could occur to reach the target. Exploratory scenario planning has an unknown outcome, but it is desired to exploring the outcome of known forces driving change. For the purposes of this guidance, a normative approach may be most beneficial as it is aligned with the vision of the community. Exploratory scenarios could be most helpful for revealing issues and risks to the community and regional freight network. Decision makers should be engaged to help determine the direction of the scenario and the desired outcomes and potential stakeholders that will help inform the process.
• Engage a strategic and diverse group of stakeholders to develop a list of forces driving change and potential risks that could be developed into a scenario. A matrix or scoring system could be utilized to grade the merits of each scenario with brief descriptions of potential impacts to the community and regional freight network. Determine if each potential scenario should have deliverable that is educational, strategic, or action oriented.
• Scenario Development – After one or more scenarios are selected for development, determine the data/ analysis needed, people involved, anticipated schedule, and required resources to accomplish the desired outcome of each scenario (educational, strategic, action). Proceed with the development of each selected scenario.
COMPONENT D
“”
If I had an hour to solve a problem, I'd spend 55 minutes thinking about the problem, and 5
minutes thinking about the solution. Albert Einstein

Chapter 4 - Supplemental Components
51
• Provide the deliverable outcome of the scenario planning process as needed. Some examples of scenarios to consider might include: • Evaluating investment options to solve an issue and its potential impact • Warehousing and distribution facilities add significant space over the next 10 years • A rail line or port is developing a new intermodal facility in three years • Gas prices and new technology cause natural gas developers to significantly expand operations
within the region • New federal legislation doubles the available multimodal freight funding • A top freight generating business enters or leaves the region • Changes in technology, equipment, vehicles, etc. impact how freight is moved
COMMUNICATION:
• Public stakeholders – Involve multiple people as may be strategically advantageous for development of each scenario. Review and approval of proposed scenarios, budget, and schedule including the desired objectives and how the scenario will improve the decisionmaking process.
• Economic stakeholders – Involve multiple people as may be strategically advantageous for development of each scenario. Seek validated information regarding economic driving forces within particular industries.
• Community stakeholders – Involve multiple people as may be strategically advantageous for development of each scenario.
AVOID: Planning for scenarios that are very unlikely to occur. Choose scenarios carefully and deliberately and avoid over estimating future demand and growth.
OUTCOME: A better understanding and documentation of the potential risks and mitigations steps for various possible scenarios. Elements may include educational, strategic, and/or actional objectives. “
”
The benefits of scenario planning include helping planners navigate uncertainty or pinpointing
a preferred combination of variables to reach a specific target. Scenario planning activities often
support subjectspecific planning efforts, including visioning, longrange transportation plans,
climate change action plans, and many others.
American Planning Association, Planning Advisory Service

Chapter 4 - Supplemental Components
52
“
”
A plan is only a scenario, and almost by definition, it is optimistic... As a result, scenario planning
can lead to a serious underestimate of the risk of failure.
Daniel Kahneman 2002 Nobel Economist

Chapter 4 - Supplemental Components
53
FREIGHT FLUIDITY WHY: It’s how the freight industry operates. Freight fluidity is a recent development in the freight industry that quantifies the efficiency of how well a supply chain operates. Since the concept was first introduced in Canada, the FHWA has studied its application to the U.S. and has developed the National Freight Fluidity Program. Freight fluidity employs performance measures commonly used by corporate supply chains including travel time, traveltime reliability, and transportation cost. The I95 Corridor Coalition noted the importance of freight fluidity of supply chains for the following reason:
• It’s how our freight users do business. • Supply chain performance is key to economic competitiveness. • Shows performance endtoend (sum of stages). • Stages put local dynamics in larger perspective: user view, market view • Important to understand public sector role. • regional supply chains and local delivery under 100 miles are significant indicators
For the purposes of regional freight planning, freight fluidity is an emerging multimodal analytic tool that is utilized by freight carriers, policy makers, and economic investors to make decisions. Freight fluidity is a significant factor in the economic competitiveness of a region. Regional MPOs/RPOs should evaluate the significant supply chains within their region and look for opportunities to improve freight fluidity where possible. HOW: Expert freight analysis support is recommended to develop the supply chain freight fluidity performance within the region. COMMUNICATION:
• Public stakeholders – Review and approval of proposed scope, budget, and schedule including the desired objectives and how freight fluidity metrics will improve the decisionmaking process. Regular status updates.
• Economic stakeholders – Request supply chain information to support the data analysis for freight fluidity. This should be a protected and confidential transfer of information utilized only for supporting the analysis and should be protected against discovery for other uses and organizations. Update supply chain information on a regular schedule.
COMPONENT E
“
”
Freight Fluidity” focuses on transportation supply chain performance measurement (SCPM); that
is, the measurement of travel time, traveltime reliability and cost of moving freight shipments
from endtoend of a supply chain.
Freight Fluidity Scale of Analysis, Freight Fluidity Background Paper #2 By TTI for TRB and FHWA

Chapter 4 - Supplemental Components
54
• Community stakeholders – No communication is required for the development of the freight fluidity analysis. If desired, the results of the freight fluidity performance metrics could be made public.
AVOID: Avoid developing supply chain treatments without adequate supporting data.
OUTCOME: Freight fluidity metrics for the significant supply chains operating within the region. The metrics should indicate well performing sections and poor performing sections. Freight fluidity metrics are an indicator of the economic competitiveness of a region.

Chapter 4 - Supplemental Components
55
FREIGHT FORECASTING MODEL
WHY: : Freight movement dominates the mobility of all traffic. This task is an indepth freight forecast model that supplements and enhances a region’s travel demand modeling. The regional travel demand model may require a more indepth analysis on a route or region that is anticipated for significant growth and change due to large projects. HOW: : This process is unique and specialized to the desired scope of the model. Extensive efforts and resources are required with specialized modeling software, data sets, and engineering support. An expert should be sought out either internally from the MPO/RPO’s staff or through consultant support with forecasting expertise. COMMUNICATION:
• Public stakeholders – Review and approval of proposed scope, budget, and schedule including the desired objectives and how the model will improve the decisionmaking process.
• Economic stakeholders – As needed, depending on the freight model. • Community stakeholders – As needed, depending on the freight model.
AVOID: : Shortcuts procuring data and technical expertise. OUTCOME: : Data supported freight forecast model that projects growth and future needs of the regional freight network.
COMPONENT F

Chapter 4 - Supplemental Components
56
MULTI-REGIONAL FREIGHT
CORRIDOR STUDY WHY: Put the pieces of the freight puzzle together. This component provides an indepth study of a proposed freight corridor extending over regional or state boundaries. This type of study should be developed as a joint effort from each region that would be impacted by the corridor. By pooling resources from multiple regions, the scopes of the various studies can be expanded, improving the understanding of how various influences can impact the freight networks and incorporate the needs of the larger freight economy. HOW: This is an extensive effort that should be advanced at a pace that is respecting all parties involved. The STEPS laid out in Chapter 3 could be utilized as a planning process for developing the multiregional planning process for the freight corridor. Ensure there is sufficient participation from each organization with committed personnel and resources. A cooperative agreement or memorandum of understanding between all participating regions is recommended to clarify the agreed scope, schedule, and committed budgets of each region to the study. This process requires a strong leadership team comprised of individuals from each region to gain and keep momentum for the study. COMMUNICATION:
• Public stakeholders – Collaborate between all regional decision makers to develop an agreed scope, budget, and schedule for the freight corridor study. Provide status updates monthly to all regions including action items for decisions and information required in the next two months.
• Economic stakeholders – A combined freight advisory committee is recommended. Provide status updates as significant decisions are being made.
• Community stakeholders – As needed according to each region’s public participation plan AVOID: Unorganized teamwork, floating schedules, and poor communication. OUTCOME: Develop a partnership with neighboring regions and states affected by the same corridor. The partnership should develop a unified asset management plan for the corridor. The members should help each other with technical advice and funds strategies to obtain a comment goal.
COMPONENT G
“
”
Each region must understand the context of who they are and how they fit into the larger
geographical supply chain. When it comes to moving freight, a local region is only one piece of
many puzzles along a supply chain. Any one region is not the sum of all parts but the sum of
many parts.
Mary Grace Parker, The Eastern Transportation Coalition

Chapter 4 - Supplemental Components
57
URBAN FREIGHT STUDY WHY: Within the last mile of an urban delivery, unloading and delivering packages accounts for approximately 50% of the delivery time, making freight delivery to urban areas a constant challenge to manage. As shopping habits and delivery expectations continue to change, the delivery of freight to urban areas continues to increase in its impact to congestion, mobility, and safety. Taking an inventory of how deliveries typically occur is a critical first step toward finding ways to improve efficiencies and develop effective policies. HOW:
• Inventory of urban freight characteristics: • Urban freight centers • Supply chains and nearby distribution centers serving the urban area • Designated truck routes • Offstreet truck parking lots, truck loading docks • Onstreet truck parking, curb space inventory • Unauthorized parking locations • Geometric constraints for truck mobility • Transit routes, stops, and stations • Regulations for time restrictions, emissions controls, idling, etc. • Documentation of process flow for high volume freight locations
• Observe, engage, and understand the needs of economic stakeholders and validate the collected data • Incorporate as appropriate into the regional freight planning process • Develop initiatives and improvements to enhance urban freight mobility
COMMUNICATION:
• Public stakeholders – Review and approval of proposed scope, budget, and schedule including the desired objectives and how the urban freight study will improve the decisionmaking process.
• Economic stakeholders – Request supply chain information, parking, loading, and route information. Request updated information on a regular schedule.
• Community stakeholders – No communication is required. If desired, the results of the urban study could be made public.
AVOID: Staying in the office.
OUTCOME: Establish freight management guidelines for communities to implement into local code and ordinances. Provide guidance on how freight should be considered in future development or redevelopments. Items such as loading and unloading shipments, interface with other modes of transportation, pedestrian safety, and truck staging should be among the items established.
COMPONENT H

Chapter 4 - Supplemental Components
58
WORKFORCE DEVELOPMENT
FOR FREIGHT PLANNING WHY: You don’t know what you don’t know. Education and development of staff in freight planning is critical to not only the freight planning tasks in this guidance, but also for the benefit of educating stakeholders. A trained and knowledgeable freight planning leader can help create an intentional multimodal vision that will bridge the legacy of a community to the innovative ideas, growth, and emerging technologies of the future. As noted in Chapter 2, most people have a general understanding of the impacts of freight movement and safety, but the ability to connect the interests of all stakeholders into a common vision for freight requires a broad spectrum of knowledge and skill. Investing in the education and development of a freight planner is a service and good stewardship for all the region’s stakeholders and the community. HOW:
• Identify a current or future staff member who has an interest and desire to dedicate their professional development in freight planning.
• Identify a freight planning mentor. • Create a professional development plan for this person to attend
workshops, training events, conferences, take classes, peer exchanges, and other identified resources.
• As consultant support is utilized for freight planning efforts, allow time and resources for this person to learn about the technical aspects of the deliverables.
• Engage the economic stakeholders in the region to fully understand and advocate for their needs of the regional freight network.
• Dedicate time and resources for understanding the multimodal freight operations of the region. COMMUNICATION:
• Public stakeholders – Notify and educate public stakeholders regarding the skills, services and value of a freight planner to help them make informed decisions.
• Economic stakeholders – Notify and educate economic stakeholders regarding the skills, services, and value of a freight planner to help them advocated for issues that are important to their industry, operations, and the community.
• Community stakeholders – Notify and educate community stakeholders regarding the skills, services, and value of a freight planner to advocate for their vision and growth of the community.
AVOID: Assigning responsibility without the training and resources needed to succeed. OUTCOME: One or more personnel who have a portion of their normal workload, professional development, and personal interests dedicated to freight planning with the support and resources of the organization.
COMPONENT I

Chapter 5 - Publishing a Freight Plan
59
CHAPTERPUBLISHING A FREIGHT PLAN

Chapter 5 - Publishing a Freight Plan
60
5.1 PUBLISHING A FREIGHT PLAN
For all intents and purposes, implementation of STEP 7 – Freight Action Plan is the purpose of regional freight planning. However, the technical details, processes, data analysis, and complex terminology do not easily translate for the purposes of educating various stakeholder decision makers or for public reference. For this reason, many regions have developed a concise, easy to understand publication or website with elements of their “Freight Plan.” The purpose of the regional freight plan is to provide understandable documentation and education on the freight context of the region, issues that have been determined, a vision for the future, and a plan to get there. With so many competing policy and infrastructure needs, decision makers must be able to easily and quickly understand the importance and value of the region’s freight economy and how multimodal transportation projects can preserve and enhance the local economy. The best way to educate decision makers, who have little or no knowledge of freight planning, is to keep the presentation concise, nontechnical, visual, and implementable. Provide additional resources for the supporting studies in the appendix or as a reference.
5.2 PARTS OF A MULTIMODAL REGIONAL FREIGHT PLAN
The process outlined in Chapter 3 can be converted into sections of a published document or website. A summary of the content that is easy to understand, graphical, and nontechnical is more likely to be read and utilized for easily accessible information. The following methods of publishing a regional freight plan are used by many MPOs:
• Published regional freight plan (printed/bound) with a PDF available online • Include interactive GIS maps of the regional freight network • Create selected sections of the freight plan as a web page with the entire plan printable from website • Create an interactive website and GIS maps only with no printable PDFs available.
Based on review of various regional freight plan examples, the following sections should be considered: • Section 1:
• Executive Summary • Section 2:
• Regional Freight Plan Goals G Reference state freight plan & goals
• Section 3: • County Freight Profile(s)
G Location and context
G Population/Demographics
G Operations and safety
• Section 4: • Regional Freight Network
G Interim National Multimodal Freight Network
G Methodology
G Regional Freight Network Map
G Freight centers
G Industries/Employment
G Pertinent maps
STEP
1 & 2DEVELOPED UNDER
STEP
3 & 4
DEVELOPED UNDER
STEP
5
DEVELOPED UNDER

Chapter 5 - Publishing a Freight Plan
61
• Section 5: • Needs Assessment
G Methodology
G Operation and safety needs
G Specialized studies
G Policy and landuse
• Section 6: • Freight Action Plan Summary
G Freight policy implementation and funding
G Freight infrastructure projects and funding
G Freight Initiatives and funding
G Measures of effectiveness
G Reevaluation
The format of communication regarding the freight plan should depend on how the region can best educate its various stakeholders and how often it intends to update the information provided. Below are several questions to consider for the different audiences the MPO/RPO may be considering:
• Public Stakeholders: • What format are they accustomed to from various organizations? • What are the most useful parts of the regional freight plan for public decision makers? • Are decision makers more likely to review a published document or browse all the tabs of a website to
find information they are looking for? Which is easier to search a specific topic? • What will be easier for the stakeholder to visit later for freightrelated questions? • How will their feedback and questions be obtained? • Do you want to control the content and availability for decision makers?
• Economic Stakeholders: • What are the most useful parts of the regional freight plan for stakeholders? • Are stakeholders more likely to review a published document or browse all the tabs of a website to find
information they are looking for? • What will be easier for the stakeholder to visit later for freightrelated questions? • How will their feedback and questions be obtained? • Do you want to control the content and availability for stake holders? • What format are they accustomed to from your organization?
• Community Stakeholders: • What are the most useful parts of the regional freight plan for residents of the region? • Are residents more likely to review a published document or browse all the tabs of a website to find
information they are looking for? • What will be easier for the stakeholder to visit later for freightrelated questions?
STEP
6
DEVELOPED UNDER
STEP
7&8
DEVELOPED UNDER

Chapter 5 - Publishing a Freight Plan
62
• How will their feedback and questions be obtained? • Do you want to control the content and availability for residents? • What format are they accustomed to from your organization?
Utilize these questions to determine the best means of communication and education for each group of people. Additionally, and especially for decision makers, a presentation of the freight plan would help focus attention on the key elements, clarify any confusion, and obtain feedback and next steps for moving freight initiatives forward.
5.3 EXAMPLE FREIGHT PLANS
Several examples of regional freight plans inside and outside of Pennsylvania are provided below and include a brief explanation of how their design is related to the development of this guidance. INSIDE PENNSYLVANIA Pennsylvania Comprehensive Freight Movement Plan – This statewide freight movement plan provides a great deal of information about the entire state and will help the MPOs and RPOs understand how their regional freight network fits into and impacts the rest of the state’s network. This plan provides information on the state freight concerns and what issues PennDOT is examining on a statewide level. The plan can be accessed form the PennDOT web page. In the top ribbon under “Projects & Programs” select “planning,” or use this link: https://www.penndot.gov/ProjectAndPrograms/Planning/Pages/default.aspx. Lehigh Valley Planning Commission (LVPC) – The Lehigh Valley is located one hour west of the ports of New York and New Jersey and has experienced substantial growth in recent years due to the high demand from the warehousing industry. The expansion of the Panama Canal has allowed larger ships and more cargo to be transported to the eastern ports of the US. To help understand the growth patterns, freight movement patterns, and safety concerns LVPC developed its first freight plan in 2015 called “FreightLV.” LVPC used a datacentric approach to inventory travel patterns and determine the critical modes and transportation networks that support freight movement. The Lehigh Valley region is in the initial stages of investigating the region’s potential for an inland port to facilitate freight flows in order to promote economic development and to potentially ease congestion at several ports situated in the New York/New Jersey/Philadelphia market areas. Interviews with various stakeholders involved in the regional freight plan have noted that adequate land is available within the region, as well as access to air, rail, and highway transportation facilities. The freight landscape of the Lehigh Valley is integral to the efficiency of the national supply chain. Delaware Valley Regional Planning Commission (DVRPC) – The DVRPC has focused on maintaining freight resources and information for county and local planners/decisionmakers to expand the reach of freight considerations in regional planning. At the center of this work are the Delaware Valley Goods Movement Task Force and PhillyFreightFinder, a public web tool for exploring freight facilities and activity. The Goods Movements Task Force, which has been meeting for over 25 years, convenes quarterly to highlight regional and national freight trends or issues and seeks to highlight at least one local industry each meeting. Attendees of the meetings include private sector shippers and carriers, as well as transportation planners, economic development planners, and consultants. Members of the committee help to guide the work of the DVRPC planning program through engagement on several subcommittees.

Chapter 5 - Publishing a Freight Plan
63
PhillyFreightFinder, a webaccessible, freight data platform, is maintained by DVRPC as a way to connect the public and planners with vital information about the freight activity and facilities in the region. The use of this platform and the supporting data program allow for continual updates of data to provide users with the most current information on trends and activity of the regional freight system. The tool has been helpful with increasing the dialogue on freight and engaging new partners in the region. Southwestern Pennsylvania Commission (SPC) – With the use of technical memoranda, SPC was able to construct their regional freight plan in steps similar to those proposed in Chapter 3. The advantage to this approach is that all the useful information and research used to develop the regional freight plan is readily available, even though it is not all published in the regional freight plan. SPC’s regional freight plan can be found on the web page. From the SPC home page find the “Publications” links. Within these links there is a link to the regional freight plan. Following this link will lead to a download link for the full document with links to each county freight profile and technical memoranda that were used to develop the plan. https://spcregion.org/pub_freight.asp Since the adoption of the Southwestern Pennsylvania Regional Freight Plan, SPC has found that its external MPOs/ RPOs (county planning offices, economic development groups, etc.) have realized the greatest benefit from the county freight profiles, a collection of the freightrelated data gathered during the planning process and summarized on a countybycounty basis. SPC’s external MPOs/RPOs have used this documentation in the comprehensive planning process, in the (successful) application for grant funding, and in their ability to communicate effectively with their various MPOs/RPOs. Internally, SPC has used the regional freight plan as a tool for the evaluation and prioritization of highway, bridge, and rail projects. They have also integrated freight more fully into SPC’s operations programs, such as CMAQ, ROPS, and congestion management. Finally, through ongoing outreach and engagement, SPC has fostered a cooperative partnership with local property developers, warehouse interests, and transportation providers resulting in a broader and more robust regional transportation planning program. OUTSIDE PENNSYLVANIA Puget Sound Regional Council in Seattle, Washington – The Puget Sound Regional Council developed the regional freight plan as an appendix to the longrange transportation plan. This is a good example demonstrating that the plan does not need to be a huge document. Having the freight plan attached as an appendix provides the freight information with the rest of the longrange transportation planning documents. From the council’s home page select the “OUR WORK” tab, then “Regional Planning,” and then “Regional Transportation Plan” (https://www.psrc.org/our work/rtp). From this page expand the Appendices and click on Appendix J: Regional Freight and Goods Movement, to download a PDF. https://www.psrc.org/sites/default/files/rtpappendixjfreightandgoodsmovement.pdf North Central Texas Council of Governments, Dallas, Texas – The freight plan portion of the web site is similar to DVRPC and includes a published regional freight plan. Though the published plan is from 2013, it is a good illustration of how the plan progressed and was developed. To get to the freight information from the home page select “Transportation” then select Regional Planning & Projects. This will load a list of planning projects. Click on the freight “Learn More” button to bring up all the freight related items and documents. https://www.nctcog.org/trans/plan/freight.

Chapter 5 - Publishing a Freight Plan
64
Atlanta Regional Commission – The Atlanta Regional Commission developed and has been updating their regional freight plan for years. The Atlanta Regional Freight Plan discusses how the region has teamed with different logistic companies and the innovations that are being used to help make freight movement more efficient. They also have a good section in Mobility and Accessibility Measures. One of the metrics that Atlanta used was total truck volumes and not truck percentages. This type of evaluation is particularly useful in highly populated areas. To view the plan on the homepage, select “Transportation & Mobility” under “Browse by Topic.” Under “Transportation & Mobility” select “Transportation Planning.” A page will load with multiple links, including a link for “Freight Transportation” https://atlantaregional.org/transportationmobility/freight/freighttransportation/. North Jersey Transportation Planning Authority – The Goods Movement Strategies for Communities tool was designed by NJTPA staff to help communities that have identified issues related to trucks find strategies that address their concerns. The database includes strategies on last mile delivery parking management; parking and rest stop management; traffic management and access control; freight demand management; road infrastructure improvement; modal optimization; land use and zoning; freight facility consolidation centers; environmental concerns; and safety improvements. The tool is designed to help foster conversation about goods movement. Users can include local officials, developers, transportation providers and property owners. For more information, visit the website at https://goodsmovement.njtpa.org/home.
Appendix A - Freight Glossary & Acronyms
65
APPENDIXFREIGHT GLOSSARY
AND ACRONYMS

Appendix A - Freight Glossary & Acronyms
66
#
3P – See P3 3PL – third party logistics – a firm that specializes in providing services related to the flow of goods to other
companies. 4PL – fourth party logistics – a supply chain integrator that serves to supply a comprehensive supply chain solution
by managing all phases. 5axle tractorsemitrailer – one trailer up to 53 feet long.
6axle tractorsemitrailer – one trailer up to 53 feet long with six axles
A
Atrain combination – truck combinations consisting of a tractor (engine) and two or more trailers using a converted dolly between trailers.
AADT – Annual average daily traffic – a measure of the number of vehicles crossing a specified point on an average day during the year.
AADTT – Annual average daily truck traffic – a measure of the number of trucks crossing a specified point on an average day during the year.
AAPA – American Association of Port Authorities AAR – Association of American Railroads – an industry trade group representing the major freight railroads in
Canada, Mexico, and the U.S.. AASHTO – American Association of State Highway and Transportation Officials access control – measures taken to manage the flow of vehicles getting on and coming off a roadway, typically
highways with interchanges. access management – proactive management of vehicular access points to land parcels adjacent to all manner of
roadways. accessibility – A carrier's ability to provide service between an origin and a destination. agglomeration – A net advantage a company gains by sharing a common location or common services with other
companies. air cargo – Freight that is moved by air transportation. air cargo containers – Containers designed to conform to the inside of an aircraft. There are many shapes and sizes
of containers. Air cargo containers fall into three categories: 1) air cargo pallets 2) lower deck containers 3) box type containers.
air carrier – An enterprise that offers transportation service via air. air taxi – An exempt forhire air carrier that will fly anywhere on demand; air taxis are restricted to a maximum
payload and passenger capacity per plane.

Appendix A - Freight Glossary & Acronyms
67
Air Transport Association of America – A U.S. airline industry association. allcargo carrier – An air carrier that transports cargo only. approach improvement – changes made to roadways as they near an intersection or interchange via the addition
of turn lanes, auxiliary lanes, or other design changes. arterial roadway – a local roadway that provides a primary route for through traffic; roadway providing the highest level of service at the greatest speed for the longest uninterrupted distance, with some degree of access control. American Waterway Operators – A domestic water carrier industry association representing barge operators on inland waterways. Amtrak – The National Railroad Passenger Corporation – a federally created corporation that operates most of the United States' intercity passenger rail service. Association of American Railroads – A railroad industry association that represents the larger U.S. railroads. ATA – American Trucking Association – A motor carrier industry association composed of subconferences representing various motor carrier industry sectors. atgrade intersection – a point where two roadways intersect (or roadway/railroad), typically requiring traffic control such as a stop sign, traffic signals, or crossbucks. ATRI – American Transportation Research Institute auxiliary lane – a noncontinuous travel lane used to facilitate the entering or exiting of traffic.
B
Btrain combination – a truck combination consisting of a tractor (engine) and two trailers. It utilizes a unique trailer assembly that extends from the first trailer to the fifth wheel of the second trailer.
backhaul – The process of a transportation vehicle returning from the original destination point to the point of
origin. The 1980 Motor Carrier Act deregulated interstate commercial trucking, thereby allowing carriers to contract for the return trip. The backhaul can be with a full, partial, or empty load. An empty backhaul is called deadheading. Also see – Deadhead.
barge – A waterborne cargo vessel which may or may not have its own propulsion mechanism for the purpose of transporting goods. Primarily used by Inland water carriers, basic barges have open tops, but there are covered barges for both dry and liquid cargoes.
BEA regions – Bureau of Economic Analysis regions – 179 geographic regions defined by the U.S. Department of Commerce. BEA Regions are made up of markets surrounding metropolitan or micropolitan statistical areas. They consist of one or more economic nodes and the surrounding counties that are economically related to the nodes.
belly cargo – Cargo stowed under the main deck of an aircraft or in the holds of a ship. best practice – A specific process or group of processes which have been recognized as the best method for
conducting an action. Best practices may vary by industry or geography depending on the environment being used. Bestpractices methodology may be applied with respect to resources, activities, cost object, or processes.
bin center – A drop off facility that is smaller than a public warehouse.

Appendix A - Freight Glossary & Acronyms
68
block (rail) – a segment of rail track designated for operating purposes; or, a grouping of railcars destined for the same terminal or the same freight customer also referred to as automatic block system.
BNSF – Burlington Northern Santa Fe Railroad – one of several Class I railroads operating primarily between Chicago and the west coast of the United States.
bobtail – regional term for a straight truck or a commercial tractor in transit without a trailer. bolted rail – see jointed rail. bonded warehouse – Warehouse approved by the Treasury Department and under bond/guarantee for observance
of revenue laws. Used for storing goods until duty is paid or goods are released in some other proper manner. boxcar – An enclosed railcar used to transport freight. box truck – a truck with an attached cargo area. (see also straight truck). BPRR – Buffalo & Pittsburgh Railroad breakbulk – freight facilities that move discretely packaged cargo (such as automobiles, steel girders, or palletized
cargo, etc.) that must be loaded individually, and not in intermodal containers nor in bulk as with oil or grain. breakdown flow – the slowing of traffic due to a large number of vehicles on the road. breakdown point – the traffic volume at which the capacity of a roadway is exceeded. bulk area – A storage area for large items which at a minimum are most efficiently handled by the pallet load. bulk cargo – Unpacked dry cargo such as grain, iron ore or coal. Any commodity shipped in this way is said to be
in bulk. bulk carrier – carriers that haul bulk commodities (i.e., fuel, gravel, grain, fertilizer, vegetable oil, ammonia, scrap
metal, coal, etc.). Liquid bulk is transported in tanker trailers and solid bulk is typically moved in open top trailers.
C
capacity – the number of vehicles that a roadway can reasonably accommodate over a certain period of time. cargo – Merchandise carried by a means of transportation. carload (rail) – a loaded railcar; typically used in descriptions of freight traffic activity. carrier – an enterprise engaged in the business of transporting goods. carrier liability – A common carrier is liable for all shipment loss, damage, and delay with the exception of that
caused by act of God, act of a public enemy, act of a public authority, act of the shipper, and the goods' inherent nature.
cartage – charge for pickup and delivery of goods, or movement of goods locally (short distances). centralized traffic control – a train movement system by which a remote dispatcher controls the throwing of
switches and clearing of signals. certificated carrier – A forhire air carrier that is subject to economic regulation and requires an operating
certification to provide service. chargeable weight – shipment weight used in determining freight charges. The chargeable weight may be the
dimensional weight or, for container shipments, the gross weight of the shipment less the tare weight of the container.
chassis – A specialized framework that carries a rail or marine container.

Appendix A - Freight Glossary & Acronyms
69
city driver – A motor carrier driver who drives a local route as opposed to a longdistance, intercity route. city logistics – the process for optimizing logistics and transport activities by private companies in urban areas. Civil Aeronautics Board – A federal regulatory agency that implemented economic regulatory controls over
air carriers. Class I Carrier – A classification of regulated carriers based upon annual operating revenues motor carriers of
property $5 million; railroads $50 million; motor carriers of passengers $3 million. Class II Carrier – A classification of regulated carriers based upon annual operating revenues motor carriers of
property – $1$5 million; railroads – $10$50 million; motor carriers of passengers – $3 million. Class III Carrier – A classification of regulated carriers based upon annual operating revenues motor carriers of
property – $1 million; railroads $10 million. Class I railroad – are defined by the Federal Surface Transportation Board as having more than a minimum
threshold value of annual carrier operating revenue. The threshold is adjusted annually by the STB. They primarily operate longhaul service over highdensity intercity traffic lanes. Currently seven railroads operating in the U.S. (and four in Pennsylvania) are classified as Class I.
Class II railroad – a classification of regulated carriers based upon annual operating revenues; Class II railroads have annual revenue between the minimum threshold established annually by the Surface Transportation Board for Class I railroads and the maximum established for Class III railroads. Regional railroads also operate over at least 350 miles of track. There are two Class II railroads operating in Pennsylvania: the Buffalo & Pittsburgh Railroad, and the Wheeling & Lake Erie Railway.
Class III railroads – also called short line railroads, operate over less than 350 miles of track and have annual operating revenue of less than a threshold established annually by the Surface Transportation Board.
classification yard – A railroad terminal area where railcars are grouped together to form train units. CMU – Carnegie Mellon University CN – Canadian National Railroad CO – carbon monoxide CO2 – carbon dioxide coastal carriers – Water carriers that provide service along coasts serving ports on the Atlantic or Pacific Oceans
or on the Gulf of Mexico. container on barge – a form of Intermodal freight transport where containers are stacked on a barge and towed
to its destination. container on flat car – the practice of moving truck or Oceanic containers by rail. collector road – a roadway that transfers traffic between larger (arterial) streets and local roads; provides less
highly developed level of service at a speed for shorter distances by collecting traffic from local roads and connecting them with arterials.
commercial land uses – areas of land that are generally used for commercial development. committed improvement – roadway improvement that has been approved and funded. commodities – Any article exchanged in trade, most commonly used to refer to raw materials and agricultural
products. common carrier – an individual or business that advertises to the public that it is available for hire to transport
people or property in exchange for a fee. Common carriers must serve, deliver, charge reasonable rates, and not discriminate.

Appendix A - Freight Glossary & Acronyms
70
Conrail – The Consolidated Rail Corporation – established by the Regional Reorganization Act of 1973 to operate the bankrupt Penn Central Railroad and other bankrupt railroads in the Northeast; the 4R Act of 1976 provided funding. Conrail is now a service provider for CSX Corporation and Norfolk Southern Corporations.
consolidation – collecting smaller shipments to form a larger quantity in order to realize lower transportation rates. constraint – A bottleneck, obstacle, or planned control that limits throughput or the utilization of capacity. container – steel boxes used internationally to transport freight by sea, rail, and highway; typically, 40 or 48 feet
long, eight feet tall and eight feet wide. containerization – the technique of using a boxlike device in which a number of packages are stored, protected,
and handled as a single unit in transit. contingency – in terms of dollar expenditures, an amount that is added to the total cost to account for unforeseen
costs. continuous welded rail – rail that has been welded into continuous lengths of a quarter mile or more. Sections of
track laid with such rail are easier to maintain and provide a smoother ride. courier service – A fast, doortodoor service for highvalued goods and documents; firms usually limit service to
shipments weighing fifty pounds or less. cross dock – operational activity transferring goods from one piece of transportation equipment to another (see
also transload). CRFC – Critical Rural Freight Corridor – These are public roads not in an urbanized area which provide access and
connection to the PHFS and the Interstate with other important ports, public transportation facilities, or other intermodal freight facilities.
CSA – Commercial Service Airport CSCMP – Council of Supply Chain Management Professionals CSXT – CSX Transportation – a Class I rail carrier that serves most markets east of the Mississippi River. CUFCs – Critical Urban Freight Corridors – These are public roads in urbanized areas which provide access and
connection to the PHFS and the Interstate with other ports, public transportation facilities, or other intermodal transportation facilities.
CV – commercial vehicle CVISN – Commercial Vehicle Information Systems and Networks – a key component of the Federal Motor Carrier
Safety Administration’s drive to improve commercial motor vehicle safety. CVISN supports FMCSA’s goals by focusing safety enforcement on highrisk operators; integrating systems to improve the accuracy, integrity, and verifiability of credentials; improving efficiency through electronic screening of commercial vehicles; and enabling online application and issuance of credentials.
CWA – Clean Water Act – passed in 1972, CWA is the cornerstone of surface water quality protection in the United States.
D
DCED – Department of Community and Economic Development deadhead – The return of an empty transportation container to its point of origin. See Backhaul. density – the concentration or intensity of something expressed as a rate relative to time or space. design criteria – a set of guidelines that direct the design and construction of the roadway.

Appendix A - Freight Glossary & Acronyms
71
design standards – a set of physical standards established by each state for highway design and construction. design year – a designated year, generally no less than 20 years after the expected construction of a project,
signifying the point in time at which the improvements will operate at their functional capacity. destination – The location designated as a receipt point for goods/shipment. discounted total savings – the projected future dollar savings that are due to a roadway improvement, shown in
current dollar value. distribution center (DC) – warehousing facilities used to receive, temporarily store, and redistribute goods for
distribution to wholesale, retail, or consumer locations. distribution channel – One or more companies or individuals who participate in the flow of goods and services
from the manufacturer to the final user or consumer. distribution warehouse – A finished goods warehouse from which a company assembles customer orders. DOT – Department of Transportation doublestack – railcars designed so that the containers may be stacked two high, enabling more containers per rail
car and shorter train lengths. double trailer combinations – one type of high performance vehicle with a tractor (engine) and two trailers. drayage carrier – the service offered by a motor carrier for transport of containers between modes or between a
mode and a shipper or receiver. Driving Time Regulations – U.S. Department of Transportation rules that limit the maximum time a driver may
drive in interstate commerce; the rules prescribe both daily and weekly maximums. Duty Free Zone (DFZ) – An area where goods or cargo can be stored without paying import customs duties while
awaiting manufacturing or future transport. DVRPC – Delaware Valley Regional Planning Commission
E
EIS – Environmental Impact Statement – Actions that would significantly affect the natural, cultural, and/or human environment require preparation of an Environmental Impact Statement (EIS). EIS projects tend to be complex projects with substantial impacts to a variety of environmental resources. An example of such an action would be a new limited access highway.
evaluation factor – a basis on which to compare two or more alternatives. exclusive use – vehicles that a carrier assigns to a specific shipper for its exclusive use. expressway – a multilane (typically four or more) highway with limited, controlled access and access points
consisting of intersections or interchanges.
F
FAST Act – Fixing America’s Surface Transportation Act – federal transportation bill provides longterm funding for surface transportation adopted in 2015
FAF – Freight Analysis Framework – a USDOT tool that integrates data from a variety of sources to estimate commodity flows and related freight transportation activity.

Appendix A - Freight Glossary & Acronyms
72
FAK – freight of all kinds – typically found in trailer on freight car (TOFC) service that provides a standardized rate base, regardless of National Motor Freight Class (NMFC) classification; charges are calculated on weight and distance traveled.
FARS – Fatality Analysis Reporting System – a census of fatal crashes of motor vehicles on a trafficway. It is generally considered to be the most reliable national crash database.
FAA – Federal Aviation Administration – The federal agency that administers federal safety regulations governing air transportation.
Federal Maritime Commission – Regulatory agency responsible for rates and practices of ocean carriers shipping to and from the United States.
FHWA – Federal Highway Administration field warehouse – a warehouse that stores goods on the goods owner’s property while the goods are under a bona
fide public warehouse manager’s custody. fFinal destination – The last stopping point for a shipment. first and last mile term used in supply chain management and transportation planning to describe the movement
of people and goods from a transportation hub to a final destination. flat car – a railcar without sides, used for hauling machinery. flatbed – a type of trailer without sides used in trucking operations to transport bulk goods, such as steel or
machinery. FMCSA – Federal Motor Carrier Safety Administration FMCSRs – Federal Motor Carrier Safety Regulations forced flow – a condition where the excessive number of vehicles on a roadway slows the free movement of traffic. FTZ Foreign Trade Zone – An area or zone set aside at or near a port or airport under the control of the US
Customs Service, for holding goods dutyfree pending Customs clearance. forgiving roadway – a roadway that includes design features to accommodate driver error. forhire – fleets that exist to move other people’s freight under contract. Common examples of these include
Schneider National, Conway, and UPS. freeflow conditions – a condition when the movement of traffic on a roadway is at a speed that should be
expected for the type of facility. freeway – a multilane (typically four or more) highway with access provided only at gradeseparated interchanges. freight – cargo being transported for commerce, manufacturing, or personal use, usually via commercial vehicles. freight carriers – Companies that haul freight, also called "forhire" carriers. Methods of transportation include
trucking, railroads, airlines, and sea borne shipping. freight class – determined by the National Motor Freight Traffic Association, the National Motor Freight Class
(NMFC) reflects the freight’s density, degree to which it is breakable, and the value; the higher the NMFC, the higher the freight charges.
freight corridor – a defined area containing multiple regional freight centers, multiple regional freight network routes, all of which are accessed to a single National Highway Network route. May cross multiple jurisdictional boundaries and regions.
freight economy – an interconnected network enabling the movement of food, energy, fabricated goods, and raw materials to keep citizens employed, communities healthy, and the nation competitive on a global scale. Together, these components make up the freight economy.

Appendix A - Freight Glossary & Acronyms
73
freight forwarder – an enterprise that provides services to facilitate the transport of shipments. freight fluidity – is a broad term referring to the characteristics of a multimodal freight network in a geographic
area of interest, where any number of specific modal data elements and performance measures are used to describe the network performance (including costs and resiliency) and quantity of freight moved (including commodity value) to inform decision making.
freight network – is the physical highways, railroads, airports, and waterways that exist primarily for the movement of freight but does not include the freight or freight carriers.
freight mobility – is the ability of goods to move freely on and between transportation facilities including highways, railroads, airports, and water. The transportation infrastructure connecting these modes comprise the multimodal freight network which sustains the economy from the national level down to each community and family.
fronthaul – The first leg of the truck trip that involves hauling a load or several loads to targeted destinations. functionally obsolete – a bridge that has inadequate deck geometry (e.g., too narrow), is improperly aligned with
the roadway, has insufficient vertical clearance, or has inadequate loadcarrying capacity.
G
GA airports – an airport having no regularly scheduled commercial air service Gathering Lines – Oil pipelines that bring oil from the oil well site, or well pad to storage areas. GDP – Gross Domestic Product – U.S. Bureau of Economic Analysis definitions of GDP and state GDP are provided
below: GDP by state is the state counterpart of the Nation’s GDP: GDP by state is derived as the sum of the GDP originating in all the industries in a state. The statistics of real GDP by state are prepared in chained (2005) dollars. Real GDP by state is an inflation–adjusted measure of each state’s gross product that is based on national prices for the goods and services produced within that state. The statistics of real GDP by state and of quantity indexes with a base year of 2005 were derived by applying national chain–type price indexes to the current–dollar GDP–by–state values for the 64 detailed NAICS–based industries for 1997 forward. Relation of GDP by state to U.S. Gross Domestic Product (GDP): An industry’s GDP by state, or its value added, in practice, is calculated as the sum of incomes earned by labor and capital and the costs incurred in the production of goods and services. That is, it includes the wages and salaries that workers earn, the income earned by individual or joint entrepreneurs as well as by corporations, and business taxes such as sales, property, and Federal excise taxes—that count as a business expense. GDP is calculated as the sum of what consumers, businesses, and government spend on final goods and services, plus investment and net foreign trade. In theory, incomes earned should equal what is spent, but due to different data sources, income earned, usually referred to as gross domestic income (GDI), does not always equal what is spent (GDP). The difference is referred to as the “statistical discrepancy.”
general purpose lanes – interstate highway lanes used by any type of legal, motorized vehicle. GeneralCommodities Carrier – A common motor carrier that has operating authority to transport general
commodities, or all commodities not listed as special commodities. geometric design – the design of a roadway where the horizontal and vertical components, expressed as line
segments and curves, are set to specific lengths and directions. GIS – Geographic Information System – a computerized system that integrates hardware, software and data to
capture, manage, analyze and display geographically referenced information.

Appendix A - Freight Glossary & Acronyms
74
grade – the degree of rise or descent of a surface typically expressed as a percent (change in elevation divided by change in length); in terms of transportation, the change in the longitudinal elevation of a roadway is expressed as a grade.
gradeseparated – a roadway or railway crossing which has an overpass or underpass. gross weight – the total weight of the vehicle and the payload of freight or passengers. gondola – A railcar with a flat platform and sides three to five feet high, used for top loading long, heavy items. goods – A term associated with more than one definition – 1) Common term indicating movable property,
merchandise, or wares. 2) All materials which are used to satisfy demands. 3) Whole or part of the cargo received from the shipper, including any equipment supplied by the shipper.
GPS – Global Positioning Navigation System – a satellite system that provides location, time, and routing information via GPS receivers.
GSP – Gross State Product – uses a formula similar to gross domestic product, but for only a single state. gross weight – The total weight of the vehicle and the payload of freight or passengers. GVWR – Gross Vehicle Weight Rating
H
HC – hydrocarbons hazardous goods – Articles or substances capable of posing a significant risk to health, safety, or property, and that
ordinarily require special attention when transported. Also called Dangerous Goods. hazardous material – A substance or material which the Department of Transportation hasdetermined to be
capable of posing a risk to health, safety, and property when stored or transported incommerce. HEC2 modeling – a water surface elevation computer model developed by the Hydraulic Engineering Center of the
U.S. Army Corps of Engineers. highway trust fund – a fund into which highway users (carriers and automobile operators) pay; the fund pays for
federal government’s highway construction share. HMRs – Hazardous Materials Regulations hopper cars – Railcars that permit top loading and bottom unloading of bulk commodities; some hopper cars have
permanent tops with hatches to provide protection against the elements. horizontal alignment or curve – the configuration of a roadway comprised of curves and straight sections. HOS – Hours of Service – regulation defining the measure of time an operator may operate a commercial vehicle
and specifying required breaks; the total number of hours worked in a period. HOT lanes – High Occupancy Toll lanes – lanes provided for uncongested right of way for vehicles by extracting a
fee for usage, on a per vehicle basis. HOV lanes – High Occupancy Vehicle lanes – lanes reserved for vehicles with a driver and one or more passengers. Hub – 1) A large retailer or manufacturer having many trading partners.
2) A reference for a transportation network as a "hub and spoke" which is common in the airline and trucking industry. For example, a hub airport serves as the focal point for the origin and termination of longdistance flights where flights from outlying areas are fed into the hub airport for connecting flights. 3) A common connection point for devices in a network.

Appendix A - Freight Glossary & Acronyms
75
4) A web "hub" is one of the initial names for what is now known as a "portal." It came from the creative idea of producing a web site which would contain many different "portal spots" (small boxes that looked like ads with links to different, yet related content). This content, combined with Internet technology, made the idea a milestone in the development and appearance of web sites, primarily due to the ability to display a lot of useful content and store one's preferred information on a secured server. The web term "hub" was replaced with portal. 5) An Internet web site that provides a central repository for data or a central planning capability in an industry or supply network.
hub airport – An airport that serves as the focal point for the origin and termination of longdistance flights; flights from outlying areas meet connecting flights at the hub airport.
HPMS – Highway Performance Monitoring System HPVs – High Productivity Vehicles – trucks that are able to carry more or heavier freight due to their design or
configuration.
I
igloos – Pallets and containers used in air transportation; the igloo shape fits the internal wall contours of a narrowbody airplane.
inbound freight flows – freight that originates outside a particular state or region and terminates in that state or region.
infrastructure – the underlying foundation for development; for example, a city’s water, sewer, or transportation systems.
inland carrier – an enterprise that offers overland service to or from a point of export. integrated carrier – An airfreight company that offers a blend of transportation services such as air carriage, freight
forwarding, and ground handling. interchange (rail) – the practice of exchanging rail cars between railroads when, for example, a rail car arrives in an
area on one railroad but is destined for a freight customer served by the other; or, the junction point where such practice is typically carried out.
Interchange (highway) – a road junction that typically uses grade separation, and one or more ramps, to permit traffic on at least one highway to pass through the junction without directly crossing any other traffic stream.
Interim National Multimodal Freight Network – Established by Federal Register Notice under 49 U.S.C. 70103. This network is to include the following: • the National Highway Freight Network that DOT establishes under the National Highway Freight Program
(23 U.S.C. 167); • the freight rail systems of Class I railroads; • U.S. public ports that have total annual foreign and domestic trade of at least 2 millionshort tons; • U.S. inland and intracoastal waterways; • the Great Lakes, the St. Lawrence Seaway, and coastal and ocean domestic freight routes; • the 50 U.S. airports with the highest annual landed weight; and • other strategic freight assets, including strategic intermodal facilities and other freight rail lines.

Appendix A - Freight Glossary & Acronyms
76
intermodal – freight that travels from origin to destination on more than one kind of transportation. intermodal connector – roads that provide access between major intermodal facilities and other elements of the
National Highway System. intermodal transfer facility – a facility where cargo is transferred from one mode of transportation to another,
usually between ship or truck and rail. internal flows – freight that originates and terminates within a particular municipality, county, state, or region.
Sometimes referred to as “intra” freight flow. IRI – International Roughness Index – a scale for the roughness of pavement as it is experienced by a vehicle. It is
calculated by measuring the vertical profile of a road, then processing the profile through an algorithm that simulates the response of a reference vehicle to the profile and accumulating the suspension movement of the vehicle.
intersection control – a mechanism used in controlling and/or directing traffic through an area where two roads converge; for example, traffic signals and left or rightturn lanes.
interstate commerce – the transportation of persons or property between states; commercial trade, business, movement of goods or money, or transportation from one state to another.
interstate system – The National System of Interstate and Defense Highways, 42,000 miles of fourlane, limitedaccess roads connecting major population centers.
interstate freeway – a freeway that traverses one or more than one state and is designated as part of the federal interstate system.
interstate standard – a set of criteria that must be met in the design and construction of an interstate freeway. ISTEA – Intermodal Surface Transportation Efficiency Act – legislation passed by the U.S. Congress in 1991 which
emphasizes enhancing a transportation system’s efficiency, monitoring and improving its performance, and ensuring that future investments reflect consideration of their economic, environmental, and qualityof life impacts.
ITS – Intelligent Transportation Systems – ITS encompass a broad range of wireless and landline communications, information, and electronics technologies or information processes used singly or in combination or that are integrated into the transportation system’s infrastructure and assist vehicles in relieving congestion, improving safety, and enhancing efficiency and productivity of a surface transportation system.
J
JIT – just‐in‐time delivery – a manufacturing strategy that minimizes inventory investment by scheduling delivery of raw materials or supplies to the point where they are needed, at the precise time required.
job year – the equivalent of one year of fulltime employment. jointed rail – rail laid in 39foot sections and bolted together, as opposed to being continuous welded. At the time
most railroad lines were originally built, the typical freight car was 40 feet long. Making the joints one foot shorter and staggering them resulted in the smoothest ride.
justintime inventory system – a manufacturing strategy that minimizes inventory investment by scheduling delivery of raw materials or supplies to the point where they are needed, at the precise time required.

Appendix A - Freight Glossary & Acronyms
77
L
land use – the categorization of land according to its use; for example, commercial or recreational. LCV – Long Combination Vehicle – freight carriers made up of more than two trailers and/or carriers over 90 feet
in length. lead time – the total time that elapses between an order’s placement and its receipt. less than carload – less than carload rail service. linehaul carriers – rail carriers that predominately move freight long distances between terminals. link – term used by planners to define the individual roadway alignments within a segment. LNG – Liquefied Natural Gas local (rail) – a train operating usually within a division, or over a short distance. The purpose of the local is to
provide direct access to the freight customers served as opposed to the rapid movement of freight over a longer distance.
local freight generator – a defined area identified by County or Local Planners to have locally significant freight activity and is not already identified as a Regional Freight Center. May include multimodal/intermodal facilities for rail, port, or airport activity.
local freight network – Highways which connect the primary and regional freight network to one or more freight generators.
local road – consists of all roads not defined as arterials or collectors; primarily provides access to land with little or no through movement.
logistics – the process of planning, implementing, and controlling procedures for the efficient and effective storage of goods, services, and related information from the point of origin to the point of consumption for the purpose of conforming to customer requirements. This definition includes inbound, outbound, internal, and external movements.
LOS – Level of Service – a measure of a highway’s ability to serve a specific volume of traffic, defined by letters A through F.
LRTP – Long Range Transportation Plan – a long range (typically 20 or more years) plan developed to guide the effective investment of public funds in multimodal transportation facilities.
LTL – Less Than Truckload – describes carriers who consolidate many smaller shipments from multiple shippers located in a common area or region, sort them at dock facilities according to common designation, and then line haul trailers to a destination dock for delivery. Shipment size is typically 70 to 20,000 pounds.
M
major carrier – A forhire certificated air carrier that has annual operating revenues of $1 billion or more; the carrier usually operates between major population centers.
MAP21 – Moving Ahead for Progress in the 21st Century – federal transportation bill adopted on July 6, 2012 and has been superseded by the FAST Act.
MCMIS – Motor Carrier Management Information System – information on the safety fitness of commercial motor carriers and hazardous material shippers subject to the Federal Motor Carrier Safety Regulations and the Hazardous Materials Regulations. MCMIS is a collection of safety information including statereported crashes, compliance review and roadside inspections results, enforcement data, and motor carrier census data.

Appendix A - Freight Glossary & Acronyms
78
MEC Network – Multimodal Economic Competitiveness Network – a network of the state’s most strategic transportation facilities comprising part of the framework for the project prioritization process.
meet (rail) – the location where two trains are scheduled to meet one another. If on single track, one train will be instructed to wait in the siding for the other.
metric – measure utilized to gauge performance, efficiency, or rate, as in “metric based organization.” mileage rate – a rate based upon the number of miles the commodity is shipped. minimize impact – the act of decreasing the negative effects of a particular action. MIS – Major Investment Study – an evaluation, usually conducted in an urban area, to identify needs for public or
quasipublic investments (for example, related to public transportation) and strategies to address those needs. mitigation – measures taken to eliminate or reduce the effects of a problem. MOA – Memorandum of Agreement – a document of agreement between different reviewing government agencies
that stipulates the responsibilities and procedures to be undertaken with regard to a particular issue or element.
mobility provider – transportation facility (road, highway, or bus route) that allows people to travel from one point to another.
MOE – Measures of Effectiveness – a group of factors that evaluate transportation components such as vehicle miles traveled, vehicle hours traveled, average speed, accident cost, travel cost, etc.
mosaic – in transportation, an aerial photograph of a land surface. MPO – Metropolitan Planning Organization – an organization that oversees the development of an urban area;
similar to a regional planning commission. multimodal – involving more than one form of transportation. multiple regression equation – an equation that contains multiple variables to determine a bestfit solution for a
given number of cases.
N
NAICS – North American Industry Classification System – a numerical coding system adopted by the U.S. Census Bureau in 1997. It replaces the 1987 Standard Industrial Classification system.
NAAQS – National Ambient Air Quality Standards – criteria for measuring pollutants in the air, ambient air meaning the general conditions over an area.
national carrier – A forhire certificated air carrier that has annual operating revenues of $75 million to $1 billion; the carrier usually operates between major population centers and areas of lesser population.
National Industrial Transportation League – An association representing shippers' and receivers' interests in matters of transportation policy and regulation.
National Multimodal Freight Network – The FAST Act directs DOT to establish a National Multimodal Freight Network to: • assist States in strategically directing resources toward improved system performance for the efficient
movement of freight on the Network; • inform freight transportation planning; • assist in the prioritization of Federal investment; and

Appendix A - Freight Glossary & Acronyms
79
• assess and support Federal investments to achieve the goals of the National Multimodal Freight Policy established in 49 U.S.C. 70101 and of the National Highway Freight Program described in 23 U.S.C. 167.
When designating the final Network, the DOT must solicit input from stakeholders, including multimodal freight system users, transportation providers, MPOs, local governments, ports, airports, railroads, and States through a public process.
National Railroad Corporation – Also known as Amtrak, the corporation established by the Rail Passenger Service Act of 1970 to operate most of the United States' rail passenger service.
NEPA – National Environmental Policy Act – federal regulations which define the process of evaluating the possible impacts of federally funded projects, including transportation projects.
net weight – The weight of the merchandise, unpacked, exclusive of any containers. NFN – National Freight Network – called for in MAP21 and to include the Primary Freight Network, interstate
highways not in the Primary Freight Network, and Critical Rural Freight Corridors. NHFN – National Highway Freight Network – includes the following subsystems of roadways
• Primary Highway Freight System (PHFS) • Other Interstate portions not on the PHFS • Critical Rural Freight Corridors (CRFCs) • Critical Urban Freight Corridors (CUFCs)
NHS – National Highway System NHTSA – National Highway Traffic Safety Administration NOx – nitrogen oxide NS – Norfolk Southern Railway – a Class I rail carrier that serves most markets east of the Mississippi River.
O
OD – Origin‐Destination – the beginning and ending location of a trip. O&M cost – Operations and Maintenance costs – the costs involved in operating and maintaining a highway. ocean port intermodal terminal – one of three general types of intermodal terminals serving container traffic
at ports: • OnDock:
F a rail to ship transfer facility at the marine terminal that eliminates the need to transfer F containers by truck on city streets
• NearDock: F typically located within a few miles of port terminals; transfer between rail and ship requires a truck move
and additional container lifts. This type of terminal has the advantage of serving multiple ocean carriers • Inland Port or Satellite:
F located away from the port. Most advantageous if shuttle trains operate between the inland terminal and port facilities to avoid port traffic congestion.
origin – The place where a shipment begins its movement. OS&D – Overage, Shortage, and Damage

Appendix A - Freight Glossary & Acronyms
80
Other Interstate portions not on the PHFS – These highways consist of the remaining portion of Interstate roads not included in the PHFS. These routes provide important continuity and access to freight transportation facilities. These portions amount to an estimated 9,511 centerline miles of Interstate, nationwide, and will fluctuate with additions and deletions to the Interstate Highway System.
outbound freight flows – freight that originates in particular state or region and terminates outside of that state or region.
overhead flows – freight traffic volumes that originate and terminate beyond the borders of a state or region, but that use transportation infrastructure of the state or region during transit. See through freight flows.
overtheroad – a motor carrier operation that reflects longdistance moves.
P
PAAC – Port Authority of Allegheny County – Provides public transportation throughout Pittsburgh and Allegheny County.
P3 PPP – Public‐Private Partnership – a venture which is funded and operated through a partnership between a governmental agency and one or more private sector companies.
partiallyfolded diamond – an interchange configuration consisting of one loop ramp and three standard ramps. PennDOT – The Pennsylvania Department of Transportation perennial stream (wetland) – a stream that has measurable flow of water all year long. PFN – Primary Freight Network – called for in MAP21 PHFS – Primary Highway Freight System – a network of highways identified as the most critical highway portions of
the U.S. freight transportation system determined by measurable and objective national data. The network consists of 41,518 centerlines miles, including 37,436 centerline miles of Interstate and 4,082 centerline miles of nonInterstate roads.
physiography – the study of the physical characteristics of an area’s natural features. piggyback – Terminology used to describe a truck trailer being transported on a railroad flatcar. planning partners – in Pennsylvania: the MPOs and RPOs in the state. port – A harbor where ships will anchor. port authority – A state or local government that owns, operates, or otherwise provides wharf, dock, and other
terminal investments at ports. power unit – the engine and operational component of a truck or vehicle. PPP – see P3. preferred alternative – based on the evaluation of the alternatives and their impacts, the option for transportation
improvements recommended in an environmental document. PREP regions – Partnership for Regional Economic Performance regions – Pennsylvania has established ten PREP
regions to focus on economic growth and development. private carriers – private carrier fleets are operated by businesses whose primary function is something other than
transportation, including manufacturers, distributors, retailers, and other businesses operating trucks as an internal valueadded function primarily to meet their own business shipping needs.
private fleets – shippers who use their own trucks (at least some of the time). The bigger the “shipper” the more likely they use both forhire trucks and private trucks. For example, Walmart uses Walmart owned trucks for freight movement and also hires Schneider National and others to move some of their freight.

Appendix A - Freight Glossary & Acronyms
81
profile – a side or elevation view of a road. PRPA – Philadelphia Regional Port Authority – an independent agency of the Commonwealth of Pennsylvania
charged with the management, maintenance, marketing, and promotion of port facilities along the Delaware River in Pennsylvania, as well as strategic planning throughout the port district.
PublicPrivate Partnership – see P3.
Q
queue or queues – a row of people or things waiting for a turn at something or for admittance. quick response – a method of maximizing the efficiency of the supply chain by reducing inventory investment.
R
rail weight reference – weights of rail are expressed in weight per yard of length. Thus 136pound rail weighs 136 pounds per yard.
RCRA – Resource Conservation and Recovery Act – legislation for the management of hazardous waste sites. recharge – the process of surface water replenishing the subsurface groundwater supply system also referred to
as losing stream. recovery area – the area of a roadway provided to help drivers regain control of their vehicle. red flag – a major environmental, historic, community, or other feature that represents a resource that cannot be
or would be financially excessive to avoid or mitigate for, creating a significant challenge to project implementation.
reefer – a container with a selfcontained refrigeration unit, used for the transportation of perishable cargo. Refrigerated Carriers – Truckload carriers designed to keep perishables good refrigerated. The food industry
typically uses this type of carrier. Regional Freight Center – an area identified by the planning partner to have regionally significant and freight
activity, multiple freight facilities and is in close proximity to the Regional Fright Network. It may include multimodal/intermodal facilities for rail, port, or airport activity.
Regional Freight Network – Highways which connect the National Highway Freight Network to freight centers, and the local freight network. Includes candidate CUFC/CRFC highways.
regional highway – a highway that serves and connects several communities in a state, county, or economic area. regulatory stream – a stream that is regulated under the provisions of the Clean Water Act, Section 404 permitting
process (see Section 404 of the Clean Water Act). Reliability – is the degree of variance experienced in the actual travel times compared to the expected travel times
of shipment. Variances in travel times arise due to capacity, congestion, and traffic incidents. relay terminal – a motor carrier terminal that facilitates the substitution of one driver for another who has driven
the maximum hours permitted. retail – the sale of goods or articles directly to the customer. reverse logistics – focus on logistical needs and requirements after the final transport to the consumer, typically as
returns for repair and return for credit. RFID – Radio Frequency Identification

Appendix A - Freight Glossary & Acronyms
82
RFP – There are two common meanings for this abbreviation. 1) Reginal Fright Plan – Used in this document, 2) Request for proposal.
ROW – RightofWay – the property needed for the construction of a roadway. RoRo – Roll‐on, Roll‐off – type of ship allowing for cargo to be driven or wheeled on and off the vessel; typically
used for the movement of automobiles and large wheeled or tracked machinery. roadway deficiencies – elements of a roadway that do not meet current state or federal design standards. roadway design feature – design characteristics of a roadway. roadway line – the straight part of a roadway alignment. Rocky Mountain double – one type of HPV with a tractor (engine) and two trailers, one 48 feet long and the other
28 feet long.
ROD – Record of Decision – a document that states the government’s decision to either continue a highway improvement project into design or to postpone the improvement. This document is executed upon the completion of the EIS and provides the authority for federal funds to be utilized in the construction of the improvements.
roundabout – a type of intersection control where traffic enters a oneway stream around a central island, yielding to the traffic already within the roundabout.
ROI – Return on Investment RPC – Regional PlanningCommission – a body or group, typically enabled through state laws, concerned with the
economic and development planning of a geographic region. RPO – Rural Planning Organizations – the rural counterpart to the Metropolitan Planning Organizations.
S
SAFETEALU – Safe, Accountable, Flexible, Efficient Transportation Equity Act: A Legacy for Users – federal legislation signed in 2005 to provide funding for highways, highway safety, and public transportation.
scoping – the process of gathering information about a project’s important issues. secondary impact – impacts which result from actions caused or influenced by the project; an example would be
impacts caused by new development induced by the project. Section 106 – a review process under the National Historic Preservation Act. It requires federal agencies to take
into account the effects of their projects on historic properties and afford the Advisory Council on Historic Preservation a reasonable opportunity to comment on the project prior to taking action to implement it.
Section 4(f) – a federal procedure for reviewing projects which may affect a public park, wildlife refuge, or historic site. The report produced is referred to as the Section 4(f) evaluation. The FHWA may not approve the use of land from a significant publicly owned park or recreation area, wildlife or waterfowl refuge, or any significant historic site unless there is no feasible and prudent alternative to the use of land from the property and the project includes all possible planning to minimize harm to the property resulting from the project.
Section 404 of the Clean Water Act – a program which regulates the discharge of dredged or fill material into waters of the United States, including wetlands.
Section 404 permit – required before dredged or fill material may be discharged into waters of the United States, unless the activity is exempt from Section 404 regulation.

Appendix A - Freight Glossary & Acronyms
83
selected alternative – the chosen option for improvements after public review of recommendations within an EIS or other public document at an official hearing.
SEPTA – Southeastern Pennsylvania Transportation Authority – Provides public transportation for Bucks, Chester, Delaware, Montgomery, and Philadelphia Counties.
shadow bid – a risk adjusted estimate of a project’s costs and benefits to be developed as if the project were delivered as a P3. It includes the best estimate of full life cycle costs, benefits, and risks over the contract term.
shippers – entities whose core business model is to make, own, and/or sell goods, and secondarily rely on trucks to move their goods. Common examples include Procter & Gamble, Walmart, 3M, Exxon Mobil, and Hallmark. In some instances, these shippers contract with forhire motor carriers to move their goods, and sometimes they own or use their own trucks (private trucks or private fleets).
shipping lane – In general transportation, the logical route between the point of shipment and the point of delivery used to analyze the volume of shipment between two points. A predetermined, mapped route on the ocean that commercial vessels tend to follow between ports. This helps ships avoid hazardous areas.
short line railroad – an independently operated branch line that connects a Class I railroad with another short line or customers.
SIB – State Infrastructure Bank program – a funding program established as part of the Intermodal Surface Transportation Efficiency Act of 1991.
SIC – Standard Industry Classification – a U.S. Census Bureau coding system replaced by NAICS. siding – a short section of railroad track parallel to the main line and connected to the main line by switches to
allow one train to wait for and be passed by another, or exists as a "ramp" to an adjacent business to facilitate the movement of rail cars to / from that business.
SEIS – Supplemental Environmental Impact Statement – a document that helps fulfill the National Environmental Policy Act of 1969, which requires that before design and construction of federally funded or permitted projects, proposed projects must be evaluated in terms of their impacts to both the natural and manmade environment. The SEIS typically adds or amends information presented in an earlier EIS.
signalized intersection control – traffic light used to direct and control traffic where two roads come together. single unit trucks – trucks with the tractor (engine) and van, tank, or hopper attached to the same frame. slip ramp – a diagonal ramp connecting parallel roads typically traveling in the same direction. socioeconomic data – demographic data relating to the social environment. solid waste transfer station – a station that receives garbage for transfer to the disposal site. SPC – Southwestern Pennsylvania Commission – is the MPO serving the Pittsburgh 10county area and providing
essential services to the region. specialized carrier – motor carriers who transport specific types of goods including construction and military
materials, oversize or overweight items, and hazardous materials. spot (rail) – the act of placing a carload at a freight customer’s location for loading or unloading, or the location
itself. spring switch – a switch that is springloaded so that a train may trail through it in either direction. On short
stretches of double track in unsignaled territory, pairs of spring switches are used to direct each train to the “right” regardless of its direction.

Appendix A - Freight Glossary & Acronyms
84
STAA The Surface Transportation Assistance Act of 1982 – allows large trucks to operate on the Interstate and certain primary routes called collectively the National Network. STAADimensional vehicles are those currently specified as the federal maximum allowable lengths (i.e., 53 foot trailers, twin 28 foot trailers, etc.). Most state DOTs have ceased labelling their routes as STAA highways, since all of their state facilities are approved to accommodate the federal maximum lengths. An MPO may want to do this however, since many local routes may not have the appropriate dimensions to accommodate the full extent of federally approved truck lengths. The term “STAA Routes” has been used very little for many years. As such, many younger commercial drivers may not understand it.
stabilized shoulders – roadway shoulders that are made of asphalt or concrete and not of gravel. stakeholder – People who represent the organizations, economic development groups, chambers of commerce,
businesses, transportation operators, authorities, governments, and local leaders who have live and work in the region and have a vested interest in freight mobility.
stevedoring – one who is employed loading or unloading ships. STIC – State Transportation Innovation Council – in Pennsylvania STIP – StatewideTransportation Improvement Program – a list of federallyfunded transportation projects that are
located outside metropolitan planning organization (MPO) boundaries. In Pennsylvania the STIP includes the compilation of regional TIPs plus the Wayne County projects.
straight truck – Straight trucks do not have a separate tractor and trailer. The driving compartment, engine and trailer are one unit.
structurally deficient – a bridge that has identified structural weaknesses or inadequate waterway. supply chain – a group of physical entities such as manufacturing plants, distribution centers, conveyances, retail
outlets, people, and information which are linked together through processes (such as procurement or logistics) in an integrated fashion to supply goods or services from source through consumption.
switch engine – a railroad engine that is used to move railcars short distances within a terminal and plant. switcher – utilized to move trailers within a terminal or facility’s yard; also known as a hostler or yard mule.
T
TAC – Pennsylvania’s Transportation Advisory Committee tandem – a truck that has two drive axles or a trailer that has two axles. tangent – in a roadway description, the straight area that connects two consecutive curves. tare weight – the weight of the vehicle when it is empty or the packaging surrounding or beneath a shipment of
goods. Tariff – A tax assessed by a government on goods entering or leaving a country. The term is also used in
transportation in reference to the fees and rules applied by a carrier for its services. TAZ – Traffic Analysis Zone – a geographical unit used to represent homogeneous employment, population, and
travel characteristics within a certain area. TEA21 – Transportation Equity Act for the 21st Century – was enacted June 9, 1998 as Public Law 105178. TEA21
authorizes the Federal surface transportation programs for highways, highway safety, and transit for the 6year period 19982003.
TEUs – Twenty‐foot Equivalent Units – a measure of container traffic. TFAC – Pennsylvania’s Transportation Funding Advisory Committee

Appendix A - Freight Glossary & Acronyms
85
theoretical capacity – the calculated or unproven amount of traffic that an arterial roadway can maintain in a given period of time.
through freight flows – freight traffic volumes that originate and terminate beyond the borders of a state or region, but that use transportation infrastructure of the state or region during transit.
through lane – a lane of a roadway that is intended for traffic that does not turn or exit. through trip – a trip from one point to another that does not stop in a given area. TIF – Tax Increment Financing – allows a community to capture, for a specific period of time, the tax revenues
generated from the increased values of properties within an established district. TIFIA – Transportation Infrastructure Finance and Innovation Act – a program that provides federal credit assistance
in the form of direct loans, loan guarantees, and standby lines of credit to finance surface transportation projects of national and regional significance.
TIGER Discretionary Grants – Transportation Investments Generating Economic Recovery – a grant program established as part of the American Recovery and Reinvestment Act of 2009.
TIP – Transportation Improvement Program – a list of approved, shortrange capital improvement projects for regional highway, transit and bike and pedestrian projects.
TL – truckload TOFC – Trailer on a Flat Car – a common type of intermodal freight. A specialized form of containerization in which
motor and rail transport coordinate. Synonym – Piggyback. TOL – Truckonly Lane – dedicated highway lane for heavy truck usage that is physically separated from the general
purpose lanes of a highway. toll – a user fee paid for use of a transportation system. tonmile – a freight transportation output measure that reflects the shipment’s weight and the distance the carrier
hauls it. topographic data – information related to the surface features of a region such as rivers, lakes, canals, or bridges. topography – surface features of a region such as rivers, mountains, and lakes. tractor – The tractor is the driver compartment and engine of the truck. It has two or three axles. trailer – The part of the truck that carries the goods. trailer drops – When a driver drops off a full truck at a warehouse and picks up an empty one. transload(ing) – the practice of transferring product between truck and rail transportation. In most instances, a
transload facility operator, thirdparty logistics company, or broker facilitates transloading for both the shipper and the consignee; operations where contents are transferred between ocean containers and, typically, 53foot trailers or domestic containers for movement beyond the immediate port area.
transportation cost savings – the amount of total monies saved through improved system operations (travel distance, travel time, and accidents).
transportation network – the entire group of transportation facilities including roadways, rail lines, airports, ports and waterways, intermodal facilities, and pedestrian and bicycle facilities included in the study area.
Transportation Mode – The method of transportation – land, sea, or air shipment. tripletrailer combination – one type of HPV with a tractor (engine) and three 28 or 28.5foot trailers. Not allowed
in all states. trucker – used in conversations and informal materials to describe any entity in the trucking industry. Trucking
company, motor carrier, or truck fleet are usually used to describe the corporate trucking entity.

Appendix A - Freight Glossary & Acronyms
86
truck driver – the more technical term for the person behind the wheel; can be an employee driver, an owneroperator who owns their own truck, or an independent contractor who is essentially an owneroperator without their own truck and uses a company truck instead.
truckload carrier – the motor carrier segment which generally does not operate across a regular route, but rather delivers shipments directly to recipients; these carriers also seek back haul shipments.
trucksemitrailer combination – one type of truck with a tractor (engine) and one 38 to 53foot trailer. trucktrailer combinations – trucks with the tractor (engine) and van, tank, or hopper attached to the same frame
and one 28 to 48foot trailer. TSM – Transportation Systems Management – measures taken to improve the operations or efficiencies of a
transportation system, usually smallscale improvements that focus on improving existing systems such as traffic signals or changes in access.
travel demand modeling – a computer model procedure that projects the future traffic volumes on the transportation network.
turnpike double – one type of HPV with a tractor (engine) and two 48foot trailers. turntable (rail) – a short stretch of rail track which is rotated to connect a locomotive with one or more other tracks
to redirect the locomotive into a storage space or a maintenance area. TWC – Track Warrant Control – a train movement system in which all train movements are governed by oral and/or
written instructions issued by the dispatcher, often by radio.
U
uneconomical remnants – the land remaining after rightofway acquisition that has less than optimal or only minimal utility for certain activities, such as a very small portion of farmland.
UP – Union Pacific Railroad – the largest railroad in North America, covering 23 states across twothirds of the United States.
urban arterial roadway – street in an urban area that provides a primary route for through traffic. USACE – United StatesArmy Corps of Engineers USDOT – United States Department of Transportation USEPA – United States Environmental Protection Agency USFWS – United States Fish and Wildlife Service USGS – United States Geological Survey
V
V2I – Vehicle‐to‐Infrastructure – a type of autonomous vehicle technology V2V – Vehicle‐to‐Vehicle – a type of autonomous vehicle technology vertical alignment or curve – the configuration of a roadway comprised of changes in the slope or elevation. VHT – Vehicle Hours of Travel – a measure of the amount of time vehicles are on the road on a daily basis within a
transportation network; in computerized traffic modeling, this measure is calculated by summing the travel time made by each vehicle trip in the transportation network.

Appendix A - Freight Glossary & Acronyms
87
VMT – Vehicle Miles of Travel – a measure of the aggregated distances vehicles travel between their origin and destination on a daily basis within a transportation network; in computerized traffic modeling, this measure is calculated by summing the travel distances made by each vehicle trip in the transportation network.
W
Warehouse – Storage place for products. Principal warehouse activities include receipt of product, storage, shipment, and order picking.
weight break – the shipment volume at which the LTL (less than truckload) charges equal the TL (truckload) charges at the minimum weight.

88
Appendix B - Data Resources & Analysis
APPENDIXDATA RESOURCES
AND ANALYSIS

Appendix B - Data Resources & Analysis
89
I95 Corridor Coalition – https://i95coalition.org/ –The I95 Corridor Coalition is a partnership of transportation agencies, toll authorities, public safety, and related organizations, from the State of Maine to the State of Florida, with affiliate members in Canada. The Coalition provides a forum for key decision makers to address transportation management and operations issues of common interest. This volunteer, consensusdriven organization enables its myriad state, local and regional member agencies to work together to improve transportation system performance far more than they could working individually. The Coalition has successfully served as a model for multi state/jurisdictional interagency cooperation and coordination for over two decades. The Coalition has undertaken numerous national studies including Freight Supply Chain Performance, Truck Parking, and most recently Mileage Based User Fees. Freight Academy (Freight Bootcamp) – https://freightacademy.org/ – An Immersion Program for Public Sector Transportation Professionals, Sponsored by the I95 Corridor Coalition, this weeklong immersion program is designed to efficiently train public sector agency staff involved in planning, operational, and/or management work that impact goods movement decisions, investments and interactions. This freight academy is typically held every other year. FHWA Office of Freight Management and Operations – https://ops.fhwa.dot.gov/freight/ – The Office of Freight Management and Operations works to improve goods movement on the U.S. transportation system and across our borders. To advance this mission, the Office administers programs and activities including:
• National Freight Program implementation • Funding Programs • Freight Data and Analysis • Freight Planning, Program Development, and Partnerships • Research • Vehicle Size and Weight Regulatory Requirements
Together, these activities and more support public and private actions that are improving goods movement in the US, as well as greater understanding of freight transportation issues and trends; fostering of public/private partnerships and engagement; and education and training of freight transportation professionals. Established in 1999, the Office of Freight Management and Operations is part of the Federal Highway Administration's Office of Operations. Some additional noteworthy resources and programs that FHWA has in the above website is:
• Talking Freight Seminars The seminars are part of a broader Freight Professional Development Program aimed at providing technical assistance, training, tools, and information to help the freight and planning workforce meet the transportation challenges of tomorrow. Seminars are held via web conference on a monthly basis throughout the year and are open at no cost to all interested parties in both the public and private sectors.
• Educational course links under the Professional Development. • PeertoPeer Program – This program puts public sector freight transportation professionals in touch with
experts in the field and provides technical assistance in order to enhance overall freight skills and knowledge. The program is available to public entities, including State Departments of Transportation (DOTs) and Metropolitan Planning Organizations (MPOs).
The FHWA office of Freight Management and Operations is a good to come back to periodically to check on the current Featured articles, current news, and upcoming events that will help with more affectively freight movement planning in your region.

Appendix B - Data Resources & Analysis
90
FHWA Freight Planning Web Site – https://www.fhwa.dot.gov/planning/freight_planning/ – The Freight Planning web site has been jointly developed by the FHWA Offices of Planning and Freight Management & Operations. Though a lot of the information provided is similar to what is provided in the Office of Freight Management and Operation’s web side, this site presents the information targeted more to the planning prosses and has a few more planning resources available. It is worth reviewing the training section as well as some training are free. FHWA Transportation Planning Capacity Building – https://www.planning.dot.gov/default.asp – The Transportation Planning Capacity Building (TPCB) Program is designed to help decision makers, transportation officials, and staff resolve the increasingly complex issues they face when addressing transportation needs in their communities. This comprehensive program for training, technical assistance, and support targets State, local, regional, and Tribal governments, transit operators, and community leaders. This program is targeted more to general surface transportation planning, but there are good resources that can be carried over to the planning for freight movement. This program has a peer learning program, a Scenario Planning Program, and resources in some focus areas that cover most of the current hot topics in transportation planning. PennDOT Rail Freight Assistance Program – https://www.penndot.gov/DoingBusiness/RailFreightAndPorts/Pages/GrantsandLoans.aspx – The Rail Freight Assistance Program (RFAP) provides financial assistance for investment in rail freight infrastructure. Keystone State Railroad Association (KSRRA) – http://www.ksrra.com – a railroad industry group that represents many major freight carriers and short lines, nonoperating railroad owners, and associate members who operate or do business in the Commonwealth of Pennsylvania. American Transportation Research Institute (ATRI) – www.truckingresearch.org ATRI’s primary mission is to conduct transportation research, with an emphasis on the trucking industry’s essential role in a safe, efficient and viable transportation system. ATRI’s research focus includes: Congestion and Mobility; Economic Analysis; Safety and Security; Technology and Operations; Environment; and Transportation Infrastructure. ATRI’s extensive experience covers a broad range of commercial vehicle operations including leadership and/or participation in numerous national freight analyses, technology research initiatives and field operational tests. ATRI presently manages the U.S. DOT’s Freight Mobility Program, and has provided FPM technical assistance to 31 state DOTs and 11 of the 15 largest MPOs in the U.S. ATRI has received top research awards from ITS America, TIDA, University of Minnesota and the Institute of Transportation Engineers. The Transportation Research Board (TRB) https://www.nationalacademies.org/trb/transportationresearchboard provides innovative, researchbased solutions to improve transportation. TRB is a program unit of the National Academy of Sciences, Engineering and Medicine, a nonprofit organization that provides independent, objective, and interdisciplinary solutions. TRB manages transportation research by producing publications and online resources. It convenes experts that help to develop solutions to problems and issues facing transportation professionals. TRB also provides advice through its policy studies that tackle complex and often controversial issues of national significance. TRB is powered by volunteers, learn how to connect with TRB to find out about new research and volunteer opportunities.
Appendix B - Data Resources & Analysis
91
USDOT, Bureau of Transportation Statistics – www.bts.gov the Bureau of Transportation Statistics (BTS), part of the Department of Transportation (DOT) is the preeminent source of statistics on commercial aviation, multimodal freight activity, and transportation economics, and provides context to decision makers and the public for understanding statistics on transportation. BTS assures the credibility of its products and services through rigorous analysis, transparent data quality, and independence from political influence. BTS promotes innovative methods of data collection, analysis, visualization, and dissemination to improve operational efficiency, to examine emerging topics, and to create relevant and timely information products that foster understanding of transportation and its transformational role in society. The Bureau’s National Transportation Library (NTL) is the permanent, publicly accessible home for research publications from throughout the transportation community; the gateway to all DOT data; and the help line for the Congress, researchers, and the public for information about transportation. The BTS Director is by law the senior advisor to the Secretary of Transportation on data and statistics. Urban Freight Lab http://depts.washington.edu/sctlctr/urbanfreightlab0. The Urban Freight Lab, housed at the Supply Chain Transportation and Logistics Center at the University of Washington, is an innovative partnership bringing together private industry, academic researchers, and public transportation agencies. The Urban Freight Lab works to develop highimpact, lowcost solutions for businesses delivering goods in urban settings and cities trying to manage limited curb and parking space where delivery trucks, bicycles, pedestrians, and cars all need to coexist.

92
Appendix C - Citations
APPENDIXCITATIONS

Appendix C - Citations
93
Author, A. A., & Author, B. B. (Year). Title of article. Title of Journal, volume number, page range.
Author, A. A., & Author, B. B. (Year). Title of article. Title of Journal, volume number, page range. http://www.journalhomepage.com/full/url/
• Steele, C. W., Hodge, D., Halcrow, Inc., Fitzgerald & Halliday, Inc., & Resource Systems Group, Inc. (2011). Freight Facility Location Selection: A Guide for Public Officials. NCFRP, Report 13.
• Pennsylvania Department of Transportation. (2016). 2015 Pennsylvania State Rail Plan. Pennsylvania State Rail Plan.
• Federal Highway Administration, DOT. (2015). Buy America Waiver Notification. Federal Register, Vol. 80, No. 205.
• Boris, C., & Murray. D. (2018). Identifying State Freight Plan Best Practices. • Rayman, C. H. (2016). Fostering America’s Freight Economy. Federal Highway Administration Research and
Technology, Vol. 80 No. 1. https://www.fhwa.dot.gov/publications/ publicroads/16julaug/01.cfm • Conway, A., Williamson, J., Gjorgjievska, M., Chen, Q., Prasad, L., Xing, C., Peters, D., Hodge, S., Mammes, N.,
& Klatsky, M. (2018). Complete Streets Considerations for Freight and Emergency Vehicle Operations. NYSERDA Project 83178.
• Pennsylvania Department of Transportation. (2018). Eastern Pennsylvania Freight Summit 2018 Program Summary.
• U.S. Department of Transportation Federal Highway Administration. (2020). Comparison of Actual FY 2015 Apportionments Under the Highway and Transportation Funding Act of 2014, As Amended, and Estimated FY 2016 – FY 2020 Apportionments Under the Fixing America’s Surface Transportation (FAST) Act.
• Office of the Secretary of Transportation, Federal Aviation Administration, Federal Highway Administration, Federal Motor Carrier Safety Administration, Federal Railroad Administration, Maritime Administration, Pipeline and Hazardous Materials Safety Administration, Saint Lawrence Seaway Development Corporation, U.S. Department of Transportation. (2016). Guidance on State Freight Plans and State Freight Advisory Committees. Federal Register, Vol. 81, No. 199.
• Chao, E. L., Rosen, J., Hu, P., & Schmitt, R. (2017). Freight Facts and Figures. • U.S. Department of Transportation Federal Highway Administration. (2017). Freight Reliability Measure.
Transportation Performance Management. • U.S. Department of Transportation Federal Highway Administration. (2017). User Guide. MPO Freight
Program Assessment. • U.S. Department of Transportation Federal Highway Administration. (2012). FHWA Freight and Land Use
Handbook. • Souleyrette, R., Maze, T. H., Strauss, T., Preissig, D., & Smadi, A. G. (1998). Freight Planning Typology.
Transportation Research Record 1613. • Michael Baker International, Inc. (2017). Regional Freight Plan. Harrisburg Area Transportation Study. • Intermodal Association of North America. (2017). Intermodal Factbook: An Introduction to Intermodal
Freight Transportation. • CDM Smith, & Lehigh Valley Planning Commission. (2015). Move Lehigh Valley: Lehigh Valley Regional
Freight Plan.
Appendix C - Citations
94
• Parker, M. (2015). Measuring Supply Chains for Freight Fluidity From a Corridor Perspective: Reflections from I95 Corridor Coalition Freight Fluidity Measures Pilot Project. TRB Workshop – Advancing Freight Fluidity Performance Measures.
• U.S. Department of Transportation Federal Highway Administration. (2019). Advance Notification of Federal‐Aid Highway Funds to Be Apportioned on October 1, 2019.
• Rhodes, S. S., Berndt, M., Bingham, P., Bryan, J., Cherrett, T. J., Plumeau, P., & Weisbrod, R. (2012). Guidebook for Understanding Urban Goods Movement. NCFRP, Report 14.
• Zmud, J., Lawson, C. T., & Pisarski, A. (2014). Making Trucks Count: Innovative Strategies for Obtaining Comprehensive Truck Activity Data. NCFRP, Report 29.
• Christensen Associates, University of Texas at AustinCenter for Transportation Research, Grow & Bruening, & Pett, K. H. S. (2012). Preserving and Protecting Freight Infrastructure and Routes. NCFRP, Report 16.
• WSP Parsons Brinckerhoff, Inc. (2017). Phase I of NCFRP 50: Improving Freight Transportation Resilience in Response to Supply Chain Disruptions.
• HolguinVeras, J., Jaller, M., SanchezDiaz, I., Wojtowicz, J., Campbell, S., Levinson, H., Lawson, C., Powers, E. L., & Tavasszy, L. (2012). Joint Report: Freight Trip Generation and Land Use. NCHRP, Report 739. NCFRP, Report 19.
• National Highway System. (2019). Public Road Length – 2018 (1): Miles by Functional System and Federal‐Aid Highways National Summary.
• U.S. Department of Transportation. (2007). The Transportation and Land Use Toolkit: A planning Guide for Linking Transportation to Land Use and Economic Development. PUB 616 (3‐07).
• U.S. Department of Transportation. (2016). Comprehensive Freight Movement Plan. • Chandler, M. (2000). Ten Steps in Preparing a Comprehensive Plan. Planning Commissioners Journal,
Number 39. • Beagan, D., Tempesta, D., & Proussaloglou, K. (2019). Quick Response Freight Methods Third Edition.
FHWA‐HOP‐19‐057. • University of Washington: Supply Chain Transportation and Logistics Center Urban Freight Lab, & Seattle
Department of Transportation. (2018). The Final 50 Feet Urban Goods Delivery System: Research Scan and Data Collection Project.
• Southwestern Pennsylvania Commission. (2016). Southwestern Pennsylvania Regional Freight Plan. • U.S. Department of Transportation. (2018). Transportation Economic Trends: 2018. • U.S. Department of Transportation, Transportation Planning Capacity Building Program, Federal Highway
Administration, & Federal Transit Administration. The Transportation Planning Process: Key Issues. FHWA‐HEP‐07‐039.
• The Keck Center Washington, DC. (2018). Workshop on Implementing a Freight Fluidity Performance Measurement System. Transportation Research Circular, E‐C240.
• U.S. Government Publishing Office. (2017). U.S.C. Title 49 – TRANSPORTATION. United States Code, 2017 Edition, Chapter 702.
• Higgins, C. D., Ferguson, M., & Kanaroglou, P. S. Varieties of Logistics Centers: Developing Standardized Typology and Hierarchy. Transportation Research Record 2288.
• Eisele, B., & Villa, J. (2015). Freight Fluidity Scale of Analysis: Freight Fluidity Background Paper #2. • American Transportation Research Institute, Boris, C., & Murray, D. (2018). Identifying State Freight Plan
Best Practices.
Appendix C - Citations
95
• Mid America Association of State Transportation Officials. (2017). MAASTO Intermodal Freight SummitSummary.
• Pennsylvania Department of Transportation. (2018). Eastern Pennsylvania Freight Summit 2018 Program. • Hill, J., & Carolina Council of Governments. Greater Charlotte Regional Freight Mobility Plan. • Fargo Moorhead Metropolitan Council of Governments. (2017). Executive Summary: Regional Freight Plan. • West Florida Regional Planning Council, URS, & DRMP. (2010). Regional Freight Network Plan Highways of
Commerce. • Oregon Metro. (2018). 2018 Regional Transportation Plan: Regional Freight Strategy. • WSP Global. Regional Freight Network Project Evaluation Methodology. • I95 Corridor Coalition. FHWA Freight Fluidity Monitoring Program: Display of Supply Chain Performance
Data TRB Innovations in Freight Data Workshop. • Pennsylvania Department of Transportation Bureau of Rail Freight, Ports, & Waterways, Bureau of Planning
and Research. (2018). Pennsylvania Railroad Map: March 2018. • Pennsylvania Department of Transportation Center for program Development and Management. Developing
Regional Long Range Plans: Resource Guidance for Pennsylvania Planning Partners. PUB‐575 (3‐11). • Ziegler, M., & Bucklew, K. (2016). Innovations in Freight Planning and Project Prioritization. OTEC Conference. • Barr, K., & Bini, R. (2019, January 25). RFP Guidance, Interview Lancaster Co. Planning Commission.
(J. Hursh, Interviewer). • Patoniak, S. (2019, January 30). RFP Guidance, Lackawanna Co. RPC. (J. Hursh, Interviewer). • Eddy, H. (2019, January 30). RFP Guidance, Luzerne Co. Planning and Zoning. (J. Hursh, Interviewer). • Deck, S., & Baxendale, C. (2019, February 14). RFP Guidance, TriCounty Regional Planning Commission.
(J. Hursh, Interviewer). • Saylor, J., & Stover, J. (2019, February 15). RFP Guidance, SEDACOG Joint Rail Authority. (J. Hursh,
Interviewer). • Wallfoort, S. (2019, February 19). RFP Guidance, Southwestern PA Commission. (J. Hursh, Interviewer). • Aloiz, E., & Sandberg, B. (2019, February 20). RFP Guidance, Erie Co. Department of Planning & Erie Port
Authority. (J. Hursh, Interviewer). • Ruane, M., & Boyer, M. (2019, February 28). RFP Guidance, DVRPC. (J. Hursh, Interviewer). • Bradley, B. A. (2019, March 6). RFP Guidance, LVPC. (J. Hursh, Interviewer). • Walston, C. D. (2019, March 19). RFP Guidance, FHWA. (J. Hursh, Interviewer). • Bonini, E., Soisson, D., Sorbo, M., Granger, J., Watson, A., Adams, E., Gothie, R., McCloskey, A., Spila, D., Hare,
B., & Panko, S. (2019, March 22, March 26). RFP Guidance, PennDOT, Multiple Tranp. (J. Hursh, Interviewer). • Segeye, T., Blevins, D., & Butler, J. (2019, April 16). RFP Guidance, WILMAPCO. (J. Hursh, Interviewer). • Parker, M. G. (2019, July 1). RFP Guidance, I95 Coalition. (J. Hursh, Interviewer). • StraussWieder, A. (2019, July 9). RFP Guidance, NJTPA. (J. Hursh, Interviewer). • Ward, K. (2019, July 10). RFP Guidance, University of Washington College of Engineering. (J. Hursh,
Interviewer). • Rodrigue, J. (2020, March 11). RFP Guidance, Dept. of Global Studies & Geography Hofstra University.
(J. Hursh, Interviewer). • Conway, A. (2020, March 13). RFP Guidance, The City College of New York. (J. Hursh, Interviewer).


