OISE-UT Modern Language Centre October, 2000 French immersion students' performance on Grade 3 provincial tests: Potential impacts on program design Final report submitted to Education Quality and Accountability Office (EQAO) Principal Investigators: Miles Turnbull Doug Hart Sharon Lapkin Research Officer: Hameed Esmaeili
Transcript
OISE-UT Modern Language Centre October, 2000
French immersion students' performance on Grade 3 provincial tests: Potential impacts on program design
Final report submitted to Education Quality and Accountability Office (EQAO)
Principal Investigators:
Miles Turnbull Doug Hart
Sharon Lapkin
Research Officer:
Hameed Esmaeili
i
TABLE OF CONTENTS
ACKNOWLEDGEMENTS ....................................................................................................................................... ii
EXECUTIVE SUMMARY ....................................................................................................................................... iii
METHODOLOGY AND SAMPLE...........................................................................................................................3
SECONDARY ANALYSIS OF EQAO TEST DATA ..........................................................................................................3 COLLECTING FACTUAL INFORMATION ON IMMERSION EDUCATION IN THE CONTEXT OF PROVINCIAL TESTING........3 SAMPLE ......................................................................................................................................................................4
TESTING AT GRADE 3 ............................................................................................................................................4
A TYPOLOGY OF IMMERSION PROGRAMS AT GRADE 3...............................................................................................4 CHOICES ABOUT TESTING AT GRADE 3.......................................................................................................................6 TEST RESULTS: OVERALL COMPARISONS OF IMMERSION AND NON-IMMERSION STUDENTS AT GRADE 3..................6 RESULTS BY TYPE OF PROGRAM AT GRADE 3 ............................................................................................................8
Grade 3 reading.....................................................................................................................................................9 Grade 3 writing ...................................................................................................................................................10 Grade 3 mathematics...........................................................................................................................................11 A note on language of testing in mathematics .....................................................................................................12
TESTING AT GRADE 6 ..........................................................................................................................................14
A TYPOLOGY OF IMMERSION PROGRAMS AT GRADE 6.............................................................................................14 CHOICES ABOUT TESTING AT GRADE 6.....................................................................................................................16 TEST RESULTS: OVERALL COMPARISONS OF IMMERSION AND NON-IMMERSION STUDENTS AT GRADE 6................17 EXAMINING THE RESULTS ACROSS GRADES 3 AND 6 ...............................................................................................19 TWO HYPOTHESES....................................................................................................................................................19
The extended lag hypothesis ................................................................................................................................20 The self-selection hypothesis ...............................................................................................................................20
TEST RESULTS BY TYPE OF PROGRAM AT GRADE 6 .................................................................................................21 SUMMARY OF TEST RESULTS ...................................................................................................................................24
THE QUESTIONNAIRE RESULTS.......................................................................................................................25
CHANGES IN SCHOOL BOARD POLICIES....................................................................................................................25 IMPACT OF EQAO TESTING......................................................................................................................................26 ENROLMENT AND ATTRITION ...................................................................................................................................26 DISSEMINATION OF EQAO TEST RESULTS ...............................................................................................................29
This project was made possible through contract funds from the Educational Quality Assessment Office in Ontario. We are grateful to that body both for the funds and the test data that made our study possible. We would also like to acknowledge the school districts in Ontario who responded to our questionnaire. We wish to thank Dr. Hameed Esmaeili who served as Research Officer to this project and Ms. Michelle Pon, Administrative Assistant in the OISE/UT Modern Language Centre. Finally, Mr. Devon Krueger of the University of Toronto Research Office was most helpful in negotiating our contract and assisting with administrative aspects of the contract.
iii EXECUTIVE SUMMARY
French immersion student’s performance on Grade 3 provincial tests: Potential
impacts on program design Introduction
The recently introduced EQAO testing program at Grades 3 and 6 in Ontario
creates a unique opportunity to investigate French immersion students' performance on literacy and mathematics tests about 20 years after many of the large-scale evaluations of French were conducted. Those evaluations involved administrations of standardized tests such as the Canadian Tests of Basic Skills. The EQAO tests differ in nature from those used in earlier evaluations in that they are curriculum-based and include a greater variety of test types.
While there are no mandated consequences of EQAO test results, in the current
climate the tests are seen as high-stakes for parents, individual boards and schools, and possibly, individual teachers and students. All parties are strongly encouraged to take the results seriously. Stakeholders may be inclined to question immersion programs if test results reveal weaker performance than expected.
The language of testing most appropriate to assess the academic achievement of immersion students in subjects such as mathematics is also a concern for parents, students, teachers and school board officials. Although the research literature suggests that knowledge acquired in French (in math, in this case) transfers and can be tested in English, there has been a continuing concern that students may not learn ‘as much’ content when they are schooled in a second language.
We examined these same questions in the current Ontario context. We
compared immersion students' results to those of regular English program students on the Grade 3 and Grade 6 tests, according to the option they chose for the testing. Currently, school boards can choose:
Option 1: all students participate in the Grade 3 assessment in English in all three components; OR Option 2: students do the language components of the Grade 3 assessment in English and a French translation of the mathematics component; OR Option 3: French immersion students do the mathematics component only in French.
At the Grade 6 level, it is mandatory for all Grade 6 students to complete all components of the assessment in English.
In addition, this study allowed us to explore the impact of different approaches to English literacy instruction within French immersion. Currently across the province, boards introduce formal instruction in English at different grades within their early
ivimmersion programs. Thus the EQAO testing created a natural laboratory for exploring the impact of program organization on student achievement. We examined whether the EQAO testing program was creating pressure to change the design of immersion programs and whether boards were opting for provincial testing in French and/or English in Grade 3.
This study was guided by the following research questions: 1) How do French immersion students perform on the provincial Grade 3 tests of
reading, writing and mathematics, compared to regular English program students? Do all French immersion programs choose the same testing option? Is this choice related to program design?
2) Do French immersion student performances on the provincial tests differ depending on the grade at which English language arts is introduced?
3) How have the provincial tests affected policy and/or program design, enrolment patterns, and attrition rates in early French immersion?
4) Are French immersion students' results on the EQAO tests publicised, disseminated and compared to regular English program students’ results? If so, how?
This summary is organized under the following main headings: Introduction,
Methodology and sample, Grade 3 test results, Grade 6 test results, Summarizing test results across Grades 3 and 6, Questionnaire findings, and Summary and implications.
Methodology and sample
Secondary analysis of EQAO test data We analyzed data held by EQAO (1998-99) to ascertain the comparative
performance of immersion students on Grade 3 and Grade 6 reading, writing and mathematics overall achievement results. Using information from the questionnaire component of the study and board identifiers in the test data sets (provided by EQAO), we also compared students' performance according to the grade at which English language arts was introduced and relative intensity of French and English instruction in the early grades.
School district survey We conducted a short survey of all school districts in Ontario currently offering early
immersion programs to obtain the following information: 1) immersion programs (if any) currently/recently offered; 2) detailed information on program format; 3) active policy issues (if any) concerning immersion education; 4) latest enrolment figures and documentation or informed opinions about trends in enrolment at the elementary level (including intake and attrition); 5) formats for publishing EQAO results; 6) formats for circulating results internally; 7) published comparisons (if any) of EQAO test results for immersion versus regular program students; 8) unpublished comparisons used for administrative and planning purposes.
vSample The questionnaire survey was sent to a total of 62 school districts. We received
responses from 36 districts; three districts reported that they did not have immersion programs and thus did not complete the survey. The districts in our sample cover 70-75 percent of immersion students participating in the EQAO testing program in 1998/99 at both Grades 3 and 6.
Grade 3 test results
Immersion students at Grade 3 encountered the EQAO testing with different degrees of instruction in English. A small minority of students was in programs where they did not experience English instruction until Grade 4. A larger number began classes in English only at Grade 3. At the other extreme, students in partial (50/50) programs had instruction in English on a half-time basis throughout Grades 1 to 3. In the middle were students in programs offering lesser amounts of class time in English over the three grades.
A typology of immersion programs at Grade 3 We developed a categorization of immersion programs by start grade and
accumulated hours of instruction in English from Grades 1 to 3, based on information from our questionnaire data. The program typology is based initially on starting grade, and then differentiates programs with an early start to instruction in English in terms of number of accumulated hours from Grades 1 to 3.
Choices about testing at Grade 3 Program design appears to have had little systematic influence on district
choices about whether immersion students were administered the EQAO reading and writing tests at Grade 3. Boards with full immersion through to the end of Grade 3 avoided testing. However, those in most other categories participated. In the case of mathematics testing, boards with relatively little instruction in English showed a reluctance prior to 1998-1999 to participate in the testing program and an overwhelming preference for translated tests when they did.
Comparisons of immersion and non-immersion test results at Grade 3 EQAO has established four levels of achievement. The levels profile of
immersion students in the same districts was broadly similar to non-immersion students in all three skill areas: reading, writing, and mathematics. Results from districts where immersion students wrote the EQAO tests indicate that in the case of reading and writing, immersion students were somewhat more likely to be rated at levels 3 or 4. Distributions for immersion and regular program students were virtually identical in mathematics.
viGrade 3 results by type of program In the case of overall reading scores, the proportion of regular program students
at levels 3 and 4 (combined) was similar across program categories. Reading test results for total immersion students at Grade 3 (i.e. the small minority who had no instruction in English prior to Grade 4) were below the range for those in the regular program. However, in all other cases, immersion students equaled or outperformed regular program students in the same district grouping.
The proportion of regular program students achieving level 3 or 4 in the writing tests also showed relatively little variation. Again, with the exception of the total immersion students, test outcomes for immersion students equaled or exceeded regular program students' results in the same district grouping.
While districts had the option of not administering the EQAO literacy tests to immersion students, the mathematics test was compulsory. As a result, mathematics results for immersion students at Grade 3 are based on a larger base population. Mathematics test results show a narrower range of outcomes for regular program students over our district groupings than for immersion students. However, in contrast to literacy and particularly reading test results, students in total immersion at Grade 3 do not appear at a disadvantage. Test results for mathematics do not show a systematic relationship to starting grade or accumulated hours of instruction in English.
A note on language of testing in mathematics In examining mathematics test results by language of testing, it is important to control for prior accumulated hours of instruction in English. Accumulated hours may be independently related both to test scores themselves and to the impact of language of testing (which we might expect to be greater, the less prior exposure to instruction in English). The available data provides a limited basis for conducting this analysis at Grade 3. The results offer virtually no support to the argument that testing in English disadvantages immersion students, at least in comparison to testing in French translation, even though instruction in mathematics up to Grade 3 has been in French. Grade 6 test results
As at Grade 3, immersion students approached the Grade 6 EQAO tests in 1998/99 with an array of program backgrounds. By Grade 6, in most programs, students were receiving 30-50 percent of instruction in English, but had accumulated differing amounts of instruction in English. This range was further expanded by the inclusion of middle immersion students, instructed wholly in English (with the exception of core French) prior to starting immersion in Grades 4 or 5. In summary the number of accumulated hours of instruction in English ranged from under 1000 to 2800 among early immersion programs. The more intensive middle immersion programs had totals
viiapproximately equivalent to the partial early immersion programs. However, students in partial middle immersion programs had much higher totals exceeding 4000 hours.
A typology of immersion programs at Grade 6 Our typology of programs at Grade 6 was based on accumulated hours of
instruction in English where all students in a district were in early immersion programs. Districts with both early and middle immersion programs formed a separate category, as did districts with middle immersion alone.
Choices about testing at Grade 6 At Grade 6, the main policy choice regarding immersion students was whether to
administer the English version or the French translation of the mathematics tests. Few districts chose to test mathematics in French. Those that did tended to have lower totals of accumulated hours of instruction in English.
Comparisons of immersion and non-immersion test results at Grade 6 As indicated above, at Grade 3, we found that the performance of immersion and
non-immersion students on EQAO tests was broadly similar. Immersion students did somewhat better on literacy tests, but differences were small. Results for mathematics were virtually identical for immersion and non-immersion students. At Grade 6 we found a different pattern. Immersion students outperformed those in the regular program in all skill areas. Differences were notable, even when we compared these with the differences in performance between regular program students as a whole and those in enrichment.
Differences in test performance were greatest for reading. Just over half of non-immersion students achieved level 3 or 4, compared to slightly more than 70 percent of immersion students. The performance of immersion students was, in fact, closer to that of English program students in enrichment, although a higher proportion of the latter group reached level 4. On the writing test half of regular program students obtained level 3 or 4; two-thirds of immersion students reached this level. However the writing performance of immersion students was less similar to that of English program students in enrichment than is the case for reading. Results for mathematics paralleled those for writing. Just under half of regular program students reached level 3 or 4 compared to 62 percent of immersion students and almost 75 percent of English program students in enrichment. Differences in test results at Grades 3 and 6
In summary, at Grade 6 in contrast to Grade 3, students in immersion clearly outperformed those in the regular program on EQAO tests in both literacy and mathematics. Differences were notable even in comparison to the performance of the
viiihighly selected English program enrichment group. What had changed since Grade 3? One hypothesis is that test results at Grade 3 did not really reflect the greater academic strengths of immersion students. There was an extended lag in development that was remedied sometime after Grade 3 with further accumulated hours of instruction in English. We have termed this the extended lag hypothesis. A second hypothesis is that immersion students become more self-selected on academic strength as weaker students leave early immersion programs, and students of above average academic ability undertake middle immersion. We have called this the self-selection hypothesis.
We derived predictions from these two hypotheses regarding differences in performance among program groupings. In testing these, we found no support for the extended lag hypothesis and weak and inconsistent support for the self-selection hypothesis. This suggests that there may be no simple, single-factor explanation for differences in patterns of immersion/non-immersion differences at Grades 3 and 6.
Questionnaire findings The school district questionnaire developed for this study targeted possible
changes in school or board policies since the 1996-97 academic year as well as perceptions of the effects of the testing program.
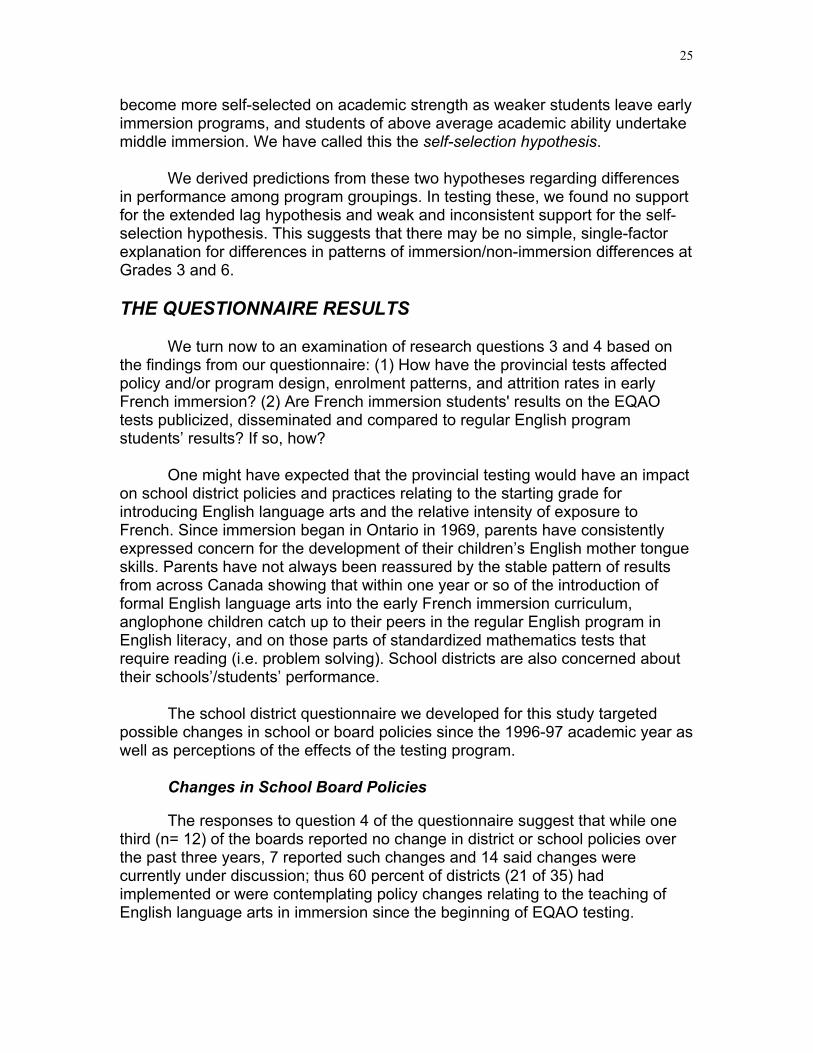
Twenty-one of 35 (60 percent) of school districts had implemented or were
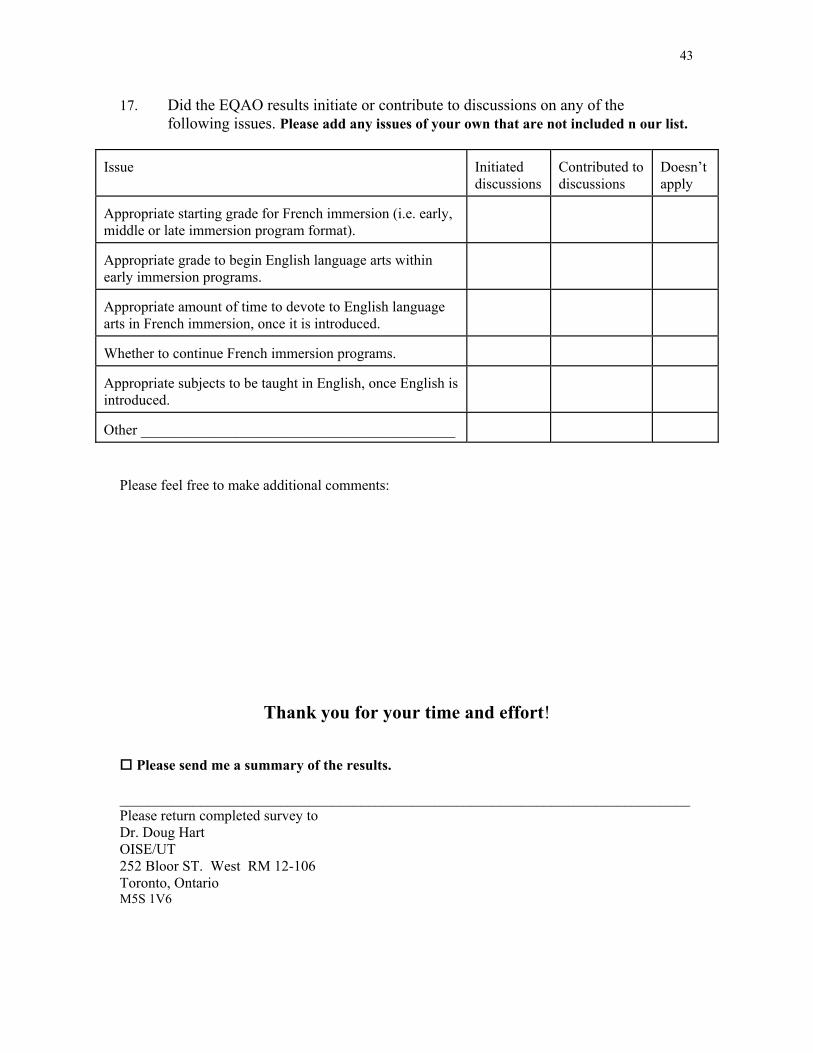
contemplating policy changes relating to the teaching of English language arts in immersion since the beginning of EQAO testing. The EQAO testing did not appear, however, to initiate or contribute to discussions about whether to continue French immersion programs or about the appropriate starting grade for immersion. Moreover, responses to questions about enrolment and attrition trends indicated considerable stability.
School districts used multiple methods to disseminate information about the
EQAO test results. Over the three years since testing began, an increasing number of districts provided comparisons of results for French immersion and regular program students for various stakeholders.
Summary
Question 1: How do French immersion students perform on the provincial Grade 3 tests of reading, writing and mathematics, compared to regular English program students? Do all French immersion programs choose the same testing option? Is this choice consistent within the same school board?
ixOverall, at Grade 3, immersion students did somewhat better than English
program students on literacy tests, but differences were small. At Grade 3, French immersion students who had little exposure to English language arts instruction lagged somewhat behind their English program counterparts. Results for mathematics were virtually identical for immersion and non-immersion students at Grade 3. By Grade 6, French immersion students achieved better overall results on the EQAO reading, writing and mathematics tests.
Testing policy decisions were made at the school board level and all schools in the board were bound by these decisions. At the Grade 3 level, some school boards (particularly those with the most intensive immersion programs) opted out of literacy testing at Grade 3. In the case of mathematics, at Grade 3, a notable number of boards tested math via French, and this number increased from 1996-1999. At Grade 6, mathematics testing occurred in English. Question 2: Do French immersion student performances on the provincial tests differ depending on the grade at which English language arts is introduced?
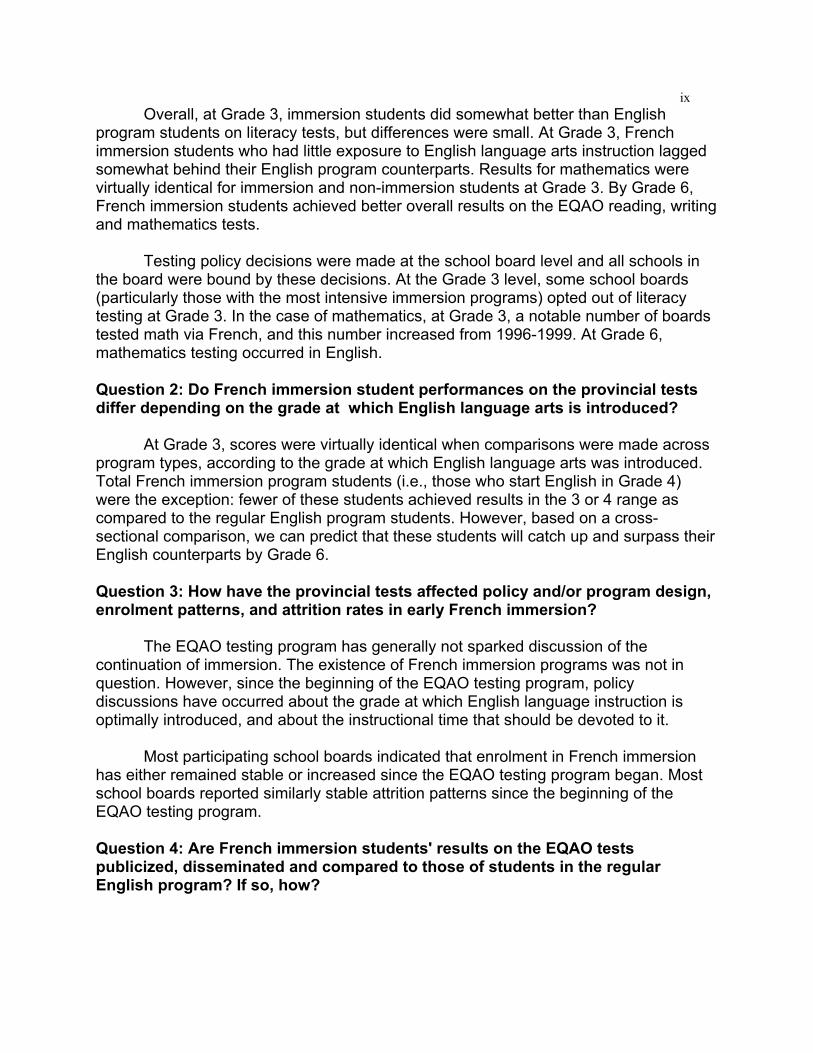
At Grade 3, scores were virtually identical when comparisons were made across program types, according to the grade at which English language arts was introduced. Total French immersion program students (i.e., those who start English in Grade 4) were the exception: fewer of these students achieved results in the 3 or 4 range as compared to the regular English program students. However, based on a cross-sectional comparison, we can predict that these students will catch up and surpass their English counterparts by Grade 6. Question 3: How have the provincial tests affected policy and/or program design, enrolment patterns, and attrition rates in early French immersion?
The EQAO testing program has generally not sparked discussion of the continuation of immersion. The existence of French immersion programs was not in question. However, since the beginning of the EQAO testing program, policy discussions have occurred about the grade at which English language instruction is optimally introduced, and about the instructional time that should be devoted to it.
Most participating school boards indicated that enrolment in French immersion has either remained stable or increased since the EQAO testing program began. Most school boards reported similarly stable attrition patterns since the beginning of the EQAO testing program. Question 4: Are French immersion students' results on the EQAO tests publicized, disseminated and compared to those of students in the regular English program? If so, how?
xMost participating school districts reported that they use a variety of
methods to disseminate information about the results of the EQAO testing, including school reports sent to parents, presentations at school council and parent meetings, local news media articles and district newsletters. There appears to be an increasing tendency for school districts to provide comparisons of results for French immersion and regular program students. Summary of implications For EQAO • We recommend that EQAO consider adapting the current testing policy at Grade 3
to allow boards to opt out of both literacy and mathematics testing. The results at this grade may not represent immersion students' abilities accurately, and may cause unnecessary stress and concern for parents, teachers and students.
For school boards • Our findings suggest that no fundamental changes in immersion programs are
necessary because of fears that immersion students will suffer due to EQAO testing. For parents • Parents should be cautious in interpreting lower-than-expected test results at Grade
3. Our cross-sectional results indicate that by Grade 6, most French immersion students recover from any lags in literacy skills that may have been a concern at Grade 3.
For researchers • More research is clearly needed to investigate the links between language of testing,
instruction and achievement.
1
INTRODUCTION
From the extensive program evaluations of French immersion in the 70s and 80s, we have detailed information about student achievement in English and mathematics. In general, the data come from large-scale administrations of standardized tests such as the Canadian Tests of Basic Skills. Results in English suggest that within one year of the introduction of English language arts into the curriculum, immersion students catch up with comparable students in the regular English program (for summaries of relevant evaluation data see, for example, Swain & Lapkin, 1982; Genesee, 1987; Lapkin & Swain with Shapson, 1990). More qualitative analyses of immersion students' writing in English indicate that they are as creative and articulate as regular English comparison students (e.g. Lapkin, 1982; Swain, 1975).
The recently introduced EQAO testing program at Grades 3 and 6 in Ontario creates a unique opportunity to investigate French immersion students' performance on literacy and mathematics tests in a different context, about 25 years since many of the large-scale evaluations of French were first conducted. The EQAO tests differ in nature from standardized tests used in earlier evaluations in that they are curriculum-based and include a greater variety of test types.
While there are no mandated consequences of EQAO test results, in the current climate the tests are seen as high-stakes for parents, individual boards and schools, and possibly, individual teachers and students. All parties are strongly encouraged to take the results seriously. In this context, early immersion programs may find themselves squeezed by pressures from above and below. (Early immersion students constitute an important sub-group when we analyzed school and board results on the EQAO tests.) Moreover, parents may be led to question immersion programs if test results reveal weaker performance than expected.
The language of testing most appropriate to assess the academic achievement of immersion students in subjects such as mathematics is also a concern for parents, students, teachers and school board officials. Some answers are available from the research literature. For example, data from the Peel Board of Education (1992:164) comparing immersion and non-immersion achievement in Grades 4 and 7 indicate "that the two immersion groups show greater potential for academic-type learning, and stronger performance on measures of mathematics and English-language reading/vocabulary skills." The tests used in Peel included the Canadian Cognitive Abilities Test and the Canadian Achievement Tests. The Peel results suggest that knowledge acquired in French (in math, in this case) transfers and can be tested in English. Such findings have been substantiated elsewhere (e.g. Alberta Education, 1991). EQAO (1998-1999) has also examined this issue.
2
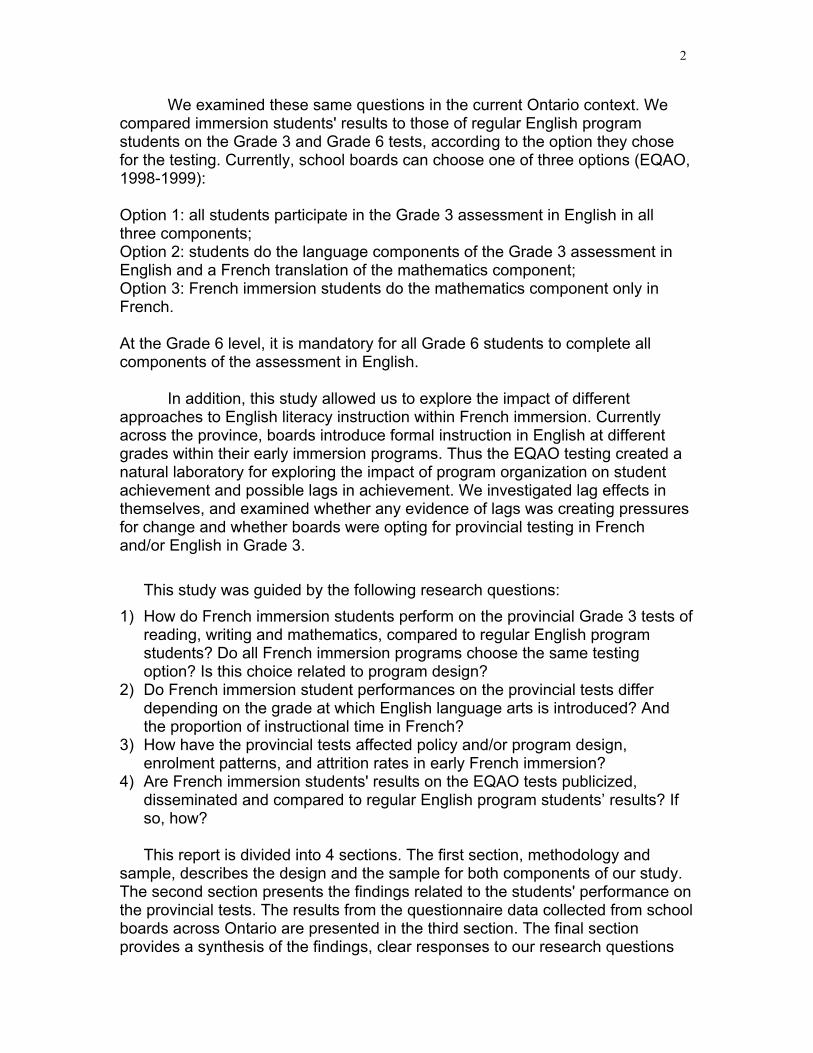
We examined these same questions in the current Ontario context. We compared immersion students' results to those of regular English program students on the Grade 3 and Grade 6 tests, according to the option they chose for the testing. Currently, school boards can choose one of three options (EQAO, 1998-1999): Option 1: all students participate in the Grade 3 assessment in English in all three components; Option 2: students do the language components of the Grade 3 assessment in English and a French translation of the mathematics component; Option 3: French immersion students do the mathematics component only in French. At the Grade 6 level, it is mandatory for all Grade 6 students to complete all components of the assessment in English.
In addition, this study allowed us to explore the impact of different approaches to English literacy instruction within French immersion. Currently across the province, boards introduce formal instruction in English at different grades within their early immersion programs. Thus the EQAO testing created a natural laboratory for exploring the impact of program organization on student achievement and possible lags in achievement. We investigated lag effects in themselves, and examined whether any evidence of lags was creating pressures for change and whether boards were opting for provincial testing in French and/or English in Grade 3.
This study was guided by the following research questions: 1) How do French immersion students perform on the provincial Grade 3 tests of
reading, writing and mathematics, compared to regular English program students? Do all French immersion programs choose the same testing option? Is this choice related to program design?
2) Do French immersion student performances on the provincial tests differ depending on the grade at which English language arts is introduced? And the proportion of instructional time in French?
3) How have the provincial tests affected policy and/or program design, enrolment patterns, and attrition rates in early French immersion?
4) Are French immersion students' results on the EQAO tests publicized, disseminated and compared to regular English program students’ results? If so, how?
This report is divided into 4 sections. The first section, methodology and
sample, describes the design and the sample for both components of our study. The second section presents the findings related to the students' performance on the provincial tests. The results from the questionnaire data collected from school boards across Ontario are presented in the third section. The final section provides a synthesis of the findings, clear responses to our research questions
3
and a discussion of the theoretical, pedagogical and policy-level implications of this study. METHODOLOGY AND SAMPLE
Secondary Analysis of EQAO Test Data
The first component of our study included an analysis of data held by EQAO
to ascertain the comparative performance of immersion students on Grade 3 and Grade 6 Reading, Writing and Mathematics overall achievement results. Using information from the questionnaire component of the study (see below) and board identifiers in the test data sets (provided by EQAO), we also compared students' performance according to the grade at which English language arts was introduced and relative intensity of French and English instruction in the early grades.
Collecting Factual Information on Immersion Education in the Context of Provincial Testing
In the second phase of the study, we conducted a short survey (see
Appendix) of all school districts in Ontario currently offering early immersion programs to obtain the following information: 1) immersion programs (if any) currently/recently offered; 2) detailed information on program format; 3) active policy issues (if any) concerning immersion education; 4) latest enrolment figures and documentation or informed opinions about trends in enrolment at the elementary level (including intake and attrition); 5) formats for publishing EQAO results; 6) formats for circulating results internally; 7) published comparisons (if any) of EQAO test results for immersion versus regular program students; 8) unpublished comparisons used for administrative and planning purposes.
A draft version of the survey was created by the research team. Five educators, either French immersion teachers or school board officials, piloted the survey and provided valuable suggestions for clarification and to make the survey more complete.
The survey was conducted using a layered design, beginning with an Xpresspost mailing, with subsequent telephone and electronic follow-up reminders. Some surveys were sent and returned electronically, upon request from participants.
The survey data fed back into the secondary analysis of EQAO data by allowing us to supplement the existing datasets with information on the characteristics of local immersion programs, particularly, starting grade for English language arts and amount of time allocated to this English instruction.
4
Sample
The questionnaire survey was sent to a total of 62 school districts. We received responses from 36 districts (one district that returned a completed survey had only a late immersion program). Another three districts reported that they did not have immersion programs and thus did not complete the survey. Our effective sample is thus 36 districts of 59 districts contacted and not known to be ineligible, that is, excluding districts we now know do not have immersion programs. (In one amalgamated district, information on testing choices and program enrolment growth was reported separately for two distinct early immersion programs. In the relevant tables, each program is treated as a separate district.) The districts in our sample cover 70-75 percent of immersion students participating in the EQAO testing program in 1998/99 at both Grades 3 and 6.
In 1998/99, EQAO testing protocols required immersion students in all
districts to participate in the Grade 6 language and mathematics testing. At Grade 3, participation in mathematics testing was also compulsory, but districts had the option of excluding immersion students from language testing. In 1998/99, thirty percent fewer immersion students at Grade 3 wrote the literacy tests compared to the mathematics tests. TESTING AT GRADE 3
Immersion students at Grade 3 encountered the EQAO testing with different degrees of instruction in English. A small minority of students were in programs where they did not experience English instruction until Grade 4. A larger number began classes in English only at Grade 3. At the other extreme, students in partial (50/50) programs had instruction in English on a half-time basis throughout Grades 1 to 3. In the middle were students in programs offering lesser amounts of class time in English over the three grades.
A Typology of Immersion Programs at Grade 3
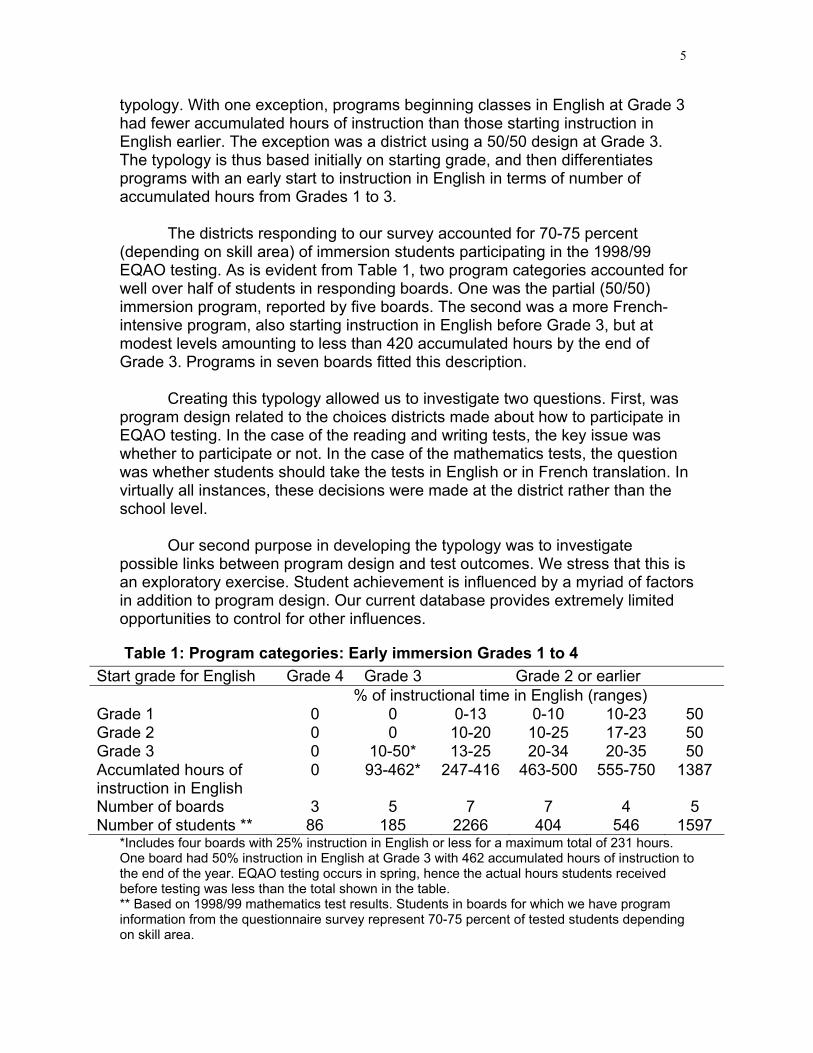
Table 1 summarizes our categorization of immersion programs by start grade and accumulated hours of instruction in English from Grades 1 to 3. This typology was developed from our questionnaire data. District programs were assigned codes on the basis of program design, which were then applied to the questionnaire and the EQAO-supplied databases. The categorization did not take account of the language of instruction in kindergarten. Many early immersion programs allowed entry at both kindergarten and Grade 1, making it difficult to estimate the real contribution of kindergarten programs to student achievement.
We were largely spared the issue of evaluating the relative weights of starting grade versus total accumulated hours as factors in constructing our
5
typology. With one exception, programs beginning classes in English at Grade 3 had fewer accumulated hours of instruction than those starting instruction in English earlier. The exception was a district using a 50/50 design at Grade 3. The typology is thus based initially on starting grade, and then differentiates programs with an early start to instruction in English in terms of number of accumulated hours from Grades 1 to 3.
The districts responding to our survey accounted for 70-75 percent (depending on skill area) of immersion students participating in the 1998/99 EQAO testing. As is evident from Table 1, two program categories accounted for well over half of students in responding boards. One was the partial (50/50) immersion program, reported by five boards. The second was a more French-intensive program, also starting instruction in English before Grade 3, but at modest levels amounting to less than 420 accumulated hours by the end of Grade 3. Programs in seven boards fitted this description.
Creating this typology allowed us to investigate two questions. First, was program design related to the choices districts made about how to participate in EQAO testing. In the case of the reading and writing tests, the key issue was whether to participate or not. In the case of the mathematics tests, the question was whether students should take the tests in English or in French translation. In virtually all instances, these decisions were made at the district rather than the school level.
Our second purpose in developing the typology was to investigate possible links between program design and test outcomes. We stress that this is an exploratory exercise. Student achievement is influenced by a myriad of factors in addition to program design. Our current database provides extremely limited opportunities to control for other influences.
Table 1: Program categories: Early immersion Grades 1 to 4 Start grade for English Grade 4 Grade 3 Grade 2 or earlier % of instructional time in English (ranges) Grade 1 0 0 0-13 0-10 10-23 50 Grade 2 0 0 10-20 10-25 17-23 50 Grade 3 0 10-50* 13-25 20-34 20-35 50 Accumlated hours of instruction in English
0 93-462* 247-416 463-500 555-750 1387
Number of boards 3 5 7 7 4 5 Number of students ** 86 185 2266 404 546 1597
*Includes four boards with 25% instruction in English or less for a maximum total of 231 hours. One board had 50% instruction in English at Grade 3 with 462 accumulated hours of instruction to the end of the year. EQAO testing occurs in spring, hence the actual hours students received before testing was less than the total shown in the table. ** Based on 1998/99 mathematics test results. Students in boards for which we have program information from the questionnaire survey represent 70-75 percent of tested students depending on skill area.
6
Choices about Testing at Grade 3
Program design appears to have had little systematic influence on district choices about whether immersion student were administered the EQAO reading and writing tests at Grade 3 (see Table 2). Boards with full immersion through to the end of Grade 3 avoided testing. However, those in most other categories participated. Within this general pattern, boards in the median category, those offering an early start but only modest (<500) accumulation of class hours in English, represented a divergent pattern up to 1997/98. Participation rates were notably lower than for boards with more intensive and less intensive English language exposure. This suggests that other factors beyond program design influenced testing choices.
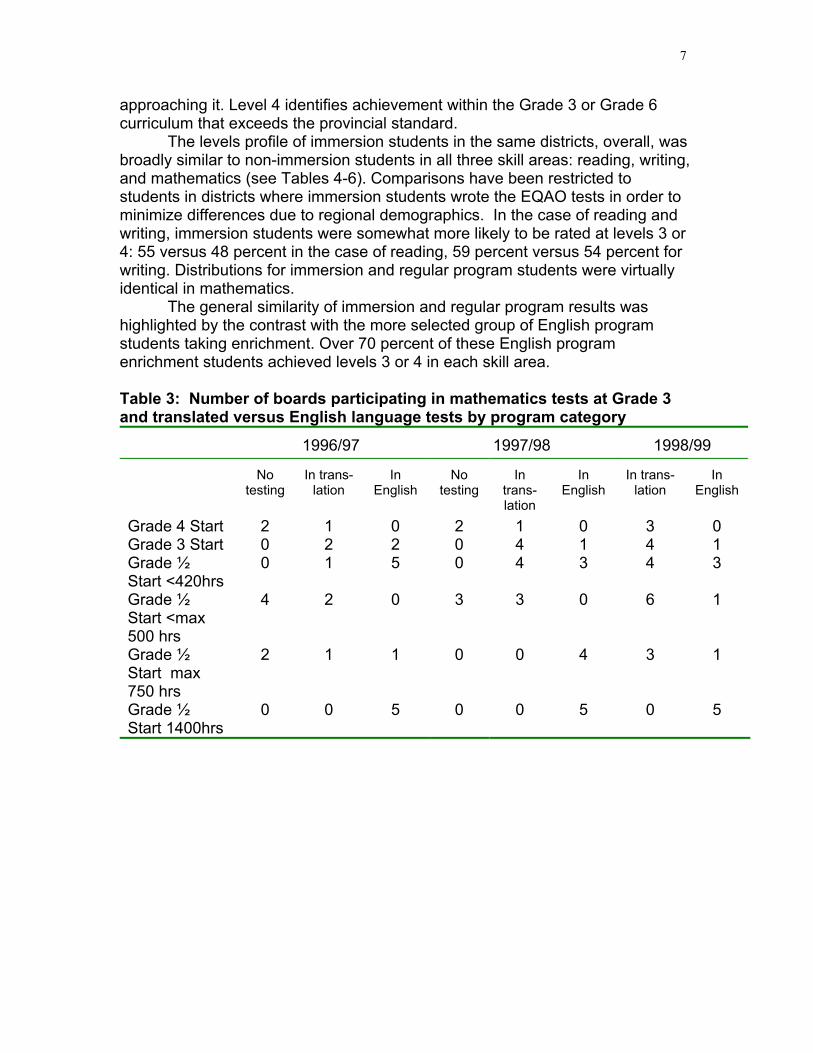
In the case of mathematics testing, self-reports were less complete. However, districts with full immersion through Grade 3 were again more likely to have opted out of testing, when this was possible, and to use tests in translation when it was not. Boards with partial (50/50) immersion participated consistently, using English language tests. What was striking however, was that districts in other categories generally showed a strong preference for tests in translation in contrast to those with partial immersion programs. Boards with programs delivering less than 500 hours of instruction in English again showed a reluctance prior to 1998-1999 to participate in the testing program and an overwhelming preference for translated tests when they did. Table 2: Number of boards participating in Grade 3 reading and writing tests by program category
*Self-reports have been corrected in a few instances based on EQAO test data files.
Test Results: Overall Comparisons of Immersion and Non-immersion Students at Grade 3 EQAO has established four levels of achievement, as follows:. Level 3
identifies a high level of achievement and is the provincial standard. Parents whose children are achieving at this level can be confident that their children will be well prepared for work in the next grade. Level 1 identifies achievement that falls much below the provincial standard. Level 2 identifies achievement that is
7
approaching it. Level 4 identifies achievement within the Grade 3 or Grade 6 curriculum that exceeds the provincial standard.
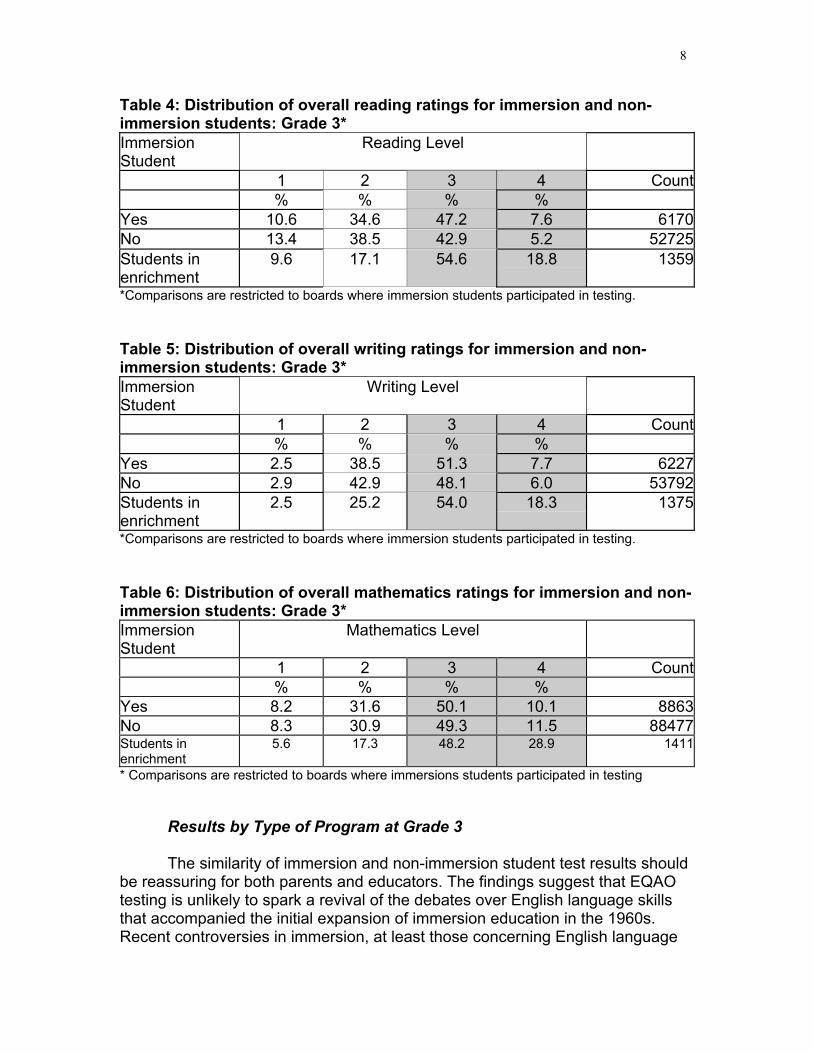
The levels profile of immersion students in the same districts, overall, was broadly similar to non-immersion students in all three skill areas: reading, writing, and mathematics (see Tables 4-6). Comparisons have been restricted to students in districts where immersion students wrote the EQAO tests in order to minimize differences due to regional demographics. In the case of reading and writing, immersion students were somewhat more likely to be rated at levels 3 or 4: 55 versus 48 percent in the case of reading, 59 percent versus 54 percent for writing. Distributions for immersion and regular program students were virtually identical in mathematics.
The general similarity of immersion and regular program results was highlighted by the contrast with the more selected group of English program students taking enrichment. Over 70 percent of these English program enrichment students achieved levels 3 or 4 in each skill area. Table 3: Number of boards participating in mathematics tests at Grade 3 and translated versus English language tests by program category
Table 4: Distribution of overall reading ratings for immersion and non-immersion students: Grade 3* Immersion Student
Reading Level
1 2 3 4 Count % % % % Yes 10.6 34.6 47.2 7.6 6170 No 13.4 38.5 42.9 5.2 52725 Students in enrichment
9.6 17.1 54.6 18.8 1359
*Comparisons are restricted to boards where immersion students participated in testing. Table 5: Distribution of overall writing ratings for immersion and non-immersion students: Grade 3* Immersion Student
*Comparisons are restricted to boards where immersion students participated in testing. Table 6: Distribution of overall mathematics ratings for immersion and non-immersion students: Grade 3* Immersion Student
* Comparisons are restricted to boards where immersions students participated in testing
Results by Type of Program at Grade 3
The similarity of immersion and non-immersion student test results should be reassuring for both parents and educators. The findings suggest that EQAO testing is unlikely to spark a revival of the debates over English language skills that accompanied the initial expansion of immersion education in the 1960s. Recent controversies in immersion, at least those concerning English language
9
skills, have been more circumscribed, being mainly concerned with the optimal grade level at which to introduce instruction in English. To address this issue, we examined test results by type of program. The results are shown in Tables 7 to 9. Included are comparisons of immersion and non-immersion student results, for the same districts, in each program category. This serves as a rough check that our immersion program categories in fact generate groupings of districts which have substantially different levels of achievement overall.
Grade 3 reading
In the case of overall reading scores, there was little evidence that our district groupings corresponded to broad differences in achievement levels. The proportion of regular program students at levels 3 and 4 (combined) was similar across categories ranging from 43 to 50 percent (see Table 7). The range for immersion students was much larger, but hinged on the relatively weak performance of students in total immersion programs at the time of testing. Only 32 percent of students in programs that do not begin instruction in English until Grade 4 achieved level 3 or 4. And as noted above, in this category, only one of three boards exposed their immersion students to testing. The range for other program categories was much narrower, though still larger than for the regular program: 50 to 62 percent; moreover, there was no pattern linking higher test results with higher totals of accumulated hours of instruction in English. The two most significant program designs in terms of student numbers had very similar achievement levels despite large differences in accumulated hours of instruction in English. In other words, apart from the small minority in total French immersion at Grade 3, program design appears to have had no systematic effect on reading test scores.
Reading test results for total immersion students at Grade 3 were well below the range for those in the regular program. However, in all other cases, immersion students equaled or outperformed regular program students in the same district grouping.
10
Table 7: Distribution of overall reading ratings by program type: Grade 3 Overall Reading Level
Immersion Program Type Immersion student
1 2 3 4
% % % % CountGrade 4 Start Yes 18.2 50.0 27.3 4.5 22 No 15.4 41.8 38.7 4.0 1484 Grade 3 Start Yes 12.6 34.4 47.0 6.0 183 No 17.0 38.1 40.2 4.7 3075 Grade ½ Start <420hrs Yes 6.8 33.3 50.9 9.0 2251 No 12.4 37.8 44.0 5.8 15708 Grade ½ Start <max 500 hrs Yes 17.9 36.6 40.8 4.7 385 No 14.3 41.1 40.8 3.8 4895 Grade ½ Start max 750 hrs Yes 13.9 38.2 41.3 6.6 288 No 12.7 39.6 42.8 4.9 6280 Grade ½ Start 1400hrs Yes 8.4 32.7 50.7 8.2 1565 No 12.3 38.2 43.7 5.8 9249
Grade 3 writing
The proportion of regular program students achieving level 3 or 4 in the writing tests also showed relatively little variation (see Table 8). The range among district groupings defined by their immersion programs varied from 47 to 56 percent. There was greater variation in the case of immersion students, but less so than for reading. Students in total immersion at Grade 3 again turned in weaker performances but were closer to regular English program students in the same districts and to immersion students in less intensive programs. Forty-two percent of total immersion students obtained level 3 or 4 ratings in 1998/99; the range for the other program categories was only slightly wider than for regular program students: 49 to 62 percent. The proportion of immersion students achieving at levels 3 and 4 did not increase systematically as we moved from lower to higher numbers of accumulated hours of instructional time in English. Again, the two most significant program designs in terms of student numbers had very similar achievement levels despite their large differences in accumulated hours of instruction in English. Again, with the exception of the total immersion students, test outcomes for immersion students equaled or exceeded regular program students' results in the same district grouping.
11
Table 8: Distribution of overall writing ratings by program type: Grade 3
Overall Writing Level Immersion Program Type Immersion
student 1 2 3 4
% % % % CountGrade 4 Start Yes 7.7 50.0 38.5 3.8 26 No 2.9 48.3 44.6 4.2 1539 Grade 3 Start Yes 4.9 45.9 45.4 3.8 185 No 4.9 47.8 42.3 5.0 3163 Grade ½ Start <420hrs Yes 1.6 34.9 54.3 9.1 2243 No 2.3 40.3 50.5 6.9 15981 Grade ½ Start <max 500 hrs Yes 5.8 44.8 45.0 4.5 400 No 3.3 46.5 45.4 4.8 4987 Grade ½ Start max 750 hrs Yes 2.7 40.4 51.7 5.1 292 No 3.3 45.1 46.5 5.2 6399 Grade ½ Start 1400hrs Yes 1.5 36.8 53.2 8.5 1576 No 2.7 41.4 49.5 6.4 9041
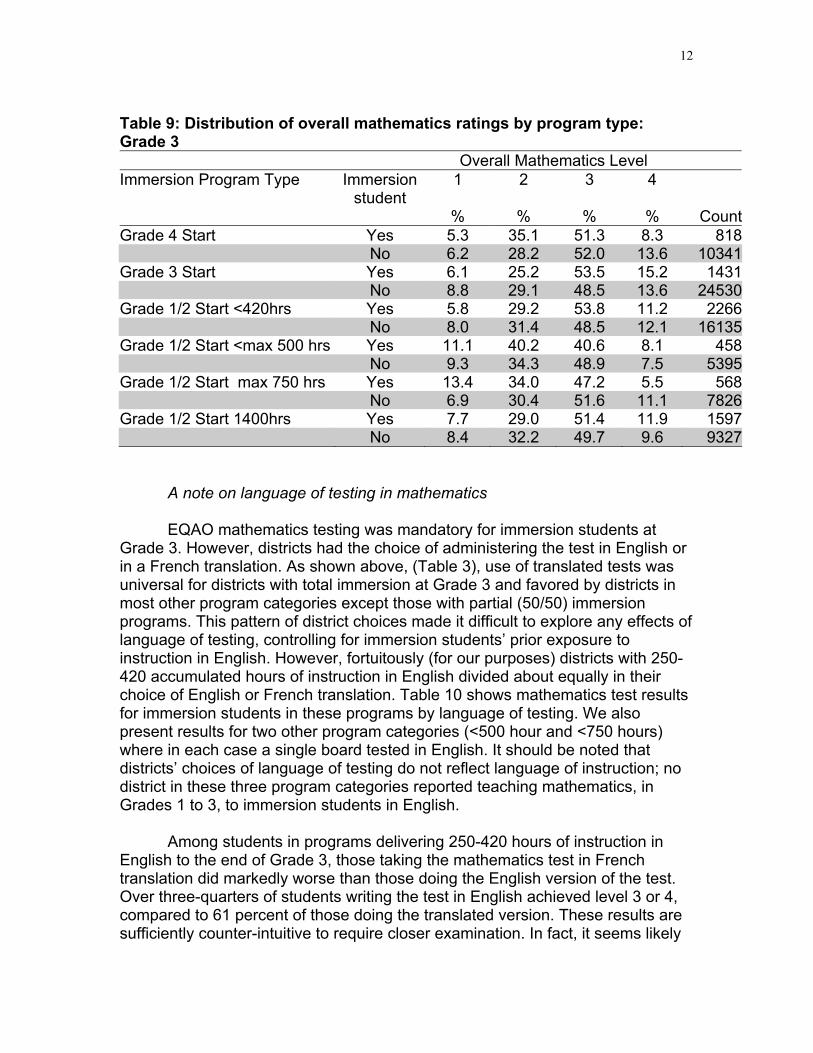
Grade 3 mathematics While districts had the option of not administering the EQAO literacy tests to immersion students, the mathematics test was compulsory. As a result, mathematics results for immersion students at Grade 3 are based on a larger base population. In particular, the numbers in the two most French-intensive program categories are substantially higher (compare Table 9 with Tables 7 or 8). Mathematics test results show a narrower range of outcomes for regular program students over our district groupings than for immersion students. In the case of the regular program, between 56 and 66 percent of students obtained ratings of 3 or 4. The range for immersion students was almost twice as broad: 49 to 69 percent. However, in contrast to literacy and particularly reading test results, students in total immersion at Grade 3 did not appear at a disadvantage. Test results for mathematics did not show a systematic relationship to starting grade or accumulated hours of instruction in English. The weakest performance on the mathematics test was among immersion students in programs with maximums less than 500 hours and less than 750 hours. These are also the least common program designs in terms of student numbers (among districts responding to our survey). Immersion students in these program categories did less well than other immersion students, but also less well than regular program students in their districts. It should be noted as well that while students in total immersion at Grade 3 are not exceptional within the immersion student group, their test results were also lower than those of regular program students in their districts.
12
Table 9: Distribution of overall mathematics ratings by program type: Grade 3
Overall Mathematics Level Immersion Program Type Immersion
A note on language of testing in mathematics EQAO mathematics testing was mandatory for immersion students at Grade 3. However, districts had the choice of administering the test in English or in a French translation. As shown above, (Table 3), use of translated tests was universal for districts with total immersion at Grade 3 and favored by districts in most other program categories except those with partial (50/50) immersion programs. This pattern of district choices made it difficult to explore any effects of language of testing, controlling for immersion students’ prior exposure to instruction in English. However, fortuitously (for our purposes) districts with 250-420 accumulated hours of instruction in English divided about equally in their choice of English or French translation. Table 10 shows mathematics test results for immersion students in these programs by language of testing. We also present results for two other program categories (<500 hour and <750 hours) where in each case a single board tested in English. It should be noted that districts’ choices of language of testing do not reflect language of instruction; no district in these three program categories reported teaching mathematics, in Grades 1 to 3, to immersion students in English. Among students in programs delivering 250-420 hours of instruction in English to the end of Grade 3, those taking the mathematics test in French translation did markedly worse than those doing the English version of the test. Over three-quarters of students writing the test in English achieved level 3 or 4, compared to 61 percent of those doing the translated version. These results are sufficiently counter-intuitive to require closer examination. In fact, it seems likely
13
that the result reflects differences among districts unrelated to language of testing. Among the four boards using translated tests, the proportion of students achieving level 3 or 4 was in the narrow range from 55 to 61 percent. In contrast, the range for the three boards using English tests was 42 to 80 percent; the higher figure being for a large district which numerically dominated this English test group. For the other two program categories where our database was even thinner (with one board in each using English tests) results were mixed. For the <500 hours category, students doing the translated test did substantially better than those writing the English language test; however, this pattern was reversed for the <750 hours category. In examining mathematics test results by language of testing, it is important to control for prior accumulated hours of instruction in English. Accumulated hours may be independently related both to test scores themselves and to the impact of language of testing (which we might expect to be greater, the less prior exposure to instruction in English). The available data provide a limited basis for conducting this analysis at Grade 3. The results offer virtually no support to the argument that testing in English disadvantages immersion students, at least in comparison to testing in French translation, even though instruction in mathematics up to Grade 3 has been in French.
The patterns of EQAO test results by type of immersion program are reminiscent of the “lag hypothesis" (Swain & Lapkin, 1982) which became conventional wisdom based on intensive research of the first immersion programs. Students in total or highly intensive French immersion programs did indeed pay a price initially in terms of weaker English language literacy skills. However, this developmental “lag” was very short-lived, on average a year, once students were exposed to formal instruction in English. We found a similar pattern in the EQAO results in this study. Students in total French immersion were clearly disadvantaged in taking the EQAO tests and there was a prima facia case for excluding them from the literacy tests. However, the “lag” effect appeared to be largely undone (at least with reference to the aggregate performance of non-immersion students) by even relatively small amounts of instructional time in English, even when introduced at Grade 3.
14
Table 10: Distribution of overall mathematics ratings by language of testing: Grade 3
Overall Mathematics Level Language of testing 1 2 3 4 % % % % CountGrade 1/2 Start <420hrs English 2.2 21.3 56.4 20.1 541 French translation 6.9 31.7 53.0 8.3 1725Grade 1/2 Start <max 500 hrs English 13.2 48.8 34.7 3.3 121 French translation 10.4 37.1 42.7 9.8 337Grade 1/2 Start max 750 hrs English 7.5 27.1 56.1 9.3 107 French translation 14.8 35.6 45.1 4.6 461 TESTING AT GRADE 6
As at Grade 3, immersion students approached the Grade 6 EQAO tests in 1998/99 with an array of program backgrounds. Early immersion programs generally became more similar after Grade 3; the proportion of teaching in English increased in programs that introduced English late or held class time in English to a minimum in the early grades. By Grade 6, in most programs, students were receiving 30-50 percent of instruction in English (see Table 11). Despite this convergence, early immersion students reached the end of Grade 6 with differing amounts of exposure to instruction in English. This range was further expanded by the inclusion of middle immersion students, instructed wholly in English (with the exception of core French) prior to starting immersion in Grades 4 or 5. Middle immersion programs themselves, can be categorized as intensive or partial (see Table 12) regarding the proportion of French.
In summary the range of accumulated hours of instruction in English ranged from under 1000 to 2800 among early immersion programs. The more intensive middle immersion programs had totals approximately equivalent to the partial early immersion programs. However, students in partial middle programs had much higher totals exceeding 4000 hours.
A Typology of Immersion Programs at Grade 6
Our typology of programs at Grade 6 was based on accumulated hours of
instruction in English where all students in a district were in early immersion programs. Districts with both early and middle immersion programs formed a separate category as did districts with middle immersion alone. Table 13 presents a detailed picture of program types and combination of immersion programs within the same school district. Table 14 shows the distribution of districts and student numbers across the categories of our typology.
15
Table 11: Program categories: Early immersion at Grade 6
Early Immersion
Accumulated hours of instruction in English, Grades 1-6
<950
1050-1200
1250-1400
1480-1900
2800
% of instructional time in English (ranges)
Grade 1
0
0-13
0-20
5-23
50
Grade 2
0
0-20
0-25
10-23
50
Grade 3
0-20
0-20
20-30
20-50
50
Grade 4
13-20
13-30
25-30
30-50
50
Grade 5
13-30
20-50
25-50
20-30
50
Grade 6
13-30
30-50
30-45-50
45-50
50
Number of boards
4
7
7
8
5
Table 12: Program categories: Middle immersion at Grade 6
Intensive
Partial
Accumulated hours of instruction in English, Grades 1-6
2900-2970
4100-4500
% of instructional time in English (ranges)
Grade 4
0-27
87
Grade 5
0-27
30-50
Grade 6
13-27
30-50
Number of boards
5
6
16
Table 13: Combinations of programs offered by boards
Middle Immersion (MI)
Early Immersion Program (EI)
Intensive
Partial
Any MI
Program
No MI Program
indicated <950
0
1
1
3
1050-1200
2
0
2
5
1250-1400
0
1
1
6
1480-1900
1
0
1
7
2800
0
1
1
4
Any EI program
3
3
6
25
No EI program
2
3
5
n/a
Table 14: Numbers of boards and students tested by program category Immersion program combinations
Number of boards
Number of tested students* Early Only
<950
3
332
1050-1200
5
491
1250-1400
6
541
1480-1900
7
677
2800
4
1067
Early and Middle
6
3380
Middle Only
5
378
*Based on 1998/99 mathematics test results. Students in boards for which we have program information from the questionnaire survey represented 75-76 percent of tested students depending on skill area.
Choices about Testing at Grade 6
At Grade 6, the main policy choice regarding immersion students was whether to administer the English version or the French translation of the mathematics tests. As shown in Table 15, very few districts availed themselves
17
of the French translation. Those that did tended to have lower totals of accumulated hours of instruction in English. Table 15: Number of boards participating in mathematics tests at Grade 3 and translated versus English language tests by program category
1998/99
In translation
In English
EI <950
1
2
EI 1050-1200
1
4
EI 1250-1400
0
6
EI 1480-1900
1
5
EI 2800
0
4
Early and Middle
0
6
Middle Only
0
4
Test Results: Overall Comparisons of Immersion and Non-immersion Students at Grade 6
As indicated above, at Grade 3, we found that the performance of
immersion and non-immersion students on EQAO tests was broadly similar. Immersion students did somewhat better on literacy tests, but differences were small. Results for mathematics were virtually identical for immersion and non-immersion students. At Grade 6 we found a very different pattern. Immersion students outperformed those in the regular program in all skill areas. Differences were notable, even when we compared these with the differences in performance between regular program students as a whole and those in enrichment. As at Grade 3, immersion students were compared with non-immersion students in districts that offer immersion programs. The English program enrichment group was not restricted to these districts.
Differences in test performance were greatest for reading. Just over half of non-immersion students achieved level 3 or 4, compared to slightly more than 70 percent of immersion students (see Table 16). The performance of immersion students was, in fact, closer to that of English program students in enrichment, although a higher proportion of the latter group reached level 4. On the writing tests (see Table 17), 51 percent of regular program students obtained level 3 or 4; two-thirds of immersion students reached this level. However the writing performance of immersion students was less similar to that of English program students in enrichment than is the case for reading. Results for mathematics (see
18
Table 18) paralleled those for writing. Just under half of regular program students reached level 3 or 4 compared to 62 percent of immersion students and almost 75 percent of English program students in enrichment. Table 16: Distribution of overall reading ratings for immersion and non-immersion students: Grade 6* Immersion Student
Reading Level
1 2 3 4 Count % % % % Yes 2.8 26.5 55.7 15.0 8833 No 10.0 39.4 42.5 8.1 104318 Students in enrichment
5.2 20.9 48.4 25.5 1819
*Comparisons are restricted to boards where immersions students participated in testing. Table 17: Distribution of overall writing ratings for immersion and non-immersion students: Grade 6* Immersion Student
Writing Level
1 2 3 4 Count % % % % Yes 3.5 29.8 48.4 18.3 8779 No 9.7 39.3 40.1 11.0 102769 Students in enrichment
5.0 23.6 44.6 26.8 1802
*Comparisons are restricted to boards where immersions students participated in testing. Table 18: Distribution of overall mathematics ratings for immersion and non-immersion students: Grade 6* Immersion Student
Mathematics Level
1 2 3 4 Count % % % % Yes 5.3 32.4 45.2 17.0 8865 No 13.4 38.2 36.5 11.9 105199 Students in enrichment
6.9 18.5 41.0 33.7 1821
*Comparisons are restricted to boards where immersions students participated in testing.
19
Examining the Results Across Grades 3 and 6
How do we account for the difference in patterns between Grade 3 and Grade 6? Why do immersion students perform as well or only somewhat better than non-immersion students at Grade 3, yet very substantially outperform their peers in the regular program at Grade 6?
It is important to remember that we are dealing here with cross-sectional data; that is, both our Grade 3 and Grade 6 data were for 1998/99. We did not have longitudinal data for the same student cohort. Even if we had 1996/97 data for Grade 3, there would have been no way to link students across test years. Hence we could not be sure what proportion of our immersion students consisted of the same students who had been tested in Grade 3. In the intervening three years, there would have been an influx of middle immersion students and attrition from early immersion between Grade 3 and 6.
However, while our data documented the experiences of students at two different grade levels at one point in time, our explanations are framed in terms of what happens to the same cohort of students between Grades 3 and 6.
Two Hypotheses
There are two main competing hypotheses to explain the divergence in pattern between Grade 3 and Grade 6. We say competing because each invokes a different process, however, in practice both processes (or neither) may be at work. The first might be termed the extended lag hypothesis. This proposes that immersion students’ test scores at Grade 3 seriously under-represent their actual academic abilities or at least aptitudes. While immersion students do at least as well as those in the regular program, they are still in the grip of a lag in performance due to their lesser exposure to instruction in English. This lag is finally overcome between Grades 3 and 6 with the result that test performance, particularly in reading and writing in English, is notably better than that of regular program students.
An alternate explanation is provided by what might be called the self-selection hypothesis. This explains the difference in relative test performance between Grades 3 and 6 by a change in the makeup of the immersion cohort, rather than a change in the abilities of those in the cohort through overcoming a lag in development. The argument here is that progress through the grades coincides with processes that increase the proportion of students in immersion with higher academic abilities. Two processes might be involved. First, within early immersion programs, attrition may be selective; those with lesser academic abilities or special needs are much more likely to leave than others. Second, students who take the risk of self-selecting themselves into middle immersion programs are more likely to be stronger academically than others. Thus attrition “winnows” the initial early immersion cohort and middle immersion offers a
20
gateway for a new influx of academically strong students. The net result is that those in immersion programs at Grade 6 include a larger proportion of academically strong students than at Grade 3.
Both hypotheses are supported by some anecdotal evidence. The self-selection hypothesis corresponds to educators' concerns about elitism in French immersion and its impact on regular English programs. The extended lag hypothesis is congruent with persistent, lingering parental doubts about effects on English language skills and subject learning. However, there is little “hard” data to test these claims. We are, unfortunately, not in a position to do much to remedy this situation. We have neither developmental data on immersion students’ aptitudes, academic preparedness, or abilities; nor data on characteristics of students moving out of and into immersion programs between Grades 3 and 6. What we do have, however, is information on test outcomes by program design. It is worth speculating how the scenarios offered by these two hypotheses (extended lag, self-selection) might entail detectable differences among immersion programs.
The extended lag hypothesis
The extended lag hypothesis applies only to students in early immersion programs. We have found that at Grade 3, test performance bore little relationship to the extent of instruction in English. We might reason on this basis that all programs fell below some threshold of instruction in English sufficient to alleviate the lag (although students in near total immersion experienced more difficulties than others). Given that at Grade 6 there was considerable variation in student accumulated class time in English, it is plausible to expect that not all programs reached whatever (unknown) threshold was needed to dissipate the extended lag effect. We should thus find, over some range of accumulated hours in English, marked differences in student performance on the EQAO tests. Better test performance should be associated with larger total accumulated hours of instruction in English. (The self-selection hypothesis might be made to yield an opposite prediction, that is, that attrition would be highest, the more French-intensive the program. On this basis we might expect stronger test performance in programs with fewer accumulated hours in English. However, this appears overly simplistic given the complex set of factors involved in attrition, in particular the nature of screening at entry and the level of support for special needs students).
The self-selection hypothesis
The self-selection hypothesis applies to all programs and program combinations, although the dynamics of self-selection vary depending on a particular district’s program offerings. Clearly when a district offers only early immersion, attrition alone is a potential source of self-selection. In order to arrive at testable hypotheses we need to make judgements about the relative impact of
21
attrition in early immersion versus self-selection in middle immersion. Here we assume that the self-selection into middle immersion has a greater impact on ability levels than attrition out of early immersion. We thus expect higher test scores in districts with middle immersion only, or both middle and early immersion programs, than those with early immersion alone.
If we do not find the predicted differences, it may be because we have misjudged the relative strengths of attrition and self-selection. However, if the hypothesis is supported, it provides important evidence for composition rather than lag effects. This is true even though the lag hypothesis might also predict the same result, since middle immersion entrants would not be subject to an extended lag effect. At this level, even if the lag hypothesis is correct, higher test scores for districts with middle immersion programs still may represent a composition effect. If anything, it suggests that release from an extended lag is at best a secondary factor in accounting for the differences in patterns of test scores at Grades 3 and 6, unless strong differences also appear among early immersion programs, related to accumulated hours of instruction in English. In the next section we look at the evidence.
Test Results by Type of Program at Grade 6
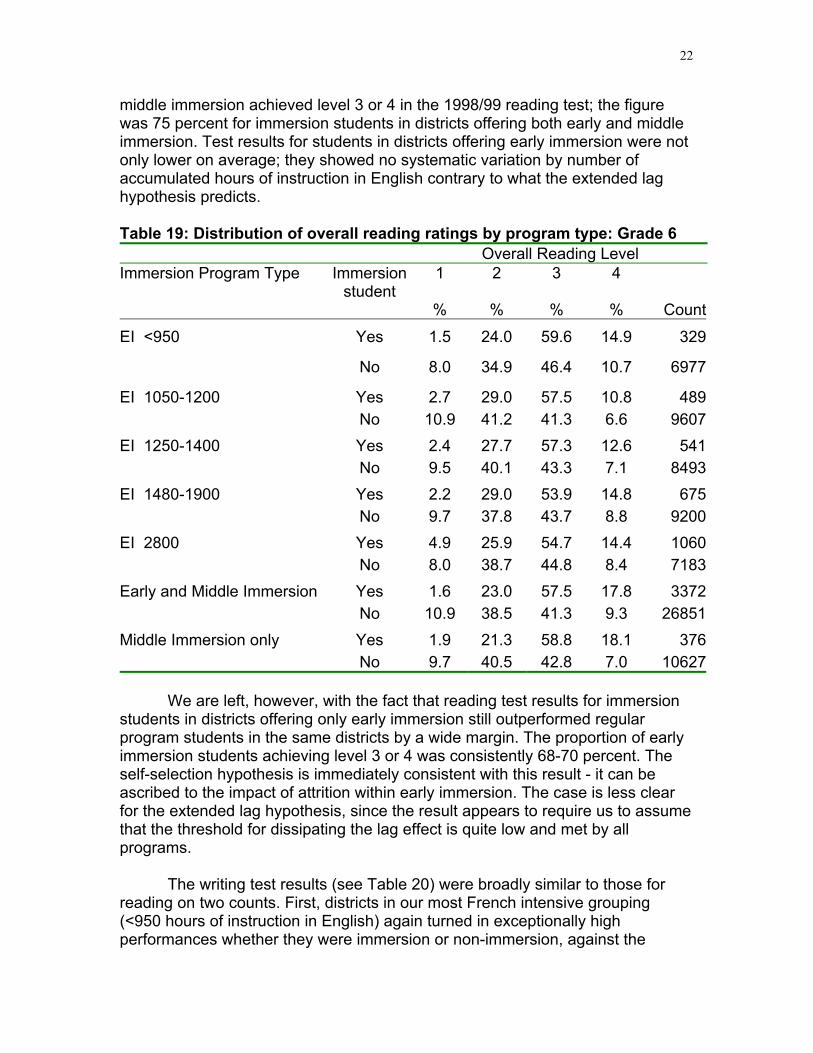
The reading test results offer some support for the self-selection hypothesis through the derived predictions about program outcomes (see Table 19). To make this case, we needed to set aside the results for the districts offering immersion programs with the smallest number of accumulated hours in English (<950 hours). Reading test performance in these districts was exceptionally high for both immersion and non-immersion students in comparison to others in the same program. This suggests that there were factors affecting student outcomes in both programs that had little to do with the extended lag or self-selection hypotheses.
Once we had excluded the districts offering French immersion programs with less than 950 hours of English instruction, the pattern of test results offered some support for the self-selection hypothesis, specifically in terms of the impact of the influx of middle immersion students. First of all, the reading test results for regular program students across our six remaining groupings all fell within a narrow range. Between 48 and 53 percent of students reached level 3 or 4. Thus, there was little evidence of extraneous factors producing differences in student outcomes across grouping. Thus differences among immersion programs can likely be attributed to factors specific to these programs.
The pattern of immersion results conforms to predictions based on the self-selection hypothesis. Students in districts with middle immersion programs alone, or a mix of early and middle immersion programs, did somewhat better than those in districts with early immersion alone, regardless of program design. Over three-quarters (77 percent) of immersion students in districts offering only
22
middle immersion achieved level 3 or 4 in the 1998/99 reading test; the figure was 75 percent for immersion students in districts offering both early and middle immersion. Test results for students in districts offering early immersion were not only lower on average; they showed no systematic variation by number of accumulated hours of instruction in English contrary to what the extended lag hypothesis predicts.
Table 19: Distribution of overall reading ratings by program type: Grade 6
Overall Reading Level Immersion Program Type Immersion
student 1 2 3 4
% % % % Count EI <950
Yes
1.5
24.0
59.6
14.9
329
No
8.0
34.9
46.4
10.7
6977
EI 1050-1200
Yes
2.7
29.0
57.5
10.8
489
No 10.9 41.2 41.3 6.6 9607 EI 1250-1400
Yes
2.4
27.7
57.3
12.6
541
No 9.5 40.1 43.3 7.1 8493 EI 1480-1900
Yes
2.2
29.0
53.9
14.8
675
No 9.7 37.8 43.7 8.8 9200 EI 2800
Yes
4.9
25.9
54.7
14.4
1060
No 8.0 38.7 44.8 8.4 7183 Early and Middle Immersion
Yes
1.6
23.0
57.5
17.8
3372
No 10.9 38.5 41.3 9.3 26851 Middle Immersion only
Yes
1.9
21.3
58.8
18.1
376
No 9.7 40.5 42.8 7.0 10627
We are left, however, with the fact that reading test results for immersion students in districts offering only early immersion still outperformed regular program students in the same districts by a wide margin. The proportion of early immersion students achieving level 3 or 4 was consistently 68-70 percent. The self-selection hypothesis is immediately consistent with this result - it can be ascribed to the impact of attrition within early immersion. The case is less clear for the extended lag hypothesis, since the result appears to require us to assume that the threshold for dissipating the lag effect is quite low and met by all programs.
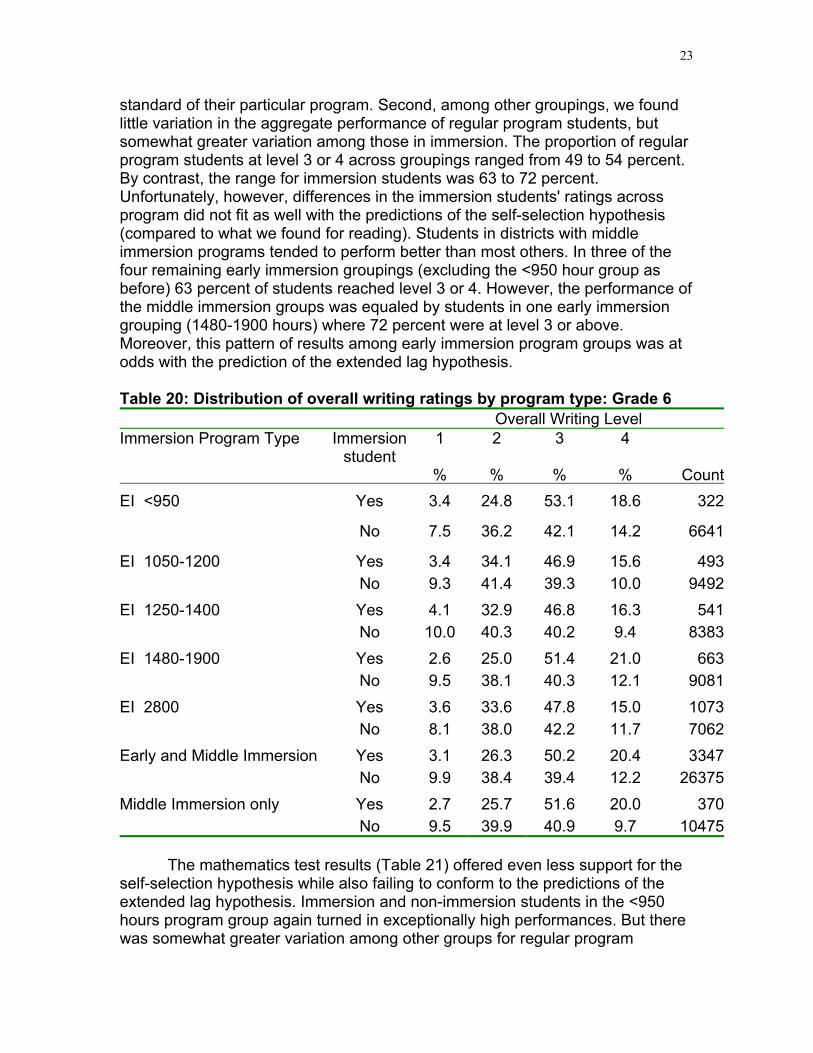
The writing test results (see Table 20) were broadly similar to those for reading on two counts. First, districts in our most French intensive grouping (<950 hours of instruction in English) again turned in exceptionally high performances whether they were immersion or non-immersion, against the
23
standard of their particular program. Second, among other groupings, we found little variation in the aggregate performance of regular program students, but somewhat greater variation among those in immersion. The proportion of regular program students at level 3 or 4 across groupings ranged from 49 to 54 percent. By contrast, the range for immersion students was 63 to 72 percent. Unfortunately, however, differences in the immersion students' ratings across program did not fit as well with the predictions of the self-selection hypothesis (compared to what we found for reading). Students in districts with middle immersion programs tended to perform better than most others. In three of the four remaining early immersion groupings (excluding the <950 hour group as before) 63 percent of students reached level 3 or 4. However, the performance of the middle immersion groups was equaled by students in one early immersion grouping (1480-1900 hours) where 72 percent were at level 3 or above. Moreover, this pattern of results among early immersion program groups was at odds with the prediction of the extended lag hypothesis.
Table 20: Distribution of overall writing ratings by program type: Grade 6
Overall Writing Level Immersion Program Type Immersion
student 1 2 3 4
% % % % Count EI <950
Yes
3.4
24.8
53.1
18.6 322
No
7.5
36.2
42.1
14.2 6641
EI 1050-1200
Yes
3.4
34.1
46.9
15.6 493
No 9.3 41.4 39.3 10.0 9492 EI 1250-1400
Yes
4.1
32.9
46.8
16.3 541
No 10.0 40.3 40.2 9.4 8383 EI 1480-1900
Yes
2.6
25.0
51.4
21.0 663
No 9.5 38.1 40.3 12.1 9081 EI 2800
Yes
3.6
33.6
47.8
15.0 1073
No 8.1 38.0 42.2 11.7 7062 Early and Middle Immersion
Yes
3.1
26.3
50.2
20.4 3347
No 9.9 38.4 39.4 12.2 26375 Middle Immersion only
Yes
2.7
25.7
51.6
20.0 370
No 9.5 39.9 40.9 9.7 10475
The mathematics test results (Table 21) offered even less support for the self-selection hypothesis while also failing to conform to the predictions of the extended lag hypothesis. Immersion and non-immersion students in the <950 hours program group again turned in exceptionally high performances. But there was somewhat greater variation among other groups for regular program
24
students, suggesting that local factors may have been more important than was the case for literacy skills. Among regular program students, the proportion of students reaching level 3 or 4 ranged from 43 to 51 percent. Among immersion students there was quite substantial variation, from 51 to 71 percent, in the proportion of students at levels 3 and 4. However, there was no clear pattern favoring middle immersion groups over others (the self-selection hypothesis) or, among early immersion program groups, favoring those with higher totals of accumulated hours of instruction in English (the extended lag hypothesis). Table 21: Distribution of overall mathematics ratings by program type: Grade 6
Overall Mathematics Level Immersion Program Type Immersion
student 1 2 3 4
% % % % Count EI <950
Yes
1.8
26.8
47.3
24.1
332
No
9.2
33.1
40.0
17.7
6737
EI 1050-1200
Yes
5.1
44.0
42.8
8.1
491
No 15.4 41.5 34.8 8.3 9679 EI 1250-1400
Yes
2.4
27.0
49.2
21.4
541
No 12.6 38.4 37.6 11.4 8583 EI 1480-1900
Yes
4.7
34.9
43.1
17.3
677
No 13.0 37.3 37.5 12.1 9227 EI 2800
Yes
8.9
35.1
43.2
12.8
1067
No 12.0 40.7 36.4 10.9 7267 Early and Middle Immersion
Yes
3.6
29.1
47.2
20.1
3380
No 13.6 35.5 35.9 15.0 27150 Middle Immersion only
Yes
4.2
31.2
45.0
19.6
378
No 13.6 40.4 36.1 9.9 10638
Summary of Test Results
In summary, at Grade 6 in contrast to Grade 3, students in immersion clearly outperformed those in the regular program on EQAO tests in both literacy and mathematics. Differences were notable even in comparison to the performance of the highly selected English program enrichment group. What had changed since Grade 3? One hypothesis is that test results at Grade 3 did not really reflect the greater academic strengths of immersion students. There was an extended lag in development that was remedied sometime after Grade 3 with further accumulated hours of instruction in English. We have termed this the extended lag hypothesis. A second hypothesis is that immersion students
25
become more self-selected on academic strength as weaker students leave early immersion programs, and students of above average academic ability undertake middle immersion. We have called this the self-selection hypothesis.
We derived predictions from these two hypotheses regarding differences in performance among program groupings. In testing these, we found no support for the extended lag hypothesis and weak and inconsistent support for the self-selection hypothesis. This suggests that there may be no simple, single-factor explanation for differences in patterns of immersion/non-immersion differences at Grades 3 and 6. THE QUESTIONNAIRE RESULTS
We turn now to an examination of research questions 3 and 4 based on
the findings from our questionnaire: (1) How have the provincial tests affected policy and/or program design, enrolment patterns, and attrition rates in early French immersion? (2) Are French immersion students' results on the EQAO tests publicized, disseminated and compared to regular English program students’ results? If so, how?
One might have expected that the provincial testing would have an impact on school district policies and practices relating to the starting grade for introducing English language arts and the relative intensity of exposure to French. Since immersion began in Ontario in 1969, parents have consistently expressed concern for the development of their children’s English mother tongue skills. Parents have not always been reassured by the stable pattern of results from across Canada showing that within one year or so of the introduction of formal English language arts into the early French immersion curriculum, anglophone children catch up to their peers in the regular English program in English literacy, and on those parts of standardized mathematics tests that require reading (i.e. problem solving). School districts are also concerned about their schools’/students’ performance.
The school district questionnaire we developed for this study targeted possible changes in school or board policies since the 1996-97 academic year as well as perceptions of the effects of the testing program.
Changes in School Board Policies
The responses to question 4 of the questionnaire suggest that while one third (n= 12) of the boards reported no change in district or school policies over the past three years, 7 reported such changes and 14 said changes were currently under discussion; thus 60 percent of districts (21 of 35) had implemented or were contemplating policy changes relating to the teaching of English language arts in immersion since the beginning of EQAO testing.
26
Impact of EQAO Testing
Question 15 in the questionnaire asked if the EQAO results initiated or contributed to discussions on five different themes (see Table 22). Three themes were cited as contributing to such discussions by about one third of the responding boards: appropriate grade to begin English language arts within early immersion programs, appropriate amount of time to devote to English language arts in French immersion once it is introduced, and appropriate subjects to be taught in English once English is introduced. For the latter issue, however, 50 percent of responding boards (n = 18) said that it did not apply.
The EQAO testing did not appear to initiate or contribute to discussions about whether to continue French immersion programs (33 districts said that this was not applicable or they did not offer a response) or about the appropriate starting grade for immersion (24 boards checked off “does not apply ” or did not respond). Table 22: Did the EQAO results initiate or contribute to discussions on any of the following issues?
Initiated discussions
Contributed
to discussions
Doesn’t
apply/not stated
Issue
Count
%
Count
%
Count
%
Appropriate starting grade for French immersion (i.e. early, middle or late immersion program format).
5
13.9
7
19.4 24 66.7
Appropriate grade to begin English language arts within early immersion programs.
6
16.7
12
33.3
18 50.0
Appropriate amount of time to devote to English language arts in French immersion, once it is introduced.
6
16.7
11
30.6
19 52.8
Whether to continue French immersion programs.
2
5.6
1
2.8 33 91.7
Appropriate subjects to be taught in English, once English is introduced.
7
19.4
11
30.6 18 50.0
Enrolment and Attrition
With respect to enrolment patterns, question 6 responses (see Table 23)
indicated considerable stability: 47.2 (n=17), 54.5 (n= 7) and 50 (n=5) percent of reporting districts said that intake into early immersion, middle immersion and late immersion, respectively, had “stayed about the same” since EQAO testing began. Eight boards (26.7%) reported that early immersion enrolment had
27
increased steadily over the past three years and three boards (27.3%) reported the same for middle immersion enrolment. Only 2 boards (6.7%) said that early immersion enrolment was consistently down over that period; 1 board (9.1%) indicated the same for middle immersion. Finally, some boards reported fluctuating enrolment (3 for early immersion, 2 for middle immersion and 1 for late immersion). Table 23: For each type of French immersion program in your district, please indicate whether intake has consistently gone up, consistently gone down, stayed about the same or fluctuated up and down over the past three years. Changes to intake Early Immersion Middle Immersion Late Immersion
Count % Count % Count % Consistently gone up 8 26.7 3 27.3 1 10 Consistently gone down 2 6.7 1 9.1 0 0 Stayed about the same 17 56.7 7 54.5 5 50 Fluctuated up and down 3 10 2 9.1 1 10 Not stated 0 0 0 0 3 30
The three most commonly cited main reasons (by 5 boards in each case; see Table 24) for increasing or decreasing enrolment were: changes in the way we organize immersion programs, parents’ views of educational outcomes in immersions, and parents’ views of the future of bilingualism in Canada. No board cited as a main reason “the EQAO testing program at the elementary level”.
A companion question (#8) asked about attrition patterns. Again, there
was a great degree of stability (see Table 25) with 18 or 60% of the districts reporting that the number of students leaving early immersion for any reason up to Grade 6 had stayed about the same over the past three years. About the same percentage of districts reported that attrition in middle and late immersion had also stayed stable over the past three years (54.5% and 60%, respectively). Six districts (16.7 percent) reported fluctuating attrition in early immersion, but only one board (9.1%) reported the same in middle immersion and no board reported fluctuating attrition rates in late immersion. The five boards reporting that attrition had consistently gone up or down offered a variety of explanations (Table 26), with only one citing the EQAO testing program as a major factor, and one as a minor factor.
28
Table 24: If intake in any French immersion program has consistently gone up or consistently gone down, please indicate whether each of the following factors in major, minor, or does not apply. Changes in immersion intake reflect... Major factor Minor factor Does not
apply/not stated
Count % Count % Count % ...changes in the size of the whole student population.
4 33.3 2 16.7 6 50.0
...changes in the way we organize immersion programs.
5 41.7 2 16.7 5 41.6
...changes in staffing in immersion programs.
2 16.7 3 25.0 7 58.4
...changes in other programs available to parents.
2 16.7 3 25.0 7 58.4
...parents' views of educational outcomes in immersion.
5 41.7 3 25.0 4 33.3
...parents' views of the future of bilingualism in Canada.
5 41.7 4 33.3 3 25.0
...the EQAO testing program at the elementary level.
0 0.0 5 44.7 7 58.3
Table 25: For each type of French immersion program in your district, please indicate whether attrition, that is the number of students leaving the program for any reason up to Grade 6, has consistently gone up, consistently gone down, stayed about the same or fluctuated up and down (over the past three years). Changes to attrition Early Immersion Middle Immersion Late Immersion Count % Count % Count % Consistently gone up 2 6.7 3 27.3 0 0 Consistently gone down 3 10 1 9.1 0 0 Stayed about the same 18 60 6 54.5 6 60 Fluctuated up and down 6 16.7 1 9.1 0 0 Not stated 1 3.3 0 0 4 40
29
Table 26: If attrition in any French immersion program has consistently gone up or consistently gone down, please indicate whether each of the following factors is major, minor, or does not apply. Major factor Minor factor Does not
apply/Not stated
Count % Count % Count % Changes in the size of the whole student population
0 0 1 14.3 6 85.7
Changes in the way we organize immersion programs
1 14.3 2 28.6 4 57.2
changes in staffing in immersion programs
1 14.3 2 28.6 4 57.2
changes in other programs available to parents
1 14.3 1 14.3 5 71.4
parents’ views of educational outcomes in immersion
0 0 5 71.4 2 28.6
parents’ views of the future of bilingualism in Canada
1 14.3 4 57.1 2 28.6
the EQAO testing program at the elementary level
1 14.3 1 14.3 5 71.4
Dissemination of EQAO Test Results
Table 27 shows that school districts used multiple methods to disseminate
information about the EQAO testing results. The alternative least cited (and yet listed by 11 to 16 boards reporting on years 1996-97, 1997-98 and 1998-99) was “published in a District newsletter or a special report sent to parents.” More frequently cited were; available at district offices, available at local schools, published in school reports sent to parents, presented at school council meetings, presented at parent meetings at school, and published by local news media. Over time, an increasing proportion of districts reported using each of the listed means of disseminating information on EQAO testing.
30
Table 27: How are EQAO results provided to parents in your district after each of the assessments? 1996/97 1997/98 1998/99 Count % Count % Count % Available at district offices. 22 61.1 25 69.4 29 80.6 Available at local schools. 26 72.2 28 77.8 32 88.9 Published in a District newsletter or a special report sent to parents.
11 30.6 14 38.9 16 44.4
Published in school reports sent to parents.
17 47.2 20 55.6 25 69.4
Presented at school council meetings. 23 63.9 26 72.2 30 83.3 Presented at parent meetings at school.
17 47.2 18 50 19 52.8
Published by local news media. 20 55.6 21 58.3 24 66.7
Table 28 suggests that across the three testing years there was an increasing number of districts who provided comparisons of results for French immersion and regular program students for various stakeholders. The most dramatic example was that of school principals: in 1996-97 such comparisons were provided for school principals in 8 districts (22 percent), in 1997-98 in 12 districts (33 percent) and in 1998-99 in 19 districts (53 percent). The increasing trend to provide comparative statistics held for all categories: trustees, board staff, program coordinators and consultants in immersion, French immersion teachers, parents of children in French immersion and the media. Few respondents to our questionnaire offered characterizations of the reactions of the above groups to these comparisons; in general when reactions were reported, they were mixed.
Table 28: Did you provide comparisons of results for French immersion and regular program students for any of the following groups? 1996/97 1997/98 1998/99 Count % Count % Count % Trustees 6 16.7 9 25 11 30.6 Board staff 7 19.4 10 27.8 13 36.1 Program coordinators, consultants, etc. in French immersion.
8 22.2 9 25 13 36.1
Principals in schools with French immersion programs.
8 22.2 12 33.3 19 52.8
French immersion teachers. 7 19.4 10 27.8 14 38.9 Parents of children in French immersion.
4 11.1 6 16.7 10 27.8
The media 3 8.3 5 13.9 7 19.4
31
SUMMARY
In this section we return systematically to each of the research questions that guided this study to summarize our findings and to draw implications from them. Question 1: How do French immersion students perform on the provincial Grade 3 tests of reading, writing and mathematics, compared to regular English program students? Do all French immersion programs choose the same testing option? Is this choice consistent within the same school board?
Overall, at Grade 3, immersion students did somewhat better than English program students on literacy tests, but differences were small. At Grade 3, French immersion students who had little exposure to English language arts instruction lagged somewhat behind their English program counterparts. Results for mathematics were virtually identical for immersion and non-immersion students at Grade 3. By Grade 6, French immersion students achieved better overall results on the EQAO reading, writing and mathematics tests.
Testing policy decisions were made at the school board level and all schools in the board were bound by these decisions. At the Grade 3 level, some school boards opted out of literacy testing at Grade 3. In the case of mathematics, at Grade 3, a notable number of boards tested math via French, and this number increased from 1996-1999. At Grade 6, mathematics testing occurred in English. Question 2: Do French immersion student performances on the provincial tests differ depending on the grade at which English language arts is introduced?
Scores were virtually identical when comparisons were made across program types, according to the grade at which English language arts was introduced. Total French immersion program students (i.e., those who start English in Grade 4) were the exception: fewer of these students achieved results in the 3 or 4 range as compared to the regular English program students. However, based on a cross-sectional comparison, we can predict that these students will catch up and surpass their English counterparts by Grade 6. Question 3: How have the provincial tests affected policy and/or program design, enrolment patterns, and attrition rates in early French immersion?
The EQAO testing program has generally not sparked discussion of the continuation of immersion. The existence of French immersion programs was not in question. However, since the beginning of the EQAO testing program, policy discussions have occurred about the grade at which English language instruction
32
is optimally introduced, and about the instructional time that should be devoted to it.
Most participating school boards indicated that enrolment in French immersion has either remained stable or increased since the EQAO testing program began. Most school boards reported similarly stable attrition patterns since the beginning of the EQAO testing program. Question 4: Are French immersion students' results on the EQAO tests publicized, disseminated and compared to those of students in the regular English program? If so, how?
Most participating school districts reported that they use a variety of methods to disseminate information about the results of the EQAO testing, including school reports sent to parents, presentations at school council and parent meetings, local news media articles and district newsletters. There appears to be an increasing tendency for school districts to provide comparisons of results for French immersion and regular program students. IMPLICATIONS
The results from this study corroborate those of large-scale evaluation studies of French immersion programs conducted some 20 years ago. Students in total early French immersion who opted to do the EQAO tests demonstrated a certain lag in English literacy skills at Grade 3 as compared to students in regular English programs. This is consistent with earlier results. However, immersion students exposed to some instruction in English language arts (even if only at the Grade 3 level) performed as well as students in the regular program. Moreover, at Grade 6, immersion students’ literacy test scores were notably better than their peers’ in English programs, and at both Grade 3 and 6, the immersion students’ mathematics test scores were almost identical to those of their peers in the English program, even though mathematics had been taught in French in most cases from Grades 1 to 3.
Although research from the 70s and 80s had already clearly communicated this message, the findings from our study, conducted in a different socio-political climate in education, with tests that are more curriculum-based, add further support to this research and may be perceived as a more accurate reflection of the current situation.
We believe that EQAO, the provincial government and decision makers will find these cross-sectional results useful and enlightening. Our analyses of EQAO test results suggest that school boards should not be considering fundamental changes in their immersion programs. It is notable that our questionnaire findings also indicate that EQAO testing has not sparked discussions about the existence of French immersion programs. In addition,
33
school boards have reported that intake and attrition rates in immersion programs have remained stable since the beginning of the EQAO testing.
Parental organizations and others involved in promotion of immersion programs should also benefit from our results. Parents considering French immersion programs for their children must receive the message that French immersion does not have a negative impact on students’ literacy and mathematics skills in English. We urge EQAO and organizations such as Canadian Parents for French, Ontario Modern Language Teachers Association and the Canadian Association of Immersion Teachers to continue their efforts to communicate these messages to parents and decision-makers. We also encourage school districts to continue reporting comparisons of EQAO test results for French immersion and regular program students through school bulletins sent to parents, presentations at school council and parent meetings, local news media articles and district newsletters.
While there are no mandated consequences of EQAO test results, in the current climate the tests are seen as high-stakes for parents, individual boards and schools, and possibly, individual teachers and students. It is therefore not surprising that EQAO testing has resulted in some discussion in school boards about the most appropriate grade at which to introduce English language arts instruction in French immersion and the amount of instructional time to devote to it. However, we believe that the results from this and other studies suggest that these discussions are unnecessary. French immersion students are not disadvantaged in English in the medium- to long-term. Results from many studies also show that early total French immersion students’ French skills are better than those of students who receive less intensive instruction in French. It is thus logical to immerse students as much as possible in French in early grades while introducing English instruction gradually.
The link between language of testing language of instruction and achievement is an interesting theoretical, empirical and policy-level question. EQAO has addressed parents’ and teachers’ concerns that it is not fair for French immersion students to be obliged to do mathematics tests in English when they have been taught mathematics in French: At Grade 3, school boards can choose to do an English or a French (in translation) version of the mathematics tests. An overwhelming proportion of school boards offering early total French immersion programs reported in our questionnaire that they chose the latter option. Some school boards did, however, choose to administer the mathematics tests in English at Grade 3, and all students in Grade 6 are obliged to do these tests in their first language. Our Grade 3 data are too limited to draw firm conclusions about the link between language of testing, language of instruction and student achievement. Nevertheless, our findings suggest that immersion students are not disadvantaged by doing these tests in English even though they have been taught mathematics in French, at least up until Grade 3. Moreover, results at Grade 6 suggest that French immersion students do as well as their English program peers who have been taught mathematics in English since the start of their formal schooling. Even though our findings must be interpreted with caution due to the small number of students who did the
34
mathematics tests in English at Grade 3, our study does corroborate other research with similar findings (Alberta Education, 1991). Future research could investigate this question more thoroughly should more school boards opt to administer the Grade 3 EQAO mathematics tests in English. Our findings are also consistent with the hypothesized transfer of literacy and other skills across languages (Cummins, 1986). Summary of implications For EQAO • We recommend that EQAO consider adapting the current testing policy at
Grade 3 to allow boards to opt out of both literacy and mathematics testing. The results at this grade may not represent immersion students' abilities accurately, and may cause unnecessary stress and concern for parents, teachers and students.
For school boards • Our findings suggest that no fundamental changes in immersion programs
are necessary because of fears that immersion students will suffer due to EQAO testing.
For parents • Parents should be cautious in interpreting lower-than-expected test results at
Grade 3. Our cross-sectional results indicate that by Grade 6, most French immersion students recover from any lags in literacy skills that may have been a concern at Grade 3.
For researchers • More research is clearly needed to investigate the links between language of
testing, instruction and achievement.
35
REFERENCES Alberta Department of Education. (1991). Language of testing report. Edmonton, AB: Author. Cummins, J. (1986). Linguistic interdependece: A central principle of bilingual education. In J. Cummins & M. Swain (Eds.), Bilingualism in education. London: Longman. EQAO. (1998-1999). Ontario provincial report on achievement. English language schools. Toronto, ON: Author. Genesee, F. (1987). Learning through two languages. Cambridge, MA: Newbury House.
Lapkin, S. (1982). The English writing skills of French immersion pupils at Grade 5. Canadian Modern Language Review, 39, 24-33.
Lapkin, S., & Swain, M., with Shapson, S. (1990 and 1992). French immersion research agenda for the 90s. The Canadian Modern Language Review, 46 (4), 638-674. Reprinted in S. Rehorick & V. Edwards (Eds.), French immersion: Process, product and perspectives. Welland, Ontario: The Canadian Modern Language Review.
Peel Board of Education. (1992). Immersion and extended French
program review. Research report No. 91-10. Mississauga, ON: Author. Swain, M. (1975). The writing skills of grade three French immersion
pupils. Working Papers on Bilingualism, 7, 1-38. Swain, M. & Lapkin, S. (1982). Evaluating bilingual education: A Canadian
case study. Clevedon, Avon: Multilingual Matters.
36
APPENDIX Immersion Education and the EQAO Assessment
As described in the cover memo, this short questionnaire is part of a study that examines the performance of French immersion students on EQAO assessments at Grades 3 and 6, and their possible impact on program design. We are using this questionnaire to gather some basic information about French immersion education in your district which we cannot obtain elsewhere. This includes current program offerings and current enrolment. We would also like to know whether your district has made any substantial changes in the organization of immersion programs (or if there are current discussions about possible changes) due, at least in part, to the provincial tests. Finally, we are interested in how you use the information provided by EQAO assessment with regard to French immersion programs and parents of children in the program. Thank you for you assistance with our study. Section 1: Immersion Programs 1. What types of French immersion programs do schools in your district currently offer?
Which programs have been offered by these schools in the past three years (if different from now)? Please check as many as apply.
early immersion
middle immersion
late immersion
Currently
In past three years
2. At what grades can students begin a French immersion program in your district.
Please circle as many as apply.
K
1
2
3
4
5
6
7
8
37
3. The following questions ask about use of English in French immersion programs. The questions DO NOT represent or endorse any particular view of when it is appropriate to introduce formal instruction in English.
For each French immersion program offered in your district please indicate (whichever is
easiest) either the number of minutes OR the percentage of class time students are taught in English at each grade, if any. If there are differences among schools with the same program, please tell us about the most typical situation. Where there is no instruction in English, please enter “0".
Grade
Program 1
Program 2
Program 3
K
___ minutes or ___ %
___ minutes or ___ %
___ minutes or ___ %
1
___ minutes or ___ %
___ minutes or ___ %
___ minutes or ___ %
2
___ minutes or ___ %
___ minutes or ___ %
___ minutes or ___ %
3
___ minutes or ___ %
___ minutes or ___ %
___ minutes or ___ %
4
___ minutes or ___ %
___ minutes or ___ %
___ minutes or ___ %
5
___ minutes or ___ %
___ minutes or ___ %
___ minutes or ___ %
6
___ minutes or ___ %
___ minutes or ___ %
___ minutes or ___ %
4. What subjects, if any, are taught in English at each grade level? If no subjects are taught
in English at a particular grade in the program, please put an X in the box. Grade
Program 1
Program 2
Program 3
K
subjects:
subjects:
subjects:
1
subjects:
subjects:
subjects:
2
subjects:
subjects:
subjects:
3
subjects:
subjects:
subjects:
4
subjects:
subjects:
subjects:
5
subjects:
subjects:
subjects:
6
subjects:
subjects:
subjects:
38
5. Do you have any immersion centres in the district, that is where all the classes in the
school are French immersion classes?
Yes No 6. Over the past three years, has there been any change in district or school policies about
teaching in English within French immersion programs, between Grades K to 6? Please check.
No Yes Currently being talked about
IF you answered yes or “currently being talked about”, please briefly describe the changes made or talked about:
____________________________________________________________________________________________________________________________________________________________ What was the main reason for making these changes?
7. For each type of French immersion program in your district, please indicate the approximate enrolment at the elementary level (K - 8).
Program 1
Program 2
Program 3
Enrolment K -8 (1999/2000)
_____________
_____________
_____________ 8. For each type of French immersion program in your district, please indicate
whether intake has consistently gone up, consistently gone down, stayed about the same or fluctuated up and down over the past three years? Please check.
Changes to Intake
Program 1
Program 2
Program 3
Consistently gone up
Consistently gone down
Stayed about the same
Fluctuated up and down
39
9. If intake in any French immersion program has consistently gone up or consistently gone down, please indicate whether each of the following factors is major, minor, or does not apply. Please add factors of your own that we have not included in our list.
Changes in immersion intake reflect...
Major factor
Minor factor
Does not
apply ...changes in the size of the whole student population.
...changes in the way we organize immersion programs.
...changes in staffing in immersion programs.
...changes in other programs available to parents.
...parents’ views of educational outcomes in immersion.
...parents’ views of the future of bilingualism in Canada.
...the EQAO testing program at the elementary level.
Other _______________________________________________
10. For each type of French immersion program in your district, please indicate
whether attrition, that is the number of students leaving the program for any reason up to Grade 6, has consistently gone up, consistently gone down, stayed about the same or fluctuated up and down? Please indicate what has happened to attrition in each program over the past three years. Please check.
Changes to Attrition
Program 1
Program 2
Program 3
Consistently gone up
Consistently gone down
Stayed about the same
Fluctuated up and down
40
11. If attrition in any French immersion program has consistently gone up or consistently gone down, please indicate whether each of the following factors is major, minor, or does not apply. Please add factors of your own that we have not included in our list.
Changes in immersion attrition reflect...
Major factor
Minor factor
Does not
apply ...changes in the size of the whole student population.
...changes in the way we organize immersion programs.
...changes in staffing in immersion programs.
...changes in other programs available to parents.
...parents’ views of educational outcomes in immersion.
...parents’ views of the future of bilingualism in Canada.
...the EQAO testing program at the elementary level.
Other _______________________________________________
Section 2: EQAO Results 12. Which option was most used in your district for immersion students regarding EQAO testing at Grades 3 and 6?
Grade 3
Grade 6
Reading and writing
Mathematics
Read/Write
Mathematics
1996 /97
1997 /98
1998 /99
1996 /97
1997 /98
1998 /99
1998 /99
1996 /97
1997 /98
1998 /99
Did not do.
Did in English.
Did French translation of test.
41
13. Was there a single district policy in place or did individual schools make their own decisions about what option to follow for immersion students?
Grade 3
Grade 6
Reading and writing
Mathematics
Read/Write
Mathematics
1996 /97
1997 /98
1998 /99
1996 /97
1997 /98
1998 /99
1998 /99
1996 /97
1997 /98
1998 /99
District wide policy
Schools decide
14. How are EQAO results provided to parents in your district after each of the assessments? Please add additional methods that we have not included in our list.
1996/97
1997/98
1998/99
Available at district offices.
Available at local schools.
Published in a District newsletter or a special report sent to parents.
Published in school reports sent to parents.
Presented at school council meetings.
Presented at parent meetings at school.
Published by local news media.
Other _________________________________________________
15. Did you provide comparisons of results for French immersion and regular program students for any of the following groups. Please check for each assessment year. Please add any other groups that we have not included in our list.
1996/97
1997/98
1998/99
Trustees
Board staff
Program coordinators, consultants, etc . in French immersion.
Principals in schools with French immersion programs.
French immersion teachers.
Parents of children in French immersion.
The media
Other _________________________________________________
16. If you made comparisons available to any of the above groups, please
characterize any reactions you are aware of, in terms of whether they were positive about the results, neutral or negative.
very
positive
positive
mixed/ neutral
negative
very
negative
Doesn’t apply
Trustees
Board staff
Program coordinators, consultants, etc . in French immersion.
Principals in schools with French immersion programs.
French immersion teachers.
Parents of children in French immersion.
Parents in regular program
Other ______________________
Other_______________________
43
17. Did the EQAO results initiate or contribute to discussions on any of the following issues. Please add any issues of your own that are not included n our list.
Issue
Initiated discussions
Contributed to discussions
Doesn’t apply
Appropriate starting grade for French immersion (i.e. early, middle or late immersion program format).
Appropriate grade to begin English language arts within early immersion programs.
Appropriate amount of time to devote to English language arts in French immersion, once it is introduced.
Whether to continue French immersion programs.
Appropriate subjects to be taught in English, once English is introduced.
Other ___________________________________________
Please feel free to make additional comments:
Thank you for your time and effort!
Please send me a summary of the results. ______________________________________________________________________________ Please return completed survey to Dr. Doug Hart OISE/UT 252 Bloor ST. West RM 12-106 Toronto, Ontario M5S 1V6