63
French methodology for hot bituminous mix design Yves BROSSEAUD Senior researcher IFSTTAR – ex LCPC FRANCE www.ifsttar.fr

French methodology for hot bituminous mix design
Yves BROSSEAUD Senior researcher
IFSTTAR – ex LCPC FRANCE
www.ifsttar.fr

Framework
Mix design presentation Method Tests and devices Performances – specifications Pertinence of method : comparison lab/field Conclusion
Method and overview

One material type for each need
Optimized with performance based criteria
In relation with its use on the road
Method used in France since more than 25 years old, so with a very long experience
One laboratory test for One performance
Principle
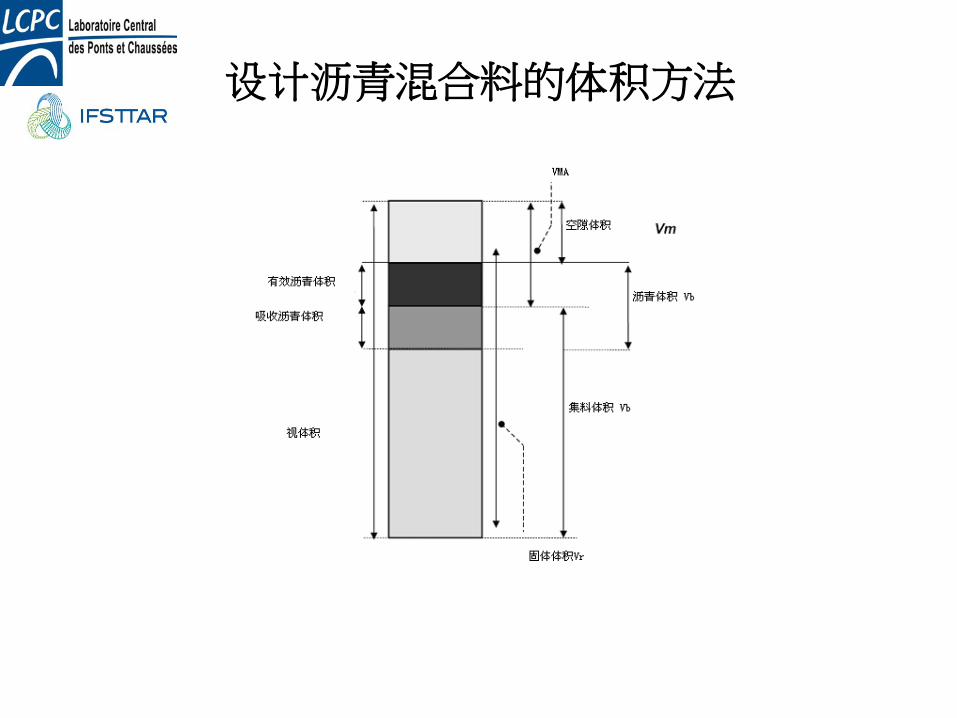
设计沥青混合料的体积方法

Summarise of French mix design – different steps

Mix design and specifications : level 2 PCG + Water + Rutting RESISTANCE (fabrication-preparation sample-checking)
Marshall test
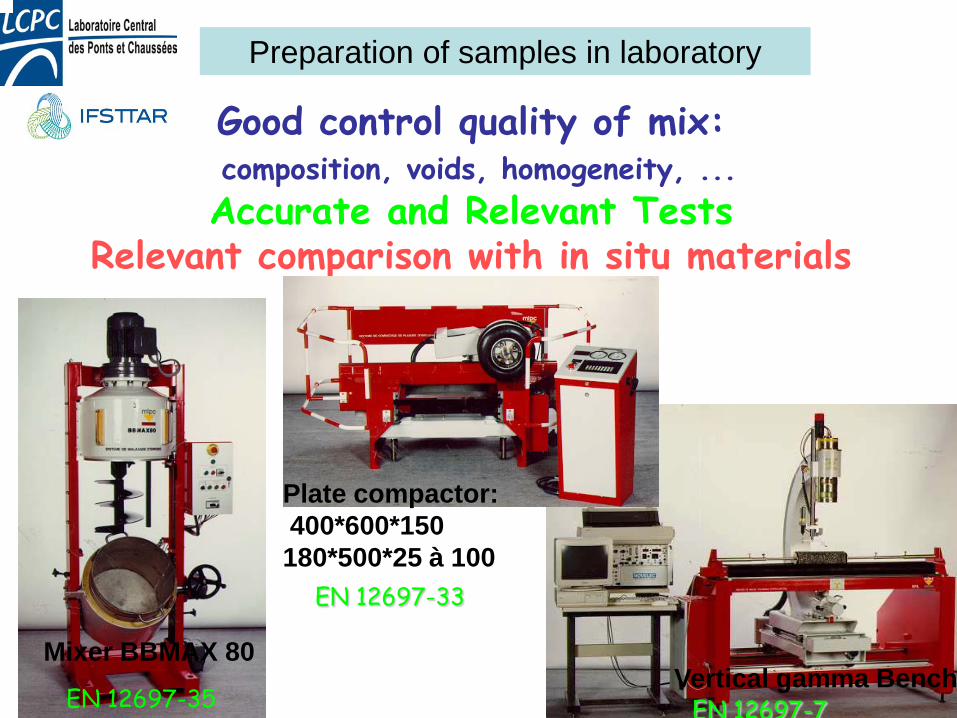
Preparation of samples in laboratory
Good control quality of mix: composition, voids, homogeneity, ... Accurate and Relevant Tests
Relevant comparison with in situ materials
Mixer BBMAX 80
Plate compactor: 400*600*150 180*500*25 à 100
Vertical gamma Bench EN 12697-35 EN 12697-7
EN 12697-33

Design steps
Selection and identification of components Choice: gradation & binder content
Compactability test (gyratory)
Duriez test
Rutting test
Modulus test
Fatigue test
Formulation selected
Level 1
Level 2
Level 3
Level 4
Compaction
Water sensitivity
Rutting
Stiffness
Fatigue
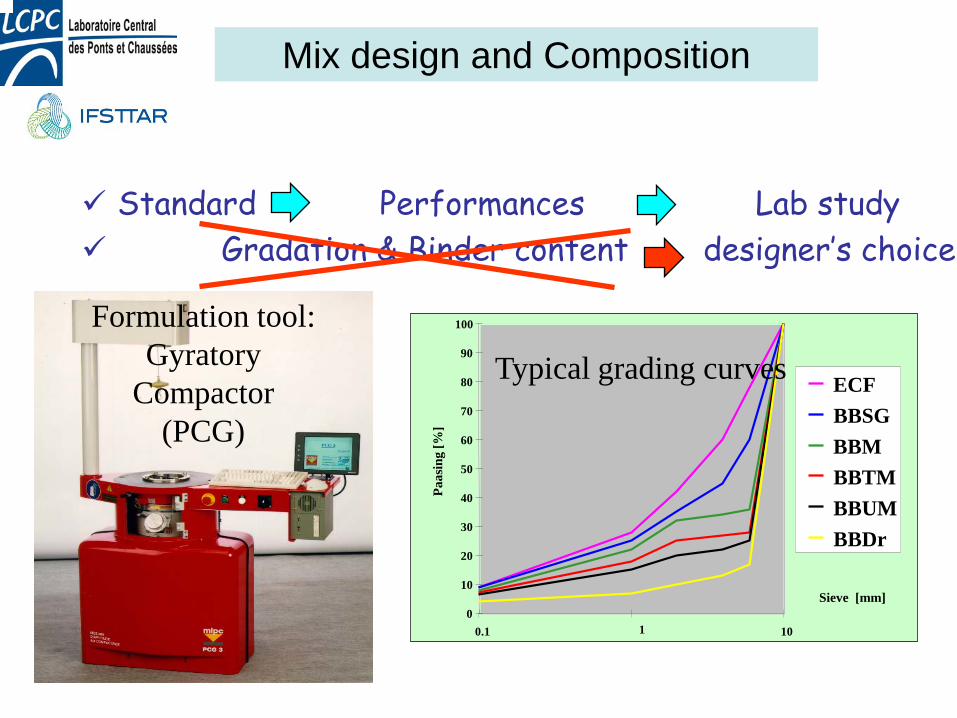
Standard Performances Lab study Gradation & Binder content designer’s choice
Formulation tool: Gyratory
Compactor (PCG)
Mix design and Composition
0
10
20
30
40
50
60
70
80
90
100
0.1 1 10
Sieve [mm]
Paas
ing
[%]
ECF BBSG BBM BBTM BBUM BBDr
Typical grading curves

MLPC Gyratory shear compactor
Gyratory Shear compactor Standard (NF EN 12697-31) Characterisation of void %
reduction under axial force + gyratory shear
Mix design by adjustment of void content according to product standards
Estimation of site void content Vsite = V(Ne)
Ne nbr of cycle as thickness [mm]
r= 0,95 R= 1,38 (% voids 60g)
Compactability characterisation

Void content
Failed
Failed
Interpretation of gyratory compaction test
Conformity study of a mix in relation to product standard specification for each material type ( NF EN 13 108-1 /2 / 7)
Pass

% voids
Number of passes 2 26 16 8 20
10
5
4 6
8 12 cm
Void content versus layer thickness In site compaction process
Main difference with Superpave interpretation: N initial, N design 4%, N max

表2-9 空隙率规范

Water sensitivity : Duriez test
Standard EN 12697-12 exNFP 98-251-1
Two compaction processes D< 14 mm H 190 mm, 60 kN, 5 min D>14 mm H 270 mm, 180 kN, 5 min Stored at 18 °C, 7 days
in air (50 % moisture) in water
Vertical compression (1 mm/s ) Ratio r/R (and % voids) Repeatability and reproducibility
r = 0,08 R =0,13 (ratio of 0,73)
Decision to use of an adhesion agent
European standard used also indirect tensile test (EN 12697-12)

Level 2 : rutting resistance test

Wheel
Rut depth measurement
Standard (EN 12697-22 ex NFP 98-253-1)
Influence of heavy, slow, channelled traffic under high temperature
relevant correlation with site, repeatability (r = 1,2 et R =1,3)
Test conditions: Smooth tire, pressure 0.6 MPa Load 5 kN, speed 1 cycle/s Controlled temperature 60°C
LPC Wheel tracking test
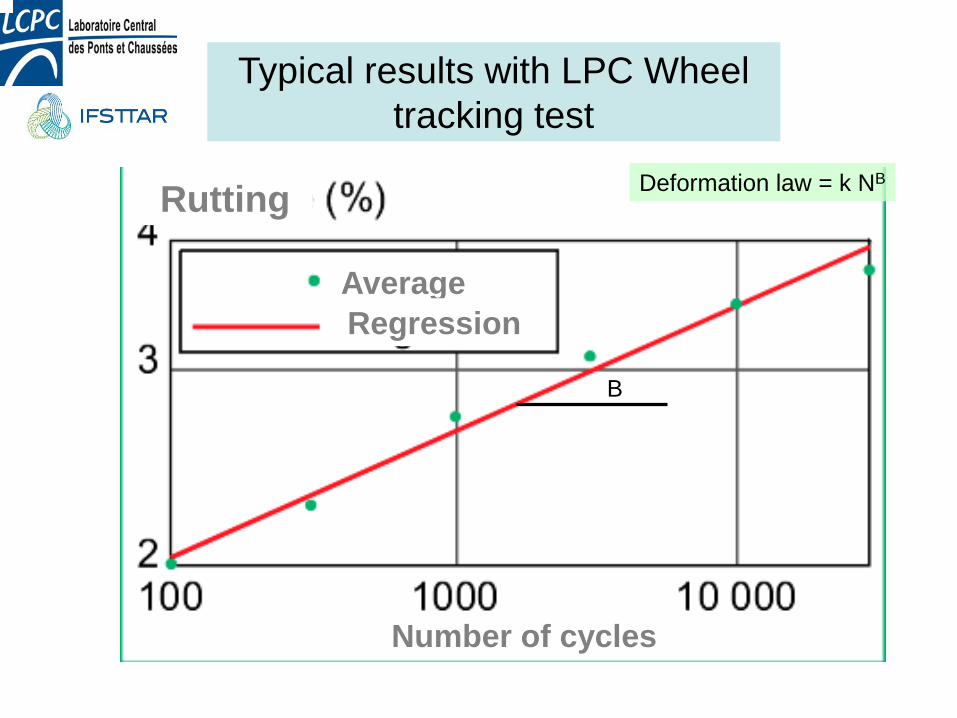
Rutting
Number of cycles
Average Regression
Typical results with LPC Wheel tracking test
Deformation law = k NB
B

Influence of binder type

Influence of sand nature
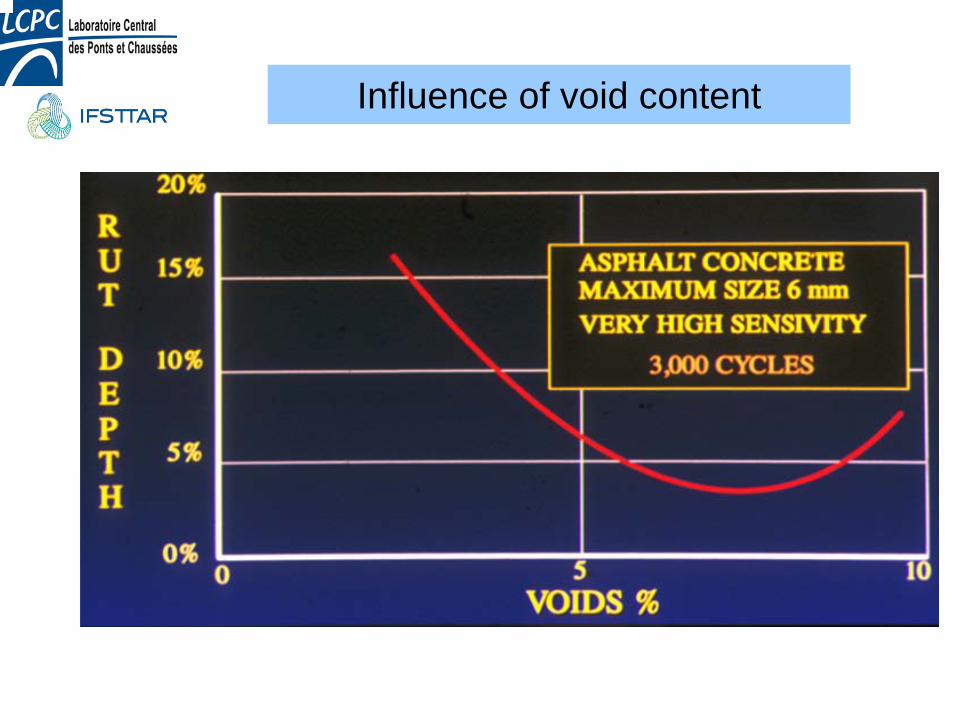
Influence of void content

Comparaison Résultats d ’orniérage (EME)
1
10
100
1000 10000 100000Nbre de cycles
% o
rniè
re
France 20 - 30
Pologne 20- 30
Pologne D 50
Heavy compaction Void content : 5%

Surface stability under loads at 60°C, for BBTM
Test with rutting tester
BBTM 0/10 Rut after
3000 cycles : 10,8% voids 11,5%
HSV = 1,4 mm

Rutting resistance - specifications
Test @ 60 °C
0
4
8
12
16
20
BBA 1
BBA 2
BBA 3
BBME 1
BBME 2
BBME 3
GB 2 to 4
EME 1-2
Rut
dep
th [%
]
Surface Base
Number of cycles 10 000 30 000 10 000 30 000
Out of spec
On spec

Level 3 and 4
Mechanical tests: stiffness measurement (direct
tensile test or 2 points bending on trapezoidal samples)
Fatigue resistance test
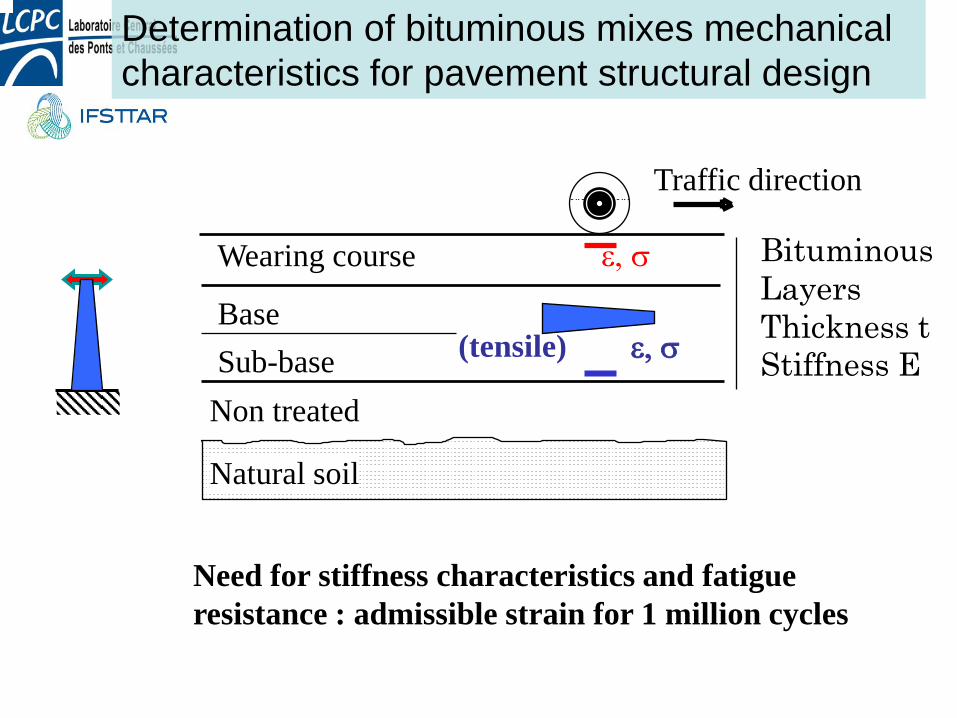
Determination of bituminous mixes mechanical characteristics for pavement structural design
Need for stiffness characteristics and fatigue resistance : admissible strain for 1 million cycles
Traffic direction
Wearing course
Base Sub-base
Natural soil
Bituminous Layers Thickness t Stiffness E ε, σ (tensile)
Non treated
ε, σ

Mechanical tests
Linear domain (modulus test) Frequencies Domain - dynamic test
(complex modulus in flexion)
temporal Domain - quasi-static test (secant modulus in traction)
Damage domain (fatigue, test in flexion with impose
constant displacement)

Test conditions : Frequencies F [1,3,10,25,30,40 Hz] Temperature 15 °C linear domain low deformation 50*10-6
σ ε
solicitation
time
σ* = σο eiωt ε∗ = εο ei(ωt-ϕ)
σ* = Ε* ε∗
E* =|E*| eiϕ = E1+iE2
Fr, θ
Complex modulus test (NF EN 12697- 26)
h 120 mm Base 40 *40 mm

Complex modulus test
EN 12697-26 ex NFP 98 260-2 2 points bending on trapezoidal samples, 4 repetitions
E pavement design 15°C, 10 Hz Master curve (rheological behavior)
r= 335 MPa , R= 2750 MPa (E = 15300 MPa)

- 1 parallelepiped sample from cut of plate or PCG sample - Control temperature (climate chamber) - Frequencies imposed (vibrator system) -Solicitations in linear domain (ε<50 10-6) (adaptation with solicitation) - Modulus at fixed conditions: 15°C, 10 Hz - Machine « compact » and easy to use
Device to measure modulus with simple system
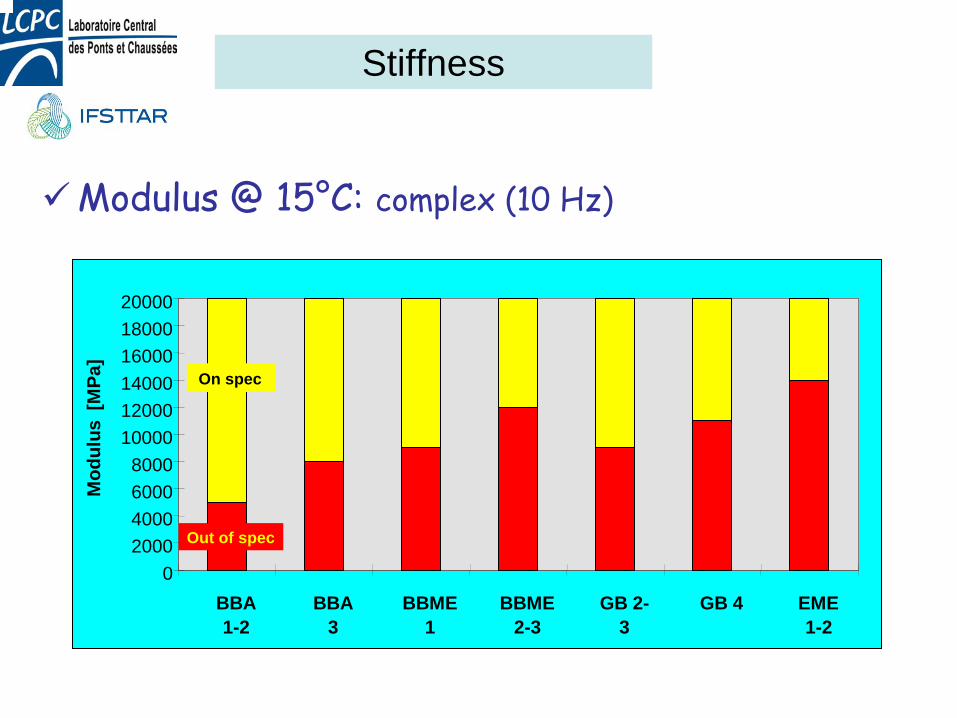
Stiffness
Modulus @ 15°C: complex (10 Hz)
0 2000 4000 6000 8000
10000 12000 14000 16000 18000 20000
BBA 1-2
BBA 3
BBME 1
BBME 2-3
GB 2- 3
GB 4 EME 1-2
Mod
ulus
[M
Pa]
Out of spec
On spec

Fatigue according to NF EN 12697- 24 - annex A
Service life N
Ln εο
time
time
Displacement resp. (ε)
εο εο
Load resp. (σ)
Fo Fo/2
Ln (duration of life)
106
ε6
Principle of fatigue test
Fatigue law = k Nb
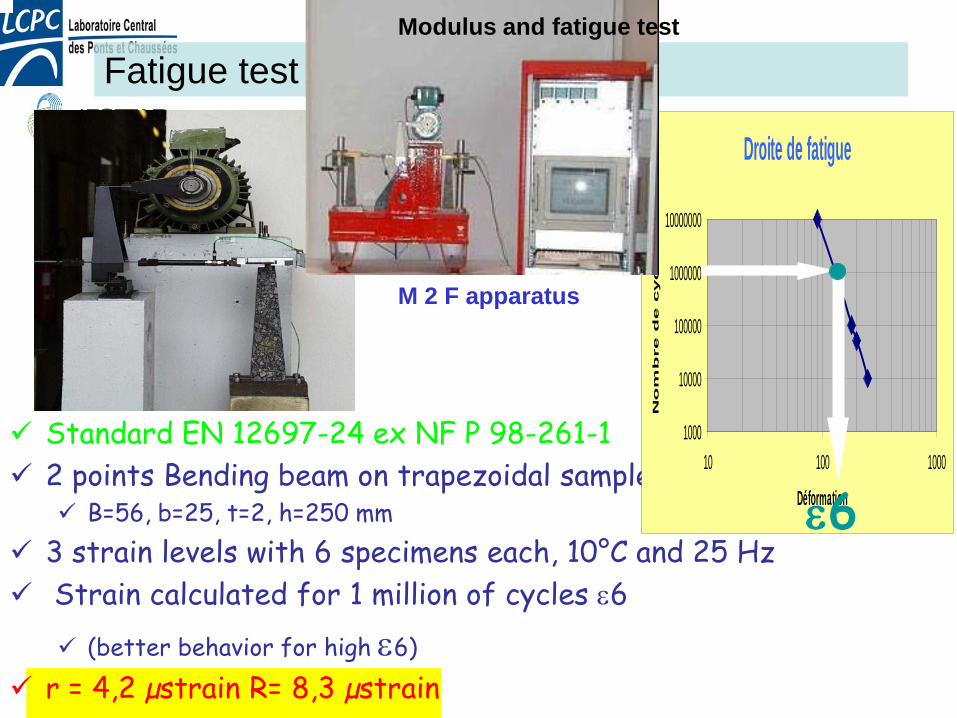
Fatigue test
Standard EN 12697-24 ex NF P 98-261-1 2 points Bending beam on trapezoidal samples
B=56, b=25, t=2, h=250 mm 3 strain levels with 6 specimens each, 10°C and 25 Hz Strain calculated for 1 million of cycles ε6
(better behavior for high ε6)
r = 4,2 µstrain R= 8,3 µstrain
Droite de fatigue
1000
10000
100000
1000000
10000000
10 100 1000
Déformation
No
mb
re d
e cycles
ε6
Modulus and fatigue test
M 2 F apparatus
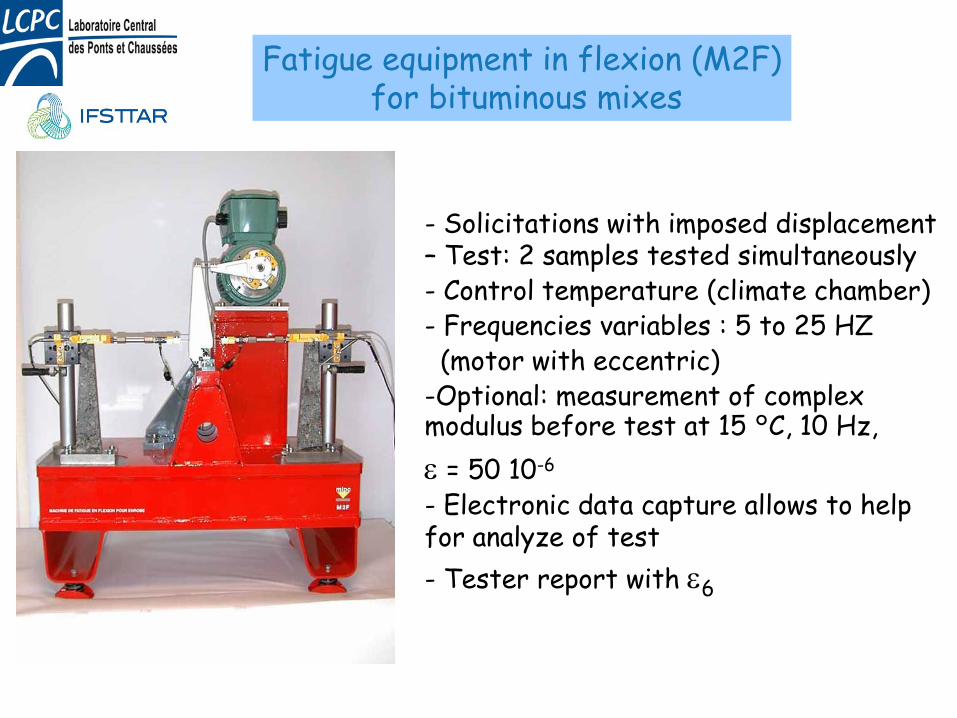
- Solicitations with imposed displacement – Test: 2 samples tested simultaneously - Control temperature (climate chamber) - Frequencies variables : 5 to 25 HZ (motor with eccentric) -Optional: measurement of complex modulus before test at 15 °C, 10 Hz, ε = 50 10-6
- Electronic data capture allows to help for analyze of test - Tester report with ε6
Fatigue equipment in flexion (M2F) for bituminous mixes
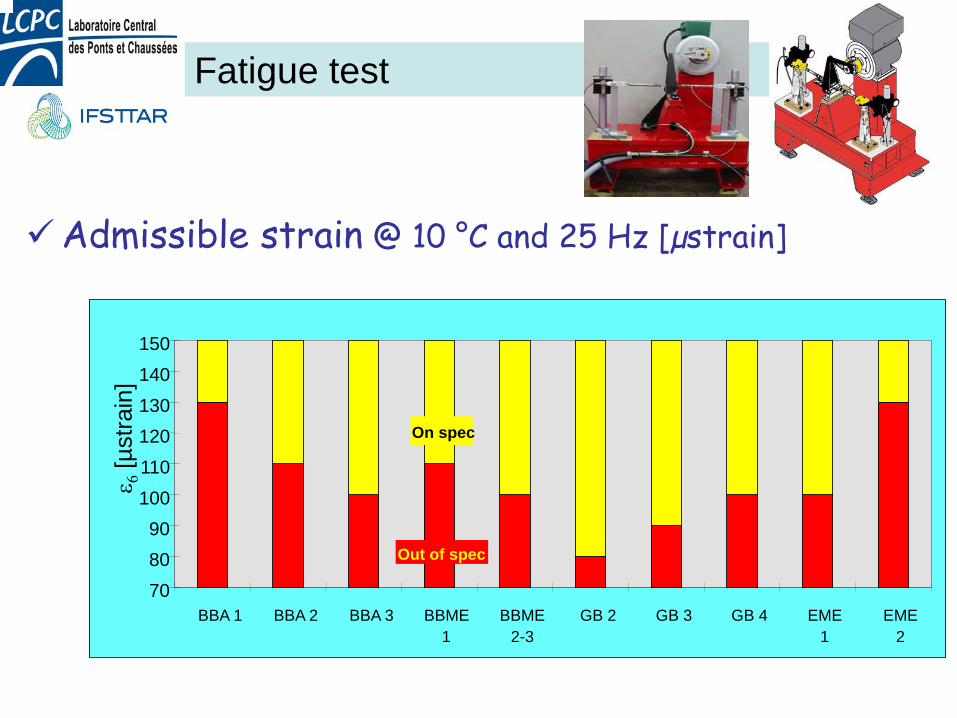
Fatigue test
Admissible strain @ 10 °C and 25 Hz [µstrain]
70
80
90
100
110
120
130
140
150
BBA 1 BBA 2 BBA 3 BBME 1
BBME 2-3
GB 2 GB 3 GB 4 EME 1
EME 2
ε 6 [µ
stra
in]
Out of spec
On spec

Type
of m
ix
Gira
tory
. (V
oids
%)
C80
(D 1
0mm
)C
100
(D 1
4mm
) C
120
(D 2
0 m
m)
Wat
er s
ensi
tivity
r/R ra
tio
Rut
dep
th(6
0°C
-100
mm
)*
10.0
00 c
ycle
s (%
)**
30.
000
cycl
es (%
)
Stiff
ness
mod
ulus
(15°
C-1
0Hz)
in M
Pa
Fatig
ue –
adm
issi
ble
stra
in(@
1 m
illio
n de
cyc
les)
G.BClass 2 ≤ 11 ≥ 0.65 ≤ 10* ≥ 9,000 ≥ 80.10-6
GBClass 3 ≤ 10 ≥ 0.7 ≤ 10* ≥ 9,000 ≥ 90.10-6
GBClass 4 ≤ 9 ≥ 0.7 ≤ 10** ≥ 11,000 ≥ 100.10-6
EMEClass 1 ≤ 10 ≥ 0.7 ≤ 7.5** ≥ 14,000 ≥ 100.10-6
EMEclass 2 ≤ 6 ≥ 0.75 ≤ 7.5** ≥ 14,000 ≥ 130.10-6
Base Hot Mix Asphalt : main performances
fundamental empirical

Summarise of mechanical properties used in pavement design
Modulus E 15°C 10 Hz Fatigue ε 10°C 25 Hz

Volume composition : voids content % Performances : Surface or wearing course wear resistance in humidity conditions rutting resistance evolution of surface characteristics (texture)
Structure or base course (thickness > 5 cm) modulus properties fatigue resistance rutting behaviour
Ranking of hot bituminous mixes
Properties determined in laboratory and some controls in place

Need for the study of laboratory
Starting from components representative of the job site and in conformity with the standards of tests of mix design, It can be possible to have a good control on:
mix design, manufacture, preparation of the sample,
with the accuracy of the means of laboratory. method optimization of the mixture authorizes, with controlled
parameter, it is thus selective, method is moreover repeatable, the given properties are relevant compared to those obtained
on average on a well led job site, the specifications of the products taken as reference for the
study are realistic compared to the behaviors awaited in place.

Path lab to field?
Assessment of link between lab to field: -PCG -Rutting test -Modulus -Fatigue

Accuracy, Selectivity, Pertinence
Classification in lab / Behavior in place Comparison between different lab Round robin test : repeatability, reproducibility Tests in different labs
How can we determined specifications?

GSC : dispersion in field (N7 Base)
Preliminary study
checking
GSC (average 32)
Preliminary study no representative Bonne correspondence : checking and average of field Low dispersion of workability : range maxi 5 to 9%
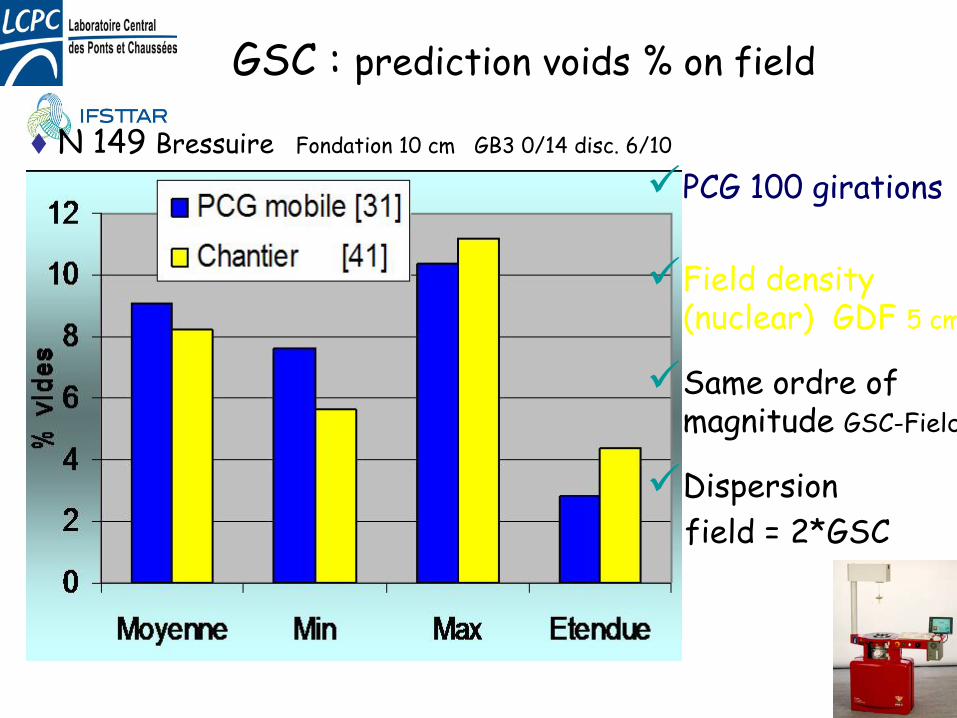
GSC : prediction voids % on field
PCG 100 girations Field density
(nuclear) GDF 5 cm
Same ordre of magnitude GSC-Field
Dispersion field = 2*GSC
N 149 Bressuire Fondation 10 cm GB3 0/14 disc. 6/10
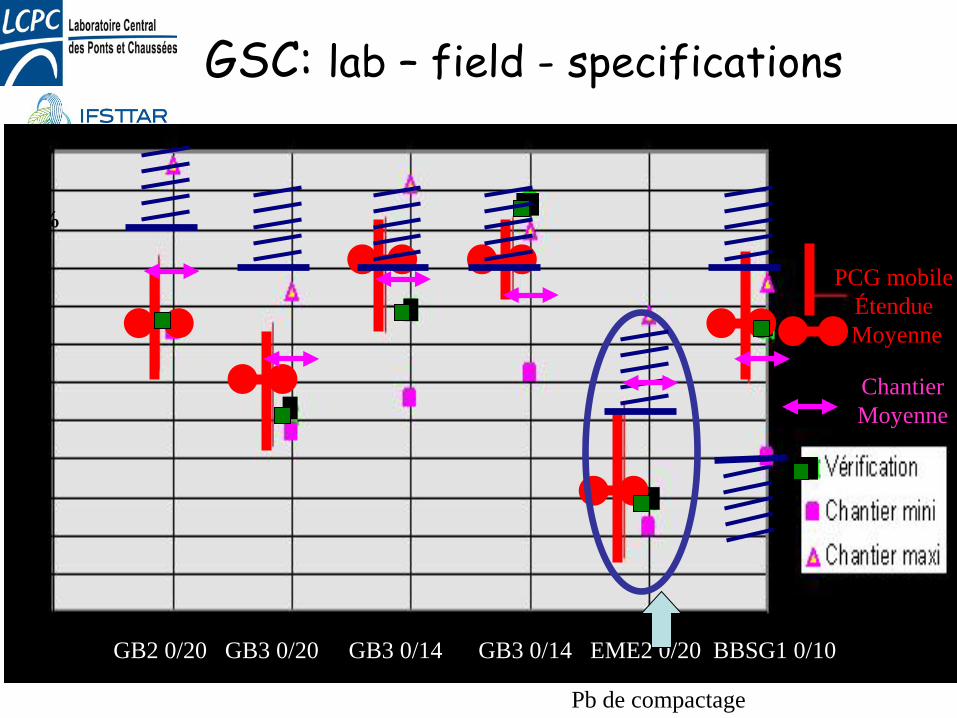
GSC: lab – field - specifications
0%
5%
10%
PCG mobile Étendue Moyenne
GB2 0/20 GB3 0/20 GB3 0/14 GB3 0/14 EME2 0/20 BBSG1 0/10
Synthèse
Pb de compactage
Chantier Moyenne

Specific studies with LPC rutting test
Correspondence lab-field (Dot Colorado -USA) Previous standardization tests studies Comparison rutting tester english-french Behaviour of different asphalt mixes in europe with
LPC rutting tester Researches : correspondences lab-field Studies on fatigue test track in Nantes (Seattle) Research experience (mix design guide)

DOT Colorado study
33 job sites : crossing traffic, ambiance temperature
Results on sites With high temperature

Results on sites At moderated temperature
DOT Colorado study

Results on sites With low temperature
DOT Colorado study

ranging : behaviour site / LPC criteria DOT Colorado study

Rutting Prediction
Excellent correlation between rutting prevision with LPC equipment and on job site, if taking into account : heavy traffic and temperature

Conclusion de l’étude
Conclusion of Dot Colorado study
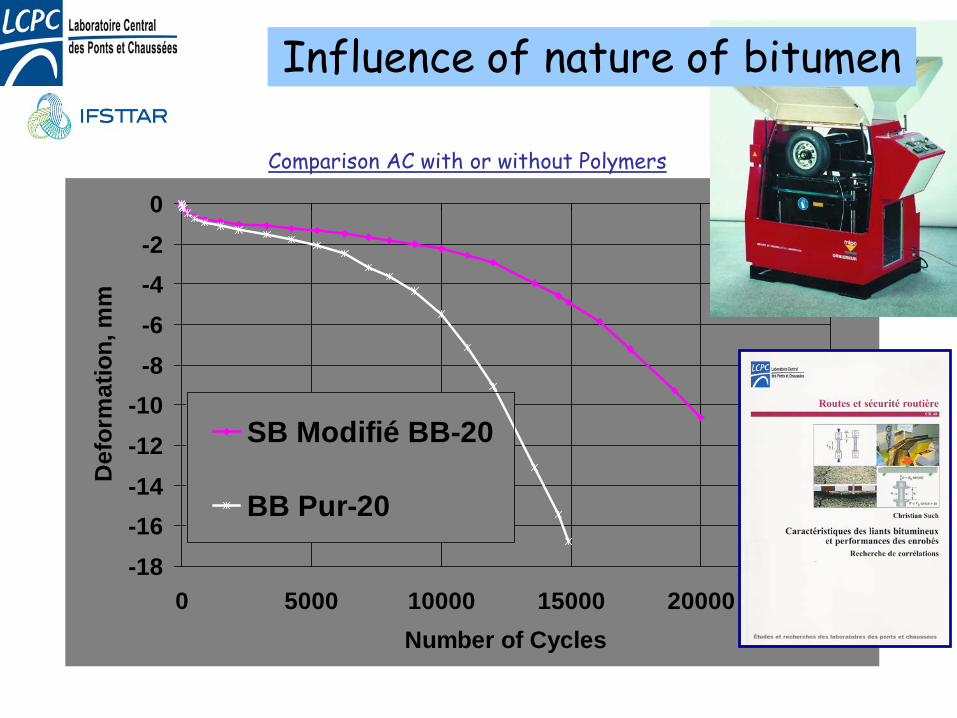
Comparison AC with or without Polymers
-18-16-14-12-10
-8-6-4-20
0 5000 10000 15000 20000 25000Number of Cycles
Def
orm
atio
n, m
m
SB Modifié BB-20
BB Pur-20
Influence of nature of bitumen

GSC –plate compactor rutting : comparison field - lab
N 149 GB3 0/14 disc.
Noubleau
Prélèvements chantiers
Sample from field low relation G SC–PC (high) Rut : field < Lab no significative
% de vides % d’ornière
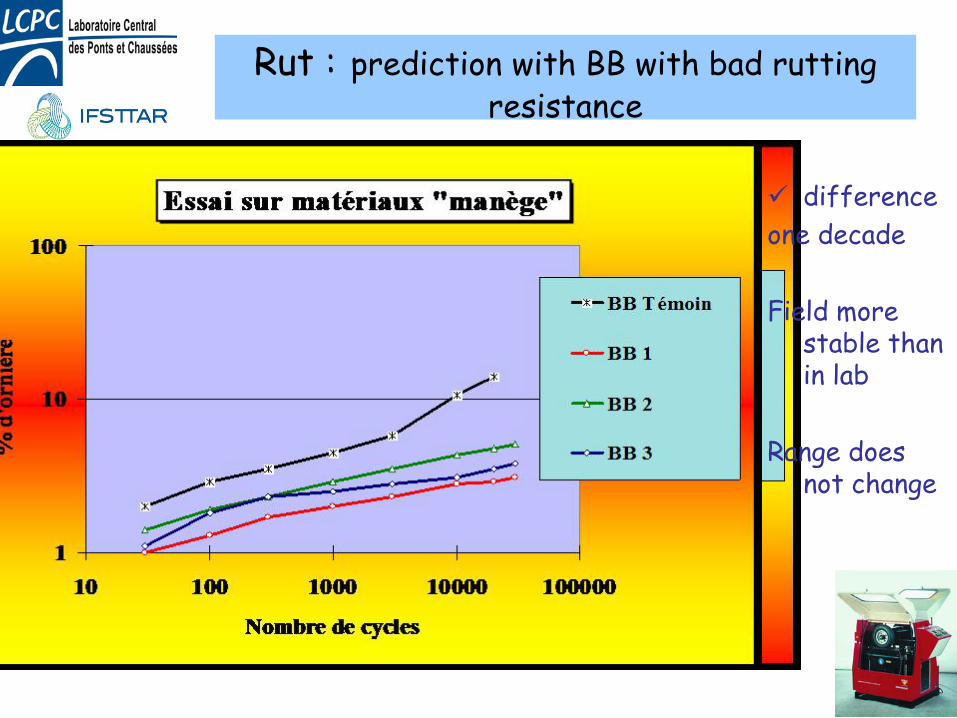
Rut : prediction with BB with bad rutting resistance
difference one decade Field more
stable than in lab
Range does
not change

Dispersion of complex modulus : example of results in place on motorway
Low variability on each sample range : Maximum 1300 MPa Minimum 80 MPa Significative difference between each point
80001000012000140001600018000
0 5 10 15 20 25N° de prélèvement
|E*|
(MPa
)
Eprouvette 1Eprouvette 2Eprouvette 3
A 39 lot Monnières, |E*| 15°C, 10 Hz
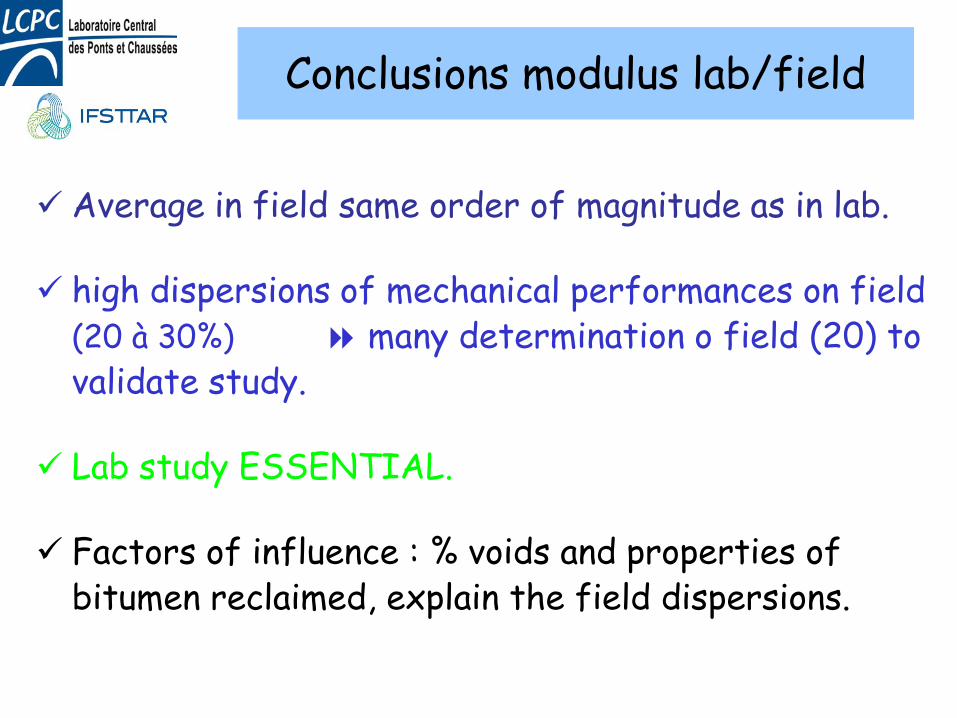
Conclusions modulus lab/field
Average in field same order of magnitude as in lab.
high dispersions of mechanical performances on field (20 à 30%) many determination o field (20) to validate study.
Lab study ESSENTIAL.
Factors of influence : % voids and properties of bitumen reclaimed, explain the field dispersions.
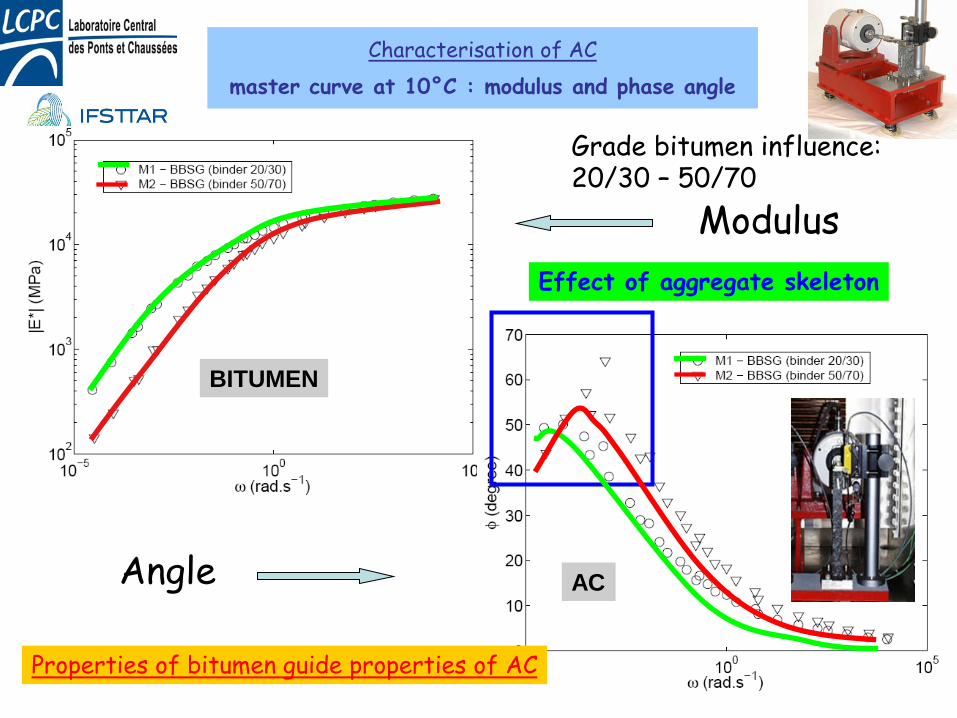
Modulus
Angle
Properties of bitumen guide properties of AC
Effect of aggregate skeleton
Characterisation of AC
master curve at 10°C : modulus and phase angle
Grade bitumen influence: 20/30 – 50/70
BITUMEN
AC
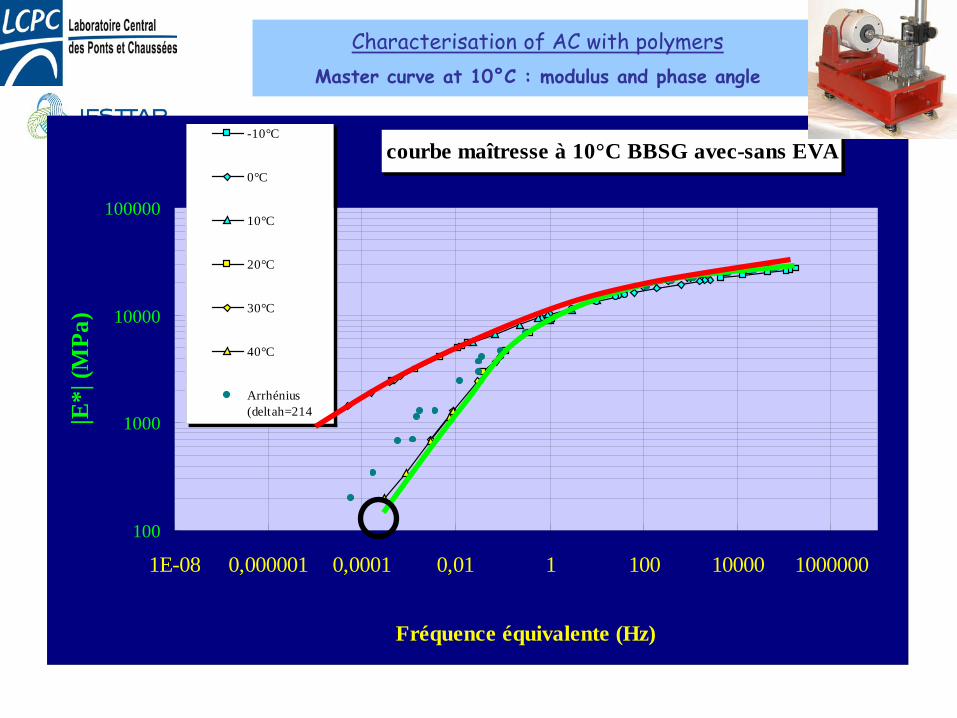
courbe maîtresse à 10°C BBSG avec-sans EVA
100
1000
10000
100000
1E-08 0,000001 0,0001 0,01 1 100 10000 1000000
Fréquence équivalente (Hz)
|E*|
(MPa
)
-10°C
0°C
10°C
20°C
30°C
40°C
Arrhénius(deltah=214kJ/ l )
Characterisation of AC with polymers
Master curve at 10°C : modulus and phase angle

Variability of fatigue properties synthesis of results
Note : when modulus high, fatigue is a little low, inverse too
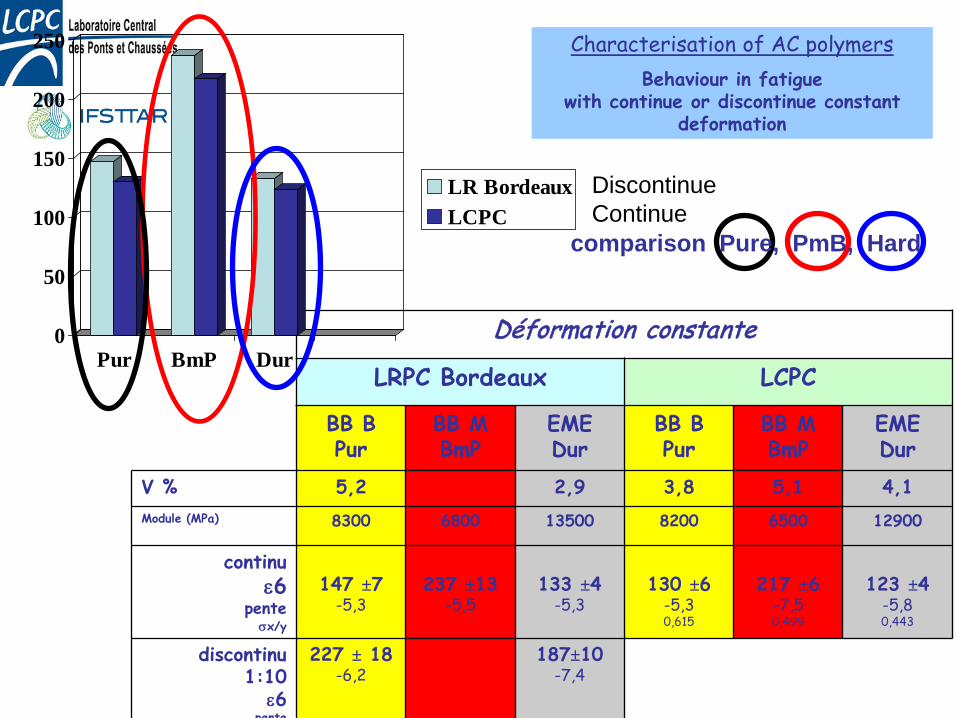
Déformation constante
LRPC Bordeaux LCPC
BB B Pur
BB M BmP
EME Dur
BB B Pur
BB M BmP
EME Dur
V % 5,2 2,9 3,8 5,1 4,1 Module (MPa) 8300 6800 13500 8200 6500 12900
continu ε6
pente σx/y
147 ±7
-5,3
237 ±13
-5,5
133 ±4
-5,3
130 ±6
-5,3 0,615
217 ±6
-7,5 0,499
123 ±4
-5,8 0,443
discontinu 1:10
ε6 pente
227 ± 18 -6,2
187±10 -7,4
0
50
100
150
200
250
Pur BmP Dur
LR BordeauxLCPC
Characterisation of AC polymers
Behaviour in fatigue with continue or discontinue constant
deformation
comparison Pure, PmB, Hard
Discontinue Continue
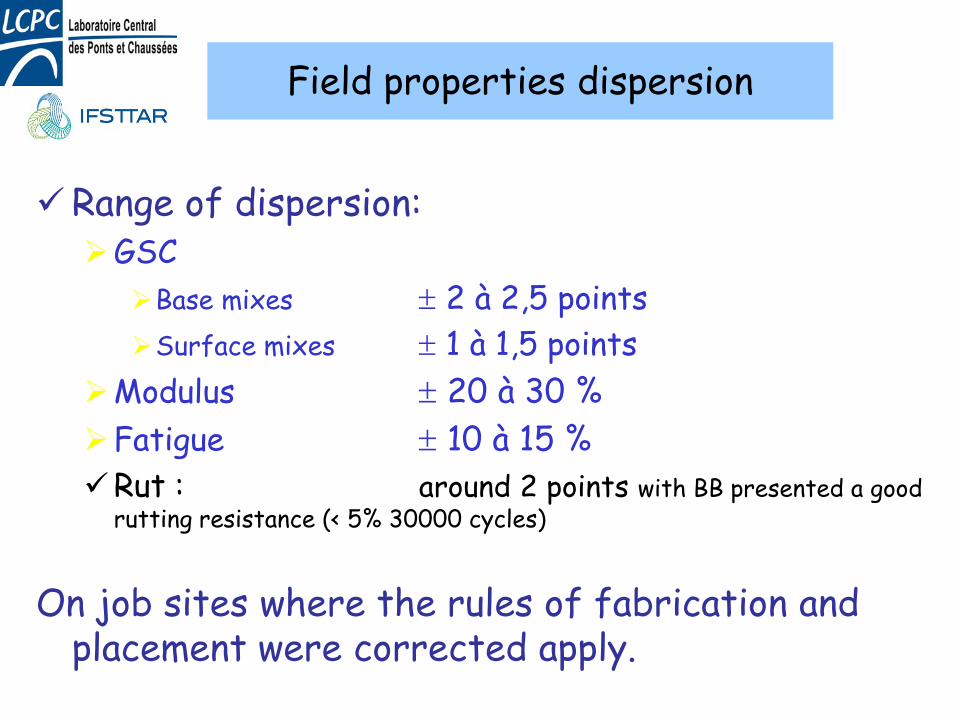
Field properties dispersion
Range of dispersion: GSC
Base mixes ± 2 à 2,5 points Surface mixes ± 1 à 1,5 points
Modulus ± 20 à 30 % Fatigue ± 10 à 15 % Rut : around 2 points with BB presented a good
rutting resistance (< 5% 30000 cycles)
On job sites where the rules of fabrication and placement were corrected apply.

conclusion
Well-known well used by road technicians Free method to improve the quality in term of
performances requirements, even for Road materials (innovative efforts, quality system,..) Road structures (allowable for private free variant, but same rules
for all,…)
A good feed back with the job site Specifications : realistic, relevant, Statistical method : take into account variation due to
construction, and dispersion of material, adjustment coefficient Method admitting by European standardization :
road material mix design, laboratory characterization tests, in future : pavement design procedure (harmonization to do)

Thanks a lot for your attention


