Regolith 2004 In: Roach I.C. ed. 2004. Regolith 2004. CRC LEME, pp. 49-53. 49 FREQUENCY DOMAIN HELICOPTER ELECTROMAGNETICS – REDUCING THE COSTS OF ACQUISITION FOR SALINITY AND GROUNDWATER MAPPING Kevin Cahill, Andrew Fitzpatrick & Ken Lawrie CRC LEME, Geoscience Australia, PO Box 378, Canberra, ACT, 2601 INTRODUCTION Recent investigations by the Cooperative Research Centre for Landscape Environments and Mineral Exploration (CRC LEME) and Geoscience Australia (GA) demonstrated that significant cost reductions in acquisition of time-domain airborne electromagnetic (AEM) surveys for natural resource management could be achieved if the critical landscape elements that control salinity and groundwater in a target area can be identified prior to surveying. Thus, the appropriate line spacing can be optimised to map according to the scale of features of interest. This study uses a similar approach applied to Frequency Domain Helicopter Electro-Magnetic data (FDHEM), taking into consideration inherent drift and levelling problems with HEM data. This study uses FDHEM data collected from the Riverland South Australian Salinity Mapping and Management Projects, using the RESOLVE system. The Riverland survey was collected along the southern floodplains near Loxton, South Australia, an area of largest salt export along the Murray River. The objective of the Riverland survey was to map the depth, thickness and conductivity of two layers, the Blanchetown Clay and the saline groundwater. Definition of useful targets for the AEM survey, rather than a simplistic salinity mapping approach, was undertaken to provide the level of detail and understanding required. Survey design based on knowledge of the hydrogeological framework and pre-survey down-hole induction conductivity logging enabled forward modelling of the likely EM response of the target given a particular airborne EM system and survey parameters. Further to this, use of a priori knowledge of the local geomorphic and geological landscapes, density of boreholes and other geophysical information was investigated in the context of survey planning of line and tie line density. Initial line spacings were derived from a model describing the smallest target of interest in the survey, 150 metre diameter holes in the Blanchetown Clays, so that at least two lines would intersect the smallest target. DETERMINATION OF OPTIMAL AEM SURVEY SPECIFICATIONS Using the approach developed by Lawrie et al. 2003, which places particular emphasis on identifying the key landscape elements that control groundwater and salinity in the Riverland survey, the following steps were performed to assist with the sub surface interpretation (Figure 1): 1. Landscape elements for mapping salinity and groundwater were identified. These data were then integrated with the original AEM data (150 m/300 m line spacing) and mapped within selected CDI slices; 2. Progressive broadening of the line spacing was undertaken using both spaced line and swath set mapping approaches to assess the effect of line spacing on the identification of the landscape elements controlling/affecting groundwater and salinity in the area; 3. Comparisons were made between interpretations of landscape elements from the original data (utilising all other available data) with interpretations from progressively wider line spaced datasets; and, 4. Integrated analysis of existing datasets and forward modelling the landscape architecture and geomorphic features relevant to salinity and groundwater processes in the area so as to optimise the flight line spacings. Line spacings were modified either for the entire survey region or by sub dividing the area into two or more zones of differing flight line density so as to resolve spatially varying landscape features at catchment and sub catchment scales. As drift is a significant factor in HEM systems, the previous methodology had to be modified to ensure realistic acquisition parameters. A three-stage approach to reducing line spacing is proposed for frequency domain data: 1. Simplistic approach - assume the quality of the Riverland data remains consistent with increasing line spacing and produce conductivity grids for various line spacings (this assumes a zero/low-drift system). This allowed an estimation of distance between lines such that NRM targets could still be identified and allows a quantifiable decision with respect to survey design that decreases data density and acquisition costs;
FREQUENCY DOMAIN HELICOPTER ELECTROMAGNETICS – REDUCING THE COSTS OF ACQUISITION FOR SALINITY AND
GROUNDWATER MAPPING
Kevin Cahill, Andrew Fitzpatrick & Ken Lawrie
CRC LEME, Geoscience Australia, PO Box 378, Canberra, ACT, 2601 INTRODUCTION Recent investigations by the Cooperative Research Centre for Landscape Environments and Mineral Exploration (CRC LEME) and Geoscience Australia (GA) demonstrated that significant cost reductions in acquisition of time-domain airborne electromagnetic (AEM) surveys for natural resource management could be achieved if the critical landscape elements that control salinity and groundwater in a target area can be identified prior to surveying. Thus, the appropriate line spacing can be optimised to map according to the scale of features of interest. This study uses a similar approach applied to Frequency Domain Helicopter Electro-Magnetic data (FDHEM), taking into consideration inherent drift and levelling problems with HEM data. This study uses FDHEM data collected from the Riverland South Australian Salinity Mapping and Management Projects, using the RESOLVE system. The Riverland survey was collected along the southern floodplains near Loxton, South Australia, an area of largest salt export along the Murray River. The objective of the Riverland survey was to map the depth, thickness and conductivity of two layers, the Blanchetown Clay and the saline groundwater. Definition of useful targets for the AEM survey, rather than a simplistic salinity mapping approach, was undertaken to provide the level of detail and understanding required. Survey design based on knowledge of the hydrogeological framework and pre-survey down-hole induction conductivity logging enabled forward modelling of the likely EM response of the target given a particular airborne EM system and survey parameters. Further to this, use of a priori knowledge of the local geomorphic and geological landscapes, density of boreholes and other geophysical information was investigated in the context of survey planning of line and tie line density. Initial line spacings were derived from a model describing the smallest target of interest in the survey, 150 metre diameter holes in the Blanchetown Clays, so that at least two lines would intersect the smallest target. DETERMINATION OF OPTIMAL AEM SURVEY SPECIFICATIONS Using the approach developed by Lawrie et al. 2003, which places particular emphasis on identifying the key landscape elements that control groundwater and salinity in the Riverland survey, the following steps were performed to assist with the sub surface interpretation (Figure 1):
1. Landscape elements for mapping salinity and groundwater were identified. These data were then integrated with the original AEM data (150 m/300 m line spacing) and mapped within selected CDI slices;
2. Progressive broadening of the line spacing was undertaken using both spaced line and swath set mapping approaches to assess the effect of line spacing on the identification of the landscape elements controlling/affecting groundwater and salinity in the area;
3. Comparisons were made between interpretations of landscape elements from the original data (utilising all other available data) with interpretations from progressively wider line spaced datasets; and,
4. Integrated analysis of existing datasets and forward modelling the landscape architecture and geomorphic features relevant to salinity and groundwater processes in the area so as to optimise the flight line spacings. Line spacings were modified either for the entire survey region or by sub dividing the area into two or more zones of differing flight line density so as to resolve spatially varying landscape features at catchment and sub catchment scales.
As drift is a significant factor in HEM systems, the previous methodology had to be modified to ensure realistic acquisition parameters. A three-stage approach to reducing line spacing is proposed for frequency domain data:
1. Simplistic approach - assume the quality of the Riverland data remains consistent with increasing line spacing and produce conductivity grids for various line spacings (this assumes a zero/low-drift system). This allowed an estimation of distance between lines such that NRM targets could still be identified and allows a quantifiable decision with respect to survey design that decreases data density and acquisition costs;
Regolith 2004
K. Cahill, A. Fitzpatrick & K. Lawrie. Frequency domain helicopter electromagnetics – reducing the costs of acquisition for salinity and groundwater mapping.
50
2. Rigorous Approach - use raw flight line data and tie line data to correct drift for different line spacings. The drift/uncertainty will be calculated as a function of the line spacing; and,
3. Review of survey techniques and other frequency-domain systems (i.e., dual tie-lines may assist in drift corrections, Geophex GEM-2 (multi-frequency system utilising one set of coils, which implies systematic drift across all frequencies)).
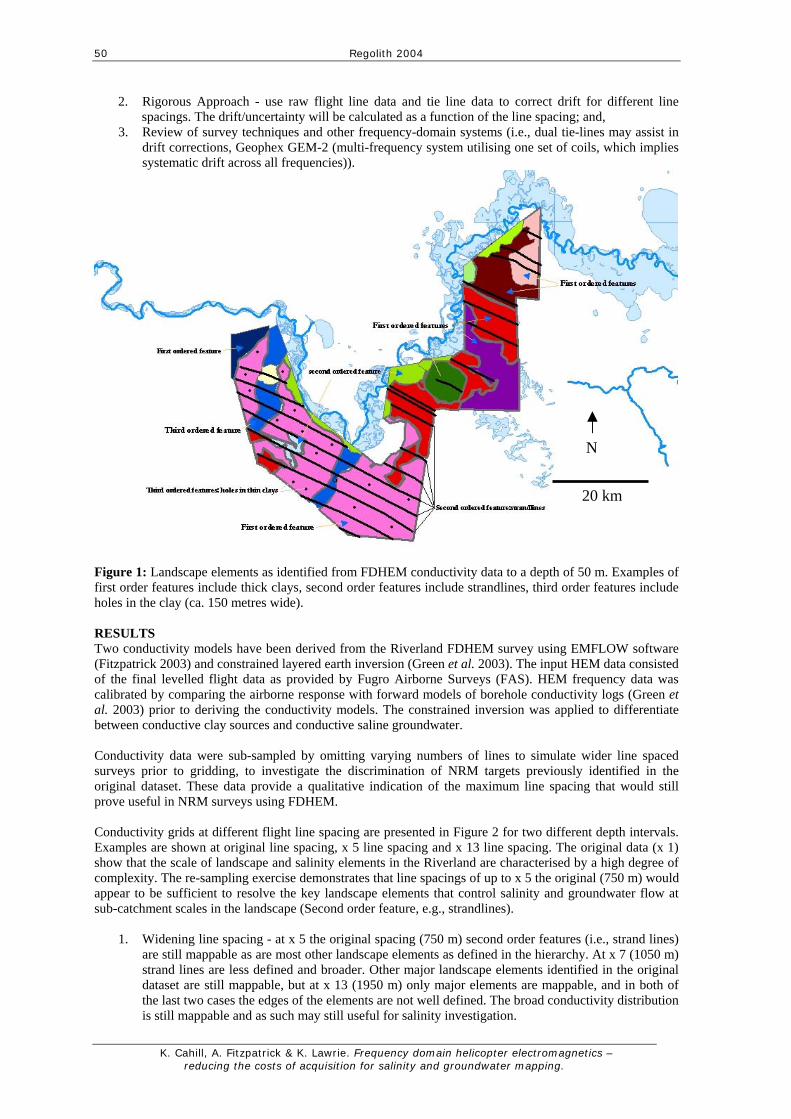
Figure 1: Landscape elements as identified from FDHEM conductivity data to a depth of 50 m. Examples of first order features include thick clays, second order features include strandlines, third order features include holes in the clay (ca. 150 metres wide). RESULTS Two conductivity models have been derived from the Riverland FDHEM survey using EMFLOW software (Fitzpatrick 2003) and constrained layered earth inversion (Green et al. 2003). The input HEM data consisted of the final levelled flight data as provided by Fugro Airborne Surveys (FAS). HEM frequency data was calibrated by comparing the airborne response with forward models of borehole conductivity logs (Green et al. 2003) prior to deriving the conductivity models. The constrained inversion was applied to differentiate between conductive clay sources and conductive saline groundwater. Conductivity data were sub-sampled by omitting varying numbers of lines to simulate wider line spaced surveys prior to gridding, to investigate the discrimination of NRM targets previously identified in the original dataset. These data provide a qualitative indication of the maximum line spacing that would still prove useful in NRM surveys using FDHEM. Conductivity grids at different flight line spacing are presented in Figure 2 for two different depth intervals. Examples are shown at original line spacing, x 5 line spacing and x 13 line spacing. The original data (x 1) show that the scale of landscape and salinity elements in the Riverland are characterised by a high degree of complexity. The re-sampling exercise demonstrates that line spacings of up to x 5 the original (750 m) would appear to be sufficient to resolve the key landscape elements that control salinity and groundwater flow at sub-catchment scales in the landscape (Second order feature, e.g., strandlines).
1. Widening line spacing - at x 5 the original spacing (750 m) second order features (i.e., strand lines) are still mappable as are most other landscape elements as defined in the hierarchy. At x 7 (1050 m) strand lines are less defined and broader. Other major landscape elements identified in the original dataset are still mappable, but at x 13 (1950 m) only major elements are mappable, and in both of the last two cases the edges of the elements are not well defined. The broad conductivity distribution is still mappable and as such may still useful for salinity investigation.
N
20 km
Regolith 2004
K. Cahill, A. Fitzpatrick & K. Lawrie. Frequency domain helicopter electromagnetics – reducing the costs of acquisition for salinity and groundwater mapping.
51
Figure 2: Conductivity images for different line spacing data (x 1, x 5, x 13) from the Riverland survey area for (a) 12-14 m slice, (b) 34-36 m slice, derived using EMFLOW.
2. Swath mapping – at 6 x 3 (six 150 m spaced lines, followed by 450 metre gap, equivalent to two-thirds original acquisition cost) all elements in the original are mappable. At 5 x 5 (five 150 m spaced lines, followed by 750 m gap, equivalent to half the acquisition cost) elements are mappable
Regolith 2004
K. Cahill, A. Fitzpatrick & K. Lawrie. Frequency domain helicopter electromagnetics – reducing the costs of acquisition for salinity and groundwater mapping.
52
but require careful consideration, strand lines are mappable but again care must be taken. At 5 x 10 (five 150 m spaced lines, followed by a 1500 m gap, equivalent to one third the acquisition lines cost) elements are mappable, geometric orientation of strandlines are mappable, holes in the clay can be seen, but some will be missed in the non-data swath component. This still may be reliable for identification of areas of the survey where the clays are thinner and mixed with sand as the thicker clay regions are still mappable, though a blind test may prove this is not the case.
The smallest paddock-scale features within the thin clays (holes) are lost between x 2 (300 m) and x 3 (450 m) but at x 5 (750 m) some holes are still visible (> 275 m diameter).
Figure 3: 5 x 5 swath mapping grids (five lines removed for every five lines flown, 600 m x 600 m) for depths (a) 14 m and (b) 34 m. Conductivity ranges from 0-1000 mS/m (blue to red). This would effectively reduce the cost of the survey to half the original cost. RIGOROUS APPROACH: DRIFT AND LEVELLING PROBLEMS OF HEM DATA The simplistic approach identified that line spacings of up to 750 (5 times original) would be suitable for mapping second order scale features in the Riverland area. However, the close line spacing of HEM surveys (typically 150 m) greatly assists drift and levelling methods, as data between adjacent lines are near-identical. This allows artefacts to be clearly identified due to drift and levelling problems. However, as the line spacing is increased, the coherency between adjacent lines becomes less, until each line is independent of the other. The second phase of the study investigated errors and uncertainties in applying drift correction and levelling to FDHEM. This identified a number of fundamental issues that will need to be tackled in order to assess whether this approach is sound. In particular, significant issues have been identified in the characterisation of the quantity of error associated with the different orders of drift and levelling corrections applied to RESOLVE data for the Riverland survey. Methodology of this approach involved:
• Characterise drift on RESOLVE system for first and second order drift functions; • Investigate calibration, drift correction and levelling of FDHEM data for broadening of line spacing
to determine maximum line spacing, whilst maintaining adequate drift correction and levelling. This involved the investigation of the use of tie-lines, closely spaced or flown twice and swath approaches;
• Investigation of current methods of levelling for aeromagnetic data and apply to FDHEM electromagnetic data along with possible methods to assess and correct non-linear drift in the system by use of tie-lines for loop levelling;
• Investigation of swath methods as a possible resolution to the problem of adjacent line levelling techniques normally used in FDHEM;
• Compare and contrast suitability of various line spacings and swath approaches with mapping elements of the landscape;
0 10050
conductivity
20 km
(a) Shallow depth slice (14 metres)
(b) Intermediate depth
slice (34 metres)
5 x 5 : five lines flown at 150m spacing, five lines not
Regolith 2004
K. Cahill, A. Fitzpatrick & K. Lawrie. Frequency domain helicopter electromagnetics – reducing the costs of acquisition for salinity and groundwater mapping.
53
• Apply cost-reduction methodology to the Riverland survey based on target scale; • Partition of the Riverland area into regions where the scale of the desired information for land
management purposes is the determining factor as well as landscape elements such as proximity to the river or changes in land elevation.
First order drift corrections can be simply addressed by re-zeroing the FDHEM coils at high altitude routinely every 20 minutes during surveying. To correct second and third order drift corrections would require closely spaced flight lines, although their magnitude in not expected to be significant and could be ignored. In order to level FDHEM data with widely spaced lines would require tie-lines. Levelling issues are still being studied, with several approaches under consideration, including repeat tie lines for widely spaced data, a swath mapping approach, use of auxiliary data, e.g., borehole conductivity logs, ground calibration loops) and novel calibrating processing techniques (Ley-Cooper & Macnae 2004). CONCLUSIONS Analysis of the Riverland survey data has indicated that a line spacing of approximately up to five times could be used to identify and map most of the sub-catchment scale landscape elements. Swath mapping shows the potential to map all landscape elements, although results in data gaps across the survey area. Used in conjunction with borehole data, different survey planning, multiple tie lines and levelling approaches minimise levelling errors and/or difficulties. This suggests that costs savings in acquisition might be achieved for surveys with similar complexity and line kilometres in adjacent or similar landscapes for sub-catchment to catchment scales. Employing the landscape element approach may indicate that a combination of widely spaced lines and swath lines to be a cost effective method to identify targets of varying size in a survey area without the need to fly the entire area based on the smallest target to be acquired Characterisation and an understanding of first and second order drift of the system are required to ensure a correct approach and solution to levelling and analysis of system drift over time. It is essential that an integrated geoscience approach to assessing the past and present landscape elements be used to design cost-effective surveys for salinity mapping and broader NRM applications utilising ground water flow systems, conceptual models and frameworks. REFERENCES GRAY M.C., FITZPATRICK A.D. & LAWRIE K. 2004. A cost reduction methodology for the acquisition of time
domain AEM surveys in the context of salinity and groundwater mapping. Australian Society of Exploration Geophysicists 17th Conference and Exhibition, Sydney, Extended Abstracts.
GREEN A. 2003. Correcting Drift Errors in HEM Data. Australian Society of Exploration Geophysicists 16th Conference and Exhibition, Adelaide, Extended Abstracts.
GREEN A., BRODIE R. & MUNDAY T.J. 2003. Constrained Inversion of Resolve Electromagnetic Data Riverland, South Australia. CRC LEME Restricted Report 152.
FITZPATRICK A. 2003. Calculation of conductivity depth images (CDI) S.A. AEM data using EMFLOW 5.30: TEMPEST: Riverland & Tintinara (east & west) RESOLVE: Jamestown & Angas Bremer Plains, CRC LEME Restricted Report 179.
LAWRIE K., GRAY M.C., FITZPATRICK A.D., WILKES P. & LANE R. 2003. Reducing the Acquisition Costs of Airborne Electromagnetics Surveys for Salinity and Groundwater Mapping. Preview 106, 31-38.
LEY-COOPER Y & MACNAE J. 2004, Theoretical treatment of amplitude calibration in HEM data. Australian Society of Exploration Geophysicists 17th Conference and Exhibition, Sydney, Extended Abstracts.
VALLEAU N.C. 2000. HEM Data Processing – A Practical Overview. Australian Society of Exploration Geophysicists 14th Conference and Exhibition, Perth, Extended Abstracts.