Prepared in cooperation with the City of Charlotte and Mecklenburg County Frequency of Annual Maximum Precipitation in the City of Charlotte and Mecklenburg County, North Carolina, through 2004 Scientific Investigations Report 2006–5017 U.S. Department of the Interior U.S. Geological Survey
Transcript
Prepared in cooperation with the City of Charlotte and Mecklenburg County
Frequency of Annual Maximum Precipitation inthe City of Charlotte and Mecklenburg County,North Carolina, through 2004
Scientific Investigations Report 2006–5017
U.S. Department of the InteriorU.S. Geological Survey
Cover. Precipitation data-collection site CRN07 at Fire Station 9, McKee Road, Charlotte, North Carolina. (photograph from U.S. Geological Survey files)
Frequency of Annual Maximum Precipitation in the City of Charlotte and Mecklenburg County, North Carolina, through 2004
By J. Curtis Weaver
Prepared in cooperation with the City of Charlotte amd Mecklenburg County
Scientific Investigations Report 2006–5017
U.S. Department of the InteriorU.S. Geological Survey
U.S. Department of the InteriorP. Lynn Scarlett, Acting Secretary
U.S. Geological SurveyP. Patrick Leahy, Acting Director
U.S. Geological Survey, Reston, Virginia: 2006
Any use of trade, product, or firm names in this publication is for descriptive purposes only and does not imply endorsement by the U.S. Government.
Although this report is in the public domain, permission must be secured from the individual copyright owners to reproduce any copyrighted materials contained within this report.
Suggested citation:Weaver, J.C., 2006, Frequency of annual maximum precipitation in the city of Charlotte and Mecklenburg County, North Carolina, through 2004: U.S. Geological Survey Scientific Investigations Report 2006–5017, 53 p.
For product and ordering information: World Wide Web: http://www.usgs.gov/pubprod Telephone: 1-888-ASK-USGS
For more information on the USGS—the Federal source for science about the Earth, its natural and living resources, natural hazards, and the environment: World Wide Web: http://www.usgs.gov Telephone: 1-888-ASK-USGS
Purpose and Scope ..............................................................................................................................2 Previous Investigations........................................................................................................................3 Acknowledgments ................................................................................................................................5
Description of the Study Area .....................................................................................................................5 Setting and Climate ..............................................................................................................................5 U.S. Geological Survey Precipitation Data-Collection Sites .........................................................6
Data Compilation and Analytical Methods ................................................................................................6 Precipitation Data ...............................................................................................................................11 L-Moment Method ..............................................................................................................................15
Frequency of Annual Maximum Precipitation in the City of Charlotte and Mecklenburg County ..............................................................................................................17
L-Moment Ratio Diagrams and Goodness-of-Fit Measures ........................................................17 Depth-Duration and Intensity-Duration Frequency Curves .........................................................22
Figures 1–2. Maps showing: 1. Location of Mecklenburg County in the Catawba River and Rocky River
basins in North and South Carolina ............................................................................3 2. Locations of major streams and U.S. Geological Survey precipitation
network sites in Charlotte and Mecklenburg County, North Carolina, October 1988 through September 2004 ......................................................................4
3. Graphs showing time series of annual maximum of 24-hour (1,440-minute) precipitation totals at selected U.S. Geological Survey precipitation sites in or near Mecklenburg County, North Carolina ..............................................................11
4. Map showing selected National Weather Service precipitation stations in North and South Carolina in the vicinity of Mecklenburg County, North Carolina .......................................................................................................................13
5–13. Graphs showing: 5. Time series of annual maximum of 24-hour (1,440-minute) precipitation
totals at selected National Weather Service precipitation stations in or near Mecklenburg County, North Carolina ........................................................14
6. L-moment ratios for selected durations for the CRN initial dataset analysis of precipitation data for Charlotte and Mecklenburg County, North Carolina ..............................................................................................................18
7. Precipitation (A) depth-duration and (B) intensity-duration frequency curves for the 2-year recurrence interval for Charlotte and Mecklenburg County, North Carolina ...............................................................................................25
8. Precipitation (A) depth-duration and (B) intensity-duration frequency curves for the 5-year recurrence interval for Charlotte and Mecklenburg County, North Carolina ...............................................................................................26
iii
9. Precipitation (A) depth-duration and (B) intensity-duration frequency curves for the 10-year recurrence interval for Charlotte and Mecklenburg County, North Carolina ......................................................................27
10. Precipitation (A) depth-duration and (B) intensity-duration frequency curves for the 25-year recurrence interval for Charlotte and Mecklenburg County, North Carolina ......................................................................28
11. Precipitation (A) depth-duration and (B) intensity-duration frequency curves for the 50-year recurrence interval for Charlotte and Mecklenburg County, North Carolina ......................................................................29
12. Precipitation (A) depth-duration and (B) intensity-duration frequency curves for the 100-year recurrence interval for Charlotte and Mecklenburg County, North Carolina ......................................................................30
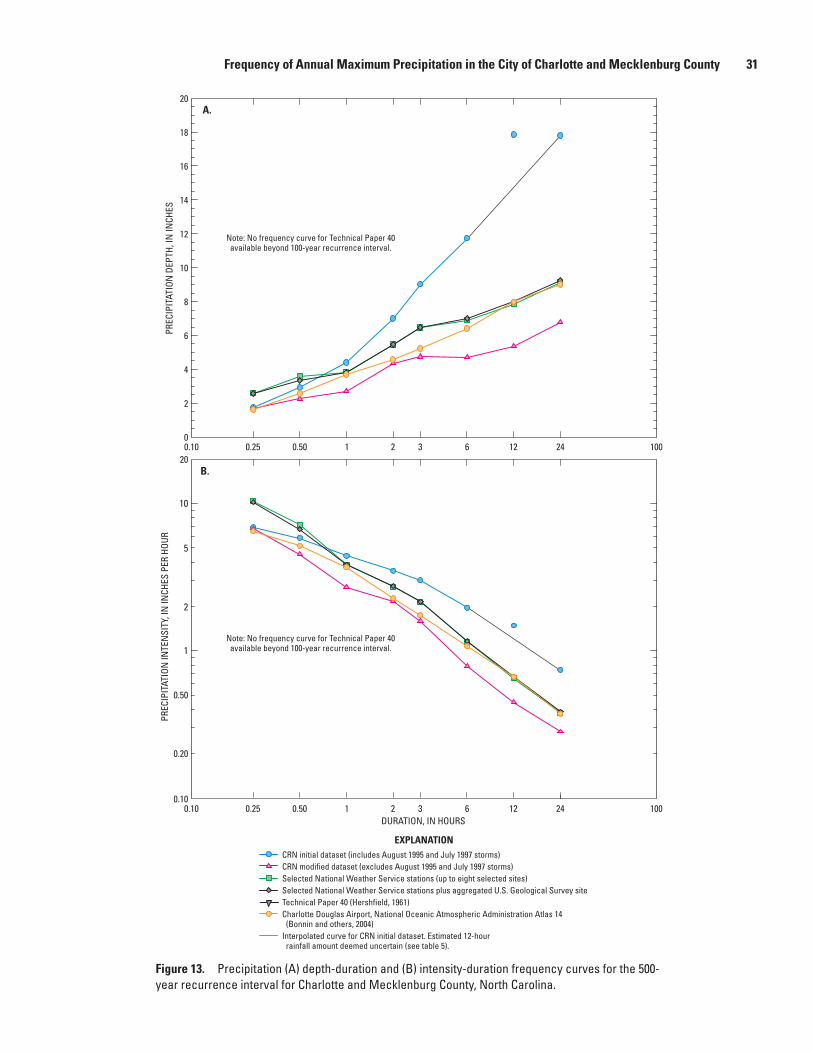
13. Precipitation (A) depth-duration and (B) intensity-duration frequency curves for the 500-year recurrence interval for Charlotte and Mecklenburg County, North Carolina ......................................................................31
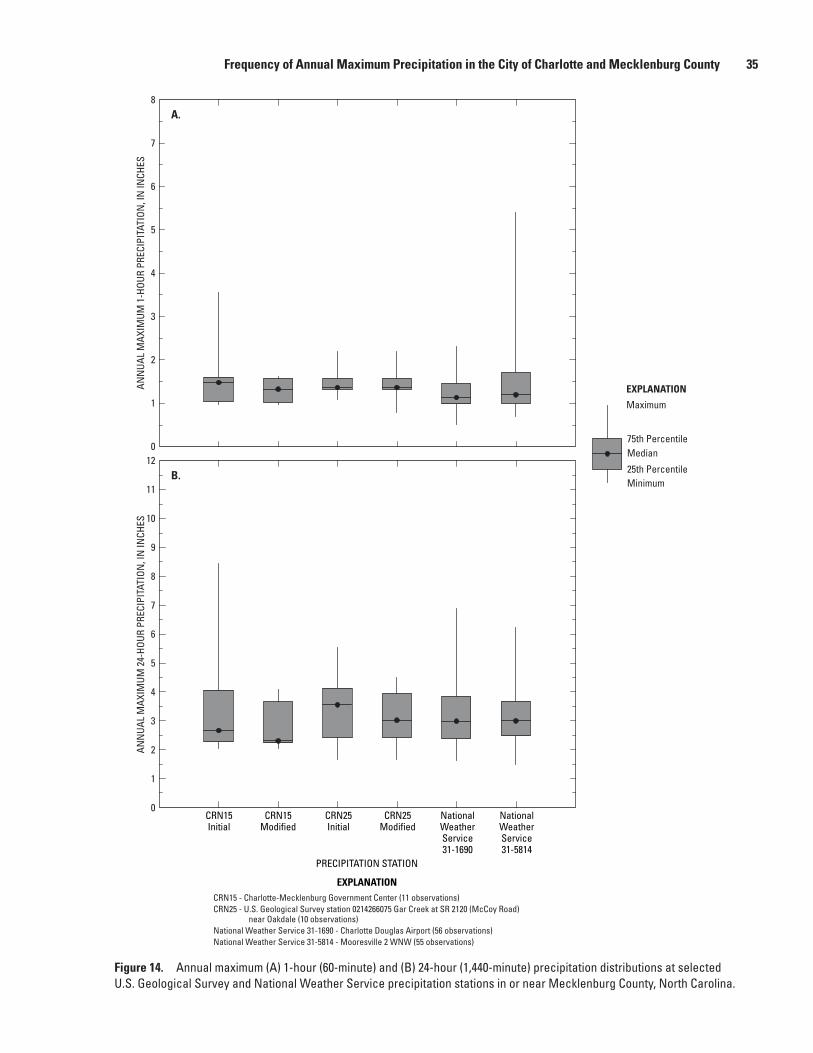
14. Box plots showing annual maximum (A) 1-hour (60-minute) and (B) 24-hour (1,440-minute) precipitation distributions at selected U.S. Geological Survey and National Weather Service precipitation stations in or near Mecklenburg County, North Carolina .......................................................................35
Tables 1. U.S. Geological Survey precipitation network sites in Mecklenburg County,
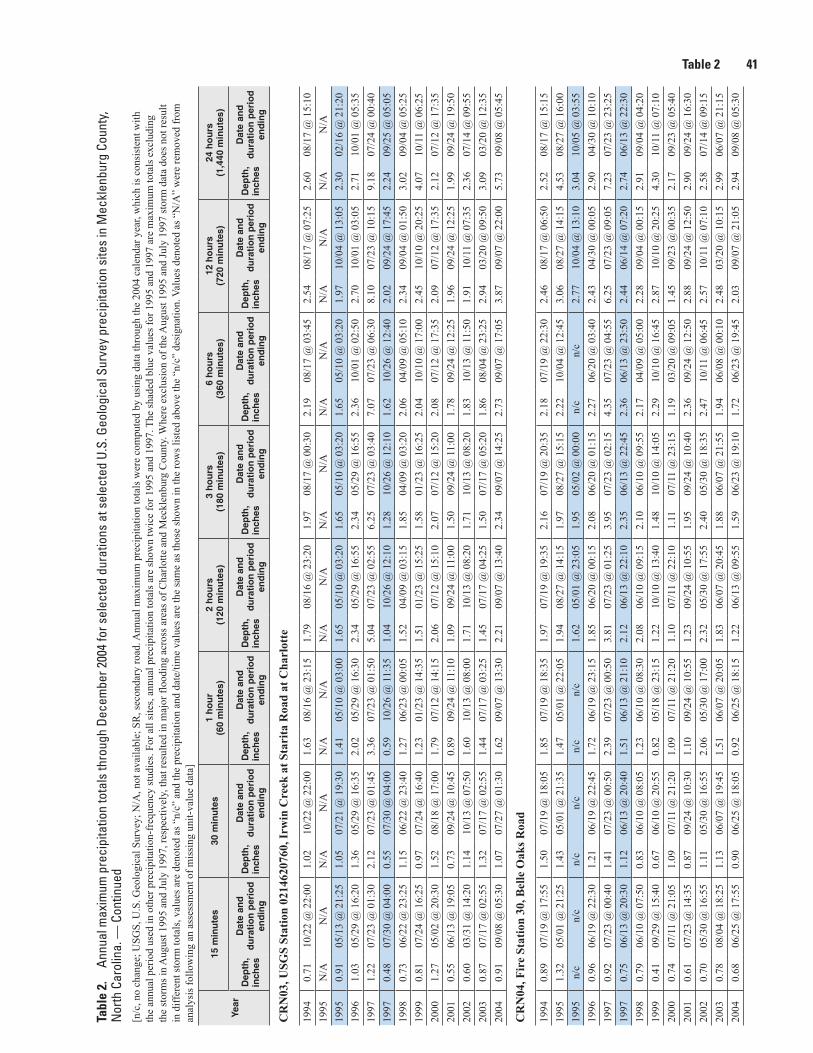
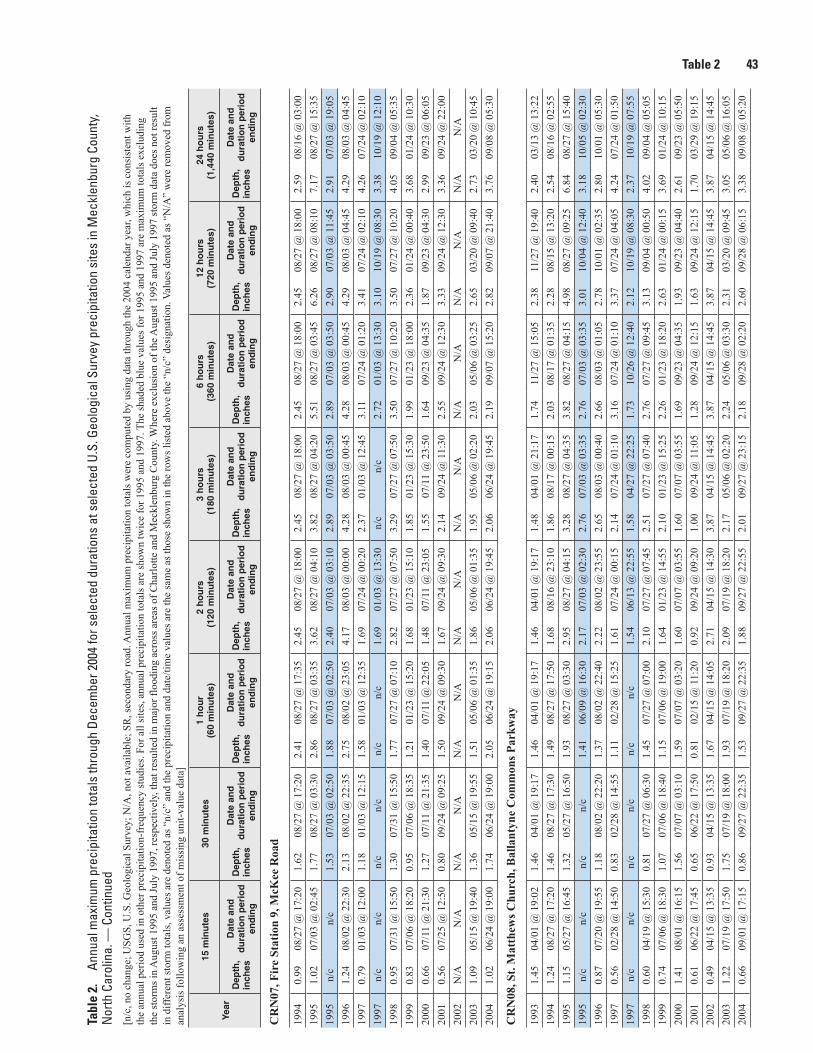
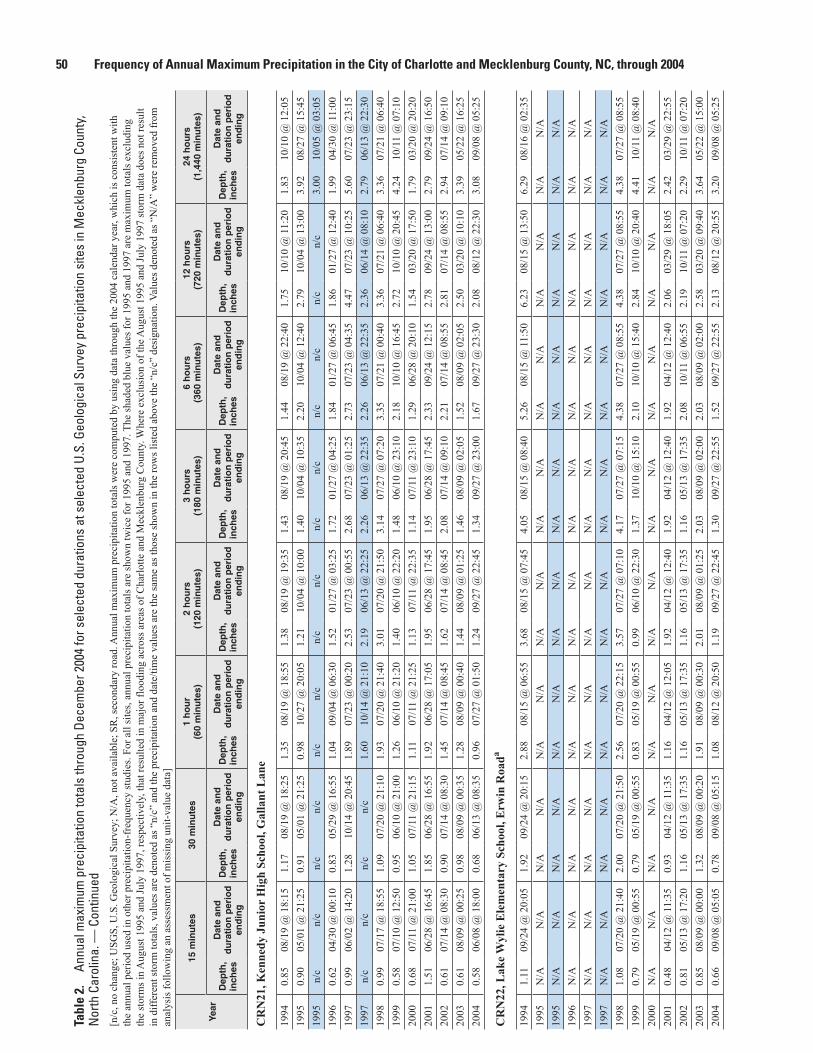
North Carolina, October 1988 through September 2004 ...................................................7 2. Annual maximum precipitation totals through December 2004 for selected
durations at selected U.S. Geological Survey precipitation sites in Mecklenburg County, North Carolina ................................................................................40
3. Selected National Weather Service precipitation network stations in North and South Carolina in the vicinity of Mecklenburg County, North Carolina .......................................................................................................................14
4. Summary of goodness-of-fit and heterogeneity measures for precipitation- frequency analyses in Charlotte and Mecklenburg County, North Carolina .......................................................................................................................21
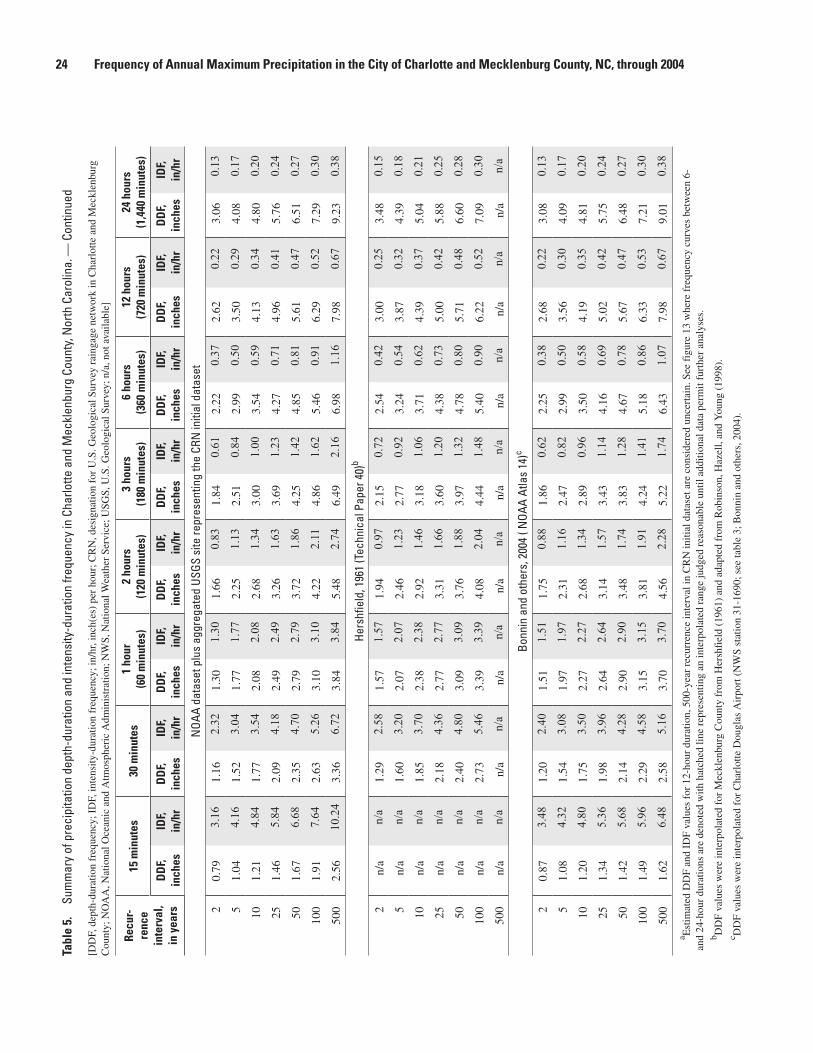
5. Summary of precipitation depth-duration and intensity-duration frequency in Charlotte and Mecklenburg County, North Carolina ..................................................23
6. Annual maximum 1- and 24-hour precipitation totals for selected U.S. Geological Survey and National Weather Service precipitation sites in or near Mecklenburg County, North Carolina ..............................................................32
iv
Conversion Factors, Temperature, Datums, and Acronyms Multiply By To obtain
Length
inch (in.) 25.4 millimeter (mm)
foot (ft) 0.3048 meter (m)
mile (mi) 1.609 kilometer (km)
Area
square mile (mi2) 2.590 square kilometer (km2)
Flow
cubic foot per second (ft3/s) 0.02832 cubic meter per second (m3/s)
cubic foot per second per square mile [(ft3/s)/mi2]
0.01093 cubic meter per second per square kilometer [(m3/s)/km2]
Volume per time
inch per year (in/yr) 2.54 centimeter per year (cm/yr)
Temperature: In this report, temperature is given in degrees Fahrenheit (°F), which can be converted to degrees Celsius (°C) by using the following equation:
°C = 5/9 x (°F – 32)
Vertical coordinates: Vertical coordinates in this report are referenced to the North American Vertical Datum of 1988 (NAVD 88).
Horizontal coordinates: Unless otherwise specified, horizontal (latitude and longitude) coordinates in this report are referenced to the North American Datum of 1983 (NAD 83).
Acronyms:CRN Charlotte Raingage NetworkDDF depth-duration frequencyGEV generalized extreme valueGIS geographic information systemGLO generalized logisticGN generalized normalGP generalized ParetoNAD 27 North American Datum of 1927NCDC National Climatic Data CenterNOAA National Oceanic and Atmospheric AdministrationNWS National Weather ServicePE3 Pearson Type IIIPWM probability-weighted momentUSGS U.S. Geological Survey
v
Frequency of Annual Maximum Precipitation in the City of Charlotte and Mecklenburg County, North Carolina, through 2004
By J. Curtis Weaver
AbstractA study of annual maximum precipitation frequency
in Mecklenburg County, North Carolina, was conducted to characterize the frequency of precipitation at sites having at least 10 years of precipitation record. Precipitation-frequency studies provide information about the occurrence of precipita-tion amounts for given durations (for example, 1 hour or 24 hours) that can be expected to occur within a specified recurrence interval (expressed in years). In this study, annual maximum precipitation totals were determined for durations of 15 and 30 minutes; 1, 2, 3, 6, 12, and 24 hours; and for recurrence intervals of 2, 5, 10, 25, 50, 100, and 500 years.
Precipitation data collected by the U.S. Geological Survey network of raingages in the city of Charlotte and Mecklenburg County were analyzed for this study. In September 2004, more than 70 precipitation sites were in operation; 27 of these sites had at least 10 years of record, which is the minimum record typically required in frequency studies. Missing record at one site, however, resulted in its removal from the dataset. Two datasets—the Charlotte Raingage Network (CRN) initial and CRN modified datasets—were developed from the U.S. Geological Survey data, which represented relatively short periods of record (10 and 11 years). The CRN initial dataset included very high precipitation totals from two storms that caused severe flooding in areas of the city and county in August 1995 and July 1997, which could significantly influence the statistical results. The CRN modified dataset excluded the highest precipitation totals from these two storms but included the second highest totals.
Two additional datasets were developed using National Oceanic and Atmospheric Administration (NOAA) records from eight selected National Weather Service precipitation stations in or near Mecklenburg County. These datasets were included in this investigation in order to analyze long-term records of precipitation data in the vicinity of Mecklenburg County and to provide an overall quality-assurance check of results of the L-moment method that was applied to all
datasets. The periods of record for the quarterly data (15-, 30-, and 60-minute durations) ranged from 24 to 33 years at the eight National Weather Service stations, and the periods of record for the hourly data (1-, 2-, 3-, 6-, 12-, and 24-hour durations) generally were about 55 years. One of the NOAA datasets consisted only of precipitation totals from the National Weather Service stations. The other NOAA dataset consisted of the eight National Weather Service stations combined with an aggregated U.S. Geological Survey site represented by using regional (county) L-moment statistics to simulate a set of statistics for one site (as though only one U.S. Geological Survey site had been in operation).
The L-moment method used in this report is the col-lective group of statistical techniques used in the analyses of annual maximum precipitation totals to compute the regional weighted L-moment statistics for each duration. The L-moment statistical calculations included the mean, L-scale, coefficient of L-variation, L-skew, and L-kurtosis. L-moment ratio diagrams of the site and regional L-skew and L-kurtosis statistics plotted against selected theoretical probability distributions resulted in the use of the generalized logistic and extreme-value distributions as the most appropriate for estimating precipitation frequency. Precipitation-frequency estimates were provided as depth-duration values, in inches, and intensity-duration values, in inches per hour. Values also were presented as precipitation-frequency curves to assess the differences in results from the four datasets. For comparative purposes, tabulated and graphical frequency information presented in this report include values determined from previous and similar studies completed by the National Weather Service.
Precipitation-frequency curves were examined in the order of ascending recurrence intervals, and the spread between the curves for the CRN initial and CRN modified datasets generally increased. Beginning with the 60-minute duration and 5-year recurrence interval, percentage differ-ences between many of the corresponding depths in the two datasets exceeded 15 percent, indicating that the large annual maximum precipitation totals for 1995 and 1997 exerted a
high degree of influence on the results. The precipitation depths for the NOAA datasets exhibited a smaller degree of spread than the CRN datasets and generally tended to straddle the midrange between the CRN datasets. Comparisons of precipitation depths between the combined NOAA and aggregated U.S. Geological Survey dataset and the CRN initial dataset indicate that percentage differences generally were less than 15 percent for durations less than 6 hours and for recurrence intervals less than 25 years. The estimated 24-hour, 100-year precipitation depth of 10.99 inches for the CRN initial dataset is about 51 percent higher than the corresponding value of 7.29 inches for the combined NOAA and aggregated U.S. Geological Survey dataset.
The small sample available from the U.S. Geological Survey precipitation network, which was influenced by the occurrence of two large observations (1995 and 1997), indicates that frequency characteristics may be biased higher than actual values. Resolution of this question can only be accomplished with additional data. In the absence of further analyses, results from the combined NOAA and aggregated U.S. Geological Survey dataset currently (2005) can be considered appropriate for use in deriving frequency char-acteristics for Mecklenburg County. This combined dataset provides consideration of the substantial amount of precipita-tion data, including some large rainfalls that have occurred in the county, and the NOAA precipitation data representing longer periods of record.
IntroductionThe characterization of precipitation frequency is
an important component in hydrologic investigations and engineering design. An understanding of the varying nature of input (precipitation) to the hydrologic system allows for the prediction of output (stream runoff) from the system. Hydrolo-gists use precipitation-frequency information to develop models for use in predicting runoff and flood inundation. Engineers use precipitation-frequency information in making decisions concerning the size of hydraulic structures, such as culverts and bridges. Governmental entities involved in hydraulic engineering design rely on established durations and recurrence intervals (or return periods) for streamflows and(or) precipitation as standards in the design and decisionmaking processes. For example, an interstate highway bridge is designed for a specific discharge (for instance, the 100-year peak discharge) that generally is associated with precipitation having a high recurrence interval, whereas a residential street culvert is designed for a predicted streamflow with a lower recurrence interval (for instance, 25 years or less) that, likewise, is associated with precipitation having a low recur-rence interval.
The effects of increased urbanization on runoff in the city of Charlotte and Mecklenburg County, North Carolina, have been the focus of water-resources data-collection and analysis investigations conducted by the U.S. Geological Survey (USGS) since the early 1990s. Streams in the county are in the Catawba and Rocky River basins, which drain to the larger Santee River basin and Yadkin-Pee Dee River basin, respectively. These combined basins drain much of central North Carolina and South Carolina (fig. 1). The earliest USGS streamflow record in Mecklenburg County dates back to 1924, and a few other streamgaging stations in the county have records dating back to 1962.
Since 1963, the USGS has collected precipitation data at various locations in Charlotte and Mecklenburg County (Robinson and others, 1996). In October 1992, the USGS in cooperation with the city of Charlotte and Mecklenburg County began to expand areal coverage by installing additional data-collection sites, primarily within the city limits of Charlotte. By the mid- to late-1990s, precipitation data were being collected in most areas of and immediately surrounding the county; and by September 2004, data were being collected at more than 70 sites (fig. 2), 27 of which had at least 10 years of record. Because previous precipitation-frequency studies were completed 20 or more years ago and at least 10 years of more recent data were available from the USGS sites, the USGS conducted an investigation in cooperation with the city of Charlotte and Mecklenburg County to characterize the frequency of precipitation at USGS precipitation sites having at least 10 years of record.
This investigation supports USGS priority issues for the Cooperative Water Program at both the national and local levels (U.S. Geological Survey, 2005). The collection, analysis, and publication of long-term environmental and natural-resource information are part of the USGS mission (U.S. Geological Survey, 2000). Results of this investigation provide policymakers and water-resource managers in Mecklenburg County with tools and data that are essential to assessing management strategies for stormwater drainage in and around Mecklenburg County.
Purpose and Scope
This report presents the frequency of annual maximum precipitation totals for durations of 15 and 30 minutes and 1, 2, 3, 6, 12, and 24 hours; and for recurrence intervals of 2, 5, 10, 25, 50, 100, and 500 years. Data collected in Charlotte and Mecklenburg County through December 2004 were used to compile annual maximum precipitation totals for the calendar year, the period used in previous precipitation-frequency studies. Because the sites used in the analyses are located relatively close to each other (compared
2 Frequency of Annual Maximum Precipitation in the City of Charlotte and Mecklenburg County, NC, through 2004
to those that might be used in a larger regional or statewide study), the precipitation-frequency values presented in this report are based on a regional statistical assessment of the data collected at these sites. No precipitation-frequency values are presented for individual sites, and no statistical relations are given for predicting the precipitation amounts for selected durations and recurrence intervals at ungaged locations.
Previous Investigations
Although numerous USGS investigations have focused on the quantity and quality of water resources in Charlotte and Mecklenburg County, this study represents the first investigation of precipitation frequency in the study area. Observed precipitation data collected during 1993–98 as part of an investigation to characterize urban stormwater quantity and quality are documented in several USGS publications (Robinson, Hazell, and Garrett, 1996, 1998; Sarver and others, 1999). Precipitation data collected from the USGS network
were used extensively in another study to develop relations for estimating peak discharges and unit hydrographs for streams in Charlotte and Mecklenburg County (Weaver, 2003).
Previous investigations of precipitation frequency in Mecklenburg County and across North Carolina have been documented by Hershfield (1961, commonly known as Technical Paper 40 or TP–40); Miller (1964, known as Technical Paper 49); Frederick and others (1977, known as NWS (National Weather Service) HYDRO–35); and Bonnin and others (2004, known as NOAA Atlas 14). Hershfield (1961) used precipitation data for varying periods of record through 1958 from across the contiguous United States at 6,185 daily sites, 2,081 hourly sites, and 200 sites where data were collected at short intervals (30 minutes to 24 hours). Using these data, Hershfield developed the depth-duration frequency (DDF) of precipitation for durations of 30 minutes to 24 hours and return periods, or recurrence intervals, of 2 to 100 years.
Figure 1. Location of Mecklenburg County in the Catawba River and Rocky River basins in North and South Carolina.
Introduction �
Base from digital files of:U.S. Department of Commerce, Bureau of Census, 1990 Precensus TIGER/Line Files-Political boundaries, 1991U.S. Environmental Protection Agency, River File 3U.S. Geological Survey, 1:100,000 scale
84
36
35
34
33
82 80 78 76
Yadkin-Pee Dee
Basin
River
0 50 100 MILES
0 50 100 KILOMETERS
RockyRiver
Basin
Catawba
Santee
River
Basin
River
Basin
MecklenburgCounty
NORTH CAROLINA
VIRGINIA
TENNESSEE
SOUTH CAROLINA
GEORGIA
BASIN BOUNDARY LINEEXPLANATION
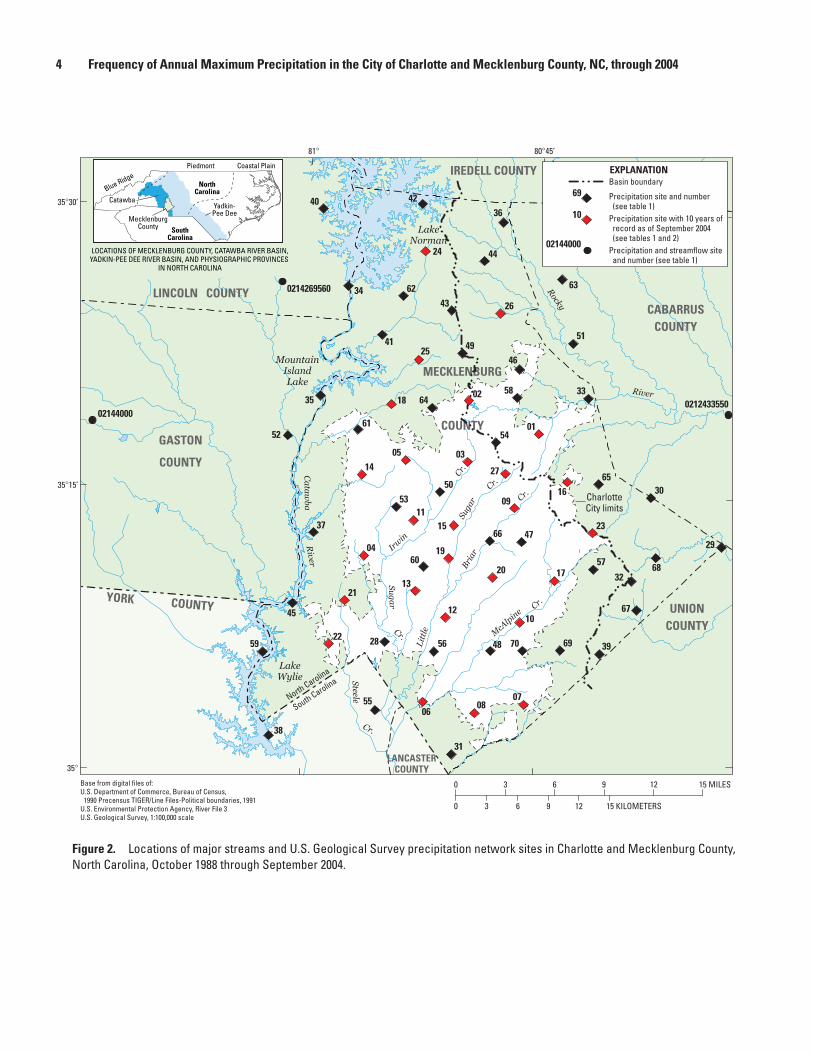
Figure 2. Locations of major streams and U.S. Geological Survey precipitation network sites in Charlotte and Mecklenburg County, North Carolina, October 1988 through September 2004.
4 Frequency of Annual Maximum Precipitation in the City of Charlotte and Mecklenburg County, NC, through 2004
Base from digital files of:U.S. Department of Commerce, Bureau of Census, 1990 Precensus TIGER/Line Files-Political boundaries, 1991U.S. Environmental Protection Agency, River File 3U.S. Geological Survey, 1:100,000 scale
Blue RidgePiedmont
CatawbaYadkin-
Pee Dee
Coastal Plain
LOCATIONS OF MECKLENBURG COUNTY, CATAWBA RIVER BASIN,YADKIN-PEE DEE RIVER BASIN, AND PHYSIOGRAPHIC PROVINCES
IN NORTH CAROLINA
MecklenburgCounty South
Carolina
NorthCarolina
MECKLENBURG
COUNTY
LINCOLN COUNTY
GASTON
COUNTY
CABARRUSCOUNTY
UNIONCOUNTY
ROWANCOUNTY
IREDELL COUNTY
0 3 6 9 12 15 MILES
0 3 6 9 12 15 KILOMETERS
YORK COUNTY
LANCASTERCOUNTY
South Carolina
North Carolina
Basin boundary
Precipitation site and number (see table 1)Precipitation site with 10 years of record as of September 2004 (see tables 1 and 2)Precipitation and streamflow site and number (see table 1)
EXPLANATION
70
10
69
68
67
66
65
19
59 5628
55
48
47
45
40
39
38
37
340214269560
02144000
32
31
30
29
23
57
CharlotteCity limits
22
21
2060
17
15
13
12
11
0807
69
10
04
8045’81
LakeNorman
LakeWylie
0212433550
MountainIslandLake
06
02144000
3530’
3515’
35
24
64
6362
61
1858
54
5053
52
35
514941
46
44
43
4236
33
27
26
16
14
09
05
02
01
03
25
McA
lpin
e
Lit
tle
Suga
r
Cr.
Cr.
Bria
r
Cr.
Cr.
Sug
ar
Irwin
Cr.
Rocky
River
Steele
Cr.
Ca
taw
baR
iver
Miller (1964) used additional data available through 1961 as well as some of Hershfield’s (1961) results to extend the DDF statistics for durations of 2 to 10 days at return periods of 2 to 100 years. Frederick and others (1977) likewise used additional data available through 1972 at 1,900 hourly sites and 200 sites where data were collected at short intervals (5 to 60 minutes) to develop the DDF of precipitation for durations of 5 to 60 minutes and return periods of 2 to 100 years.
More recently, the NWS has begun the process of updating precipitation-frequency statistics for the United States (Bonnin and others, 2004) based on available periods of record through December 2000 and replacing those provided by Hershfield (1961), Miller (1964), and Frederick and others (1977). By spring 2005, updated statistics had been released for two areas—the semiarid southwestern United States, including New Mexico, Arizona, Utah, Nevada, and portions of southern California (volume 1); and the Ohio River basin and surrounding States, including North Carolina and the District of Columbia among the 13 States (volume 2).
Acknowledgments
The foresight and leadership in initiating and conduct-ing this investigation and previous USGS investigations in Mecklenburg County are credited to Mr. Jim Schumacher, City of Charlotte, and Mr. Dave Canaan, Mecklenburg County. Additionally, important contributions to this investigation were made by numerous other Charlotte-Mecklenburg Storm Water Services employees, including Mr. Tom Calhoun, City of Charlotte, and Mr. Bill Tingle, Mecklenburg County.
The author acknowledges Dr. William H. Asquith of the USGS Texas Water Science Center for his guidance in the precipitation-frequency methods used during this investiga-tion. Dr. Asquith has conducted a number of investigations of the effects of precipitation frequency on the hydrologic system in Texas. In particular, his knowledge and instruction of the L-moment method proved invaluable in the completion of the study for Mecklenburg County and, subsequently, in the completion of this report. Some material from Dr. Asquith’s previous reports, particularly the discussion pertaining to the L-moment method, has been reproduced in this report.
The author also acknowledges Ms. Sue Giller, Hydro-sphere Data Products, Inc., who compiled annual maximum precipitation totals for NWS stations in North Carolina and South Carolina. Use of these precipitation data provided a stronger basis for assessing the data collected at the USGS sites.
Finally, the author acknowledges Mr. William F. Hazell of the USGS and Ms. Nicole Scheman, formerly of the USGS, who compiled and reviewed the extensive volume of USGS precipitation data used in this investigation.
Description of the Study AreaMecklenburg County is in south-central North Carolina
in the southern Piedmont Physiographic Province and encompasses a total area of about 567 square miles (mi2). The county is bounded on the west by the Catawba River and its reservoirs—part of Lake Norman, Mountain Island Lake, and part of Lake Wylie (fig. 2), which compose 21.9 mi2 of the county area. Charlotte is the principal municipality in Meck-lenburg County and the largest city in North Carolina. The city encompasses about 237 mi2, or 43.5 percent of Mecklenburg County’s nearly 545-mi2 land area.
The 2003 population for the incorporated area of Charlotte was nearly 585,000, and the total population of Mecklenburg County was about 752,000 (U.S. Census Bureau, 2005). These numbers are 37.0 and 47.1 percent higher than the corresponding 1990 population values. The higher percentage change for the county represents the expansion of urban development into unincorporated areas of the county.
Approximately 75 percent of Mecklenburg County is drained by the Catawba River, which is part of the Santee River basin. The remaining 25 percent of the county is drained by the Rocky River and its tributaries in the Yadkin-Pee Dee River basin (fig. 2). Most of the Charlotte metropolitan area is drained by four large creeks—Irwin, Little Sugar, Briar, and McAlpine Creeks (fig. 2).
Setting and Climate
The topography of Mecklenburg County is character-ized by broad, gently rolling interstream areas and by steep slopes along the drainage ways. The elevation of the county ranges from 520 feet (ft) at the State line at the county’s southern border to about 830 ft in the extreme northern part of the county (McCachren, 1980). The area is predominately underlain by granite with some slate in the southeast (LeGrand and Mundorff, 1952). The soils in the county are described as well-drained, sandy loams with a clayey subsoil.
The climate of the county is characterized by hot, humid summers and short, mild winters with more moderate conditions during the spring and fall. The monthly mean temperature at Charlotte Douglas Airport ranges from about 42 degrees Fahrenheit (°F) in January to about 80 °F in July (National Oceanic and Atmospheric Administration, 2004). In all areas of the county, daily maximum temperatures in the summer frequently reach levels exceeding 90 °F, sometimes for long periods of consecutive days.
Precipitation in Mecklenburg County averages about 43 inches per year (in/yr), similar to most areas of central North Carolina where average precipitation is between 40 and 50 in/yr. In comparison, the lowest and highest average precipitation recorded in North Carolina are about 37 in/yr in Asheville (Buncombe County) and 92 in/yr in Lake Toxaway (Transylvania County) in the western part of the State (State Climate Office of North Carolina, 2005).
Description of the Study Area �
Because the determination of precipitation frequency is based on annual maximum precipitation totals observed at data-collection sites, it is interesting to note some of the large precipitation amounts that have been recorded in the region. Though large precipitation amounts generally occur as a result of intense thunderstorms during the summer, many of the larger totals are associated with tropical storms during late summer and fall.
In North Carolina, the greatest 24-hour precipitation total on record is 22.2 inches observed July 15–16, 1916, in Altapass (Mitchell County) as a result of a tropical storm that came inland from the South Carolina coast and caused some of the most extensive and destructive flooding on record (Zembrzuski and others, 1991; State Climate Office of North Carolina, 2005). During September 6–9, 2004, rainfall totals in western North Carolina associated with Hurricane Frances exceeded 12 inches in several areas, and some isolated totals exceeded 18 inches, causing widespread, catastrophic flooding (National Weather Service, 2004a). Only 2 weeks later, rainfall from Hurricane Ivan (September 16–19, 2004) drenched areas of western North Carolina, resulting in substantial additional runoff to the already high flows occurring in the mountainous terrain. Compared to Hurricane Frances, however, rainfall totals from Hurricane Ivan generally were between 4 and 8 inches, and only a few totals exceeded 8 inches in the severely flooded basins of the higher elevations (National Weather Service, 2004b).
In Mecklenburg County, the largest daily precipitation total at the NWS climate observation station at Charlotte Douglas Airport is 6.88 inches recorded on July 23, 1997, during the passage of Hurricane Danny (Southeast Regional Climate Center, 2005). Other notable daily rainfall totals recorded at this station include 4.51 inches on August 3, 1978, and 4.21 inches on October 4, 1992 (Southeast Regional Climate Center, 2005). Because daily totals reflect 24-hour amounts measured at fixed times (for instance, from 8:00 a.m. to 8:00 a.m.), daily totals typically are less than 24-hour precipitation totals for storms occurring for 2 or more consecutive days. Maximum 24-hour totals recorded at the USGS precipitation sites during July 22–24, 1997, were between 9 and 9.5 inches at several sites. Robinson, Hazell, and Young (1998), however, reported a maximum rainfall amount of 11.40 inches for a continuous 24-hour period during this same storm (site 30, fig. 2). Other notable 24-hour totals over 8 inches were recorded at the USGS precipitation sites (maximum 8.7 inches at site 20, fig. 2) during Tropical Storm Jerry, August 26–28, 1995.
U.S. Geological Survey Precipitation Data-Collection Sites
The precipitation data analyzed during this investigation were collected from an extensive USGS network of raingages located throughout the city of Charlotte and Mecklenburg
County (fig. 2; table 1). Near the beginning of the 1993 water year1, the raingage network consisted of 14 data-collection sites providing coverage predominantly across the southern two-thirds of the county. By the end of the 2004 water year, a network of more than 70 precipitation data-collection sites provided coverage for the entire county and parts of adjacent counties.
Although the size of the network has varied since the 1993 water year, 27 of the USGS data-collection sites had at least 10 years of record at the end of the 2004 water year. Missing record at one site resulted in removal of the site from this investigation. Precipitation data collected at the remaining 26 sites as of December 2004 were included in the analyses to characterize the frequency of precipitation for the county. Annual maximum precipitation totals were computed by using the calendar year, which is consistent with the annual period used in previous precipitation-frequency studies. Further information on the USGS raingage network is provided by Hazell and Bales (1997) and U.S. Geological Survey (2004).
Data Compilation and Analytical Methods
Regionalization is the process of developing statistical relations and(or) mapping of spatially varying factors or other statistical parameters that can be used to estimate environ-mental phenomena (for example, peak discharges, rainfall totals) where observed data are not available. Regionalization techniques commonly are applied to data collected from large study areas, such as a physiographic province, a region having similar geologic or soil characteristics, a state, or even a multistate area. Such techniques generally are designed to permit the determination of estimates where site-specific data are not available (for example, the estimation of peak discharges or precipitation amounts for 100-year recurrence intervals at ungaged sites).
Because the study area for this report consists of one county (Mecklenburg), the determination of regional or countywide estimates for the selected durations and recurrence intervals was based on the use of regional L-moment statistics fitted to an appropriate probability distribution. No statistical relations or mapping of spatial factors were developed for esti-mating precipitation at ungaged locations where site-specific data are not available. For instance, as presented in this report, the annual 24-hour maximum precipitation estimated for a given recurrence interval is considered applicable to all areas of the county. This section describes the precipitation data compiled for the study and presents a brief description of the L-moment method.
1Water year is the 12-month period from October 1 through September 30 and is identified by the year in which the period ends. For example, the 2004 water year is from October 1, 2003, to September 30, 2004.
� Frequency of Annual Maximum Precipitation in the City of Charlotte and Mecklenburg County, NC, through 2004
Tabl
e 1.
U.
S. G
eolo
gica
l Sur
vey
prec
ipita
tion
netw
ork
site
s in
Mec
klen
burg
Cou
nty,
Nor
th C
arol
ina,
Oct
ober
198
8 th
roug
h Se
ptem
ber 2
004.
— C
ontin
ued
[CM
UD
, Cha
rlot
te-M
eckl
enbu
rg U
tiliti
es D
epar
tmen
t; SR
, sec
onda
ry r
oad;
WW
TP,
was
tew
ater
-tre
atm
ent p
lant
. Site
s lis
ted
in th
is ta
ble
are
thos
e w
here
dat
a co
llect
ion
was
ong
oing
as
of S
epte
mbe
r 20
04.
Site
s sh
aded
in r
ed a
re th
ose
for
whi
ch a
nnua
l max
imum
pre
cipi
tatio
n to
tals
wer
e co
mpu
ted
for
incl
usio
n in
the
freq
uenc
y an
alys
es (
see
tabl
e 2)
. Ann
ual m
axim
um p
reci
pita
tion
tota
ls w
ere
calc
ulat
ed b
y us
ing
data
thro
ugh
the
2004
cal
enda
r ye
ar, w
hich
is c
onsi
sten
t with
the
annu
al p
erio
d us
ed in
oth
er p
reci
pita
tion-
freq
uenc
y st
udie
s]
Site
in
dex
num
ber
(fig.
2)
Stat
ion
num
bera
Latit
ude
Long
itude
Loca
tionb
Dra
inag
e ba
sin
Beg
in p
erio
d of
reco
rdc
1
3518
1208
0445
545
35°1
8'12
"80
°44'
55"
CR
N01
, Fir
e St
atio
n 27
, Ken
Hof
fman
Dri
veM
alla
rd C
reek
O
ct. 1
992
2
3519
5408
0493
445
35°1
9'54
"80
°49'
34"
CR
N02
, Fir
e St
atio
n 28
, Old
Sta
tesv
ille
Roa
dL
ong
Cre
ek
Oct
. 199
2
3
0214
6207
6035
°16'
32"
80°4
7'05
"C
RN
03, I
rwin
Cee
k at
Sta
rita
Roa
d at
Cha
rlot
teIr
win
Cre
ek
Oct
. 199
2
4
3511
3208
0562
345
35°1
1'32
"80
°56'
23"
CR
N04
, Fir
e St
atio
n 30
, Bel
le O
aks
Roa
dSu
gar
Cre
ek
Oct
. 199
2
5
3516
4208
0533
445
35°1
6'42
"80
°53'
34"
CR
N05
, CM
UD
Adm
inis
trat
ion
Bui
ldin
g, B
rook
shir
e B
oule
vard
Irw
in C
reek
O
ct. 1
992
6
0214
6750
35°0
3'59
"80
°52'
12"
CR
N06
, McA
lpin
e C
reek
bel
ow M
cMul
len
Cre
ek n
ear
Pine
ville
McA
lpin
e C
reek
M
ay 1
993
7
3503
5108
0454
145
35°0
3'51
"80
°45'
41"
CR
N07
, Fir
e St
atio
n 9,
McK
ee R
oad
Six
Mile
Cre
ek
Oct
. 199
2
8
3503
1408
0484
945
35°0
3'14
"80
°48'
49"
CR
N08
, St.
Mat
thew
s C
hurc
h, B
alla
ntyn
e C
omm
ons
Park
way
d Fo
ur M
ile C
reek
O
ct. 1
992
9
3514
1408
0463
245
35°1
4'14
"80
°46'
32"
CR
N09
, Fir
e St
atio
n 15
, Fro
nten
ac R
oad
Bri
ar C
reek
N
ov. 1
992
10
0214
6600
35°0
8'14
"80
°46'
05"
CR
N10
, McA
lpin
e C
reek
at S
ardi
s R
oad
near
Cha
rlot
teM
cAlp
ine
Cre
ek
Nov
. 199
2
11
3513
3108
0525
945
35°1
3'31
"80
°52'
59"
CR
N11
, Fir
e St
atio
n 10
, Rem
ount
Roa
dIr
win
Cre
ek
Nov
. 199
2
12
3508
2308
0505
345
35°0
8'23
"80
°50'
53"
CR
N12
, Fir
e St
atio
n 16
, Par
k So
uth
Dri
veL
ittle
Sug
ar C
reek
M
ar. 1
993
13
3509
4708
0524
945
35°0
9'47
"80
°52'
49"
CR
N13
, U.S
. Geo
logi
cal S
urve
y of
fice
, Tyv
ola
Roa
dSu
gar
Cre
ek
May
199
3
14
3515
5308
0562
645
35°1
5'53
"80
°56'
26"
CR
N14
, Fir
e St
atio
n 21
, Litt
le R
ock
Roa
dPa
w C
reek
M
ar. 1
993
15
3513
2008
0502
645
35°1
3'20
"80
°50'
26"
CR
N15
, Cha
rlot
te-M
eckl
ebur
g G
over
nmen
t Cen
ter,
Eas
t Fou
rth
Stre
etL
ittle
Sug
ar C
reek
M
ar. 1
993
16
3515
4008
0430
045
35°1
5'40
"80
°43'
00"
CR
N16
, Ree
dy C
reek
Par
k E
nvir
onm
enta
l Cen
ter,
Roc
ky R
iver
Roa
dR
eedy
Riv
er
Mar
. 199
3
17
3510
2308
0435
745
35°1
0'23
"80
°43'
57"
CR
N17
, Pin
ey G
rove
Ele
men
tary
Sch
ool,
Eag
lew
ind
Dri
veM
cAlp
ine
Cre
ek
Mar
. 199
3
18
0214
2900
35°1
9'42
"80
°54'
35"
CR
N18
, Lon
g C
reek
nea
r Pa
w C
reek
Lon
g C
reek
M
ar. 1
993
19
3511
3208
0504
145
35°1
1'32
"80
°50'
41"
CR
N19
, Fre
edom
Par
k, C
umbe
rlan
d D
rive
Litt
le S
ugar
Cre
ek
Sept
. 199
3
20
3510
3208
0475
245
35°1
0'32
"80
°47'
52"
CR
N20
, Fir
e St
atio
n 14
, Nor
th S
haro
n A
mity
Roa
dM
cMul
len
Cre
ek
Sept
. 199
3
21
3508
4208
0572
801
35°0
8'42
"80
°57'
28"
CR
N21
, Ken
nedy
Jun
ior
Hig
h Sc
hool
, Gal
lant
Lan
eSt
eele
Cre
ek
Sept
. 199
0
22
e 35
0623
0805
8380
135
°06'
41"
80°5
8'20
"C
RN
22, L
ake
Wyl
ie E
lem
enta
ry S
choo
l, E
rwin
Roa
dfSt
eele
Cre
ek
Sept
. 199
0
23
3513
0208
0412
701
35°1
3'02
"80
°41'
27"
CR
N23
, Cha
rles
T. M
eyer
s G
olf
Cou
rse,
Har
risb
urg
Roa
dgR
eedy
Riv
er
Oct
. 198
8
Data Compilation and Analytical Methods �
Tabl
e 1.
U.
S. G
eolo
gica
l Sur
vey
prec
ipita
tion
netw
ork
site
s in
Mec
klen
burg
Cou
nty,
Nor
th C
arol
ina,
Oct
ober
198
8 th
roug
h Se
ptem
ber 2
004.
— C
ontin
ued
[CM
UD
, Cha
rlot
te-M
eckl
enbu
rg U
tiliti
es D
epar
tmen
t; SR
, sec
onda
ry r
oad;
WW
TP,
was
tew
ater
-tre
atm
ent p
lant
. Site
s lis
ted
in th
is ta
ble
are
thos
e w
here
dat
a co
llect
ion
was
ong
oing
as
of S
epte
mbe
r 20
04.
Site
s sh
aded
in r
ed a
re th
ose
for
whi
ch a
nnua
l max
imum
pre
cipi
tatio
n to
tals
wer
e co
mpu
ted
for
incl
usio
n in
the
freq
uenc
y an
alys
es (
see
tabl
e 2)
. Ann
ual m
axim
um p
reci
pita
tion
tota
ls w
ere
calc
ulat
ed b
y us
ing
data
thro
ugh
the
2004
cal
enda
r ye
ar, w
hich
is c
onsi
sten
t with
the
annu
al p
erio
d us
ed in
oth
er p
reci
pita
tion-
freq
uenc
y st
udie
s]
Site
in
dex
num
ber
(fig.
2)
Stat
ion
num
bera
Latit
ude
Long
itude
Loca
tionb
Dra
inag
e ba
sin
Beg
in p
erio
d of
reco
rdc
24
0214
2651
35°2
7'49
"80
°52'
36"
CR
N24
, McD
owel
l Cre
ek a
t Wes
tmor
elan
d R
oad
near
Cor
neliu
sM
cDow
ell C
reek
M
ay 1
994
25
0214
2660
7535
°21'
55"
80°5
3'12
"C
RN
25, G
ar C
reek
at S
R 2
120
(McC
oy R
oad)
nea
r O
akda
leG
ar C
reek
A
pr. 1
994
26
3524
3208
0473
745
35°2
4'32
"80
°47'
37"
CR
N26
, Bra
dfor
d A
irfi
eld,
Hun
ters
ville
-Con
cord
Roa
d (H
unte
rsvi
lle)
Cla
rke
Cre
ek
June
199
4
27
3516
0408
0470
845
35°1
6'04
"80
°47'
08"
CR
N27
, Hid
den
Val
ley
Ele
men
tary
Sch
ool,
Snow
Whi
te L
ane
Litt
le S
ugar
Cre
ek
Oct
. 199
4
28
0214
6352
1235
°06'
57"
80°5
4'49
"C
RN
28, U
nnam
ed tr
ibut
ary
to S
ugar
Cre
ek a
t Cro
mpt
on S
tree
tSu
gar
Cre
ek
Apr
. 199
5
29
3512
1808
0331
345
35°1
2'18
"80
°33'
13"
CR
N29
, Cle
ar C
reek
Boy
Sco
ut C
amp,
Bel
t Roa
d (M
idla
nd)
Cle
ar R
iver
Fe
b. 1
996
30
3514
5508
0374
445
35°1
4'55
"80
°37'
44"
CR
N30
, pri
vate
res
iden
ce, P
each
Orc
hard
Roa
d (M
int H
ill)
McK
ee C
reek
Fe
b. 1
996
31
3501
1008
0502
045
35°0
1'10
"80
°50'
20"
CR
N31
, Elo
n H
omes
for
Chi
ldre
n, A
rdre
y-K
ell R
oad
Six
Mile
Cre
ek
Feb.
199
6
32
3510
2808
0385
545
35°1
0'28
"80
°38'
55"
CR
N32
, Bai
n E
lem
enta
ry S
choo
l, B
ain
Scho
ol R
oad
(Min
t Hill
)G
oose
Cre
ek
Feb.
199
6
33
3520
0008
0414
645
35°2
0'00
"80
°41'
46"
CR
N33
, Mal
lard
Cre
ek W
WT
P, U
.S. H
ighw
ay 2
9 N
orth
M
alla
rd C
reek
D
ec. 1
995
34
3525
5508
0574
445
35°2
5'55
"80
°57'
44"
CR
N34
, Cow
ans
Ford
Dam
war
ehou
se, D
uke
Lan
e (H
unte
rsvi
lle)
Cat
awba
Riv
er
Feb.
199
6
35
0214
2676
0035
°20'
03"
80°5
9'12
"C
RN
35, C
ataw
ba R
iver
at M
ount
ain
Isla
nd D
amC
ataw
ba R
iver
Ja
n. 1
996
36
3529
2108
0473
245
35°2
9'21
"80
°47'
32"
CR
N36
, Wes
tfor
k su
bsta
tion,
She
arer
Roa
d (D
avid
son)
Roc
ky R
iver
Fe
b. 1
996
37
3512
4708
0592
745
35°1
2'47
"80
°59'
27"
CR
N37
, Ber
ryhi
ll E
lem
enta
ry S
choo
l, W
alke
rs F
erry
Roa
dC
ataw
ba R
iver
Fe
b. 1
996
38
3502
0008
1020
345
35°0
2'00
"81
°02'
03"
CR
N38
, Teg
a C
ay T
own
Hal
l, Te
ga C
ay D
rive
(Te
ga C
ay, S
C)
Lak
e W
ylie
Fe
b. 1
996
39
3506
3408
0405
245
35°0
6'34
"80
°40'
52"
CR
N39
, pri
vate
res
iden
ce, M
ount
Har
mon
y C
hurc
h R
oad
(Mat
thew
s)C
rook
ed C
reek
Fe
b. 1
996
40
3530
0308
0591
745
35°3
0'03
"80
°59'
17"
CR
N40
, Wes
tpor
t Gol
f C
ours
e (D
enve
r)h
Lak
e N
orm
an
Feb.
199
6
41
0214
2660
0035
°23'
22"
80°5
5'16
"C
RN
41, M
cDow
ell C
reek
nea
r C
harl
otte
McD
owel
l Cre
ek
Nov
. 199
6
42
3530
1408
0524
945
35°3
0'14
"80
°52'
49"
CR
N42
, pri
vate
res
iden
ce, N
orm
an S
hore
s D
rive
(C
orne
lius)
iL
ake
Nor
man
Ja
n. 1
997
43
3524
4008
0505
045
35°2
4'40
"80
°50'
50"
CR
N43
, Hun
ters
ville
Ele
men
tary
Sch
ool,
Gile
ad R
oad
(Hun
ters
ville
)M
cDow
ell C
reek
Ja
n. 1
997
44
3527
1808
0484
345
35°2
7'18
"80
°48'
43"
CR
N44
, pri
vate
res
iden
ce, M
ayes
Roa
d (H
unte
rsvi
lle)
Cla
rke
Cre
ek
Jan.
199
7
45
3509
0308
1004
545
35°0
9'03
"81
°00'
45"
CR
N45
, pri
vate
res
iden
ce, W
ither
s C
ove
Roa
dC
ataw
ba R
iver
Ja
n. 1
997
46
3521
3508
0462
045
35°2
1'35
"80
°46'
20"
CR
N46
, pri
vate
res
iden
ce, J
ohns
ton-
Oeh
ler
Roa
dM
alla
rd C
reek
Ja
n. 1
997
� Frequency of Annual Maximum Precipitation in the City of Charlotte and Mecklenburg County, NC, through 2004
Tabl
e 1.
U.
S. G
eolo
gica
l Sur
vey
prec
ipita
tion
netw
ork
site
s in
Mec
klen
burg
Cou
nty,
Nor
th C
arol
ina,
Oct
ober
198
8 th
roug
h Se
ptem
ber 2
004.
— C
ontin
ued
[CM
UD
, Cha
rlot
te-M
eckl
enbu
rg U
tiliti
es D
epar
tmen
t; SR
, sec
onda
ry r
oad;
WW
TP,
was
tew
ater
-tre
atm
ent p
lant
. Site
s lis
ted
in th
is ta
ble
are
thos
e w
here
dat
a co
llect
ion
was
ong
oing
as
of S
epte
mbe
r 20
04.
Site
s sh
aded
in r
ed a
re th
ose
for
whi
ch a
nnua
l max
imum
pre
cipi
tatio
n to
tals
wer
e co
mpu
ted
for
incl
usio
n in
the
freq
uenc
y an
alys
es (
see
tabl
e 2)
. Ann
ual m
axim
um p
reci
pita
tion
tota
ls w
ere
calc
ulat
ed b
y us
ing
data
thro
ugh
the
2004
cal
enda
r ye
ar, w
hich
is c
onsi
sten
t with
the
annu
al p
erio
d us
ed in
oth
er p
reci
pita
tion-
freq
uenc
y st
udie
s]
Site
in
dex
num
ber
(fig.
2)
Stat
ion
num
bera
Latit
ude
Long
itude
Loca
tionb
Dra
inag
e ba
sin
Beg
in p
erio
d of
reco
rdc
47
3512
2908
0460
245
35°1
2'29
"80
°46'
02"
CR
N47
, Win
terf
ield
Ele
men
tary
Sch
ool,
Win
terf
ield
Pla
ceB
riar
Cre
ek
Mar
. 199
9
48
3506
3708
0475
645
35°0
6'37
"80
°47'
56"
CR
N48
, Old
e Pr
ovid
ence
Ele
men
tary
Sch
ool,
Rea
Roa
dM
cAlp
ine
Cre
ek
Mar
. 199
9
49
3522
2408
0500
345
35°2
2'24
"80
°50'
03"
CR
N49
, Nor
th M
eckl
enbu
rg H
igh
Scho
ol, O
ld S
tate
svill
e R
oad
(Hun
ters
ville
)L
ong
Cre
ek
Apr
. 199
9
50
3515
0208
0512
045
35°1
5'02
"80
°51'
20"
CR
N50
, Ves
t Tre
atm
ent P
lant
jIr
win
Cre
ek
Mar
. 199
9
51
3523
1008
0424
845
35°2
3'10
"80
°42'
48"
CR
N51
, Con
cord
Reg
iona
l Air
port
, Avi
atio
n B
oule
vard
(C
onco
rd)
Roc
ky R
iver
Ju
ne 2
000
52
3517
5308
1011
745
35°1
7'53
"81
°01'
17"
CR
N52
, Ida
Ran
kin
Ele
men
tary
Sch
ool,
Cen
tral
Ave
nue
(Mt.
Hol
ly)
Cat
awba
Riv
er
May
200
0
53
3514
1208
0541
245
35°1
4'12
"80
°54'
12"
CR
N53
, Har
ding
Uni
vers
ity H
igh
Scho
ol, A
llegh
any
Stre
etSu
gar
Cre
ek
May
200
0
54
3517
4108
0475
045
35°1
7'43
"80
°47'
46"
CR
N54
, Der
ita E
lem
enta
ry S
choo
l, W
est S
ugar
Cre
ek R
oad
Mal
lard
Cre
ek
May
200
0
55
3503
2408
0551
845
35°0
3'24
"80
°55'
18"
CR
N55
, pri
vate
res
iden
ce, H
amm
ond
Roa
d (F
ort M
ill, S
C)
Suga
r C
reek
Ju
ne 2
000
56
3506
3508
0513
245
35°0
6'35
"80
°51'
32"
CR
N56
, Sou
th M
eckl
enbu
rg H
igh
Scho
ol, P
ark
Roa
dL
ittle
Sug
ar C
reek
M
ay 2
000
57
3511
0908
0412
145
35°1
1'09
"80
°41'
21"
CR
N57
, Leb
anon
Roa
d E
lem
enta
ry S
choo
l, L
eban
on R
oad
McA
lpin
e C
reek
A
pr. 2
000
58
3520
0608
0462
845
35°2
0'06
"80
°46'
28"
CR
N58
, Mal
lard
Cre
ek E
lem
enta
ry S
choo
l, M
alla
rd C
reek
Roa
dkM
alla
rd C
reek
Ju
ne 2
000
59
3506
2408
1023
345
35°0
6'24
"81
°02'
33"
CR
N59
, YM
CA
Cam
p T
hund
erbi
rd, T
hund
erbi
rd L
ane
(Lak
e W
ylie
, SC
)C
ataw
ba R
iver
Ju
ne 2
000
60
3511
0408
0521
845
35°1
1'04
"80
°52'
18"
CR
N60
, Col
linsw
ood
Ele
men
tary
Sch
ool,
App
lega
te R
oad
Litt
le S
ugar
Cre
ek
Apr
. 200
0
61
3518
1608
0564
345
35°1
8'16
"80
°56'
43"
CR
N61
, Cou
lwoo
d M
iddl
e Sc
hool
, Ken
tber
ry R
oad
Lon
g C
reek
Se
pt. 2
001
62
3525
2308
0535
545
35°2
5'23
"80
°53'
55"
CR
N62
, Coo
ke F
arm
, Erv
in C
ooke
Roa
dM
cDow
ell C
reek
O
ct. 2
002
63
3526
2308
0434
145
35°2
6'23
"80
°43'
41"
CR
N63
, Ode
ll E
lem
enta
ry S
choo
l, O
dell
Scho
ol R
oad
(Con
cord
)R
ocky
Riv
er
Sept
. 200
2
64
3519
2808
0515
645
35°1
9'28
"80
°51'
56"
CR
N64
, Hor
nets
Nes
t Ele
men
tary
Sch
ool,
Bea
tties
For
d R
oad
Lon
g C
reek
A
ug. 2
001
65
3515
3608
0410
645
35°1
5'36
"80
°41'
06"
CR
N65
, Ree
dy C
reek
Ele
men
tary
Sch
ool,
Plaz
a R
oad
Ext
ensi
onR
eedy
Cre
ek
July
200
1
66
3512
2908
0480
145
35°1
2'29
"80
°48'
01"
CR
N66
, Cha
ntill
y E
lem
enta
ry S
choo
l, B
riar
Cre
ek R
oad
Bri
ar C
reek
D
ec. 2
001
67
3508
5708
0383
245
35°0
8'57
"80
°38'
32"
CR
N67
, Tho
mps
on R
oad
(Min
t Hill
)G
oose
Cre
ek
Oct
. 200
2
68
3511
4508
0371
945
35°1
1'45
"80
°37'
19"
CR
N68
, Whi
te F
arm
, Bar
tlett
Roa
d (M
int H
ill)
Cle
ar C
reek
A
ug. 2
001
Data Compilation and Analytical Methods �
Tabl
e 1.
U.
S. G
eolo
gica
l Sur
vey
prec
ipita
tion
netw
ork
site
s in
Mec
klen
burg
Cou
nty,
Nor
th C
arol
ina,
Oct
ober
198
8 th
roug
h Se
ptem
ber 2
004.
— C
ontin
ued
[CM
UD
, Cha
rlot
te-M
eckl
enbu
rg U
tiliti
es D
epar
tmen
t; SR
, sec
onda
ry r
oad;
WW
TP,
was
tew
ater
-tre
atm
ent p
lant
. Site
s lis
ted
in th
is ta
ble
are
thos
e w
here
dat
a co
llect
ion
was
ong
oing
as
of S
epte
mbe
r 20
04.
Site
s sh
aded
in r
ed a
re th
ose
for
whi
ch a
nnua
l max
imum
pre
cipi
tatio
n to
tals
wer
e co
mpu
ted
for
incl
usio
n in
the
freq
uenc
y an
alys
es (
see
tabl
e 2)
. Ann
ual m
axim
um p
reci
pita
tion
tota
ls w
ere
calc
ulat
ed b
y us
ing
data
thro
ugh
the
2004
cal
enda
r ye
ar, w
hich
is c
onsi
sten
t with
the
annu
al p
erio
d us
ed in
oth
er p
reci
pita
tion-
freq
uenc
y st
udie
s]
Site
in
dex
num
ber
(fig.
2)
Stat
ion
num
bera
Latit
ude
Long
itude
Loca
tionb
Dra
inag
e ba
sin
Beg
in p
erio
d of
reco
rdc
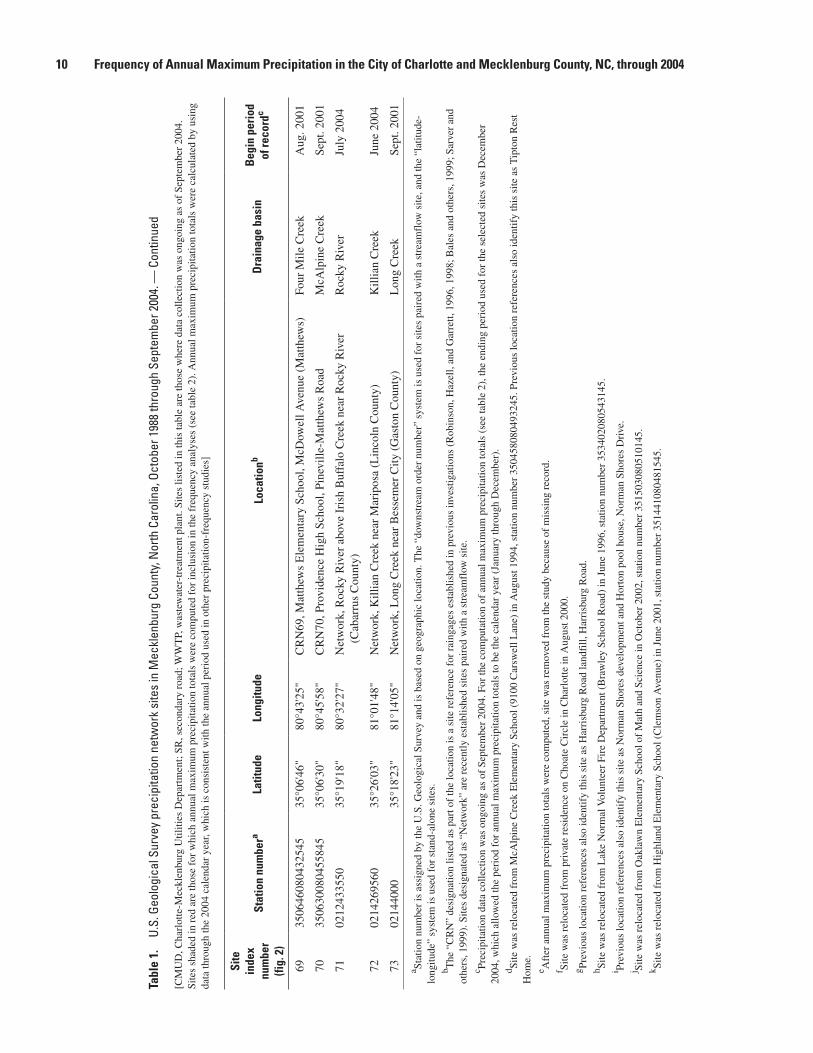
69
3506
4608
0432
545
35°0
6'46
"80
°43'
25"
CR
N69
, Mat
thew
s E
lem
enta
ry S
choo
l, M
cDow
ell A
venu
e (M
atth
ews)
Four
Mile
Cre
ek
Aug
. 200
1
70
3506
3008
0455
845
35°0
6'30
"80
°45'
58"
CR
N70
, Pro
vide
nce
Hig
h Sc
hool
, Pin
evill
e-M
atth
ews
Roa
dM
cAlp
ine
Cre
ek
Sept
. 200
1
71
0212
4335
5035
°19'
18"
80°3
2'27
"N
etw
ork,
Roc
ky R
iver
abo
ve I
rish
Buf
falo
Cre
ek n
ear
Roc
ky R
iver
(C
abar
rus
Cou
nty)
Roc
ky R
iver
Ju
ly 2
004
72
0214
2695
6035
°26'
03"
81°0
1'48
"N
etw
ork,
Kill
ian
Cre
ek n
ear
Mar
ipos
a (L
inco
ln C
ount
y)K
illia
n C
reek
Ju
ne 2
004
73
0214
4000
35°1
8'23
"81
°14'
05"
Net
wor
k, L
ong
Cre
ek n
ear
Bes
sem
er C
ity (
Gas
ton
Cou
nty)
Lon
g C
reek
Se
pt. 2
001
a Stat
ion
num
ber
is a
ssig
ned
by th
e U
.S. G
eolo
gica
l Sur
vey
and
is b
ased
on
geog
raph
ic lo
catio
n. T
he “
dow
nstr
eam
ord
er n
umbe
r” s
yste
m is
use
d fo
r si
tes
pair
ed w
ith a
str
eam
flow
site
, and
the
“lat
itude
-lo
ngitu
de”
syst
em is
use
d fo
r st
and-
alon
e si
tes.
b The
“C
RN
” de
sign
atio
n lis
ted
as p
art o
f th
e lo
catio
n is
a s
ite r
efer
ence
for
rai
ngag
es e
stab
lishe
d in
pre
viou
s in
vest
igat
ions
(R
obin
son,
Haz
ell,
and
Gar
rett,
199
6, 1
998;
Bal
es a
nd o
ther
s, 1
999;
Sar
ver
and
othe
rs, 1
999)
. Site
s de
sign
ated
as
“Net
wor
k” a
re r
ecen
tly e
stab
lishe
d si
tes
pair
ed w
ith a
str
eam
flow
site
.c Pr
ecip
itatio
n da
ta c
olle
ctio
n w
as o
ngoi
ng a
s of
Sep
tem
ber
2004
. For
the
com
puta
tion
of a
nnua
l max
imum
pre
cipi
tatio
n to
tals
(se
e ta
ble
2), t
he e
ndin
g pe
riod
use
d fo
r th
e se
lect
ed s
ites
was
Dec
embe
r 20
04, w
hich
allo
wed
the
peri
od f
or a
nnua
l max
imum
pre
cipi
tatio
n to
tals
to b
e th
e ca
lend
ar y
ear
(Jan
uary
thro
ugh
Dec
embe
r).
d Site
was
rel
ocat
ed f
rom
McA
lpin
e C
reek
Ele
men
tary
Sch
ool (
9100
Car
swel
l Lan
e) in
Aug
ust 1
994,
sta
tion
num
ber
3504
5808
0493
245.
Pre
viou
s lo
catio
n re
fere
nces
als
o id
entif
y th
is s
ite a
s T
ipto
n R
est
Hom
e.e A
fter
ann
ual m
axim
um p
reci
pita
tion
tota
ls w
ere
com
pute
d, s
ite w
as r
emov
ed f
rom
the
stud
y be
caus
e of
mis
sing
rec
ord.
f Site
was
rel
ocat
ed f
rom
pri
vate
res
iden
ce o
n C
hoat
e C
ircl
e in
Cha
rlot
te in
Aug
ust 2
000.
g Prev
ious
loca
tion
refe
renc
es a
lso
iden
tify
this
site
as
Har
risb
urg
Roa
d la
ndfi
ll, H
arri
sbur
g R
oad.
h Site
was
rel
ocat
ed f
rom
Lak
e N
orm
al V
olun
teer
Fir
e D
epar
tmen
t (B
raw
ley
Scho
ol R
oad)
in J
une
1996
, sta
tion
num
ber
3534
0208
0543
145.
i Prev
ious
loca
tion
refe
renc
es a
lso
iden
tify
this
site
as
Nor
man
Sho
res
deve
lopm
ent a
nd H
orto
n po
ol h
ouse
, Nor
man
Sho
res
Dri
ve.
j Site
was
rel
ocat
ed f
rom
Oak
law
n E
lem
enta
ry S
choo
l of
Mat
h an
d Sc
ienc
e in
Oct
ober
200
2, s
tatio
n nu
mbe
r 35
1503
0805
1014
5.k Si
te w
as r
eloc
ated
fro
m H
ighl
and
Ele
men
tary
Sch
ool (
Cle
mso
n A
venu
e) in
Jun
e 20
01, s
tatio
n nu
mbe
r 35
1441
0804
8154
5.
10 Frequency of Annual Maximum Precipitation in the City of Charlotte and Mecklenburg County, NC, through 2004
Precipitation Data
Precipitation data at USGS sites having at least 10 years of record were used in the computation of annual maximum precipitation totals. Although most of the precipitation data-collection sites are located in the southern two-thirds of Mecklenburg County (primarily within the Charlotte city limits), the spatial distribution of the sites provides a countywide coverage for assessing the frequency of annual maximum precipitation totals (fig. 2). Initially, 27 sites were selected for analysis, but 1 site had substantial missing record and was removed from the study. The availability of data recorded at 5-minute intervals permitted the compilation of annual maximum precipitation totals for selected durations (15 minutes to 24 hours) based on actual beginning and ending times of precipitation and not on an arbitrary fixed time of data collection. For example, the 1-hour maximum total for a given calendar year is likely to be for a compilation period that begins at a 5-minute interval other than at the top of the hour. Consistent with other precipitation-frequency studies, annual maximum totals were compiled using the calendar year (January through December; table 2, p. 40; fig. 3).
The available periods of record at the USGS data- collection sites are relatively short compared with the periods
of record commonly used to complete frequency studies. Additionally, maximum values of precipitation in 1995 and 1997 (table 2) generally were much larger than in other years because of the extremely large rainfall amounts associated with storms that caused extensive flooding in Mecklenburg County (Robinson, Hazell, and Young, 1998). Two very large observations in the relatively small sample of precipitation totals led to concern that statistical results could be biased by the 1995 and 1997 values. Thus, annual maximum precipitation values at the USGS sites were computed for two scenarios—an initial compilation (the Charlotte Raingage Network (CRN) initial dataset) of precipitation totals included the August 1995 and July 1997 storm totals, and a modified compilation (the CRN modified dataset) replaced the large storm values for August 1995 and July 1997 with the second largest values for these years (table 2). Including the CRN modified dataset in the analysis of the USGS data served as a sensitivity test to assess the influence of the 1995 and 1997 precipitation totals on the overall statistical results.
To further investigate the effects of relatively short periods of record on precipitation frequency at the USGS sites, annual maximum precipitation totals for eight selected long-term NWS precipitation stations in the vicinity of Mecklenburg County also were compiled for durations from
Figure �. Time series of annual maximum of 24-hour (1,440-minute) precipitation totals at selected U.S. Geological Survey precipitation sites in or near Mecklenburg County, North Carolina.
Data Compilation and Analytical Methods 11
Note: Black indicates exclusion of August 1995 and July 1997 storms in determining 24-hour annual maximum precipitation totals.
CRN05, Charlotte-Mecklenburg Utilities Department Administration Building, Brookshire Boulevard
Note: Black indicates exclusion of August 1995 and July 1997 storms in determining 24-hour annual maximum precipitation totals.
1994 1995 1996 1997 1998 1999
CALENDAR YEAR
2000 2001 2002 2003 2004
10
8
6
4
2
0
ANN
UAL
MAX
IMUM
24-
HOUR
PRE
CIPI
TATI
ON, I
N IN
CHES
CRN10, U.S. Geological Survey station 02146600, McAlpine Creek at Sardis Road near Charlotte
CRN01, Fire Station 27 at Ken Hoffman Drive
15 minutes (quarterly) to 24 hours (fig. 4; table 3). Within NOAA, precipitation data for NWS stations are available from several datasets maintained by the National Climatic Data Center (NCDC) in Asheville, North Carolina (National Climatic Data Center, 2004). These NOAA datasets include quarterly, hourly, and daily precipitation data collected across the United States. For this study, the annual maximum precipitation totals through December 2003 were compiled for the NWS stations in North and South Carolina (Ms. Sue Giller, Hydrosphere Data Products, Inc., written commun., November 24, 2004).
Precipitation data from the quarterly dataset for the eight NWS stations were used to compute the annual maximum totals for 15- and 30-minute and 1-hour durations. Similarly, precipitation data from the hourly dataset were used to compute the annual maximum totals for 1-, 2-, 3-, 6-, 12-, and 24-hour durations. The resulting dataset consists of seven sites for the 15- and 30-minute durations and eight sites for the 1- to 24-hour durations. (No quarterly precipitation data were available for the NWS station at Charlotte Douglas Airport; table 3, fig. 4.) The periods of record for the quarterly data ranged from 24 to 33 years at the eight selected stations
(table 3), and the periods of record for the hourly and daily datasets generally were about 55 years. Annual maximum precipitation totals were compiled from the quarterly and hourly datasets at the eight selected stations to form the third analysis included in this investigation (shown for six selected stations in fig. 5).
A fourth dataset was developed to represent a combina-tion of the NWS stations and an aggregated USGS site. This aggregated site was created by using the regional L-moment statistics to simulate one set of site statistics (as though only one USGS site had been in operation). More specifically, the fourth dataset was created by combining the regional L-moment statistics computed for each duration in the CRN initial dataset with the individual L-moment statistics from the NWS stations. Combining the aggregated USGS site with the selected NWS stations provided a means of analysis that incorporated the presence of long-term records with the USGS precipitation data while, at the same time, preventing the incorporated data from being dominated by data from 26 individual USGS sites. This resulted in a sample of eight sites for the 15- and 30-minute durations and nine sites for the 1- to 24-hour durations (table 3).
Figure � (Continued). Time series of annual maximum of 24-hour (1,440-minute) precipitation totals at selected U.S. Geological Survey precipitation sites in or near Mecklenburg County, North Carolina.
12 Frequency of Annual Maximum Precipitation in the City of Charlotte and Mecklenburg County, NC, through 2004
Note: Black indicates exclusion of August 1995 and July 1997 storms in determining 24-hour annual maximum precipitation totals.
Note: Black indicates exclusion of August 1995 and July 1997 storms in determining 24-hour annual maximum precipitation totals.
1994 1995 1996 1997 1998 1999
CALENDAR YEAR
2000 2001 2002 2003 2004
10
8
6
4
2
0
ANN
UAL
MAX
IMUM
24-
HOUR
PRE
CIPI
TATI
ON, I
N IN
CHES
CRN20, Fire Station 14, North Sharon Amity Road
CRN24, U.S. Geological Survey station 02142651, McDowell Creek at Westmoreland Road near Cornelius
CRN15, Charlotte-Mecklenburg Government Center, East Fourth Street
Figure 4. Selected National Weather Service precipitation stations in North and South Carolina in the vicinity of Mecklenburg County, North Carolina. (See table 3 and figure 5 for additional information on the National Weather Service precipitation stations.)
Including the NOAA (third and fourth) datasets in this investigation served two purposes—to analyze precipitation data collected at sites in the vicinity of Mecklenburg County having long-term records, and to provide quality assurance of results from the L-moment method applied to all datasets.
In order to compute the annual maximum totals at the USGS sites, an extensive analysis of missing precipitation data was conducted to identify years during which computed values may not represent the actual maximum precipitation that occurred at a site. Because most sites have periods of missing record and the overall available periods of record at the USGS sites during this investigation were relatively short, the assessment of missing data required considerable judgment. All periods of missing precipitation data for each site were
compiled. A comparison of the dates of annual maximum totals between a given site and the remaining sites then was made to determine whether the annual values were maximum values for the year or were affected by the missing data.
The assessment of missing records resulted in removal of records for some years from the analyses. At sites CRN03, CRN23, and CRN26, annual totals for 1995 were removed from the CRN initial dataset because of missing data during the August 1995 storm (table 2). Extended periods of missing data at site CRN22 resulted in the removal of precipitation data for this site from the analyses. Other sites where selected annual maximum precipitation totals were removed from the analyses include CRN05 (1994), CRN07 (2002), and CRN19 (1994; table 2).
Data Compilation and Analytical Methods 1�
GASTONCOUNTY
CLEVELANDCOUNTY
BURKECOUNTY
LINCOLN COUNTY
YORK COUNTY
CHEROKEECOUNTY
CATAWBA COUNTY
UNIONCOUNTY
LANCASTERCOUNTY
CHESTERFIELDCOUNTYUNION
COUNTYCHESTERCOUNTY
GASTONCOUNTY
STANLY COUNTY
CABARRUSCOUNTY
ROWAN COUNTY
DAVIDSON COUNTY
IREDELLCOUNTY
ANSONCOUNTY
South Carolina
North Carolina
0 5 10 15 MILES
0 5 10 15 KILOMETERS
Shelby 2 NNE
Shelby 2
Lockhart
Lancaster 3 SW
Polkton 2 NE
Mount Pleasant
Mooresville 2WNW
Badin
8130’
3530’
3515’
3445’
35
8115’ 81 8045’ 8030’ 8015’
Base from digital files of: U.S. Department of Commerce, Bureau of Census, 1990 Precensus TIGER/Line Files-Political boundaries, 1991 U.S. Environmental Protection Agency, River File 3 U.S. Geological Survey, 1:100,000 scale
Charlotte DouglasAirport
MECKLENBURGCOUNTY
Charlotte
LOCATION OF MECKLENBURG COUNTY, NORTH CAROLINA
Table �. Selected National Weather Service precipitation network stations in North and South Carolina in the vicinity of Mecklenburg County, North Carolina.
[N/A, not available. Stations are listed alphabetically]
National Weather Service station name (site identification)
CountyBegin precipitation record, year
Quarterlya Hourly Dailya
Badin (31-438) Stanly 1972 1948 1948
Charlotte Douglas Airport (31-1690) Mecklenburg N/Ab 1948 1948
Lancaster 3 SW (38-4918) Lancaster (South Carolina) 1980 1948 1948
Lockhart (38-5232) Union (South Carolina) 1976 1948 1948
Shelby 2 NNE (31-7845)c Cleveland 1994 1994 1893aQuarterly precipitation record represents data available at 15-minute increments, and daily precipitation record represents totals for the calendar
day (midnight to midnight).bLimited quarterly precipitation record (1973–79) was available for this site until July 1998 when collection of climate data at 5-minute inter-
vals began as part of the National Weather Service’s Automated Surface Observing System program. Because the available quarterly record does not include data for 1995 and 1997 when two major storms resulted in catastrophic flooding in Mecklenburg County, data for this site were not included in frequency analyses for durations less than 1 hour.
cQuarterly and hourly precipitation record ended at the Shelby 2 (31-7850) site in 1993 and began at Shelby 2 NNE (31-7845) in 1994. Annual maximum precipitation totals for these two stations were combined for the analyses.
Figure �. Time series of annual maximum of 24-hour (1,440-minute) precipitation totals at selected National Weather Service precipitation stations in or near Mecklenburg County, North Carolina (locations shown in fig. 4).
14 Frequency of Annual Maximum Precipitation in the City of Charlotte and Mecklenburg County, NC, through 2004
Figure � (Continued). Time series of annual maximum of 24-hour (1,440-minute) precipitation totals at selected National Weather Service precipitation stations in or near Mecklenburg County, North Carolina (locations shown in fig. 4).
L-Moment Method
The L-moment method is the collective group of statistical techniques used in the analyses of annual maximum precipitation totals to compute the regional weighted L-moment statistics for each duration. The method includes the computation of site and regional L-moment statistics, the use of L-moment diagrams to select appropriate probability distributions, and other statistical measures used to screen and assess the data used in the analyses. The discussion presented here (and in the subsequent section, L-Moment Ratio Diagrams and Goodness-of-Fit Measures) is reproduced in part from several previously published studies on precipitation frequency (Parrett, 1997; Tortorelli and others, 1999; Asquith, 2003; Bonnin and others, 2004).
The L-moment method was fully formulated by the mid-1990s and is the standard technique used in recent precipitation studies (Bonnin and others, 2004). Prior to the availability of the L-moment method, characterization of precipitation frequency (Hershfield, 1961; Miller, 1964; Frederick and others, 1977) was based on the use of conven-tional product moments. Product moments, however, are not regarded as suitable for use with many datasets, particularly those with large ranges in values, non-normal distributions, or outliers, because the biases and sampling variances are so large that statistics generated from analyses of these data tend
to be unusable (Kirby, 1974; Wallis and others, 1974; Asquith, 2003). For instance, higher-order third and fourth moments that describe sample skewness and kurtosis can be biased strongly by short periods of record (Bonnin and others, 2004).
The L-moment method allows for the computation of statistics that are more useful than the conventional-moments method in selecting the most appropriate probability distribu-tion to describe precipitation frequency. Asquith (2003, p. 92) summarized the benefits of using the L-moment method:
The L-moments provide an attractive theoretical framework because of some statistical consider-ations and their applicability to quantile functions. The L-moments have many well documented statisti-cal advantages over the product moments. Specifi-cally, L-moments are less sensitive to the presence of outliers in the data, exhibit less bias, are more accurate in small samples, and do not require loga-rithmic or other power transformations of the data. Transformations are traditionally used to reduce the skewness of the data and compensate for the short-comings of the product moments by reducing the influence of large data values. Transformations, par-ticularly logarithmic, are not always possible with data possessing zero or negative values. Further-more, logarithmic transformations generally inflate
the influence of small values, especially positive values considerably less than one. The L-moments also provide more secure inferences of distributional form than do the product moments. The L-moments specify a distribution even if some of the product moments do not exist (Hosking, 1990, p. 108), and Hosking also reports that an L-moment specifica-tion of a distribution is unique, which is not true of a product moment specification.
The L-moment method provides the means of estimating the shape of the distribution along with the uncertainty of the estimates (Bonnin and others, 2004). The method also provides a heterogeneity check for groups of sites; in other words, whether a group of sites within a study area needs to be subdivided into smaller groups or possibly combined with other sites to form a larger, regional group.
The general procedure for developing estimates of precipitation frequency is as follows:
Annual maximum totals for the selected durations were computed for each calendar year,
Individual (for each site) L-moment statistics were computed,
The L-moment statistics from each site were used to check for discordancy,
Regional weighted L-moment statistics were computed for each duration using the individual L-moment statis-tics; heterogeneity and goodness-of-fit measures were computed for assessing possible probability distribu-tions, and
Quantile (or recurrence interval) estimates from the selected probability distribution were used to compute the precipitation-frequency values.
A more theoretical discussion of the L-moment method, reproduced from Asquith (1998) and Tortorelli and others (1999), follows. A more comprehensive discussion, including presentation of theoretical equations for the L-moment method, can be found in Hosking (1986, 1990), Hosking and Wallis (1993, 1997), and Vogel and Fennessey (1993).
Consider a random variable X (precipitation depth in this report) with a cumulative probability distribution function F (non-exceedance probability). The quantities,
Mijk E X iF j 1 F–( )k[ ] X iF j 1 F–( )k F ,d0
1
∫= =
where E = the expectation operator, are known as probability-weighted moments (PWM) as defined by Greenwood and others (1979). By letting M
ijk = M
1r0, the
PWM for moment r can be expressed as
•
•
•
•
•
βr E XF r[ ] .=
An unbiased sample estimate of βr (PWM) for any
distribution is computed from the following (Landwehr and others, 1979):
br1n---
n j–r⎝ ⎠
⎛ ⎞
n 1–r⎝ ⎠
⎛ ⎞----------------- xj ,
j 1=
n r–
∑=
where b
r = unbiased sample estimate of β
r for moment
number r = 0, 1, 2, . . . and x
(j) = ordered values of X where x
(1) is the largest
observation and x(n)
is the smallest.
In a sense, the PWM are somewhat analogous to the more widely known product moments (mean, standard deviation, coefficient of variation, skew, kurtosis). For example, b
0 is
equal to the mean; however, interpretation of the higher-order PWM is difficult. To facilitate PWM interpretation, Hosking (1986, 1990) developed L-moments as specific linear combi-nations of the PWM. Unbiased L-moment sample estimates are obtained by substituting the sample estimates of β
r in the
following equation:
λr 1+ βk 1–( ) r k– rk⎝ ⎠
⎛ ⎞ r k+k⎝ ⎠
⎛ ⎞ .k 0=
r
∑=
The L-moments can be formulated into values that are analogous, though not equal, to the product moments (Hosking, 1990). The mean, scale, coefficient of variation, skewness, and kurtosis of a distribution estimated by using equation 4 are expressed by the following L-moments (λ
r) and
L-moment ratios (τr):
λ1 mean,≡
λ2 L-scale;≡
τ 2λ2λ1----- L-coefficient of variation (L CV);–≡=
τ 3λ3λ2----- L-skew;≡=
τ 4λ4λ2----- L-kurtosis .≡=
(1)
(2)
(3)
(4)
(5)
(6)
(7)
(8)
(9)
1� Frequency of Annual Maximum Precipitation in the City of Charlotte and Mecklenburg County, NC, through 2004
and
For this report, the L-moments and the L-moment ratios were calculated for each duration and each station by using unbiased estimators. The use of the unbiased estimators for L-moment computation decreases the chance of selecting an inappropriate distribution to fit a given dataset (Hosking and Wallis, 1995, p. 2024). The L-moment method includes computations that can be used to screen data, subdivide the sites into smaller groups, and select the most appropriate probability distribution.
The discordancy test provides a means of screening the data to identify sites that have very unusual or possibly erroneous data, such as values incorrectly recorded or transcribed into a database. Values considered unusual may be the result of changes in site location or environmental factors affecting a site or the collection of data (Hosking and Wallis, 1997). Based on the background and theory provided by Hosking and Wallis (1997), a site is considered discordant if the discordancy measure is greater than 3. The occurrence of a discordancy measure that exceeds this threshold does not mean that data from the affected site should be removed from the sample. Rather, data from such sites are re-examined to ensure the data were entered correctly. If the data values are verified to be correct, further checks include determining whether other factors, such as site location or surroundings, may have caused the data to misrepresent true conditions.
In this study, discordancy measures greater than 3 were noted at two sites among three durations in the CRN initial analysis—site 17 at the 3-hour duration and site 6 at the 6- and 12-hour durations (fig. 2). Likewise, discordancy measures greater than 3 were noted at two sites among three durations in the CRN modified analysis—site 25 at the 30-minute duration and site 4 at the 6- and 24-hour durations (fig. 2). No discor-dancy measures greater than 3 were observed in the analyses using the NOAA datasets. Where measures were greater than 3, the data were checked to ensure that no errors were made in the data values or that no values were outliers. No such instances were found; thus, no data were removed. Hosking and Wallis (1997) state that a discordant site may be the result of an extreme, localized meteorological event affecting one or more sites in a region. Because storms during the summer can produce a wide range of precipitation amounts over a small region, it is possible for a site to appear discordant even when the data are valid.
Regional frequency analysis generally involves subdivid-ing sites across a broad region into smaller groups having similar climatic characteristics or hydrologic factors, such as sites located in mountainous regions and sites located in coastal regions. A group of sites having similarity in frequency distribution characteristics is said to form a homogeneous region (Hosking and Wallis, 1997). Homogeneous is interpreted to mean that, except for a location-specific scaling factor, (1) the form of the distribution for the homogeneous region is known, and (2) the distribution is exactly defined (by specification of its parameters). A quantifiable means of determining whether a group of sites forms a homogeneous
region is available through the heterogeneity measure or H-statistic (Hosking and Wallis, 1997).
A group of sites is considered acceptably homogeneous if the heterogeneity measure is less than 1, possibly hetero-geneous if between 1 and 2, and definitely heterogeneous if greater than 2 (Hosking and Wallis, 1997). Negative heterogeneity measures can occur and likely are caused by a positive correlation among data values at different sites (Hosking and Wallis, 1997). Because the geographical extent of Mecklenburg County is small relative to the size of regions commonly assessed in regionalization studies, the sites in this study were not subdivided into smaller groups. Nevertheless, use of a heterogeneity measure provided a means of assessing the region based on the sites used in the analyses.
After regional L-moment statistics were computed for each of the durations, a goodness-of-fit (Z-statistic) test was used to assess whether a particular probability distribution was applicable to the regional data. Consistent with previous USGS precipitation-frequency studies, five 3-parameter distributions were evaluated in this study using the regional weighted L-moment statistics. The distributions included in the evaluations are generalized extreme value (GEV), generalized logistic (GLO), generalized normal (GN), Pearson Type III (PE3), and generalized Pareto (GP). A 5-parameter Wakeby distribution is evaluated if none of the 3-parameter distributions satisfy the goodness-of-fit test. A distribution is considered to have a good fit if the absolute value of the goodness-of-fit measure is less than 1.64 (Hosking and Wallis, 1997). More discussion on the H- and Z-statistic values computed for this report is provided in the section, L-Moment Ratio Diagrams and Goodness-of-Fit Measures.
Frequency of Annual Maximum Precipitation in the City of Charlotte and Mecklenburg County
Application of the L-moment method to the four datasets used in this investigation resulted in a wide range of annual maximum precipitation-frequency characteristics for Charlotte and Mecklenburg County. Selection of the appropriate probability distributions and the development of precipitation depth- and intensity-duration frequency curves are discussed in this section.
L-Moment Ratio Diagrams and Goodness-of-Fit Measures
L-moment ratio diagrams allow simple comparisons between the sample estimates of L-skew (τ
3) and L-kurtosis
(τ4) and their theoretical counterparts from selected probability
distributions (Asquith, 1998; Tortorelli and others, 1999; fig. 6). The diagrams provide a means of choosing the
Frequency of Annual Maximum Precipitation in the City of Charlotte and Mecklenburg County 1�
Figure �. L-moment ratios for selected durations for the CRN initial dataset analysis of precipitation data for Charlotte and Mecklenburg County, North Carolina.
1� Frequency of Annual Maximum Precipitation in the City of Charlotte and Mecklenburg County, NC, through 2004
Theoretical L-moment ratio limitsGeneralized extreme-value distributionGeneralized logistics distributionGeneralized normal distributionPearson Type IIIGeneralized Pareto distributionSiteRegional
Note: Site is the individualsite L-moment ratio and Regional is the regional weightedmean L-moment ratio
EXPLANATION
Figure � (Continued). L-moment ratios for selected durations for the CRN initial dataset analysis of precipitation data for Charlotte and Mecklenburg County, North Carolina.
Frequency of Annual Maximum Precipitation in the City of Charlotte and Mecklenburg County 1�
Theoretical L-moment ratio limitsGeneralized extreme-value distributionGeneralized logistics distributionGeneralized normal distributionPearson Type IIIGeneralized Pareto distributionSiteRegional
Note: Site is the individualsite L-moment ratio and Regional is the regional weightedmean L-moment ratio
EXPLANATION
appropriate probability distribution to represent a sample dataset. Vogel and Fennessey (1993) demonstrated the significant differences between product-moment ratio diagrams (skew and kurtosis) and L-moment ratio diagrams; furthermore, they concluded that L-moment ratio diagrams are preferred over product-moment ratio diagrams for distribution selection.
To aide in the understanding of L-moment ratio diagrams, a brief discussion of the concepts of statistical skew and kurtosis may be in order. Skew is a measure of the symmetry, or lack thereof, in a sample distribution (National Institute for Standards and Technology, 2005). Samples defined by a normal distribution are symmetrical about a center and have a skewness of zero (where the mean and median are practically equal or identical). A sample with a positive skewness has a distribution tail that extends to the right, and the mean is larger than the median. Conversely, a sample with a negative skewness has a distribution tail that extends to the left, and the mean is less than the median.
Kurtosis is a measure of the “peakedness” of a sample; that is, whether data are sharply peaked or flat relative to a normal distribution (National Institute for Standards and Technology, 2005). Samples defined by a standard normal distribution have a kurtosis value of 3. Thus, to quantify excess kurtosis, a value of 3 is subtracted from the initial kurtosis measure, resulting in either a positive measure indicative of a sharp peak in a sample distribution or a negative measure indicative of a flat or broad peak in a sample distribution.
For each duration, the relation between values of τ3
(L-skew) and τ4 (L-kurtosis) for each site, the weighted-mean
values of τ3 and τ
4 for the CRN initial dataset, and the
theoretical τ3 and τ
4 relations (Hosking, 1991) from the GEV,
GLO, GN, PE3, and GP probability distributions are shown in figure 6. The asterisk points represent the τ
3 and τ
4 for each
station, and the filled circle represents the weighted-mean value of τ
3 and τ
4.
The scatter around the weighted-mean (regional) values of τ
3 and τ
4 in figure 6, in general, represents sampling vari-
ability—in other words, sites having longer periods of record are more likely to have τ
3 and τ
4 that plot closer to the regional
mean (Asquith, 1998; Tortorelli and others, 1999). Data for the corresponding weighted mean of τ
3 and τ
4 computed from
the CRN initial dataset generally plotted between the GLO and GEV distributions (fig. 6). Specifically, the weighted mean for the 15-minute and 24-hour durations plotted closer to the GEV distribution, and the weighted means for the remaining durations plotted closer to the GLO distribution. Although not shown, this trend is supported in similar L-moment ratio diagrams for the other three datasets analyzed in this investiga-tion. In general, the GEV and GLO distributions provided the most satisfactory fits based on the L-moment statistics computed from the datasets. The GN, PE3, and GP distribu-tions were dismissed on the basis of their general relation to the data points. Final determinations of the GEV or GLO distributions for specific durations in the four datasets were
then made by examining goodness-of-fit and heterogeneity measures computed in the analyses.
A goodness-of-fit measure (Z-statistic) of the GLO and GEV distributions was computed for each duration by following the methods of Hosking and Wallis (1993) and considering the entire county as a single region (see weighted means in fig. 6). The Z-statistics of the GLO and GEV distributions of each duration are listed in table 4. For the shorter durations (up to 1 hour) in the CRN initial and modified datasets, the GEV distribution tended to have the lower absolute Z-statistic values while the GLO values generally were lower for higher durations (table 4). In the NOAA datasets, absolute values of the Z-statistic from the GLO distribution were lower for the 15- and 30-minute durations, and those from the GEV distribution were lower for durations of 1 hour and longer.
The goodness-of-fit measure can be interpreted in two ways. The first interpretation (Hosking and Wallis, 1993) is that a distribution is considered appropriate if the absolute value of the Z-statistic is less than 1.64. This interpretation, however, has validity only if the region represented by the data is considered acceptably close to homogeneous (Hosking and Wallis, 1993, 1997). Among the Z-statistic values computed (table 4), all but six pairs of values for the GLO and GEV distributions had at least one value less than the absolute value of 1.64. The instances in which both values exceeded this threshold were the 15-minute duration in both NOAA datasets; the 3-, 6-, and 12-hour durations in the CRN initial datasets; and the 24-hour duration in the CRN modified datasets (table 4).
The heterogeneity measures (H-statistic) for the county were computed for each duration following the methods of Hosking and Wallis (1993). Among the 32 computed values of the H-statistics (table 4), 29 values were less than positive 2, which Hosking and Wallis (1993, 1997) conclude as being indicative of a homogeneous region. As previously discussed, Hosking and Wallis also conclude that negative heterogeneity values (15 of 29 values in table 4) likely are caused by a positive correlation between the data values among the different sites. The range of H-statistic values (generally less than 2 and/or negative (-) values) seen for most durations in these datasets, therefore, seem to echo their conclusions (table 4). Given the close spatial locations of the precipitation sites in Mecklenburg County, it would be expected that a grouping of sites in this relatively small study area would form a homogeneous group. The close spatial locations of the sites, however, also would likely result in positive correlation among the data collected at the individual sites. Because approxi-mately half of the heterogeneity values are negative, it appears that caution should be applied in accepting the grouping of sites as a true homogeneous region. Therefore, strict interpre-tation of the goodness-of-fit measure is questionable.
A second interpretation of the goodness-of-fit measure is that the form of the distribution with the smallest absolute value of Z-statistic is considered appropriate, but the distribu-tion parameters may require additional specification (Hosking
20 Frequency of Annual Maximum Precipitation in the City of Charlotte and Mecklenburg County, NC, through 2004
Table 4. Summary of goodness-of-fit and heterogeneity measures for precipitation-frequency analyses in Charlotte and Mecklenburg County, North Carolina.
[GLO, generalized logistic distribution; GEV, generalized extreme-value distribution; min, minute; hr, hour; CRN, designation for U.S. Geological Survey rain-gage network in Charlotte and Mecklenburg County; NOAA, National Oceanic and Atmospheric Administration; NWS, National Weather Service; USGS, U.S. Geological Survey]
DurationNumber of
stations
Goodness-of-fit measure (Z-statistica)
Heterogeneity measure
(H-statistic a)
Selected distribution
GLO GEV
CRN initial dataset (including storms of August 1995 and July 1997)
15-min (0.25-hr) 26 1.44 -0.17 1.64 GEV
30-min (0.5-hr) 26 -0.07 -1.56 0.20 GLO
1-hr (60-min) 26 -0.65 -1.94 -1.48 GLO
2-hr (120-min) 26 -0.76 -1.69 -1.69 GLO
3-hr (180-min) 26 -2.70 -3.41 -1.92 GLO
6-hr (360-min) 26 -2.67 -3.22 -1.72 GLO
12-hr (720-min) 26 -3.81 -4.18 -1.77 GLO
24-hr (1,440-min) 26 -0.28 -0.97 -2.14 GLO
CRN modified dataset (not including storms of August 1995 and July 1997)
15-min (0.25-hr) 26 1.77 0.16 2.07 GEV
30-min (0.5-hr) 26 0.84 -0.84 1.08 GEV
1-hr (60-min) 26 1.16 -0.71 0.06 GEV
2-hr (120-min) 26 0.57 -0.94 -0.93 GLO
3-hr (180-min) 26 0.07 -1.31 0.12 GLO
6-hr (360-min) 26 0.37 -1.19 1.49 GLO
12-hr (720-min) 26 -1.01 -2.53 0.15 GLO
24-hr (1,440-min) 26 4.32 2.83 0.03 GEV
NOAA dataset (up to eight selected NWS stations in the vicinity of Mecklenburg County)
15-min (0.25-hr) 7 -4.17 -5.38 2.90 GLO
30-min (0.5-hr) 7 -1.10 -2.65 1.89 GLO
1-hr (60-min) 8 1.80 -0.22 0.54 GEV
2-hr (120-min) 8 1.36 -0.20 -0.95 GEV
3-hr (180-min) 8 1.12 -0.25 -1.00 GEV
6-hr (360-min) 8 2.08 0.30 0.36 GEV
12-hr (720-min) 8 1.54 -0.23 -0.29 GEV
24-hr (1,440-min) 8 1.70 -0.09 -1.06 GEV
NOAA dataset plus aggregated USGS site representing the CRN initial dataset
Frequency of Annual Maximum Precipitation in the City of Charlotte and Mecklenburg County 21
and Wallis, 1993, 1997). Applying the second interpretation to the Z-statistic values (table 4) for the CRN initial dataset, the GEV distribution is judged appropriate for the 15-minute duration and the GLO distribution is judged appropriate for the remaining durations. The selected distributions for the durations in the three other datasets analyzed in this investiga-tion are listed in table 4.
The selection of the GEV and GLO distributions is consistent with those selected in previous studies for storm durations up to 24 hours. In Texas, the GLO distribution was chosen as the most appropriate for 15-minute to 24-hour durations (Asquith, 1998). In Oklahoma, Tortorelli and others (1999) identified the GLO distribution as appropriate for the 15- and 30-minute and 1-hour durations, but the GEV distribu-tion was selected for larger durations. Parrett (1997) selected the GEV distribution as the most satisfactory fit for the 2-, 6-, and 24-hour distributions studied in Montana. In Bonnin and others (2004, p. 36), the GEV distribution was chosen for Region 2, which includes Mecklenburg County, by using hourly data.
Depth-Duration and Intensity-Duration Frequency Curves
Using the selected distribution (table 4) for each duration (15 minutes to 24 hours) in each dataset, estimated precipita-tion depths (in inches) were computed for the 2-, 5-, 10-, 25-, 50-, 100-, and 500-year recurrence intervals (table 5). The precipitation depths then were expressed as precipitation intensity (in inches per hour) by using the corresponding value for duration. For comparison purposes, precipitation depths and intensity values derived by Hershfield (1961) and Bonnin and others (2004) for the NWS station at Charlotte Douglas Airport were tabulated (table 5). A visual comparison of the precipitation depths and intensity values also is provided for each of the recurrence intervals through a series of depth-duration and intensity-duration frequency curves completed for each dataset and the NOAA data (figs. 7–13).
Visual examination of the precipitation-frequency curves for all recurrence intervals reveals that the largest range among computed precipitation values occurs between the CRN initial and CRN modified datasets (figs. 7–13), and the spread between these two curves generally increases in ascending order of recurrence intervals. For the 2-year recurrence interval, the percentage difference between corresponding precipitation depths in the two datasets for all durations is less than 15 percent. The percentage differences in the values for the 15- and 30-minute durations likewise are less than 15 percent at most all recurrence intervals (exception being about 29 percent for the 30-minute duration, 500-year recurrence interval). Beginning with the 1-hour duration and 5-year recurrence interval, however, percentage differences between many of the corresponding depths in the two datasets generally exceeded 15 percent, indicating that the presence of large annual maximum precipitation totals for 2 years (1995 and 1997) influenced the results. The 24-hour, 100-year precipitation depths estimated for the CRN initial and CRN modified datasets are 10.99 and 5.74 inches, respectively (table 5), which correspond to the CRN initial value being about 91 percent higher than the CRN modified value.
Although the frequency curves for the CRN initial and CRN modified datasets exhibit greater differences in increasing durations and recurrence intervals, the precipitation depths for the NOAA datasets (third and fourth) analyzed for this report exhibit a smaller degree of spread (figs. 7–13) and generally tended to straddle the midrange between the CRN datasets. As previously stated, the inclusion of the long-term, NOAA datasets for the vicinity of Mecklenburg County provided overall quality assurance of the results from the L-moment method applied to all datasets.
Percentage differences between precipitation frequencies computed for Charlotte Douglas Airport (Bonnin and others, 2004) and for the eight selected NWS stations (fig. 4; the third dataset) mostly are less than 15 percent. Although results among all datasets indicate varying levels of differences, comparable precipitation depths among most values computed for selected NWS stations and the estimates for Charlotte Douglas Airport (Bonnin and others, 2004) provide a general confirmation of results determined from each analysis.
22 Frequency of Annual Maximum Precipitation in the City of Charlotte and Mecklenburg County, NC, through 2004
Tabl
e �.
Su
mm
ary
of p
reci
pita
tion
dept
h-du
ratio
n an
d in
tens
ity-d
urat
ion
frequ
ency
in C
harlo
tte a
nd M
eckl
enbu
rg C
ount
y, N
orth
Car
olin
a. —
Con
tinue
d
[DD
F, d
epth
-dur
atio
n fr
eque
ncy;
ID
F, in
tens
ity-d
urat
ion
freq
uenc
y; in
/hr,
inch
(es)
per
hou
r; C
RN
, des
igna
tion
for
U.S
. Geo
logi
cal S
urve
y ra
inga
ge n
etw
ork
in C
harl
otte
and
Mec
klen
burg
C
ount
y; N
OA
A, N
atio
nal O
cean
ic a
nd A
tmos
pher
ic A
dmin
istr
atio
n; N
WS,
Nat
iona
l Wea
ther
Ser
vice
; USG
S, U
.S. G
eolo
gica
l Sur
vey;
n/a
, not
ava
ilabl
e]
Recu
r-re
nce
in
terv
al,
in y
ears
1� m
inut
es�0
min
utes
1 ho
ur
(�0
min
utes
)2
hour
s (1
20 m
inut
es)
� ho
urs
(1�0
min
utes
)�
hour
s (�
�0 m
inut
es)
12 h
ours
(�
20 m
inut
es)
24 h
ours
(1
,440
min
utes
)
DD
F, in
ches
IDF,
in/h
rD
DF,
inch
esID
F, in
/hr
DD
F, in
ches
IDF,
in/h
rD
DF,
inch
esID
F, in
/hr
DD
F, in
ches
IDF,
in/h
rD
DF,
inch
esID
F, in
/hr
DD
F, in
ches
IDF,
in/h
rD
DF,
inch
esID
F, in
/hr
CRN
initi
al d
atas
et (i
nclu
ding
sto
rms
of A
ugus
t 199
5 an
d Ju
ly 1
997)
20.
813.
241.
152.
301.
471.
471.
770.
891.
930.
642.
170.
362.
570.
213.
240.
14
51.
024.
081.
432.
861.
891.
892.
351.
182.
570.
862.
970.
503.
510.
294.
530.
19
101.
154.
601.
623.
242.
192.
192.
791.
403.
101.
033.
610.
604.
390.
375.
600.
23
251.
305.
201.
883.
762.
602.
603.
461.
733.
951.
324.
680.
785.
930.
497.
320.
31
501.
415.
642.
094.
182.
952.
954.
072.
044.
761.
595.
730.
967.
540.
638.
960.
37
100
1.51
6.04
2.32
4.64
3.33
3.33
4.79
2.40
5.75
1.92
7.06
1.18
9.68
0.81
10.9
90.
46
500
1.73
6.92
2.92
5.84
4.42
4.42
7.01
3.51
9.03
3.01
11.7
51.
9617
.84a
1.49
a17
.81
0.74
CRN
mod
ified
dat
aset
(not
incl
udin
g st
orm
s of
Aug
ust 1
995
and
July
199
7)
20.
793.
161.
102.
201.
401.
401.
660.
831.
810.
602.
100.
352.
430.
202.
880.
12
50.
993.
961.
392.
781.
771.
772.
091.
052.
250.
752.
530.
422.
910.
243.
660.
15
101.
124.
481.
563.
121.
971.
972.
381.
192.
560.
852.
810.
473.
240.
274.
170.
17
251.
275.
081.
763.
522.
202.
202.
771.
392.
980.
993.
200.
533.
670.
314.
810.
20
501.
385.
521.
903.
802.
342.
343.
091.
553.
321.
113.
510.
594.
020.
345.
280.
22
100
1.48
5.92
2.02
4.04
2.47
2.47
3.44
1.72
3.70
1.23
3.84
0.64
4.39
0.37
5.74
0.24
500
1.69
6.76
2.27
4.54
2.71
2.71
4.36
2.18
4.75
1.58
4.72
0.79
5.37
0.45
6.79
0.28
NOA
A da
tase
t (up
to e
ight
sel
ecte
d N
WS
stat
ions
in th
e vi
cini
ty o
f Mec
klen
burg
Cou
nty)
20.
783.
121.
162.
321.
301.
301.
650.
831.
840.
612.
220.
372.
620.
223.
050.
13
51.
044.
161.
563.
121.
761.
762.
251.
132.
500.
832.
990.
503.
500.
294.
070.
17
101.
224.
881.
833.
662.
082.
082.
671.
342.
991.
003.
530.
594.
110.
344.
780.
20
251.
475.
882.
194.
382.
482.
483.
251.
633.
681.
234.
260.
714.
930.
415.
730.
24
501.
696.
762.
474.
942.
792.
793.
711.
864.
241.
414.
830.
815.
570.
466.
460.
27
100
1.92
7.68
2.78
5.56
3.10
3.10
4.20
2.10
4.84
1.61
5.42
0.90
6.22
0.52
7.22
0.30
500
2.60
10.4
03.
597.
183.
843.
845.
442.
726.
452.
156.
911.
157.
850.
659.
100.
38
Frequency of Annual Maximum Precipitation in the City of Charlotte and Mecklenburg County 2�
Tabl
e �.
Su
mm
ary
of p
reci
pita
tion
dept
h-du
ratio
n an
d in
tens
ity-d
urat
ion
frequ
ency
in C
harlo
tte a
nd M
eckl
enbu
rg C
ount
y, N
orth
Car
olin
a. —
Con
tinue
d
[DD
F, d
epth
-dur
atio
n fr
eque
ncy;
ID
F, in
tens
ity-d
urat
ion
freq
uenc
y; in
/hr,
inch
(es)
per
hou
r; C
RN
, des
igna
tion
for
U.S
. Geo
logi
cal S
urve
y ra
inga
ge n
etw
ork
in C
harl
otte
and
Mec
klen
burg
C
ount
y; N
OA
A, N
atio
nal O
cean
ic a
nd A
tmos
pher
ic A
dmin
istr
atio
n; N
WS,
Nat
iona
l Wea
ther
Ser
vice
; USG
S, U
.S. G
eolo
gica
l Sur
vey;
n/a
, not
ava
ilabl
e]
Recu
r-re
nce
in
terv
al,
in y
ears
1� m
inut
es�0
min
utes
1 ho
ur
(�0
min
utes
)2
hour
s (1
20 m
inut
es)
� ho
urs
(1�0
min
utes
)�
hour
s (�
�0 m
inut
es)
12 h
ours
(�
20 m
inut
es)
24 h
ours
(1
,440
min
utes
)
DD
F, in
ches
IDF,
in/h
rD
DF,
inch
esID
F, in
/hr
DD
F, in
ches
IDF,
in/h
rD
DF,
inch
esID
F, in
/hr
DD
F, in
ches
IDF,
in/h
rD
DF,
inch
esID
F, in
/hr
DD
F, in
ches
IDF,
in/h
rD
DF,
inch
esID
F, in
/hr
NOA
A da
tase
t plu
s ag
greg
ated
USG
S si
te re
pres
entin
g th
e CR
N in
itial
dat
aset
20.
793.
161.
162.
321.
301.
301.
660.
831.
840.
612.
220.
372.
620.
223.
060.
13
51.
044.
161.
523.
041.
771.
772.
251.
132.
510.
842.
990.
503.
500.
294.
080.
17
101.
214.
841.
773.
542.
082.
082.
681.
343.
001.
003.
540.
594.
130.
344.
800.
20
251.
465.
842.
094.
182.
492.
493.
261.
633.
691.
234.
270.
714.
960.
415.
760.
24
501.
676.
682.
354.
702.
792.
793.
721.
864.
251.
424.
850.
815.
610.
476.
510.
27
100
1.91
7.64
2.63
5.26
3.10
3.10
4.22
2.11
4.86
1.62
5.46
0.91
6.29
0.52
7.29
0.30
500
2.56
10.2
43.
366.
723.
843.
845.
482.
746.
492.
166.
981.
167.
980.
679.
230.
38
Hers
hfie
ld, 1
961
(Tec
hnic
al P
aper
40)
b
2n/
an/
a1.
292.
581.
571.
571.
940.
972.
150.
722.
540.
423.
000.
253.
480.
15
5n/
an/
a1.
603.
202.
072.
072.
461.
232.
770.
923.
240.
543.
870.
324.
390.
18
10n/
an/
a1.
853.
702.
382.
382.
921.
463.
181.
063.
710.
624.
390.
375.
040.
21
25n/
an/
a2.
184.
362.
772.
773.
311.
663.
601.
204.
380.
735.
000.
425.
880.
25
50n/
an/
a2.
404.
803.
093.
093.
761.
883.
971.
324.
780.
805.
710.
486.
600.
28
100
n/a
n/a
2.73
5.46
3.39
3.39
4.08
2.04
4.44
1.48
5.40
0.90
6.22
0.52
7.09
0.30
500
n/a
n/a
n/a
n/a
n/a
n/a
n/a
n/a
n/a
n/a
n/a
n/a
n/a
n/a
n/a
n/a
Bonn
in a
nd o
ther
s, 2
004
( NOA
A At
las
14)c
20.
873.
481.
202.
401.
511.
511.
750.
881.
860.
622.
250.
382.
680.
223.
080.
13
51.
084.
321.
543.
081.
971.
972.
311.
162.
470.
822.
990.
503.
560.
304.
090.
17
101.
204.
801.
753.
502.
272.
272.
681.
342.
890.
963.
500.
584.
190.
354.
810.
20
251.
345.
361.
983.
962.
642.
643.
141.
573.
431.
144.
160.
695.
020.
425.
750.
24
501.
425.
682.
144.
282.
902.
903.
481.
743.
831.
284.
670.
785.
670.
476.
480.
27
100
1.49
5.96
2.29
4.58
3.15
3.15
3.81
1.91
4.24
1.41
5.18
0.86
6.33
0.53
7.21
0.30
500
1.62
6.48
2.58
5.16
3.70
3.70
4.56
2.28
5.22
1.74
6.43
1.07
7.98
0.67
9.01
0.38
a Est
imat
ed D
DF
and
IDF
valu
es f
or 1
2-ho
ur d
urat
ion,
500
-yea
r re
curr
ence
inte
rval
in C
RN
initi
al d
atas
et a
re c
onsi
dere
d un
cert
ain.
See
fig
ure
13 w
here
fre
quen
cy c
urve
s be
twee
n 6-
an
d 24
-hou
r du
ratio
ns a
re d
enot
ed w
ith h
atch
ed li
ne r
epre
sent
ing
an in
terp
olat
ed r
ange
judg
ed r
easo
nabl
e un
til a
dditi
onal
dat
a pe
rmit
furt
her
anal
yses
.b D
DF
valu
es w
ere
inte
rpol
ated
for
Mec
klen
burg
Cou
nty
from
Her
shfi
eld
(196
1) a
nd a
dapt
ed f
rom
Rob
inso
n, H
azel
l, an
d Y
oung
(19
98).
c DD
F va
lues
wer
e in
terp
olat
ed f
or C
harl
otte
Dou
glas
Air
port
(N
WS
stat
ion
31-1
690;
see
tabl
e 3;
Bon
nin
and
othe
rs, 2
004)
.
24 Frequency of Annual Maximum Precipitation in the City of Charlotte and Mecklenburg County, NC, through 2004
Figure �. Precipitation (A) depth-duration and (B) intensity-duration frequency curves for the 2-year recurrence interval for Charlotte and Mecklenburg County, North Carolina.
Frequency of Annual Maximum Precipitation in the City of Charlotte and Mecklenburg County 2�
4.00
3.50
3.00
2.50
2.00
1.50
1.00
0.500.10 0.25 0.50 1 2 3 6 12 24 100
0.10
0.20
0.50
1
2
5
10
0.10 0.25 0.50 1 2 3DURATION, IN HOURS
6 12 24 100
PREC
IPIT
ATIO
N IN
TEN
SITY
, IN
INCH
ES P
ER H
OUR
PREC
IPIT
ATIO
N D
EPTH
, IN
INCH
ES
A.
B.
CRN initial dataset (includes August 1995 and July 1997 storms)CRN modified dataset (excludes August 1995 and July 1997 storms)Selected National Weather Service stations (up to eight selected sites)Selected National Weather Service stations plus aggregated U.S. Geological Survey siteTechnical Paper 40 (Hershfield, 1961)Charlotte Douglas Airport, National Oceanic Atmospheric Administration Atlas 14 (Bonnin and others, 2004)
EXPLANATION
Figure �. Precipitation (A) depth-duration and (B) intensity-duration frequency curves for the 5-year recurrence interval for Charlotte and Mecklenburg County, North Carolina.
2� Frequency of Annual Maximum Precipitation in the City of Charlotte and Mecklenburg County, NC, through 2004
CRN initial dataset (includes August 1995 and July 1997 storms)CRN modified dataset (excludes August 1995 and July 1997 storms)Selected National Weather Service stations (up to eight selected sites)Selected National Weather Service stations plus aggregated U.S. Geological Survey siteTechnical Paper 40 (Hershfield, 1961)Charlotte Douglas Airport, National Oceanic Atmospheric Administration Atlas 14 (Bonnin and others, 2004)
EXPLANATION
Figure �. Precipitation (A) depth-duration and (B) intensity-duration frequency curves for the 10-year recurrence interval for Charlotte and Mecklenburg County, North Carolina.
Frequency of Annual Maximum Precipitation in the City of Charlotte and Mecklenburg County 2�
CRN initial dataset (includes August 1995 and July 1997 storms)CRN modified dataset (excludes August 1995 and July 1997 storms)Selected National Weather Service stations (up to eight selected sites)Selected National Weather Service stations plus aggregated U.S. Geological Survey siteTechnical Paper 40 (Hershfield, 1961)Charlotte Douglas Airport, National Oceanic Atmospheric Administration Atlas 14 (Bonnin and others, 2004)
EXPLANATION
Figure 10. Precipitation (A) depth-duration and (B) intensity-duration frequency curves for the 25-year recurrence interval for Charlotte and Mecklenburg County, North Carolina.
2� Frequency of Annual Maximum Precipitation in the City of Charlotte and Mecklenburg County, NC, through 2004
Figure 10. Precipitation (A) depth-duration and (B) intensity-duration frequency curves for the25-year recurrence interval for Charlotte and Mecklenburg County, North Carolina.
CRN initial dataset (includes August 1995 and July 1997 storms)CRN modified dataset (excludes August 1995 and July 1997 storms)Selected National Weather Service stations (up to eight selected sites)Selected National Weather Service stations plus aggregated U.S. Geological Survey siteTechnical Paper 40 (Hershfield, 1961)Charlotte Douglas Airport, National Oceanic Atmospheric Administration Atlas 14 (Bonnin and others, 2004)
EXPLANATION
Figure 11. Precipitation (A) depth-duration and (B) intensity-duration frequency curves for the 50-year recurrence interval for Charlotte and Mecklenburg County, North Carolina.
Frequency of Annual Maximum Precipitation in the City of Charlotte and Mecklenburg County 2�
Figure 11. Precipitation (A) depth-duration and (B) intensity-duration frequency curves for the50-year recurrence interval for Charlotte and Mecklenburg County, North Carolina.
CRN initial dataset (includes August 1995 and July 1997 storms)CRN modified dataset (excludes August 1995 and July 1997 storms)Selected National Weather Service stations (up to eight selected sites)Selected National Weather Service stations plus aggregated U.S. Geological Survey siteTechnical Paper 40 (Hershfield, 1961)Charlotte Douglas Airport, National Oceanic Atmospheric Administration Atlas 14 (Bonnin and others, 2004)
EXPLANATION
Figure 12. Precipitation (A) depth-duration and (B) intensity-duration frequency curves for the 100-year recurrence interval for Charlotte and Mecklenburg County, North Carolina.
�0 Frequency of Annual Maximum Precipitation in the City of Charlotte and Mecklenburg County, NC, through 2004
Figure 12. Precipitation (A) depth-duration and (B) intensity-duration frequency curves for the100-year recurrence interval for Charlotte and Mecklenburg County, North Carolina.
CRN initial dataset (includes August 1995 and July 1997 storms)CRN modified dataset (excludes August 1995 and July 1997 storms)Selected National Weather Service stations (up to eight selected sites)Selected National Weather Service stations plus aggregated U.S. Geological Survey siteTechnical Paper 40 (Hershfield, 1961)Charlotte Douglas Airport, National Oceanic Atmospheric Administration Atlas 14 (Bonnin and others, 2004)
EXPLANATION
Figure 1�. Precipitation (A) depth-duration and (B) intensity-duration frequency curves for the 500-year recurrence interval for Charlotte and Mecklenburg County, North Carolina.
Frequency of Annual Maximum Precipitation in the City of Charlotte and Mecklenburg County �1
CRN initial dataset (includes August 1995 and July 1997 storms)CRN modified dataset (excludes August 1995 and July 1997 storms)Selected National Weather Service stations (up to eight selected sites)Selected National Weather Service stations plus aggregated U.S. Geological Survey siteTechnical Paper 40 (Hershfield, 1961)Charlotte Douglas Airport, National Oceanic Atmospheric Administration Atlas 14 (Bonnin and others, 2004)Interpolated curve for CRN initial dataset. Estimated 12-hour rainfall amount deemed uncertain (see table 5).
Note: No frequency curve for Technical Paper 40 available beyond 100-year recurrence interval.
Note: No frequency curve for Technical Paper 40 available beyond 100-year recurrence interval.
A.
B.
EXPLANATION
As previously discussed, the fourth dataset was developed to combine selected NWS stations in the vicinity of Mecklen-burg County with an aggregated USGS site. Comparisons of precipitation depths between the fourth dataset and the CRN initial dataset indicate that percentage differences generally are less than 15 percent for durations less than 6 hours and for recurrence intervals less than 25 years. The estimated 24-hour, 100-year precipitation depth of 10.99 inches for the CRN initial dataset is about 51 percent higher than the correspond-ing value of 7.29 inches for the fourth dataset (table 5).
Some insight into the percentage differences can be obtained by examining box plots of the annual maximum 1- and 24-hour precipitation totals computed at selected USGS sites (CRN15 and CRN25) and NWS sites (Charlotte Douglas Airport (31-1690) and Mooresville 2 WNW (31-5814; tables 3, 6; fig. 14). For the selected USGS sites, the range in precipitation totals used in the CRN initial and CRN modified datasets are shown.
For the 1-hour duration, initial precipitation totals at USGS site CRN15 ranged from 0.98 (2002) to 3.55 (1997) inches with a median of 1.48 inches (table 6; fig. 14A) during the period of record (11 years). When modified to remove the rainfall totals associated with the August 1995 and July 1997 storms, totals ranged from 0.98 (2002) to 1.61 (2003) inches with a median of 1.33 inches. In comparison, 1-hour totals at the Charlotte Douglas Airport (NWS station 31-1690) ranged from 0.52 (2001) to 2.32 (1972) inches with a median of 1.14 inches during the 56-year period of record (table 6; fig. 14). Similar patterns occurred at USGS site CRN25 and at Mooresville (NWS station 31-5814), although the maximum 1-hour total at the Mooresville station is substantially higher (5.4 inches, measured on July 30, 1982; table 6; fig. 14). Thus, the interquartile ranges for the USGS sites, which have shorter periods of record, generally are higher than those for the NWS stations, which have much longer periods of record.
Similarly, 24-hour precipitation totals (table 6; fig. 14B) used in the CRN initial database analysis for USGS sites CRN15 and CRN25 are relatively higher than totals for the
�2 Frequency of Annual Maximum Precipitation in the City of Charlotte and Mecklenburg County, NC, through 2004
NWS stations at Charlotte Douglas Airport and Mooresville. These patterns further confirm the analytical results of larger precipitation-frequency values for the USGS sites having short-term records when compared with those for the NWS stations with long-term records.
The wide range in results of the analyses completed on the four datasets presents an opportunity or challenge depending on how the frequency analyses are understood. With the availability of precipitation information in NOAA Atlas 14 (Bonnin and others, 2004), which is based on a larger sample of stations having long-term records, a determination of the precipitation-frequency values to use must be made by the user(s). The USGS raingage network in and surrounding Mecklenburg County is unique in terms of the density of precipitation data for a relatively small area.
Because a comparatively small sample from the USGS precipitation network may have been influenced by the occurrence of two large observations (1995 and 1997), the higher precipitation-frequency values from the CRN initial dataset may be considered biased. The occurrence of large or extreme events within short periods of time, however, raises the question of whether a shift in frequency characteristics may be occurring. Any dismissal of results from the analyses completed on the USGS networks because the results “seem too high” could lead to an underestimation of true frequency characteristics.
In the absence of further analyses, the use of the selected NWS stations with the aggregated USGS site (third dataset) can currently (2005) be considered appropriate for use in deriving frequency characteristics for Mecklenburg County. This dataset provides consideration of (1) the significant amount of precipitation data available through the USGS network, (2) some large rainfalls that have occurred in the county, and (3) NOAA precipitation data based on longer periods of record. Nevertheless, users of the results of this analysis must recognize that actual frequency characteristics could be somewhat higher, although quantification of any such differences will require additional data.
1-hour (�0-minute) precipitation totals
24-hour (1,440-minute) precipitation totals
YearDepth, inches
Date and timea Year
Depth, inches
Date and timea
CRN15, Charlotte-Mecklenburg Government Center, East Fourth Street (from CRN initial dataset)
2002 0.98 05/30 @ 17:30 2001 2.06 03/29 @ 20:15
1996 1.02 08/11 @ 22:10 1994 2.09 08/17 @ 06:45
2001 1.04 06/13 @ 19:40 2000 2.27 09/23 @ 06:20
1998 1.24 07/27 @ 07:10 2002 2.31 07/14 @ 09:40
1994 1.33 08/16 @ 23:10 1998 2.58 09/04 @ 05:20
1999 1.48 01/23 @ 14:30 1996 2.67 10/01 @ 04:30
2000 1.56 07/07 @ 03:00 2003 3.66 05/22 @ 14:45
2004 1.57 07/17 @ 22:35 2004 3.88 09/08 @ 05:30
1995 1.60 09/11 @ 08:40 1999 4.07 10/11 @ 06:55
2003 1.61 07/30 @ 19:20 1995 6.77 08/27 @ 17:00
1997 3.55 07/23 @ 01:45 1997 8.44 07/23 @ 23:10
CRN15, Charlotte-Mecklenburg Government Center, East Fourth Street (from CRN modified dataset)
1997 0.98 07/17 @ 16:10 2001 2.06 03/29 @ 20:15
2002 0.98 05/30 @ 17:30 1994 2.09 08/17 @ 06:45
1996 1.02 08/11 @ 22:10 1995 2.23 09/11 @ 09:10
2001 1.04 06/13 @ 19:40 1997 2.27 04/28 @ 11:30
1998 1.24 07/27 @ 07:10 2000 2.27 09/23 @ 06:20
1994 1.33 08/16 @ 23:10 2002 2.31 07/14 @ 09:40
1999 1.48 01/23 @ 14:30 1998 2.58 09/04 @ 05:20
2000 1.56 07/07 @ 03:00 1996 2.67 10/01 @ 04:30
2004 1.57 07/17 @ 22:35 2003 3.66 05/22 @ 14:45
1995 1.60 09/11 @ 08:40 2004 3.88 09/08 @ 05:30
2003 1.61 07/30 @ 19:20 1999 4.07 10/11 @ 06:55
CRN25, USGS Station 0214266075, Gar Creek at SR 2120 (McCoy Road) near Oakdale (from CRN initial dataset)
1997 1.10 07/23 @ 07:30 2000 1.65 07/07 @ 05:05
2001 1.25 05/22 @ 15:35 2001 2.12 03/29 @ 20:35
1995 1.32 07/16 @ 16:50 1998 2.42 09/04 @ 04:25
2002 1.35 08/16 @ 19:05 2002 2.63 10/11 @ 09:25
1998 1.36 07/16 @ 13:20 1996 3.41 08/12 @ 16:20
2004 1.38 06/14 @ 17:55 1999 3.70 10/11 @ 07:30
2000 1.57 07/07 @ 02:25 2004 4.09 09/08 @ 06:05
1999 1.58 09/28 @ 15:00 1995 4.12 08/27 @ 16:15
2003 1.59 07/13 @ 18:25 2003 4.49 07/13 @ 20:20
1996 2.20 06/19 @ 23:35 1997 5.53 07/23 @ 22:25
1-hour (�0-minute) precipitation totals
24-hour (1,440-minute) precipitation totals
YearDepth, inches
Date and timea Year
Depth, inches
Date and timea
CRN25, USGS Station 0214266075, Gar Creek at SR 2120 (McCoy Road) near Oakdale (from CRN modified dataset)
1997 0.80 02/28 @ 13:30 2000 1.65 07/07 @ 05:05
2001 1.25 05/22 @ 15:35 2001 2.12 03/29 @ 20:35
1995 1.32 07/16 @ 16:50 1998 2.42 09/04 @ 04:25
2002 1.35 08/16 @ 19:05 1995 2.61 10/05 @ 02:45
1998 1.36 07/16 @ 13:20 2002 2.63 10/11 @ 09:25
2004 1.38 06/14 @ 17:55 1996 3.41 08/12 @ 16:20
2000 1.57 07/07 @ 02:25 1999 3.70 10/11 @ 07:30
1999 1.58 09/28 @ 15:00 1997 3.94 09/25 @ 05:15
2003 1.59 07/13 @ 18:25 2004 4.09 09/08 @ 06:05
1996 2.20 06/19 @ 23:35 2003 4.49 07/13 @ 20:20
NWS station 31-1690, Charlotte Douglas Airport
2001 0.52 07/04 @ 20:00 1986 1.63 10/25 @ 08:00
2002 0.56 09/14 @ 20:00 1957 1.90 08/17 @ 24:00
1966 0.69 03/04 @ 04:00 1988 1.92 09/09 @ 03:00
1956 0.70 05/03 @ 22:00 1953 1.94 09/26 @ 09:00
1993 0.70 05/04 @ 16:00 1980 1.95 03/28 @ 07:00
2000 0.85 09/18 @ 21:00 2000 2.09 09/22 @ 12:00
1977 0.87 10/25 @ 24:00 1971 2.11 05/12 @ 17:00
1964 0.88 09/30 @ 17:00 2001 2.13 03/29 @ 01:00
1989 0.90 11/16 @ 02:00 1981 2.16 10/25 @ 05:00
1951 0.92 06/17 @ 19:00 1982 2.17 10/24 @ 17:00
1996 0.93 04/29 @ 13:00 1987 2.17 02/28 @ 03:00
1971 0.96 10/16 @ 02:00 2002 2.25 10/10 @ 20:00
1976 0.97 07/03 @ 20:00 1993 2.28 01/21 @ 04:00
1962 0.98 09/16 @ 15:00 1984 2.37 01/10 @ 07:00
1952 0.99 08/31 @ 09:00 1951 2.38 12/20 @ 07:00
1974 1.00 09/28 @ 02:00 1950 2.39 10/19 @ 09:00
1991 1.00 11/30 @ 24:00 1983 2.42 12/05 @ 24:00
1986 1.01 07/21 @ 20:00 1965 2.46 07/27 @ 19:00
1960 1.02 06/21 @ 15:00 1994 2.46 08/16 @ 17:00
1963 1.03 05/17 @ 18:00 1996 2.47 04/29 @ 12:00
1994 1.03 08/16 @ 21:00 1991 2.48 03/03 @ 07:00
1982 1.05 05/16 @ 19:00 1960 2.49 05/07 @ 15:00
1953 1.07 06/21 @ 23:00 1958 2.59 12/27 @ 15:00
1983 1.10 08/24 @ 02:00 1954 2.78 03/13 @ 19:00
1958 1.11 08/02 @ 20:00 1966 2.79 09/18 @ 23:00
1968 1.11 06/09 @ 20:00 1972 2.87 12/14 @ 19:00
1969 1.12 08/02 @ 20:00 1961 2.88 02/20 @ 09:00
1980 1.12 07/18 @ 02:00 1973 2.92 02/01 @ 20:00
1949 1.15 06/13 @ 06:00 1998 3.07 09/03 @ 11:00
1999 1.17 06/10 @ 21:00 1956 3.11 09/25 @ 18:00
1965 1.20 07/28 @ 08:00 1970 3.15 10/29 @ 16:00
1998 1.20 07/27 @ 07:00 1989 3.16 09/21 @ 23:00
Table �. Annual maximum 1- and 24-hour precipitation totals for selected U.S. Geological Survey and National Weather Service precipitation sites in or near Mecklenburg County, North Carolina. — Continued
[USGS, U.S. Geological Survey; SR, secondary road; NWS, National Weather Service. Precipitation totals determined for each calendar year. For each site and each duration, precipitation totals are listed from minimum to maximum]
Frequency of Annual Maximum Precipitation in the City of Charlotte and Mecklenburg County ��
1-hour (�0-minute) precipitation totals
24-hour (1,440-minute) precipitation totals
YearDepth, inches
Date and timea Year
Depth, inches
Date and timea
NWS station 31-5814, Mooresville 2 WNW (Iredell County) (continued)
1965 1.05 08/18 @ 16:00 1954 2.80 10/15 @ 01:00
1954 1.07 02/21 @ 04:00 1967 2.80 07/07 @ 07:00
1962 1.08 06/02 @ 18:00 1972 2.86 06/20 @ 12:00
1986 1.10 07/01 @ 18:00 1975 2.87 09/01 @ 21:00
1996 1.10 07/25 @ 19:00 1960 2.90 08/31 @ 20:00
2001 1.10 06/22 @ 15:00 1999 2.90 10/10 @ 09:00
1957 1.16 11/19 @ 06:00 1973 2.96 08/02 @ 21:00
1978 1.20 07/02 @ 19:00 1953 2.98 03/23 @ 06:00
1994 1.20 05/15 @ 19:00 1993 3.00 03/23 @ 15:00
1995 1.20 07/06 @ 20:00 2003 3.00 03/20 @ 02:00
1974 1.21 08/03 @ 17:00 1951 3.01 12/20 @ 12:00
1973 1.28 05/28 @ 01:00 1991 3.10 03/29 @ 02:00
1972 1.33 07/29 @ 17:00 1963 3.15 07/28 @ 20:00
1987 1.40 04/15 @ 08:00 1957 3.18 09/16 @ 15:00
1989 1.40 07/31 @ 19:00 1949 3.20 10/30 @ 06:00
1960 1.46 07/23 @ 19:00 1992 3.20 10/04 @ 06:00
1979 1.50 05/12 @ 20:00 1994 3.20 08/16 @ 22:00
1951 1.56 07/04 @ 21:00 1970 3.32 08/09 @ 18:00
1975 1.60 06/18 @ 17:00 1961 3.39 06/21 @ 04:00
1952 1.66 08/01 @ 21:00 1978 3.60 05/04 @ 04:00
1949 1.68 08/15 @ 24:00 1979 3.60 09/04 @ 21:00
1980 1.70 07/18 @ 01:00 1995 3.60 08/26 @ 18:00
1956 1.71 07/28 @ 21:00 1952 3.68 03/03 @ 08:00
1955 1.75 07/19 @ 22:00 1971 3.74 08/22 @ 13:00
1969 1.77 06/13 @ 22:00 1962 3.89 11/09 @ 01:00
1967 2.00 08/04 @ 15:00 1985 4.00 08/16 @ 17:00
1981 2.00 09/05 @ 14:00 1977 4.30 09/07 @ 17:00
1959 2.08 08/26 @ 19:00 1987 4.30 04/15 @ 03:00
1985 2.10 08/24 @ 18:00 1981 4.40 09/05 @ 03:00
1991 2.10 06/16 @ 18:00 1997 4.60 07/23 @ 10:00
2003 2.10 08/10 @ 20:00 1964 4.70 10/04 @ 04:00
1997 2.20 06/12 @ 18:00 1959 4.74 09/29 @ 12:00
1971 2.30 10/05 @ 16:00 1976 4.86 10/08 @ 07:00
1984 2.30 08/13 @ 14:00 1990 5.30 10/10 @ 16:00
1963 2.66 07/28 @ 21:00 1956 5.48 09/25 @ 21:00
1982 5.40 07/30 @ 10:00 1982 6.20 07/30 @ 10:00aFor USGS precipitation sites, the time is the ending time (for example,
the 60-minute period ending at 12:00). For NWS precipitation stations, the time is the beginning of the time period (for example, the 24-hour period beginning at 12:00). The difference in how the time periods are reported reflects the manner in which the maximum totals were compiled during this investigation. Such differences, however, do not influence the outcome of the frequency analyses.
�4 Frequency of Annual Maximum Precipitation in the City of Charlotte and Mecklenburg County, NC, through 2004
1-hour (�0-minute) precipitation totals
24-hour (1,440-minute) precipitation totals
YearDepth, inches
Date and timea Year
Depth, inches
Date and timea
NWS station 31-1690, Charlotte Douglas Airport (continued)
1988 1.22 07/21 @ 20:00 1969 3.21 08/02 @ 19:00
1950 1.27 06/30 @ 23:00 1968 3.28 06/08 @ 24:00
1984 1.28 08/12 @ 24:00 1963 3.34 09/28 @ 11:00
1995 1.28 05/01 @ 22:00 1964 3.34 10/15 @ 13:00
1981 1.33 07/16 @ 19:00 1962 3.57 01/05 @ 22:00
1990 1.33 10/22 @ 19:00 1985 3.59 08/16 @ 17:00
1957 1.35 08/17 @ 24:00 1975 3.67 05/03 @ 02:00
1961 1.38 06/05 @ 13:00 1952 3.70 08/30 @ 20:00
1973 1.41 07/03 @ 18:00 1949 3.78 06/13 @ 02:00
2003 1.43 08/04 @ 19:00 1977 3.83 03/29 @ 13:00
1959 1.49 08/26 @ 21:00 1974 3.85 09/05 @ 23:00
1954 1.51 04/25 @ 19:00 1999 4.30 10/10 @ 09:00
1970 1.57 07/21 @ 18:00 1992 4.38 09/27 @ 07:00
1985 1.60 06/07 @ 18:00 1967 4.40 08/22 @ 13:00
1992 1.63 09/28 @ 04:00 1979 4.45 09/29 @ 14:00
1955 1.65 10/01 @ 01:00 1978 4.52 08/03 @ 16:00
1967 1.66 08/22 @ 13:00 2003 4.53 05/21 @ 15:00
1987 1.72 08/02 @ 18:00 1959 4.74 09/29 @ 09:00
1975 1.77 08/27 @ 20:00 1955 4.83 09/30 @ 08:00
1997 1.78 07/23 @ 02:00 1995 5.30 08/26 @ 18:00
1979 1.81 09/30 @ 03:00 1976 5.34 10/08 @ 10:00
1978 2.07 08/03 @ 16:00 1990 5.46 10/10 @ 15:00
1948 2.32 08/03 @ 18:00 1948 6.41 08/03 @ 12:00
1972 2.32 07/26 @ 18:00 1997 6.88 07/23 @ 01:00
NWS station 31-5814, Mooresville 2 WNW (Iredell County)
1976 0.69 07/23 @ 20:00 2000 1.5 09/19 @ 05:00
2000 0.70 09/25 @ 06:00 1986 1.6 12/23 @ 14:00
1992 0.80 08/13 @ 15:00 1950 1.72 05/14 @ 07:00
1999 0.80 08/25 @ 04:00 1980 2.00 09/24 @ 20:00
2002 0.80 07/26 @ 09:00 1996 2.00 08/11 @ 20:00
1964 0.83 01/01 @ 12:00 2001 2.00 03/29 @ 05:00
1968 0.85 07/18 @ 17:00 2002 2.10 07/25 @ 21:00
1970 0.85 08/01 @ 01:00 1968 2.14 03/11 @ 20:00
1966 0.90 07/16 @ 05:00 1958 2.19 12/27 @ 15:00
1998 0.90 06/10 @ 04:00 1989 2.30 08/01 @ 12:00
1950 0.91 04/30 @ 23:00 1998 2.30 06/09 @ 12:00
1977 0.91 09/08 @ 04:00 1966 2.36 08/13 @ 13:00
1958 1.00 08/03 @ 19:00 1988 2.40 11/27 @ 08:00
1961 1.00 06/12 @ 18:00 1974 2.47 01/20 @ 18:00
1983 1.00 06/22 @ 02:00 1969 2.50 06/13 @ 20:00
1988 1.00 09/23 @ 01:00 1984 2.50 08/13 @ 03:00
1990 1.00 08/05 @ 21:00 1965 2.56 03/17 @ 07:00
1993 1.00 09/16 @ 22:00 1983 2.60 11/24 @ 04:00
1953 1.02 03/23 @ 19:00 1955 2.67 08/14 @ 08:00
Table �. Annual maximum 1- and 24-hour precipitation totals for selected U.S. Geological Survey and National Weather Service precipitation sites in or near Mecklenburg County, North Carolina. — Continued
[USGS, U.S. Geological Survey; SR, secondary road; NWS, National Weather Service. Precipitation totals determined for each calendar year. For each site and each duration, precipitation totals are listed from minimum to maximum]
Figure 14. Annual maximum (A) 1-hour (60-minute) and (B) 24-hour (1,440-minute) precipitation distributions at selected U.S. Geological Survey and National Weather Service precipitation stations in or near Mecklenburg County, North Carolina.
Frequency of Annual Maximum Precipitation in the City of Charlotte and Mecklenburg County ��
8
7
6
5
4
3
2
1
012
11
10
9
8
7
6
5
4
3
2
1
0
75th Percentile
Maximum
EXPLANATION
Minimum25th Percentile
Median
CRN15Initial
CRN15Modified
CRN25Modified
NationalWeatherService31-1690
NationalWeatherService31-5814
CRN25Initial
PRECIPITATION STATION
EXPLANATION
ANN
UAL
MAX
IMUM
1-H
OUR
PREC
IPIT
ATIO
N, I
N IN
CHES
ANN
UAL
MAX
IMUM
24-
HOUR
PRE
CIPI
TATI
ON, I
N IN
CHES
CRN15 - Charlotte-Mecklenburg Government Center (11 observations)CRN25 - U.S. Geological Survey station 0214266075 Gar Creek at SR 2120 (McCoy Road) near Oakdale (10 observations)National Weather Service 31-1690 - Charlotte Douglas Airport (56 observations)National Weather Service 31-5814 - Mooresville 2 WNW (55 observations)
A.
B.
SummaryThe characterization of precipitation frequency is
an important component in hydrologic investigations and engineering design. Hydrologists use precipitation-frequency information to develop models that help in the prediction of runoff and flood inundation, and engineers use the information to make decisions concerning the size of hydraulic structures, such as culverts and bridges.
Since 1963, the U.S. Geological Survey (USGS) has collected precipitation data at various locations in Charlotte and Mecklenburg County. In October 1992, the USGS, in cooperation with the city of Charlotte and Mecklenburg County, began to provide wider areal coverage of the county by installing additional precipitation sites primarily within the city limits of Charlotte. By the mid- and late-1990s, the network of sites provided data from most areas of the county and immediate surrounding areas. By the end of 2004, data were being collected at more than 70 sites, 27 of which had at least 10 years of record. While most of these sites are located within the Charlotte city limits, the spatial distribution of the sites provides countywide coverage for assessing the frequency of annual maximum precipitation totals. After examining periods of missing record, 1 of the 27 sites was eliminated, leaving a total of 26 USGS precipitation sites in the county for use in the analyses to determine frequency of annual maximum precipitation totals for durations of 15 and 30 minutes; 1, 2, 3, 6, 12, and 24 hours; and for recurrence intervals of 2, 5, 10, 25, 50, 100, and 500 years.
The data compiled for this study indicate that maximum precipitation values for 2 particular years generally were much greater than those for the other years because of extremely large rainfall amounts associated with storms in August 1995 and July 1997 that caused major flooding in Mecklenburg County. The presence of two unusually large values in the relatively small sample of precipitation totals led to concern that statistical results may be influenced significantly by extremely large values in the sample. To determine the effects of large precipitation totals during 1995 and 1997, annual maximum precipitation values at the USGS sites were computed for two datasets—the CRN initial dataset, which included the August 1995 and July 1997 storm totals, and the CRN modified dataset, which excluded the largest precipita-tion values for these two storms.
To further investigate the effects of relatively short periods of record at the USGS sites, annual maximum precipitation totals (available through December 2003) for eight selected long-term National Weather Service (NWS) precipitation stations in the vicinity of Mecklenburg County were compiled into a third dataset for durations from 15 minutes to 24 hours. The resulting dataset consists of seven stations for the 15- and 30-minute durations and eight stations for the 1- to 24-hour durations (no quarterly precipitation data were available for the NWS station at Charlotte Douglas Airport). The periods of record for the quarterly (15-minute)
data ranged from 24 to 33 years at the eight selected stations, and the period of record for the hourly data generally was about 55 years.
A fourth dataset was developed to combine the selected NWS stations in the vicinity of Mecklenburg County with an aggregated USGS site. This aggregated site was created by using the regional L-moment method to simulate one set of site statistics. Regional L-moment statistics computed for each duration in the CRN initial dataset were combined with the individual L-moment statistics for the NWS stations. This resulted in a sample of eight stations for the 15- and 30-minute durations (again, no quarterly precipitation data were available for the NWS station at Charlotte Douglas Airport) and nine stations for the 1- to 24-hour durations. Including the National Oceanic and Atmospheric Administration (NOAA) datasets in this investigation allowed the analysis of long-term precipitation record in the vicinity of Mecklenburg County and provided an overall quality-assurance check of the L-moment method applied to all datasets.
The L-moment method used in this report is the col-lective group of statistical techniques used in the analyses of annual maximum precipitation totals to compute the regional weighted L-moment statistics for each duration. The L-moment method allows for the computation of statistics that are more useful than the conventional-moments method in selecting the most appropriate probability distribution to describe precipitation frequency. The L-moment method provides the means of estimating the shape of the distribution along with the uncertainty of the estimates and also provides the ability to check for homogeneity among subsets of data within a broad study area or a smaller homogeneous region.
Regional frequency analysis generally involves subdivid-ing sites spread across a broad region into smaller groups having similar frequency distributions as a result of common climatic characteristics or hydrologic factors, such as sites in mountainous regions or coastal regions. Because the geographical extent of Mecklenburg County is small relative to the size of regions commonly used in regionalization studies, however, the sites in this study were not subdivided into smaller groups.
In the L-moment ratio diagrams constructed for this investigation, the data for the corresponding weighted mean of L-skew (τ
3) and L-Kurtosis (τ
4) computed from the CRN
initial dataset generally plotted between the generalized logistic and generalized extreme-value distributions. This trend was supported in similar L-moment ratio diagrams for the other three datasets analyzed in this investigation.
Using the generalized logistic or generalized extreme-value distribution for each duration (15 minutes to 24 hours) in each dataset, estimated precipitation depths (in inches) were computed for the 2-, 5-, 10-, 25-, 50-, 100-, and 500-year recurrence intervals. The precipitation depths were then expressed as precipitation intensity (in inches per hour) using the corresponding value for duration. Examination of the precipitation-frequency curves in ascending order of recurrence intervals resulted in a generally increasing spread
�� Frequency of Annual Maximum Precipitation in the City of Charlotte and Mecklenburg County, NC, through 2004
between the curves for the CRN initial and CRN modified datasets. Beginning with the 60-minute duration and 5-year recurrence interval, percentage differences between many of the corresponding depths in the two datasets exceeded 15 percent, indicating that the presence of large annual maximum precipitation totals for 1995 and 1997 influenced the results in the CRN initial dataset. The 24-hour, 100-year precipitation depths estimated for the CRN initial and CRN modified datasets are 10.99 and 5.74 inches, respectively, which corresponds to the rainfall values in the CRN initial dataset being about 91 percent higher than in the CRN modified dataset.
The precipitation depths for the NOAA datasets had a smaller degree of spread than the frequency curves for the CRN initial and CRN modified datasets and generally tended to straddle the midrange between the CRN datasets. Comparisons between precipitation frequencies computed for the Charlotte Douglas Airport station and the eight selected NWS stations (third dataset) were favorable, and percentage differences between most corresponding depths were less than 15 percent.
Comparisons of precipitation depths between the fourth dataset (selected NWS stations plus an aggregated USGS site) and the CRN initial dataset indicate that percentage differences were generally less than 15 percent for durations less than 6 hours and recurrence intervals less than 25 years. The estimated 24-hour, 100-year precipitation depth of 10.99 inches for the CRN initial dataset is about 51 percent higher than the corresponding value of 7.29 inches for the fourth dataset.
Insight into the percentage differences of the annual maximum 1- and 24-hour precipitation totals computed for selected USGS (CRN15 and CRN25) and NWS (Charlotte Douglas Airport and Mooresville 2 WNW) stations was obtained by examining box plots of the data. The overall ranges in precipitation totals for the USGS sites during the short periods of record were relatively higher than those for the NWS stations, which have much longer periods of record. This confirmed the larger precipitation-frequency values for the USGS sites having short-term records compared with those for the NWS stations with long-term records.
Because of the small sample size available from the USGS precipitation network, which was influenced by the occurrence of two rainfalls in 1995 and 1997, it can be inter-preted that frequency characteristics derived from the CRN initial dataset were influenced by the presence of the 1995 and 1997 storms. Resolution of this issue can best be addressed with additional data. In the absence of further analyses, it can be concluded that use of the third dataset—selected NWS stations with the aggregated USGS site—can currently (2005) be considered appropriate for use in deriving frequency characteristics for Mecklenburg County. This dataset provides consideration of (1) the significant amount of precipitation data, including some large rainfalls that have occurred in the county, and (2) NOAA precipitation data based on longer periods of record.
Selected References
Asquith, W.H., 1998, Depth-duration frequency of precipita-tion for Texas: U.S. Geological Survey Water-Resources Investigations Report 98–4044, 67 p., 1 app., 1 pl.
Asquith, W.H., 2003, Modeling of runoff-producing rainfall hyetographs in Texas using L-moment statistics: Austin, Texas, University of Texas at Austin, Ph.D. dissertation, 386 p.
Bales, J.D., Weaver, J.C., and Robinson, J.B., 1999, Rela-tion of land use to streamflow and water quality at selected sites in the city of Charlotte and Mecklenburg County, North Carolina, 1993–98: U.S. Geological Survey Water-Resources Investigations Report 99–4180, 95 p.
Bonnin, G.M., Lin, B., Parzybok, T., Yekta, M., and Riley, D., 2004, Precipitation-frequency atlas of the United States: Silver Spring, MD, National Oceanic and Atmospheric Administration Atlas 14, v. 2, version 2, National Weather Service; accessed February 1, 2005, at http://www.nws.noaa.gov/ohd/hdsc/
Frederick, R.H., Meyers, V.A., and Auciello, E.P., 1977, Five- to 60-minute precipitation frequency for the eastern and central United States: Washington, DC, National Oceanic and Atmospheric Administration Technical Memorandum NWS HYDRO–35, 36 p.
Greenwood, J.A., Landwehr, J.M., Matalas, N.C., and Wallis, J.R., 1979, Probability weighted moments—Definition and relation to parameters of several distributions expressible in inverse form: Water Resources Research, v. 15, no. 5, p. 1049–1054.
Hazell, W.F., and Bales, J.D., 1997, Real-time rainfall mea-surement in the city of Charlotte and Mecklenburg County, North Carolina: U.S. Geological Survey Fact Sheet FS–052–97, 4 p.
Hershfield, D.M., 1961, Rainfall frequency atlas of the United States for durations from 30 minutes to 24 hours and return periods from 1 to 100 years: Washington, DC, U.S. Weather Bureau, Technical Paper 40, 115 p.
Hosking, J.R.M., 1986, The theory of probability weighted moments: Yorktown Heights, NY, IBM Research Division, T.J. Watson Research Center, Research Report RC–12210, 160 p.
Hosking, J.R.M., 1990, L-moments—Analysis and estimation of distributions using linear combinations of order statistics: Journal Royal Statistical Society B, v. 52, no. 1, p. 105–124.
Selected References ��
Hosking, J.R.M., 1991, FORTRAN routines for use with the method of L-moments, Version 2: Yorktown Heights, NY, IBM Research Division, T.J. Watson Research Center, Research Report RC-17097, 117 p.
Hosking, J.R.M., 1992, Moments or L-moments?—An example comparing two measures of distributional shape: The American Statistician, v. 46, no. 3 (August 1992), p. 186–189.
Hosking, J.R.M., and Wallis, J.R., 1993, Some statistics useful in regional frequency analysis: Water Resources Research, v. 29, no. 2, p. 271–281.
Hosking, J.R.M., and Wallis, J.R., 1995, A comparison of unbiased and plotting-position estimators of L-moments: Water Resources Research, v. 31, no. 8, p. 2019–2025.
Hosking, J.R.M., and Wallis, J.R., 1997, Regional frequency analysis—An approach based on L-moments: Cambridge, United Kingdom, Cambridge University Press, 224 p.
Imhoff, M.W., and Davis, J.M., 1983, Precipitation probabili-ties based on the gamma distribution at 76 North Carolina locations: Raleigh, North Carolina Climate Program Office, North Carolina State University, 259 p.
Kirby, W., 1974, Algebraic boundedness of sample statistics: Water Resources Research, v. 10, p. 220–222.
Landwehr, J.M., Matalas, N.C., and Wallis, J.R., 1979, Prob-ability weighted moments compared with some traditional techniques in estimating Gumbel parameters and quantiles: Water Resources Research, v. 15, no. 5, p. 1055–1064.
LeGrand, H.E., and Mundorff, M.J., 1952, Geology and groundwater in the Charlotte area, North Carolina: Raleigh, North Carolina Department of Conservation and Develop-ment, Bulletin 63, 88 p.
McCachren, C.M., 1980, Soil survey of Mecklenburg County, North Carolina: U.S. Department of Agriculture, Soil Con-servation Service, 97 p.
Miller, D.R., Warner, G.S., Ogden, F.L., and DeGaetano, A.T., 2003, Precipitation in Connecticut: Storrs, CT, Connecticut Institute of Water Resources, University of Connecticut, Report No. 38, 66 p.
Miller, J.F., 1964, Two- to ten-day precipitation for return periods of 2 to 100 years in the contiguous United States: Washington, DC, U.S. Weather Bureau, Technical Paper 49, 29 p.
National Climatic Data Center, 2004, NOAA satellite and information service; accessed October 11, 2005, at http://www.ncdc.noaa.gov/ncdc.html
National Institute for Standards and Technology, 2005, Mea-sures of skewness and kurtosis: Information Technology Laboratory’s e-Handbook of Statistical Methods (Engineer-ing Statistics Handbook); accessed August 9, 2005, at http://www.itl.nist.gov/div898/handbook/eda/section3/eda35b.htm
National Oceanic and Atmospheric Administration, 2004, Climatological data annual summary—North Carolina: National Oceanic and Atmospheric Administration [issued annually].
National Oceanic and Atmospheric Administration, 2005, History of the National Weather Service—Evolution of the NOAA’s National Weather Service (time line): Public Affairs Office, Silver Spring, MD; accessed July 7, 2005, at http://www.weather.gov/pa/history/index.php
National Weather Service, 2004a, Event summary—Hurricane Frances, September 2004: Raleigh, NC, National Weather Service; accessed April 20, 2005, at http://www4.ncsu.edu/~nwsfo/storage/cases/20040908/
National Weather Service, 2004b, Event summary—Hurri-cane Ivan, September 2004: Raleigh, NC, National Weather Service; accessed April 20, 2005, at http://www4.ncsu.edu/~nwsfo/storage/cases/20040917/
Parrett, Charles, 1997, Regional analysis of annual precipita-tion maxima in Montana: U.S. Geological Survey Water-Resources Investigations Report 97–4004, 51 p.
Robinson, J.B., Hazell, W.F., and Garrett, R.G., 1996, Pre-cipitation, streamflow, and water-quality data from selected sites in the city of Charlotte and Mecklenburg County, 1993–95: U.S. Geological Survey Open-File Report 96–150, 136 p.
Robinson, J.B., Hazell, W.F., and Garrett, R.G., 1998, Pre-cipitation, streamflow, and water-quality data from selected sites in the city of Charlotte and Mecklenburg County, 1995–97: U.S. Geological Survey Open-File Report 98–67, 220 p.
Robinson, J.B., Hazell, W.F., and Young, W.S., 1998, Effects of August 1995 and July 1997 storms in the city of Char-lotte and Mecklenburg County, North Carolina: U.S. Geo-logical Survey Fact Sheet FS–036–98, 4 p.
Sarver, K.M., Hazell, W.F., and Robinson, J.B., 1999, Pre-cipitation, atmospheric deposition, streamflow, and water-quality data from selected sites in the city of Charlotte and Mecklenburg County, 1997–98: U.S. Geological Survey Open-File Report 99–273, 144 p.
Saucier, W.J., Weber, A.H., and Bayne, C.K., 1973, Pre-cipitation variability over North Carolina: Raleigh, Water Resources Research Institute of The University of North Carolina, Report No. 84, 185 p.
�� Frequency of Annual Maximum Precipitation in the City of Charlotte and Mecklenburg County, NC, through 2004
Smith, D.G., 1993, Surface- and ground-water quality data at selected landfill sites in Mecklenburg County, North Caro-lina, 1979–92: U.S. Geological Survey Open-File Report 93–437, 971 p.
Southeast Regional Climate Center, 2005, Historical climate summaries and normals for the southeast; accessed April 20, 2005, at http://www.dnr.state.sc.us/climate/sercc/climateinfo/historical/historical.html
State Climate Office of North Carolina, 2005, Aspects of NC climate—Extreme weather records; accessed April 20, 2005, at http://www.nc-climate.ncsu.edu/climate/extremes.html
Tortorelli, R.L., Rea, A., and Asquith, W.H., 1999, Depth-duration frequency of precipitation for Oklahoma: U.S. Geological Survey Water-Resources Investigations Report 99–4232, 113 p.
U.S. Census Bureau, 2005, State & County QuickFacts; accessed February 16, 2005, at http://quickfacts.census.gov/qfd/
U.S. Geological Survey, 2000, U.S. Geological Survey strate-gic plan 2000–2005; accessed August 13, 2003, at http://www.usgs.gov/stratplan/stratplan_rev.pdf
U.S. Geological Survey, 2004, Rainfall network in and around Mecklenburg County; accessed February 7, 2005, at http://nc.water.usgs.gov/char/rainfall.html
U.S. Geological Survey, 2005, Program priorities for 2005: U.S. Geological Survey Water Resources Discipline Infor-mational Memorandum No. 2005.01, accessed in July 2005 at http://water.usgs.gov/coop/priorities.html
Vogel, R.M., and Fennessey, N.M., 1993, L-moment diagrams should replace product moment diagrams: Water Resources Research, v. 29, no. 6, p. 1745–1752.
Wallis, J.R., Matalas, N.C., and Slack, J.R., 1974, Just a moment!: Water Resources Research, v. 10, no. 2, p. 211–219.
Weaver, J.C., 2003, Methods for estimating peak discharges and unit hydrographs for streams in the city of Charlotte and Mecklenburg County, North Carolina: U.S. Geological Sur-vey Water-Resources Investigations Report 03–4108, 50 p.
Zembrzuski, T.J., Jr., Hill, C.L., Weaver, J.C., Coble, R.W., and Gunter, H.C., 1991, North Carolina floods and droughts, in National Water Summary 1988–89— Hydrologic events and floods and droughts: U.S. Geological Survey Water-Supply Paper 2375, p. 425–434.
Selected References ��
Tabl
e 2.
An
nual
max
imum
pre
cipi
tatio
n to
tals
thro
ugh
Dece
mbe
r 200
4 fo
r sel
ecte
d du
ratio
ns a
t sel
ecte
d U.
S. G
eolo
gica
l Sur
vey
prec
ipita
tion
site
s in
Mec
klen
burg
Cou
nty,
N
orth
Car
olin
a. —
Con
tinue
d[n
/c, n
o ch
ange
; USG
S, U
.S. G
eolo
gica
l Sur
vey;
N/A
, not
ava
ilabl
e; S
R, s
econ
dary
road
. Ann
ual m
axim
um p
reci
pita
tion
tota
ls w
ere
com
pute
d by
usi
ng d
ata
thro
ugh
the
2004
cal
enda
r yea
r, w
hich
is c
onsi
sten
t with
th
e an
nual
per
iod
used
in o
ther
pre
cipi
tatio
n-fr
eque
ncy
stud
ies.
For a
ll si
tes,
annu
al p
reci
pita
tion
tota
ls a
re sh
own
twic
e fo
r 199
5 an
d 19
97. T
he sh
aded
blu
e va
lues
for 1
995
and
1997
are
max
imum
tota
ls e
xclu
ding
th
e st
orm
s in
Aug
ust 1
995
and
July
199
7, re
spec
tivel
y, th
at re
sulte
d in
maj
or fl
oodi
ng a
cros
s are
as o
f Cha
rlotte
and
Mec
klen
burg
Cou
nty.
Whe
re e
xclu
sion
of t
he A
ugus
t 199
5 an
d Ju
ly 1
997
stor
m d
ata
does
not
resu
lt in
diff
eren
t sto
rm to
tals
, val
ues a
re d
enot
ed a
s “n/
c” a
nd th
e pr
ecip
itatio
n an
d da
te/ti
me
valu
es a
re th
e sa
me
as th
ose
show
n in
the
row
s lis
ted
abov
e th
e “n
/c”
desi
gnat
ion.
Val
ues d
enot
ed a
s “N
/A”
wer
e re
mov
ed fr
om
anal
ysis
follo
win
g an
ass
essm
ent o
f mis
sing
uni
t-val
ue d
ata]
Year
15 m
inu
tes
30 m
inu
tes
1 h
ou
r (6
0 m
inu
tes)
2 h
ou
rs
(120
min
ute
s)3
ho
urs
(1
80 m
inu
tes)
6 h
ou
rs
(360
min
ute
s)12
ho
urs
(7
20 m
inu
tes)
24 h
ou
rs
(1,4
40 m
inu
tes)
Dep
th,
inch
es
Dat
e an
d
du
rati
on
per
iod
en
din
g
Dep
th,
inch
es
Dat
e an
d
du
rati
on
per
iod
en
din
g
Dep
th,
inch
es
Dat
e an
d
du
rati
on
per
iod
en
din
g
Dep
th,
inch
es
Dat
e an
d
du
rati
on
per
iod
en
din
g
Dep
th,
inch
es
Dat
e an
d
du
rati
on
per
iod
en
din
g
Dep
th,
inch
es
Dat
e an
d
du
rati
on
per
iod
en
din
g
Dep
th,
inch
es
Dat
e an
d
du
rati
on
per
iod
en
din
g
Dep
th,
inch
es
Dat
e an
d
du
rati
on
per
iod
en
din
g
CR
N01
, Fir
e St
atio
n 27
, Ken
Hof
fman
Dri
ve
1994
0.57
07/1
0 @
15:
550.
9207
/10
@ 1
6:05
1.16
07/1
0 @
16:
301.
2007
/10
@ 1
7:00
1.20
07/1
0 @
17:
001.
2503
/02
@ 0
7:20
1.65
03/0
2 @
05:
302.
1203
/02
@ 1
5:30
1995
1.23
07/1
6 @
16:
201.
7807
/16
@ 1
6:30
2.46
07/1
6 @
16:
352.
8108
/27
@ 0
5:20
3.22
08/2
7 @
05:
354.
5708
/27
@ 0
5:20
5.15
08/2
7 @
07:
255.
9908
/27
@ 0
5:25
1995
n/c
n/c
n/c
n/c
n/c
n/c
2.52
07/1
6 @
17:
202.
5407
/16
@ 1
8:10
2.58
07/1
6 @
21:
102.
5807
/16
@ 2
1:10
2.59
07/1
7 @
12:
2519
961.
1305
/29
@ 1
6:30
1.37
05/2
9 @
16:
401.
4005
/29
@ 1
6:40
1.44
05/2
9 @
16:
501.
4405
/29
@ 1
6:50
1.71
10/0
1 @
03:
052.
0310
/01
@ 0
3:45
2.09
10/0
1 @
09:
1519
970.
6807
/23
@ 0
3:05
1.13
07/2
3 @
03:
101.
9507
/23
@ 0
3:20
3.35
07/2
3 @
03:
054.
6207
/23
@ 0
3:50
5.29
07/2
3 @
06:
456.
5807
/23
@ 0
8:50
7.34
07/2
3 @
10:
1519
970.
4904
/28
@ 2
0:45
0.65
02/2
8 @
13:
500.
7402
/28
@ 1
4:00
1.03
02/2
8 @
15:
151.
3610
/26
@ 1
2:25
1.69
10/2
6 @
12:
451.
9510
/19
@ 1
0:40
2.05
04/2
8 @
20:
5019
980.
8308
/13
@ 1
5:25
1.00
08/1
3 @
15:
301.
2608
/13
@ 1
5:45
1.32
04/0
9 @
03:
201.
6704
/09
@ 0
3:25
1.88
04/0
9 @
05:
352.
2809
/04
@ 0
1:55
2.79
09/0
4 @
07:
0019
990.
8007
/06
@ 1
8:15
1.20
07/0
6 @
17:
502.
3507
/06
@ 1
8:20
2.48
07/0
6 @
18:
452.
4807
/06
@ 1
8:45
2.49
07/0
6 @
22:
352.
4907
/06
@ 2
2:35
3.23
10/1
1 @
09:
3020
001.
0108
/04
@ 0
0:00
1.72
08/0
4 @
00:
052.
1008
/04
@ 0
0:25
2.39
08/0
4 @
00:
302.
9608
/04
@ 0
0:40
2.99
08/0
4 @
01:
502.
9908
/04
@ 0
1:50
3.02
09/2
3 @
06:
2520
010.
7206
/28
@ 1
7:30
0.88
06/2
8 @
17:
351.
0309
/04
@ 0
9:00
1.24
09/0
4 @
09:
251.
4009
/04
@ 0
9:15
1.70
09/0
4 @
09:
251.
8509
/04
@ 0
9:25
2.49
09/0
4 @
09:
1520
020.
6208
/16
@ 1
9:15
0.94
08/1
6 @
19:
301.
0610
/13
@ 0
8:30
1.19
10/1
3 @
08:
451.
3910
/11
@ 0
6:55
2.17
10/1
1 @
07:
102.
3110
/11
@ 0
8:05
2.33
10/1
1 @
08:
0520
031.
4408
/04
@ 1
8:40
1.91
08/0
4 @
18:
502.
0008
/04
@ 1
9:15
2.06
08/0
4 @
20:
202.
0808
/04
@ 2
1:00
2.82
08/0
4 @
22:
402.
8308
/05
@ 0
2:35
4.14
05/2
2 @
14:
5020
041.
0907
/27
@ 0
1:40
1.44
07/2
7 @
01:
551.
7907
/27
@ 0
2:25
2.25
06/1
4 @
17:
352.
6708
/12
@ 2
2:35
3.83
09/2
8 @
02:
504.
6609
/28
@ 0
2:50
5.13
09/2
8 @
08:
15
CR
N02
, Fir
e St
atio
n 28
, Old
Sta
tesv
ille
Roa
d
1994
0.62
07/1
9 @
18:
200.
9107
/19
@ 1
8:30
1.15
04/1
6 @
01:
551.
5204
/16
@ 0
2:10
1.58
04/1
6 @
02:
101.
8208
/17
@ 0
3:50
2.09
08/1
7 @
06:
402.
1008
/17
@ 0
6:40
1995
0.97
07/0
1 @
16:
401.
3507
/01
@ 1
6:55
1.56
07/1
6 @
16:
251.
5907
/16
@ 1
6:40
1.82
08/2
7 @
05:
502.
4208
/27
@ 0
5:30
3.22
08/2
7 @
08:
254.
3108
/27
@ 1
5:50
1995
n/c
n/c
n/c
n/c
n/c
n/c
n/c
n/c
1.64
07/1
6 @
18:
151.
7206
/01
@ 2
1:10
1.73
06/0
1 @
23:
402.
5502
/16
@ 2
1:30
1996
0.91
07/1
5 @
14:
001.
0307
/15
@ 1
4:10
1.43
04/2
9 @
13:
302.
1604
/29
@ 1
3:45
2.18
04/2
9 @
14:
452.
2910
/01
@ 0
3:10
2.60
10/0
1 @
03:
353.
0204
/30
@ 0
9:10
1997
0.79
06/0
2 @
12:
451.
1807
/23
@ 0
2:05
1.66
07/2
3 @
02:
302.
6707
/23
@ 0
2:40
3.68
07/2
3 @
03:
454.
9207
/23
@ 0
4:50
6.09
07/2
3 @
10:
156.
3507
/23
@ 2
3:10
1997
n/c
n/c
0.82
06/0
2 @
12:
550.
8406
/02
@ 1
3:25
1.13
09/2
4 @
10:
301.
2609
/24
@ 1
0:30
2.19
09/2
4 @
14:
153.
4709
/24
@ 1
7:45
3.67
09/2
5 @
04:
5019
980.
5807
/31
@ 1
5:40
0.64
08/0
8 @
18:
200.
7108
/08
@ 1
8:40
1.15
04/0
9 @
03:
101.
4804
/09
@ 0
3:15
1.66
04/0
9 @
05:
002.
1109
/04
@ 0
0:25
2.58
09/0
4 @
05:
1019
990.
7407
/06
@ 1
7:30
1.05
07/0
6 @
17:
401.
5807
/06
@ 1
8:10
2.02
07/0
6 @
19:
052.
0607
/06
@ 1
9:05
2.06
07/0
6 @
19:
052.
2010
/10
@ 2
2:15
3.56
10/1
1 @
06:
4020
000.
8808
/03
@ 2
3:25
1.22
07/0
7 @
02:
051.
8108
/04
@ 0
0:00
2.46
08/0
4 @
00:
452.
6208
/04
@ 0
0:45
2.63
08/0
4 @
01:
052.
6308
/04
@ 0
1:05
2.66
08/0
4 @
01:
0520
010.
5206
/13
@ 1
8:55
0.56
06/1
3 @
19:
050.
8609
/03
@ 1
0:40
1.18
09/0
3 @
10:
401.
3809
/03
@ 1
0:50
1.64
09/0
3 @
11:
051.
8709
/03
@ 1
2:10
2.32
09/0
4 @
07:
5520
020.
8908
/16
@ 2
2:15
1.53
07/0
3 @
17:
501.
8007
/03
@ 1
8:00
1.81
07/0
3 @
18:
401.
8107
/03
@ 1
8:00
2.28
10/1
1 @
07:
002.
4310
/11
@ 0
7:50
2.58
07/1
4 @
09:
4020
030.
9808
/07
@ 1
8:35
1.46
06/1
6 @
17:
301.
9406
/16
@ 1
7:50
2.04
08/0
7 @
19:
052.
0508
/07
@ 1
9:25
2.07
06/1
6 @
22:
203.
0503
/20
@ 0
9:50
4.57
05/2
2 @
14:
1020
040.
9007
/27
@ 0
1:25
1.21
07/2
7 @
01:
351.
6307
/27
@ 0
2:05
1.85
07/2
7 @
02:
301.
8707
/27
@ 0
2:30
2.56
09/2
8 @
02:
453.
4709
/28
@ 0
6:15
4.89
09/0
8 @
05:
45
40 Frequency of Annual Maximum Precipitation in the City of Charlotte and Mecklenburg County, NC, through 2004
Tabl
e 2.
An
nual
max
imum
pre
cipi
tatio
n to
tals
thro
ugh
Dece
mbe
r 200
4 fo
r sel
ecte
d du
ratio
ns a
t sel
ecte
d U.
S. G
eolo
gica
l Sur
vey
prec
ipita
tion
site
s in
Mec
klen
burg
Cou
nty,
N
orth
Car
olin
a. —
Con
tinue
d[n
/c, n
o ch
ange
; USG
S, U
.S. G
eolo
gica
l Sur
vey;
N/A
, not
ava
ilabl
e; S
R, s
econ
dary
road
. Ann
ual m
axim
um p
reci
pita
tion
tota
ls w
ere
com
pute
d by
usi
ng d
ata
thro
ugh
the
2004
cal
enda
r yea
r, w
hich
is c
onsi
sten
t with
th
e an
nual
per
iod
used
in o
ther
pre
cipi
tatio
n-fr
eque
ncy
stud
ies.
For a
ll si
tes,
annu
al p
reci
pita
tion
tota
ls a
re sh
own
twic
e fo
r 199
5 an
d 19
97. T
he sh
aded
blu
e va
lues
for 1
995
and
1997
are
max
imum
tota
ls e
xclu
ding
th
e st
orm
s in
Aug
ust 1
995
and
July
199
7, re
spec
tivel
y, th
at re
sulte
d in
maj
or fl
oodi
ng a
cros
s are
as o
f Cha
rlotte
and
Mec
klen
burg
Cou
nty.
Whe
re e
xclu
sion
of t
he A
ugus
t 199
5 an
d Ju
ly 1
997
stor
m d
ata
does
not
resu
lt in
diff
eren
t sto
rm to
tals
, val
ues a
re d
enot
ed a
s “n/
c” a
nd th
e pr
ecip
itatio
n an
d da
te/ti
me
valu
es a
re th
e sa
me
as th
ose
show
n in
the
row
s lis
ted
abov
e th
e “n
/c”
desi
gnat
ion.
Val
ues d
enot
ed a
s “N
/A”
wer
e re
mov
ed fr
om
anal
ysis
follo
win
g an
ass
essm
ent o
f mis
sing
uni
t-val
ue d
ata]
Year
15 m
inu
tes
30 m
inu
tes
1 h
ou
r (6
0 m
inu
tes)
2 h
ou
rs
(120
min
ute
s)3
ho
urs
(1
80 m
inu
tes)
6 h
ou
rs
(360
min
ute
s)12
ho
urs
(7
20 m
inu
tes)
24 h
ou
rs
(1,4
40 m
inu
tes)
Dep
th,
inch
es
Dat
e an
d
du
rati
on
per
iod
en
din
g
Dep
th,
inch
es
Dat
e an
d
du
rati
on
per
iod
en
din
g
Dep
th,
inch
es
Dat
e an
d
du
rati
on
per
iod
en
din
g
Dep
th,
inch
es
Dat
e an
d
du
rati
on
per
iod
en
din
g
Dep
th,
inch
es
Dat
e an
d
du
rati
on
per
iod
en
din
g
Dep
th,
inch
es
Dat
e an
d
du
rati
on
per
iod
en
din
g
Dep
th,
inch
es
Dat
e an
d
du
rati
on
per
iod
en
din
g
Dep
th,
inch
es
Dat
e an
d
du
rati
on
per
iod
en
din
g
CR
N03
, USG
S St
atio
n 02
1462
0760
, Irw
in C
reek
at S
tari
ta R
oad
at C
harl
otte
1994
0.71
10/2
2 @
22:
001.
0210
/22
@ 2
2:00
1.63
08/1
6 @
23:
151.
7908
/16
@ 2
3:20
1.97
08/1
7 @
00:
302.
1908
/17
@ 0
3:45
2.54
08/1
7 @
07:
252.
6008
/17
@ 1
5:10
1995
N/A
N/A
N/A
N/A
N/A
N/A
N/A
N/A
N/A
N/A
N/A
N/A
N/A
N/A
N/A
N/A
1995
0.91
05/1
3 @
21:
251.
0507
/21
@ 1
9:30
1.41
05/1
0 @
03:
001.
6505
/10
@ 0
3:20
1.65
05/1
0 @
03:
201.
6505
/10
@ 0
3:20
1.97
10/0
4 @
13:
052.
3002
/16
@ 2
1:20
1996
1.03
05/2
9 @
16:
201.
3605
/29
@ 1
6:35
2.02
05/2
9 @
16:
302.
3405
/29
@ 1
6:55
2.34
05/2
9 @
16:
552.
3610
/01
@ 0
2:50
2.70
10/0
1 @
03:
052.
7110
/01
@ 0
5:35
1997
1.22
07/2
3 @
01:
302.
1207
/23
@ 0
1:45
3.36
07/2
3 @
01:
505.
0407
/23
@ 0
2:55
6.25
07/2
3 @
03:
407.
0707
/23
@ 0
6:30
8.10
07/2
3 @
10:
159.
1807
/24
@ 0
0:40
1997
0.48
07/3
0 @
04:
000.
5507
/30
@ 0
4:00
0.59
10/2
6 @
11:
351.
0410
/26
@ 1
2:10
1.28
10/2
6 @
12:
101.
6210
/26
@ 1
2:40
2.02
09/2
4 @
17:
452.
2409
/25
@ 0
5:05
1998
0.73
06/2
2 @
23:
251.
1506
/22
@ 2
3:40
1.27
06/2
3 @
00:
051.
5204
/09
@ 0
3:15
1.85
04/0
9 @
03:
202.
0604
/09
@ 0
5:10
2.34
09/0
4 @
01:
503.
0209
/04
@ 0
5:25
1999
0.81
07/2
4 @
16:
250.
9707
/24
@ 1
6:40
1.23
01/2
3 @
14:
351.
5101
/23
@ 1
5:25
1.58
01/2
3 @
16:
252.
0410
/10
@ 1
7:00
2.45
10/1
0 @
20:
254.
0710
/11
@ 0
6:25
2000
1.27
05/0
2 @
20:
301.
5208
/18
@ 1
7:00
1.79
07/1
2 @
14:
152.
0607
/12
@ 1
5:10
2.07
07/1
2 @
15:
202.
0807
/12
@ 1
7:35
2.09
07/1
2 @
17:
352.
1207
/12
@ 1
7:35
2001
0.55
06/1
3 @
19:
050.
7309
/24
@ 1
0:45
0.89
09/2
4 @
11:
101.
0909
/24
@ 1
1:00
1.50
09/2
4 @
11:
001.
7809
/24
@ 1
2:25
1.96
09/2
4 @
12:
251.
9909
/24
@ 1
9:50
2002
0.60
03/3
1 @
14:
201.
1410
/13
@ 0
7:50
1.60
10/1
3 @
08:
001.
7110
/13
@ 0
8:20
1.71
10/1
3 @
08:
201.
8310
/13
@ 1
1:50
1.91
10/1
1 @
07:
352.
3607
/14
@ 0
9:55
2003
0.87
07/1
7 @
02:
551.
3207
/17
@ 0
2:55
1.44
07/1
7 @
03:
251.
4507
/17
@ 0
4:25
1.50
07/1
7 @
05:
201.
8608
/04
@ 2
3:25
2.94
03/2
0 @
09:
503.
0903
/20
@ 1
2:35
2004
0.91
09/0
8 @
05:
301.
0707
/27
@ 0
1:30
1.62
09/0
7 @
13:
302.
2109
/07
@ 1
3:40
2.34
09/0
7 @
14:
252.
7309
/07
@ 1
7:05
3.87
09/0
7 @
22:
005.
7309
/08
@ 0
5:45
CR
N04
, Fir
e St
atio
n 30
, Bel
le O
aks R
oad
1994
0.89
07/1
9 @
17:
551.
5007
/19
@ 1
8:05
1.85
07/1
9 @
18:
351.
9707
/19
@ 1
9:35
2.16
07/1
9 @
20:
352.
1807
/19
@ 2
2:30
2.46
08/1
7 @
06:
502.
5208
/17
@ 1
5:15
1995
1.32
05/0
1 @
21:
251.
4305
/01
@ 2
1:35
1.47
05/0
1 @
22:
051.
9408
/27
@ 1
4:15
1.97
08/2
7 @
15:
152.
2210
/04
@ 1
2:45
3.06
08/2
7 @
14:
154.
5308
/27
@ 1
6:00
1995
n/c
n/c
n/c
n/c
n/c
n/c
1.62
05/0
1 @
23:
051.
9505
/02
@ 0
0:00
n/c
n/c
2.77
10/0
4 @
13:
103.
0410
/05
@ 0
3:55
1996
0.96
06/1
9 @
22:
301.
2106
/19
@ 2
2:45
1.72
06/1
9 @
23:
151.
8506
/20
@ 0
0:15
2.08
06/2
0 @
01:
152.
2706
/20
@ 0
3:40
2.43
04/3
0 @
00:
052.
9004
/30
@ 1
0:10
1997
0.92
07/2
3 @
00:
401.
4107
/23
@ 0
0:50
2.39
07/2
3 @
00:
503.
8107
/23
@ 0
1:25
3.95
07/2
3 @
02:
154.
3507
/23
@ 0
4:55
6.25
07/2
3 @
09:
057.
2307
/23
@ 2
3:25
1997
0.75
06/1
3 @
20:
301.
1206
/13
@ 2
0:40
1.51
06/1
3 @
21:
102.
1206
/13
@ 2
2:10
2.35
06/1
3 @
22:
452.
3606
/13
@ 2
3:50
2.44
06/1
4 @
07:
202.
7406
/13
@ 2
2:30
1998
0.79
06/1
0 @
07:
500.
8306
/10
@ 0
8:05
1.23
06/1
0 @
08:
302.
0806
/10
@ 0
9:15
2.10
06/1
0 @
09:
552.
1704
/09
@ 0
5:00
2.28
09/0
4 @
00:
152.
9109
/04
@ 0
4:20
1999
0.41
09/2
9 @
15:
400.
6706
/10
@ 2
0:55
0.82
05/1
8 @
23:
151.
2210
/10
@ 1
3:40
1.48
10/1
0 @
14:
052.
2910
/10
@ 1
6:45
2.87
10/1
0 @
20:
254.
3010
/11
@ 0
7:10
2000
0.74
07/1
1 @
21:
051.
0907
/11
@ 2
1:20
1.09
07/1
1 @
21:
201.
1007
/11
@ 2
2:10
1.11
07/1
1 @
23:
151.
1903
/20
@ 0
9:05
1.45
09/2
3 @
00:
352.
1709
/23
@ 0
5:40
2001
0.61
07/2
3 @
14:
350.
8709
/24
@ 1
0:30
1.10
09/2
4 @
10:
551.
2309
/24
@ 1
0:55
1.95
09/2
4 @
10:
402.
3609
/24
@ 1
2:50
2.88
09/2
4 @
12:
502.
9009
/24
@ 1
6:30
2002
0.70
05/3
0 @
16:
551.
1105
/30
@ 1
6:55
2.06
05/3
0 @
17:
002.
3205
/30
@ 1
7:55
2.40
05/3
0 @
18:
352.
4710
/11
@ 0
6:45
2.57
10/1
1 @
07:
102.
5807
/14
@ 0
9:15
2003
0.78
08/0
4 @
18:
251.
1306
/07
@ 1
9:45
1.51
06/0
7 @
20:
051.
8306
/07
@ 2
0:45
1.88
06/0
7 @
21:
551.
9406
/08
@ 0
0:10
2.48
03/2
0 @
10:
152.
9906
/07
@ 2
1:15
2004
0.68
06/2
5 @
17:
550.
9006
/25
@ 1
8:05
0.92
06/2
5 @
18:
151.
2206
/13
@ 0
9:55
1.59
06/2
3 @
19:
101.
7206
/23
@ 1
9:45
2.03
09/0
7 @
21:
052.
9409
/08
@ 0
5:30
Table 2 41
Tabl
e 2.
An
nual
max
imum
pre
cipi
tatio
n to
tals
thro
ugh
Dece
mbe
r 200
4 fo
r sel
ecte
d du
ratio
ns a
t sel
ecte
d U.
S. G
eolo
gica
l Sur
vey
prec
ipita
tion
site
s in
Mec
klen
burg
Cou
nty,
N
orth
Car
olin
a. —
Con
tinue
d[n
/c, n
o ch
ange
; USG
S, U
.S. G
eolo
gica
l Sur
vey;
N/A
, not
ava
ilabl
e; S
R, s
econ
dary
road
. Ann
ual m
axim
um p
reci
pita
tion
tota
ls w
ere
com
pute
d by
usi
ng d
ata
thro
ugh
the
2004
cal
enda
r yea
r, w
hich
is c
onsi
sten
t with
th
e an
nual
per
iod
used
in o
ther
pre
cipi
tatio
n-fr
eque
ncy
stud
ies.
For a
ll si
tes,
annu
al p
reci
pita
tion
tota
ls a
re sh
own
twic
e fo
r 199
5 an
d 19
97. T
he sh
aded
blu
e va
lues
for 1
995
and
1997
are
max
imum
tota
ls e
xclu
ding
th
e st
orm
s in
Aug
ust 1
995
and
July
199
7, re
spec
tivel
y, th
at re
sulte
d in
maj
or fl
oodi
ng a
cros
s are
as o
f Cha
rlotte
and
Mec
klen
burg
Cou
nty.
Whe
re e
xclu
sion
of t
he A
ugus
t 199
5 an
d Ju
ly 1
997
stor
m d
ata
does
not
resu
lt in
diff
eren
t sto
rm to
tals
, val
ues a
re d
enot
ed a
s “n/
c” a
nd th
e pr
ecip
itatio
n an
d da
te/ti
me
valu
es a
re th
e sa
me
as th
ose
show
n in
the
row
s lis
ted
abov
e th
e “n
/c”
desi
gnat
ion.
Val
ues d
enot
ed a
s “N
/A”
wer
e re
mov
ed fr
om
anal
ysis
follo
win
g an
ass
essm
ent o
f mis
sing
uni
t-val
ue d
ata]
Year
15 m
inu
tes
30 m
inu
tes
1 h
ou
r (6
0 m
inu
tes)
2 h
ou
rs
(120
min
ute
s)3
ho
urs
(1
80 m
inu
tes)
6 h
ou
rs
(360
min
ute
s)12
ho
urs
(7
20 m
inu
tes)
24 h
ou
rs
(1,4
40 m
inu
tes)
Dep
th,
inch
es
Dat
e an
d
du
rati
on
per
iod
en
din
g
Dep
th,
inch
es
Dat
e an
d
du
rati
on
per
iod
en
din
g
Dep
th,
inch
es
Dat
e an
d
du
rati
on
per
iod
en
din
g
Dep
th,
inch
es
Dat
e an
d
du
rati
on
per
iod
en
din
g
Dep
th,
inch
es
Dat
e an
d
du
rati
on
per
iod
en
din
g
Dep
th,
inch
es
Dat
e an
d
du
rati
on
per
iod
en
din
g
Dep
th,
inch
es
Dat
e an
d
du
rati
on
per
iod
en
din
g
Dep
th,
inch
es
Dat
e an
d
du
rati
on
per
iod
en
din
g
CR
N05
, Cha
rlot
te-M
eckl
enbu
rg U
tiliti
es D
epar
tmen
t Adm
inst
ratio
n B
uild
ing,
Bro
oksh
ire
Bou
leva
rd
1994
N/A
N/A
N/A
N/A
N/A
N/A
N/A
N/A
N/A
N/A
N/A
N/A
N/A
N/A
N/A
N/A
1995
0.77
07/2
1 @
19:
051.
1707
/21
@ 1
9:20
1.24
07/2
1 @
19:
301.
3110
/27
@ 2
0:50
1.39
10/2
7 @
20:
552.
0208
/27
@ 0
8:00
2.91
08/2
7 @
08:
104.
4308
/27
@ 1
6:50
1995
n/c
n/c
n/c
n/c
n/c
n/c
n/c
n/c
n/c
n/c
2.00
10/0
4 @
12:
552.
3310
/04
@ 1
2:55
2.59
10/0
5 @
02:
5019
960.
6309
/04
@ 0
6:00
0.81
09/0
4 @
06:
101.
2708
/11
@ 2
2:25
1.86
08/1
1 @
22:
401.
8708
/11
@ 2
2:40
1.99
08/1
1 @
23:
552.
3108
/12
@ 0
3:55
2.65
08/1
2 @
15:
1519
970.
7807
/23
@ 0
1:00
1.21
07/2
3 @
01:
202.
2307
/23
@ 0
1:40
2.81
07/2
3 @
02:
453.
6307
/23
@ 0
3:15
4.22
07/2
3 @
06:
305.
4107
/23
@ 0
8:35
6.02
07/2
3 @
23:
2519
970.
5706
/02
@ 1
2:30
0.68
06/0
2 @
12:
400.
7306
/02
@ 1
3:05
0.96
10/2
6 @
12:
051.
1510
/26
@ 1
2:10
1.50
10/2
6 @
12:
302.
0309
/24
@ 1
6:50
2.20
09/2
5 @
05:
0019
980.
6607
/25
@ 1
3:05
0.99
07/2
5 @
13:
101.
3807
/25
@ 1
3:35
1.38
07/2
5 @
13:
351.
4104
/09
@ 0
3:05
1.58
04/0
9 @
04:
551.
9709
/03
@ 2
3:45
2.41
09/0
4 @
04:
0019
991.
1103
/21
@ 0
4:15
1.39
07/0
6 @
17:
151.
9007
/06
@ 1
7:45
2.27
07/0
6 @
18:
352.
2807
/06
@ 1
8:55
2.28
07/0
6 @
18:
552.
4010
/10
@ 2
0:25
3.86
10/1
1 @
06:
1020
001.
0108
/18
@ 1
6:45
1.11
08/1
8 @
16:
501.
3003
/16
@ 1
7:40
1.31
03/1
6 @
18:
501.
5903
/16
@ 1
9:45
1.62
03/1
6 @
19:
302.
1003
/16
@ 1
9:45
2.10
03/1
6 @
19:
4520
010.
5204
/13
@ 1
0:15
0.73
08/1
5 @
14:
550.
8008
/15
@ 1
5:10
0.80
08/1
5 @
15:
101.
0209
/24
@ 1
0:35
1.36
09/2
4 @
12:
301.
6803
/29
@ 1
8:55
1.99
03/2
9 @
20:
0020
020.
5106
/06
@ 1
8:00
0.84
07/1
4 @
09:
101.
0407
/14
@ 0
9:35
1.09
10/1
3 @
08:
201.
4810
/11
@ 0
6:40
2.30
10/1
1 @
06:
552.
4310
/11
@ 0
7:35
2.97
07/1
4 @
09:
3520
030.
7108
/04
@ 1
8:25
1.17
06/1
6 @
17:
401.
4006
/16
@ 1
7:45
1.44
06/1
6 @
18:
401.
5106
/16
@ 1
9:30
1.92
05/2
2 @
08:
453.
1205
/22
@ 1
4:45
4.07
05/2
2 @
14:
3520
040.
5707
/27
@ 0
1:05
0.67
06/2
5 @
18:
100.
9607
/17
@ 2
2:00
1.27
09/0
7 @
13:
301.
3909
/07
@ 1
4:05
1.78
09/0
7 @
17:
002.
5309
/07
@ 2
2:05
3.62
09/0
8 @
05:
50
CR
N06
, USG
S St
atio
n 02
1467
50, M
cAlp
ine
Cre
ek b
elow
McM
ulle
n C
reek
nea
r Pi
nevi
lle
1994
0.70
08/1
6 @
21:
451.
1008
/16
@ 2
2:00
1.50
08/1
6 @
22:
151.
6108
/16
@ 2
3:15
1.80
08/1
7 @
00:
152.
0608
/17
@ 0
1:30
2.27
08/1
7 @
07:
302.
3008
/17
@ 0
7:30
1995
0.84
08/1
8 @
20:
401.
2807
/03
@ 0
1:55
1.50
07/0
3 @
02:
051.
6407
/03
@ 0
3:15
1.77
08/2
7 @
04:
352.
8008
/27
@ 0
9:15
4.22
08/2
7 @
09:
255.
5308
/27
@ 1
5:40
1995
n/c
n/c
n/c
n/c
n/c
n/c
1.64
07/0
3 @
03:
151.
6607
/03
@ 0
3:25
1.84
10/0
4 @
12:
452.
6110
/04
@ 1
5:25
2.78
10/0
5 @
02:
3519
960.
5508
/27
@ 2
0:10
0.66
04/3
0 @
00:
201.
0001
/27
@ 0
3:25
1.42
01/2
7 @
03:
301.
6801
/27
@ 0
4:35
1.92
10/0
1 @
01:
452.
4210
/01
@ 0
3:00
2.48
10/0
1 @
07:
1519
970.
8307
/23
@ 0
7:05
1.36
07/2
3 @
07:
202.
2007
/23
@ 0
7:50
2.84
07/2
3 @
08:
153.
1307
/23
@ 0
9:10
3.29
07/2
4 @
01:
103.
6907
/24
@ 0
2:00
6.91
07/2
4 @
02:
0019
970.
4806
/13
@ 2
2:05
0.84
06/1
3 @
22:
201.
3306
/13
@ 2
2:25
1.69
06/1
3 @
22:
451.
7206
/13
@ 2
2:35
1.78
06/1
3 @
23:
151.
8806
/14
@ 0
6:10
2.31
06/1
3 @
23:
1519
980.
6107
/27
@ 0
6:15
1.00
07/2
7 @
06:
251.
9507
/27
@ 0
6:55
2.64
07/2
7 @
07:
503.
2107
/27
@ 0
7:35
3.51
07/2
7 @
10:
003.
5207
/27
@ 1
3:55
3.52
07/2
7 @
13:
5519
990.
6104
/27
@ 2
0:35
0.72
04/2
7 @
20:
501.
0601
/23
@ 1
4:50
1.66
01/2
3 @
15:
151.
7401
/23
@ 1
6:15
1.95
10/1
0 @
18:
202.
6810
/11
@ 0
0:45
3.77
10/1
1 @
07:
1520
000.
7406
/05
@ 1
1:40
1.07
07/1
1 @
21:
251.
4106
/27
@ 1
6:35
1.59
06/2
7 @
16:
352.
1606
/05
@ 1
2:30
2.22
06/0
5 @
14:
402.
2306
/05
@ 1
8:25
2.54
09/2
3 @
06:
5020
010.
5509
/24
@ 0
8:40
0.74
09/0
4 @
05:
251.
0109
/04
@ 0
5:30
1.41
09/2
4 @
09:
551.
7009
/24
@ 1
0:50
1.96
09/2
4 @
12:
152.
3509
/24
@ 1
2:15
2.39
09/2
4 @
14:
4520
021.
0407
/01
@ 1
8:00
1.84
07/0
1 @
18:
102.
6407
/01
@ 1
8:25
2.72
07/0
1 @
18:
502.
7307
/01
@ 1
9:40
2.73
07/0
1 @
19:
402.
7307
/01
@ 1
9:40
2.74
07/0
2 @
08:
3520
030.
5908
/14
@ 1
7:55
0.86
05/0
6 @
01:
251.
3305
/06
@ 0
1:35
1.83
06/1
8 @
17:
151.
9906
/18
@ 1
7:15
2.01
06/1
8 @
19:
552.
0106
/18
@ 1
9:55
2.54
05/0
6 @
15:
5020
040.
8509
/17
@ 0
6:50
1.10
09/1
7 @
07:
001.
2209
/17
@ 0
7:00
1.35
09/2
7 @
22:
451.
4109
/27
@ 2
3:10
1.76
09/1
7 @
10:
202.
1409
/07
@ 2
0:50
3.48
09/0
8 @
05:
30
42 Frequency of Annual Maximum Precipitation in the City of Charlotte and Mecklenburg County, NC, through 2004
Tabl
e 2.
An
nual
max
imum
pre
cipi
tatio
n to
tals
thro
ugh
Dece
mbe
r 200
4 fo
r sel
ecte
d du
ratio
ns a
t sel
ecte
d U.
S. G
eolo
gica
l Sur
vey
prec
ipita
tion
site
s in
Mec
klen
burg
Cou
nty,
N
orth
Car
olin
a. —
Con
tinue
d[n
/c, n
o ch
ange
; USG
S, U
.S. G
eolo
gica
l Sur
vey;
N/A
, not
ava
ilabl
e; S
R, s
econ
dary
road
. Ann
ual m
axim
um p
reci
pita
tion
tota
ls w
ere
com
pute
d by
usi
ng d
ata
thro
ugh
the
2004
cal
enda
r yea
r, w
hich
is c
onsi
sten
t with
th
e an
nual
per
iod
used
in o
ther
pre
cipi
tatio
n-fr
eque
ncy
stud
ies.
For a
ll si
tes,
annu
al p
reci
pita
tion
tota
ls a
re sh
own
twic
e fo
r 199
5 an
d 19
97. T
he sh
aded
blu
e va
lues
for 1
995
and
1997
are
max
imum
tota
ls e
xclu
ding
th
e st
orm
s in
Aug
ust 1
995
and
July
199
7, re
spec
tivel
y, th
at re
sulte
d in
maj
or fl
oodi
ng a
cros
s are
as o
f Cha
rlotte
and
Mec
klen
burg
Cou
nty.
Whe
re e
xclu
sion
of t
he A
ugus
t 199
5 an
d Ju
ly 1
997
stor
m d
ata
does
not
resu
lt in
diff
eren
t sto
rm to
tals
, val
ues a
re d
enot
ed a
s “n/
c” a
nd th
e pr
ecip
itatio
n an
d da
te/ti
me
valu
es a
re th
e sa
me
as th
ose
show
n in
the
row
s lis
ted
abov
e th
e “n
/c”
desi
gnat
ion.
Val
ues d
enot
ed a
s “N
/A”
wer
e re
mov
ed fr
om
anal
ysis
follo
win
g an
ass
essm
ent o
f mis
sing
uni
t-val
ue d
ata]
Year
15 m
inu
tes
30 m
inu
tes
1 h
ou
r (6
0 m
inu
tes)
2 h
ou
rs
(120
min
ute
s)3
ho
urs
(1
80 m
inu
tes)
6 h
ou
rs
(360
min
ute
s)12
ho
urs
(7
20 m
inu
tes)
24 h
ou
rs
(1,4
40 m
inu
tes)
Dep
th,
inch
es
Dat
e an
d
du
rati
on
per
iod
en
din
g
Dep
th,
inch
es
Dat
e an
d
du
rati
on
per
iod
en
din
g
Dep
th,
inch
es
Dat
e an
d
du
rati
on
per
iod
en
din
g
Dep
th,
inch
es
Dat
e an
d
du
rati
on
per
iod
en
din
g
Dep
th,
inch
es
Dat
e an
d
du
rati
on
per
iod
en
din
g
Dep
th,
inch
es
Dat
e an
d
du
rati
on
per
iod
en
din
g
Dep
th,
inch
es
Dat
e an
d
du
rati
on
per
iod
en
din
g
Dep
th,
inch
es
Dat
e an
d
du
rati
on
per
iod
en
din
g
CR
N07
, Fir
e St
atio
n 9,
McK
ee R
oad
1994
0.99
08/2
7 @
17:
201.
6208
/27
@ 1
7:20
2.41
08/2
7 @
17:
352.
4508
/27
@ 1
8:00
2.45
08/2
7 @
18:
002.
4508
/27
@ 1
8:00
2.45
08/2
7 @
18:
002.
5908
/16
@ 0
3:00
1995
1.02
07/0
3 @
02:
451.
7708
/27
@ 0
3:30
2.86
08/2
7 @
03:
353.
6208
/27
@ 0
4:10
3.82
08/2
7 @
04:
205.
5108
/27
@ 0
3:45
6.26
08/2
7 @
08:
107.
1708
/27
@ 1
5:35
1995
n/c
n/c
1.53
07/0
3 @
02:
501.
8807
/03
@ 0
2:50
2.40
07/0
3 @
03:
102.
8907
/03
@ 0
3:50
2.89
07/0
3 @
03:
502.
9007
/03
@ 1
1:45
2.91
07/0
3 @
19:
0519
961.
2408
/02
@ 2
2:30
2.13
08/0
2 @
22:
352.
7508
/02
@ 2
3:05
4.17
08/0
3 @
00:
004.
2808
/03
@ 0
0:45
4.28
08/0
3 @
00:
454.
2908
/03
@ 0
4:45
4.29
08/0
3 @
04:
4519
970.
7901
/03
@ 1
2:00
1.18
01/0
3 @
12:
151.
5801
/03
@ 1
2:35
1.69
07/2
4 @
00:
202.
3701
/03
@ 1
2:45
3.11
07/2
4 @
01:
203.
4107
/24
@ 0
2:10
4.26
07/2
4 @
02:
1019
97n/
cn/
cn/
cn/
cn/
cn/
c1.
6901
/03
@ 1
3:30
n/c
n/c
2.72
01/0
3 @
13:
303.
1010
/19
@ 0
8:30
3.38
10/1
9 @
12:
1019
980.
9507
/31
@ 1
5:50
1.30
07/3
1 @
15:
501.
7707
/27
@ 0
7:10
2.82
07/2
7 @
07:
503.
2907
/27
@ 0
7:50
3.50
07/2
7 @
10:
203.
5007
/27
@ 1
0:20
4.05
09/0
4 @
05:
3519
990.
8307
/06
@ 1
8:20
0.95
07/0
6 @
18:
351.
2101
/23
@ 1
5:20
1.68
01/2
3 @
15:
101.
8501
/23
@ 1
5:30
1.99
01/2
3 @
18:
002.
3601
/24
@ 0
0:40
3.68
01/2
4 @
10:
3020
000.
6607
/11
@ 2
1:30
1.27
07/1
1 @
21:
351.
4007
/11
@ 2
2:05
1.48
07/1
1 @
23:
051.
5507
/11
@ 2
3:50
1.64
09/2
3 @
04:
351.
8709
/23
@ 0
4:30
2.99
09/2
3 @
06:
0520
010.
5607
/25
@ 1
2:50
0.80
09/2
4 @
09:
251.
5009
/24
@ 0
9:30
1.67
09/2
4 @
09:
302.
1409
/24
@ 1
1:30
2.55
09/2
4 @
12:
303.
3309
/24
@ 1
2:30
3.36
09/2
4 @
22:
0020
02N
/AN
/AN
/AN
/AN
/AN
/AN
/AN
/AN
/AN
/AN
/AN
/AN
/AN
/AN
/AN
/A20
031.
0905
/15
@ 1
9:40
1.36
05/1
5 @
19:
551.
5105
/06
@ 0
1:35
1.86
05/0
6 @
01:
351.
9505
/06
@ 0
2:20
2.03
05/0
6 @
03:
252.
6503
/20
@ 0
9:40
2.73
03/2
0 @
10:
4520
041.
0206
/24
@ 1
9:00
1.74
06/2
4 @
19:
002.
0506
/24
@ 1
9:15
2.06
06/2
4 @
19:
452.
0606
/24
@ 1
9:45
2.19
09/0
7 @
15:
202.
8209
/07
@ 2
1:40
3.76
09/0
8 @
05:
30
CR
N08
, St.
Mat
thew
s Chu
rch,
Bal
lant
yne
Com
mon
s Par
kway
1993
1.45
04/0
1 @
19:
021.
4604
/01
@ 1
9:17
1.46
04/0
1 @
19:
171.
4604
/01
@ 1
9:17
1.48
04/0
1 @
21:
171.
7411
/27
@ 1
5:05
2.38
11/2
7 @
19:
402.
4003
/13
@ 1
3:22
1994
1.24
08/2
7 @
17:
201.
4608
/27
@ 1
7:30
1.49
08/2
7 @
17:
501.
6808
/16
@ 2
3:10
1.86
08/1
7 @
00:
152.
0308
/17
@ 0
1:35
2.28
08/1
5 @
13:
202.
5408
/16
@ 0
2:55
1995
1.15
05/2
7 @
16:
451.
3205
/27
@ 1
6:50
1.93
08/2
7 @
03:
302.
9508
/27
@ 0
4:15
3.28
08/2
7 @
04:
353.
8208
/27
@ 0
4:15
4.98
08/2
7 @
09:
256.
8408
/27
@ 1
5:40
1995
n/c
n/c
n/c
n/c
1.41
06/0
9 @
16:
302.
1707
/03
@ 0
2:30
2.76
07/0
3 @
03:
352.
7607
/03
@ 0
3:35
3.01
10/0
4 @
12:
403.
1810
/05
@ 0
2:30
1996
0.87
07/2
0 @
19:
551.
1808
/02
@ 2
2:20
1.37
08/0
2 @
22:
402.
2208
/02
@ 2
3:55
2.65
08/0
3 @
00:
402.
6608
/03
@ 0
1:05
2.78
10/0
1 @
02:
352.
8010
/01
@ 0
5:30
1997
0.56
02/2
8 @
14:
500.
8302
/28
@ 1
4:55
1.11
02/2
8 @
15:
251.
6107
/24
@ 0
0:15
2.14
07/2
4 @
01:
103.
1607
/24
@ 0
1:10
3.37
07/2
4 @
04:
054.
2407
/24
@ 0
1:50
1997
n/c
n/c
n/c
n/c
n/c
n/c
1.54
06/1
3 @
22:
551.
5804
/27
@ 2
2:25
1.73
10/2
6 @
12:
402.
1210
/19
@ 0
8:30
2.37
10/1
9 @
07:
5519
980.
6004
/19
@ 1
5:30
0.81
07/2
7 @
06:
301.
4507
/27
@ 0
7:00
2.10
07/2
7 @
07:
452.
5107
/27
@ 0
7:40
2.76
07/2
7 @
09:
453.
1309
/04
@ 0
0:50
4.02
09/0
4 @
05:
0519
990.
7407
/06
@ 1
8:30
1.07
07/0
6 @
18:
401.
1507
/06
@ 1
9:00
1.64
01/2
3 @
14:
552.
1001
/23
@ 1
5:25
2.26
01/2
3 @
18:
202.
6301
/24
@ 0
0:15
3.69
01/2
4 @
10:
1520
001.
4108
/01
@ 1
6:15
1.56
07/0
7 @
03:
101.
5907
/07
@ 0
3:20
1.60
07/0
7 @
03:
551.
6007
/07
@ 0
3:55
1.69
09/2
3 @
04:
351.
9309
/23
@ 0
4:40
2.61
09/2
3 @
05:
5020
010.
6106
/22
@ 1
7:45
0.65
06/2
2 @
17:
500.
8102
/15
@ 1
1:20
0.92
09/2
4 @
09:
201.
0009
/24
@ 1
1:05
1.28
09/2
4 @
12:
151.
6309
/24
@ 1
2:15
1.70
03/2
9 @
19:
1520
020.
4904
/15
@ 1
3:35
0.93
04/1
5 @
13:
351.
6704
/15
@ 1
4:05
2.71
04/1
5 @
14:
303.
8704
/15
@ 1
4:45
3.87
04/1
5 @
14:
453.
8704
/15
@ 1
4:45
3.87
04/1
5 @
14:
4520
031.
2207
/19
@ 1
7:50
1.75
07/1
9 @
18:
001.
9307
/19
@ 1
8:20
2.09
07/1
9 @
18:
202.
1705
/06
@ 0
2:20
2.24
05/0
6 @
03:
302.
3103
/20
@ 0
9:45
3.05
05/0
6 @
16:
0520
040.
6609
/01
@ 1
7:15
0.86
09/2
7 @
22:
351.
5309
/27
@ 2
2:35
1.88
09/2
7 @
22:
552.
0109
/27
@ 2
3:15
2.18
09/2
8 @
02:
202.
6009
/28
@ 0
6:15
3.38
09/0
8 @
05:
20
Table 2 4�
Tabl
e 2.
An
nual
max
imum
pre
cipi
tatio
n to
tals
thro
ugh
Dece
mbe
r 200
4 fo
r sel
ecte
d du
ratio
ns a
t sel
ecte
d U.
S. G
eolo
gica
l Sur
vey
prec
ipita
tion
site
s in
Mec
klen
burg
Cou
nty,
N
orth
Car
olin
a. —
Con
tinue
d[n
/c, n
o ch
ange
; USG
S, U
.S. G
eolo
gica
l Sur
vey;
N/A
, not
ava
ilabl
e; S
R, s
econ
dary
road
. Ann
ual m
axim
um p
reci
pita
tion
tota
ls w
ere
com
pute
d by
usi
ng d
ata
thro
ugh
the
2004
cal
enda
r yea
r, w
hich
is c
onsi
sten
t with
th
e an
nual
per
iod
used
in o
ther
pre
cipi
tatio
n-fr
eque
ncy
stud
ies.
For a
ll si
tes,
annu
al p
reci
pita
tion
tota
ls a
re sh
own
twic
e fo
r 199
5 an
d 19
97. T
he sh
aded
blu
e va
lues
for 1
995
and
1997
are
max
imum
tota
ls e
xclu
ding
th
e st
orm
s in
Aug
ust 1
995
and
July
199
7, re
spec
tivel
y, th
at re
sulte
d in
maj
or fl
oodi
ng a
cros
s are
as o
f Cha
rlotte
and
Mec
klen
burg
Cou
nty.
Whe
re e
xclu
sion
of t
he A
ugus
t 199
5 an
d Ju
ly 1
997
stor
m d
ata
does
not
resu
lt in
diff
eren
t sto
rm to
tals
, val
ues a
re d
enot
ed a
s “n/
c” a
nd th
e pr
ecip
itatio
n an
d da
te/ti
me
valu
es a
re th
e sa
me
as th
ose
show
n in
the
row
s lis
ted
abov
e th
e “n
/c”
desi
gnat
ion.
Val
ues d
enot
ed a
s “N
/A”
wer
e re
mov
ed fr
om
anal
ysis
follo
win
g an
ass
essm
ent o
f mis
sing
uni
t-val
ue d
ata]
Year
15 m
inu
tes
30 m
inu
tes
1 h
ou
r (6
0 m
inu
tes)
2 h
ou
rs
(120
min
ute
s)3
ho
urs
(1
80 m
inu
tes)
6 h
ou
rs
(360
min
ute
s)12
ho
urs
(7
20 m
inu
tes)
24 h
ou
rs
(1,4
40 m
inu
tes)
Dep
th,
inch
es
Dat
e an
d
du
rati
on
per
iod
en
din
g
Dep
th,
inch
es
Dat
e an
d
du
rati
on
per
iod
en
din
g
Dep
th,
inch
es
Dat
e an
d
du
rati
on
per
iod
en
din
g
Dep
th,
inch
es
Dat
e an
d
du
rati
on
per
iod
en
din
g
Dep
th,
inch
es
Dat
e an
d
du
rati
on
per
iod
en
din
g
Dep
th,
inch
es
Dat
e an
d
du
rati
on
per
iod
en
din
g
Dep
th,
inch
es
Dat
e an
d
du
rati
on
per
iod
en
din
g
Dep
th,
inch
es
Dat
e an
d
du
rati
on
per
iod
en
din
g
CR
N09
, Fir
e St
atio
n 15
, Fro
nten
ac R
oad
1994
0.91
07/1
8 @
19:
201.
2607
/18
@ 1
9:30
1.37
07/1
8 @
19:
551.
8407
/18
@ 2
0:50
2.01
08/1
7 @
00:
302.
2008
/17
@ 0
1:35
2.40
08/1
7 @
07:
152.
4808
/17
@ 1
3:00
1995
1.01
07/2
7 @
17:
051.
5708
/27
@ 0
4:25
2.34
08/2
7 @
04:
503.
1908
/27
@ 0
5:05
3.45
08/2
7 @
05:
204.
8408
/27
@ 0
5:05
5.42
08/2
7 @
10:
206.
4208
/27
@ 1
6:15
1995
n/c
n/c
1.45
07/2
7 @
17:
101.
6307
/27
@ 1
7:20
1.95
09/1
1 @
09:
302.
1209
/11
@ 1
0:10
2.18
09/1
1 @
10:
102.
3810
/04
@ 1
5:40
2.61
07/2
8 @
16:
2019
960.
7005
/29
@ 1
7:40
1.24
05/2
9 @
17:
401.
8705
/29
@ 1
7:40
2.05
05/2
9 @
18:
052.
0505
/29
@ 1
8:05
2.05
05/2
9 @
18:
052.
3010
/01
@ 0
4:25
2.40
10/0
1 @
06:
4519
970.
9707
/23
@ 0
1:55
1.65
07/2
3 @
02:
002.
7207
/23
@ 0
2:00
3.77
07/2
3 @
02:
504.
6307
/23
@ 0
3:45
5.60
07/2
3 @
04:
258.
5207
/23
@ 0
9:30
9.28
07/2
4 @
00:
5019
970.
6606
/02
@ 1
5:05
0.72
03/1
4 @
05:
300.
8403
/14
@ 0
5:40
1.07
03/1
4 @
06:
051.
3810
/26
@ 1
2:25
1.71
10/2
6 @
12:
351.
9009
/24
@ 1
7:15
2.26
09/2
5 @
05:
1519
981.
1706
/29
@ 1
7:20
1.53
06/2
9 @
17:
351.
6206
/29
@ 1
7:50
1.80
04/0
9 @
03:
202.
1604
/09
@ 0
3:20
2.39
04/0
9 @
05:
152.
4004
/09
@ 0
5:15
3.10
09/0
4 @
05:
2519
990.
8307
/06
@ 1
7:55
1.07
07/0
6 @
18:
051.
4407
/06
@ 1
8:25
1.57
01/2
3 @
15:
001.
7201
/23
@ 1
6:00
1.85
10/1
0 @
17:
052.
2910
/10
@ 2
0:55
4.16
10/1
1 @
07:
2020
000.
7707
/14
@ 2
1:15
1.11
07/1
4 @
21:
201.
3509
/23
@ 0
5:05
1.96
09/2
3 @
06:
002.
2009
/23
@ 0
6:30
2.82
09/2
3 @
06:
153.
1309
/23
@ 0
6:30
3.79
09/2
3 @
06:
4520
010.
8907
/04
@ 1
8:15
1.30
07/0
4 @
18:
301.
3507
/04
@ 1
9:00
1.64
07/0
4 @
20:
001.
7809
/24
@ 1
1:00
2.09
09/2
4 @
12:
252.
2609
/24
@ 1
2:25
2.28
09/2
4 @
17:
4020
020.
9908
/02
@ 1
7:50
1.06
08/1
6 @
23:
151.
5808
/16
@ 2
3:20
1.61
08/1
7 @
00:
151.
6408
/17
@ 0
1:05
2.01
08/1
7 @
00:
552.
1010
/11
@ 0
7:45
2.12
10/1
1 @
07:
4520
030.
7006
/07
@ 1
9:55
1.22
06/0
7 @
20:
051.
4906
/07
@ 2
0:30
2.27
06/0
7 @
21:
252.
2806
/07
@ 2
1:45
2.28
06/0
7 @
21:
452.
6106
/07
@ 2
1:45
4.29
05/2
2 @
15:
0520
040.
7407
/17
@ 2
2:50
1.38
07/1
7 @
23:
001.
8707
/17
@ 2
3:20
2.76
07/1
7 @
23:
202.
9007
/17
@ 2
3:25
2.92
07/1
7 @
23:
503.
3009
/28
@ 0
2:40
4.29
09/0
8 @
05:
45
CR
N10
, USG
S St
atio
n 02
1466
00, M
cAlp
ine
Cre
ek a
t Sar
dis R
oad
near
Cha
rlot
te
1994
0.89
07/1
9 @
17:
501.
5108
/18
@ 2
3:45
2.05
08/1
9 @
00:
152.
4708
/19
@ 0
1:10
2.50
08/1
9 @
01:
452.
5508
/19
@ 0
3:30
2.55
08/1
9 @
03:
302.
7708
/15
@ 2
3:40
1995
0.91
05/0
1 @
21:
351.
3108
/27
@ 0
3:45
2.17
08/2
7 @
04:
153.
1208
/27
@ 0
4:25
3.35
08/2
7 @
04:
355.
0308
/27
@ 0
4:35
5.73
08/2
7 @
09:
357.
5008
/27
@ 1
6:10
1995
n/c
n/c
0.96
05/0
1 @
21:
351.
0205
/01
@ 2
2:15
1.26
08/1
8 @
20:
501.
5805
/02
@ 0
0:15
2.03
10/0
4 @
10:
352.
8610
/04
@ 1
4:55
3.04
10/0
5 @
03:
2019
960.
8006
/20
@ 2
0:35
1.35
06/2
0 @
20:
401.
4206
/20
@ 2
0:55
1.68
06/2
0 @
20:
551.
6806
/20
@ 2
0:55
1.98
10/0
1 @
02:
352.
4510
/01
@ 0
3:00
2.49
10/0
1 @
05:
1019
971.
0107
/23
@ 0
7:50
1.67
07/2
3 @
07:
552.
6107
/23
@ 0
8:05
3.20
07/2
3 @
08:
203.
6707
/23
@ 0
9:25
4.09
07/2
3 @
09:
305.
2307
/23
@ 0
9:30
6.65
07/2
3 @
23:
4519
970.
4003
/14
@ 0
5:25
0.54
07/0
5 @
22:
100.
9107
/05
@ 2
2:20
1.03
07/0
5 @
22:
251.
1002
/28
@ 1
7:05
1.44
10/1
9 @
07:
301.
9810
/19
@ 1
0:45
2.27
10/1
9 @
11:
4519
980.
8207
/20
@ 2
0:35
1.22
07/2
0 @
20:
451.
7307
/27
@ 0
7:20
2.69
07/2
7 @
07:
452.
8407
/27
@ 0
8:15
2.88
07/2
7 @
08:
352.
9409
/04
@ 0
0:55
3.85
09/0
4 @
08:
4019
990.
4501
/23
@ 1
4:40
0.71
01/2
3 @
14:
551.
0401
/23
@ 1
5:15
1.58
01/2
3 @
15:
001.
8501
/23
@ 1
5:45
1.97
01/2
3 @
18:
052.
3401
/24
@ 0
0:25
3.26
01/2
4 @
10:
3020
000.
6009
/23
@ 0
4:25
0.97
09/2
3 @
04:
401.
3209
/23
@ 0
4:45
2.00
09/2
3 @
04:
502.
3009
/23
@ 0
5:50
2.84
09/2
3 @
05:
553.
1509
/23
@ 0
6:05
4.23
09/2
3 @
06:
3520
010.
4006
/01
@ 1
2:00
0.49
06/1
3 @
19:
350.
7106
/13
@ 2
0:05
0.88
06/1
3 @
20:
350.
9909
/24
@ 1
0:05
1.34
12/1
0 @
20:
301.
7103
/29
@ 1
8:10
2.03
03/2
9 @
19:
5020
020.
4605
/13
@ 1
7:45
0.86
05/1
3 @
17:
551.
1405
/13
@ 1
8:10
1.15
08/3
1 @
07:
551.
4208
/31
@ 0
8:50
1.98
08/3
1 @
11:
252.
7808
/31
@ 1
6:40
2.95
09/0
1 @
03:
4520
030.
5606
/17
@ 2
0:45
0.65
06/1
7 @
21:
000.
8406
/18
@ 1
6:10
1.28
06/1
8 @
16:
401.
5106
/18
@ 1
7:35
1.58
03/2
0 @
05:
102.
7703
/20
@ 0
9:50
2.89
03/2
0 @
11:
2020
041.
2008
/13
@ 1
6:45
1.83
08/1
3 @
16:
551.
9508
/13
@ 1
7:05
1.97
08/1
3 @
17:
451.
9708
/13
@ 1
7:45
2.62
09/2
8 @
02:
403.
1409
/07
@ 2
1:55
4.28
09/0
8 @
10:
25
44 Frequency of Annual Maximum Precipitation in the City of Charlotte and Mecklenburg County, NC, through 2004
Tabl
e 2.
An
nual
max
imum
pre
cipi
tatio
n to
tals
thro
ugh
Dece
mbe
r 200
4 fo
r sel
ecte
d du
ratio
ns a
t sel
ecte
d U.
S. G
eolo
gica
l Sur
vey
prec
ipita
tion
site
s in
Mec
klen
burg
Cou
nty,
N
orth
Car
olin
a. —
Con
tinue
d[n
/c, n
o ch
ange
; USG
S, U
.S. G
eolo
gica
l Sur
vey;
N/A
, not
ava
ilabl
e; S
R, s
econ
dary
road
. Ann
ual m
axim
um p
reci
pita
tion
tota
ls w
ere
com
pute
d by
usi
ng d
ata
thro
ugh
the
2004
cal
enda
r yea
r, w
hich
is c
onsi
sten
t with
th
e an
nual
per
iod
used
in o
ther
pre
cipi
tatio
n-fr
eque
ncy
stud
ies.
For a
ll si
tes,
annu
al p
reci
pita
tion
tota
ls a
re sh
own
twic
e fo
r 199
5 an
d 19
97. T
he sh
aded
blu
e va
lues
for 1
995
and
1997
are
max
imum
tota
ls e
xclu
ding
th
e st
orm
s in
Aug
ust 1
995
and
July
199
7, re
spec
tivel
y, th
at re
sulte
d in
maj
or fl
oodi
ng a
cros
s are
as o
f Cha
rlotte
and
Mec
klen
burg
Cou
nty.
Whe
re e
xclu
sion
of t
he A
ugus
t 199
5 an
d Ju
ly 1
997
stor
m d
ata
does
not
resu
lt in
diff
eren
t sto
rm to
tals
, val
ues a
re d
enot
ed a
s “n/
c” a
nd th
e pr
ecip
itatio
n an
d da
te/ti
me
valu
es a
re th
e sa
me
as th
ose
show
n in
the
row
s lis
ted
abov
e th
e “n
/c”
desi
gnat
ion.
Val
ues d
enot
ed a
s “N
/A”
wer
e re
mov
ed fr
om
anal
ysis
follo
win
g an
ass
essm
ent o
f mis
sing
uni
t-val
ue d
ata]
Year
15 m
inu
tes
30 m
inu
tes
1 h
ou
r (6
0 m
inu
tes)
2 h
ou
rs
(120
min
ute
s)3
ho
urs
(1
80 m
inu
tes)
6 h
ou
rs
(360
min
ute
s)12
ho
urs
(7
20 m
inu
tes)
24 h
ou
rs
(1,4
40 m
inu
tes)
Dep
th,
inch
es
Dat
e an
d
du
rati
on
per
iod
en
din
g
Dep
th,
inch
es
Dat
e an
d
du
rati
on
per
iod
en
din
g
Dep
th,
inch
es
Dat
e an
d
du
rati
on
per
iod
en
din
g
Dep
th,
inch
es
Dat
e an
d
du
rati
on
per
iod
en
din
g
Dep
th,
inch
es
Dat
e an
d
du
rati
on
per
iod
en
din
g
Dep
th,
inch
es
Dat
e an
d
du
rati
on
per
iod
en
din
g
Dep
th,
inch
es
Dat
e an
d
du
rati
on
per
iod
en
din
g
Dep
th,
inch
es
Dat
e an
d
du
rati
on
per
iod
en
din
g
CR
N11
, Fir
e St
atio
n 10
, Rem
ount
Roa
d
1994
0.79
07/1
9 @
18:
151.
3807
/19
@ 1
8:25
1.67
07/1
9 @
18:
451.
7607
/19
@ 1
9:40
1.91
07/1
9 @
20:
401.
9608
/17
@ 0
3:40
2.31
08/1
7 @
06:
552.
3508
/17
@ 0
6:55
1995
0.97
05/0
1 @
21:
301.
1405
/01
@ 2
1:30
1.17
05/0
1 @
22:
001.
4508
/27
@ 1
4:40
1.97
08/2
7 @
15:
202.
1308
/27
@ 1
8:25
3.47
08/2
7 @
15:
205.
0208
/27
@ 1
7:00
1995
n/c
n/c
n/c
n/c
n/c
n/c
1.29
05/0
1 @
23:
051.
6305
/02
@ 0
0:00
1.76
05/0
2 @
01:
352.
1810
/04
@ 1
3:30
2.43
10/0
5 @
02:
3519
960.
7205
/29
@ 1
6:05
0.91
05/2
9 @
16:
101.
4708
/11
@ 2
2:25
1.99
08/1
1 @
22:
402.
0208
/11
@ 2
2:40
2.37
08/1
2 @
00:
002.
5108
/12
@ 0
3:40
2.79
08/1
2 @
15:
2019
971.
3207
/23
@ 0
1:25
2.14
07/2
3 @
01:
353.
3207
/23
@ 0
1:30
4.18
07/2
3 @
02:
054.
7107
/23
@ 0
3:15
5.58
07/2
3 @
04:
307.
3007
/23
@ 0
9:15
8.07
07/2
3 @
23:
1019
970.
8607
/17
@ 1
5:45
1.50
07/1
7 @
16:
001.
6607
/17
@ 1
6:10
1.93
06/1
3 @
22:
102.
0906
/13
@ 2
2:40
2.09
06/1
3 @
22:
402.
1806
/14
@ 0
7:35
2.50
06/1
3 @
22:
3019
980.
9007
/25
@ 1
3:30
1.50
07/2
5 @
13:
451.
6207
/25
@ 1
4:10
1.83
06/1
0 @
09:
202.
0204
/09
@ 0
3:15
2.23
04/0
9 @
05:
002.
2304
/09
@ 0
5:00
2.72
09/0
4 @
05:
0019
990.
8008
/20
@ 2
0:30
0.96
06/1
0 @
20:
451.
2806
/10
@ 2
1:15
1.38
06/1
0 @
22:
151.
4006
/10
@ 2
2:35
2.04
10/1
0 @
16:
552.
5610
/10
@ 2
0:25
4.13
10/1
1 @
06:
4520
000.
9207
/12
@ 1
4:25
1.54
07/1
2 @
14:
351.
8307
/12
@ 1
5:00
1.87
07/1
2 @
15:
101.
9009
/03
@ 1
6:40
1.90
07/1
2 @
18:
001.
9109
/03
@ 2
2:15
2.30
07/1
2 @
18:
0020
010.
6409
/24
@ 1
0:20
0.97
09/2
4 @
10:
301.
1909
/24
@ 1
1:00
1.39
09/2
4 @
10:
502.
0009
/24
@ 1
0:50
2.34
09/2
4 @
12:
202.
7809
/24
@ 1
2:20
2.80
09/2
4 @
16:
5520
020.
6103
/31
@ 1
4:10
0.81
07/1
3 @
22:
500.
9907
/13
@ 2
3:05
1.10
07/0
1 @
18:
401.
4610
/11
@ 0
6:40
2.34
10/1
1 @
06:
402.
6907
/14
@ 0
7:30
3.18
07/1
4 @
09:
3020
031.
0108
/14
@ 1
7:45
1.37
05/1
5 @
19:
151.
6306
/07
@ 2
0:00
1.84
06/0
7 @
21:
001.
8506
/07
@ 2
1:20
2.05
08/0
4 @
23:
252.
9303
/20
@ 0
9:35
4.50
05/2
2 @
14:
4020
040.
9107
/17
@ 2
1:55
1.16
07/1
7 @
22:
001.
6207
/17
@ 2
2:05
2.13
07/1
7 @
22:
452.
2607
/17
@ 2
3:05
2.28
07/1
8 @
00:
302.
2807
/18
@ 0
0:30
3.60
09/0
8 @
05:
40
CR
N12
, Fir
e St
atio
n 16
, Par
k So
uth
Dri
ve
1994
0.68
08/1
6 @
22:
201.
0408
/16
@ 2
2:25
1.44
08/1
6 @
22:
301.
9608
/15
@ 0
7:50
2.02
08/1
5 @
08:
502.
9108
/15
@ 1
1:45
3.75
08/1
5 @
14:
104.
2408
/16
@ 0
2:30
1995
1.01
06/0
9 @
15:
451.
8806
/09
@ 1
5:55
2.35
06/0
9 @
16:
102.
4508
/27
@ 0
4:55
2.77
08/2
7 @
05:
053.
4408
/27
@ 0
8:10
4.94
08/2
7 @
09:
406.
3408
/27
@ 1
6:00
1995
n/c
n/c
n/c
n/c
n/c
n/c
2.36
06/0
9 @
16:
152.
3806
/09
@ 1
8:05
2.39
06/0
9 @
18:
202.
3906
/09
@ 1
8:20
2.53
10/0
5 @
02:
3019
960.
7208
/24
@ 1
6:25
0.90
08/2
4 @
16:
401.
0808
/24
@ 1
7:10
1.27
01/2
7 @
03:
351.
5601
/27
@ 0
4:40
2.18
10/0
1 @
02:
152.
5810
/01
@ 0
3:05
2.61
10/0
1 @
06:
0519
970.
7607
/23
@ 0
7:30
1.13
07/2
3 @
07:
401.
7907
/23
@ 0
8:10
2.65
07/2
3 @
08:
352.
9007
/23
@ 0
8:50
3.16
07/2
3 @
08:
504.
4007
/23
@ 0
9:40
5.62
07/2
4 @
01:
5019
970.
6607
/05
@ 2
1:40
1.11
07/0
5 @
21:
501.
2907
/05
@ 2
2:05
1.29
07/0
5 @
22:
051.
2907
/05
@ 2
2:05
1.41
10/2
6 @
12:
251.
5610
/19
@ 0
8:15
1.86
06/1
3 @
22:
4019
980.
7107
/27
@ 0
6:05
1.26
07/2
7 @
06:
152.
1707
/27
@ 0
6:40
3.50
07/2
7 @
07:
203.
8907
/27
@ 0
7:50
4.02
07/2
7 @
08:
104.
0207
/27
@ 0
8:10
4.02
07/2
7 @
08:
1019
990.
6601
/23
@ 1
4:20
1.03
01/2
3 @
14:
251.
3301
/23
@ 1
4:55
1.75
01/2
3 @
15:
151.
8201
/23
@ 1
6:15
1.95
01/2
3 @
19:
052.
4410
/10
@ 2
1:25
3.68
10/1
1 @
08:
0020
000.
8308
/26
@ 0
0:55
1.02
08/2
6 @
01:
051.
0208
/26
@ 0
1:05
1.10
08/2
6 @
01:
051.
1108
/26
@ 0
2:20
1.23
09/2
3 @
05:
101.
5209
/23
@ 0
5:30
2.03
09/2
3 @
06:
2520
010.
6008
/17
@ 2
0:50
0.90
08/1
7 @
21:
000.
9108
/17
@ 2
1:05
0.92
08/1
7 @
22:
151.
4609
/24
@ 1
0:55
1.75
09/2
4 @
12:
202.
0209
/24
@ 1
2:20
2.04
09/2
4 @
17:
0020
020.
6505
/13
@ 1
7:30
0.90
05/1
3 @
17:
450.
9005
/13
@ 1
7:45
1.07
08/3
1 @
09:
401.
7007
/13
@ 2
2:25
2.07
08/3
1 @
11:
552.
9108
/31
@ 1
6:40
3.05
07/1
4 @
09:
4520
031.
3105
/15
@ 1
9:20
1.57
05/1
5 @
19:
351.
6105
/15
@ 1
9:45
1.70
08/0
3 @
15:
401.
7608
/03
@ 1
5:50
1.78
08/0
3 @
19:
402.
1303
/20
@ 0
9:50
3.56
05/2
2 @
14:
5020
041.
0209
/08
@ 0
5:20
1.12
06/1
3 @
09:
301.
3706
/13
@ 0
9:40
1.47
06/1
3 @
10:
201.
5006
/13
@ 1
1:35
1.81
09/0
7 @
16:
352.
3509
/07
@ 2
1:05
3.85
09/0
8 @
05:
30
Table 2 4�
Tabl
e 2.
An
nual
max
imum
pre
cipi
tatio
n to
tals
thro
ugh
Dece
mbe
r 200
4 fo
r sel
ecte
d du
ratio
ns a
t sel
ecte
d U.
S. G
eolo
gica
l Sur
vey
prec
ipita
tion
site
s in
Mec
klen
burg
Cou
nty,
N
orth
Car
olin
a. —
Con
tinue
d[n
/c, n
o ch
ange
; USG
S, U
.S. G
eolo
gica
l Sur
vey;
N/A
, not
ava
ilabl
e; S
R, s
econ
dary
road
. Ann
ual m
axim
um p
reci
pita
tion
tota
ls w
ere
com
pute
d by
usi
ng d
ata
thro
ugh
the
2004
cal
enda
r yea
r, w
hich
is c
onsi
sten
t with
th
e an
nual
per
iod
used
in o
ther
pre
cipi
tatio
n-fr
eque
ncy
stud
ies.
For a
ll si
tes,
annu
al p
reci
pita
tion
tota
ls a
re sh
own
twic
e fo
r 199
5 an
d 19
97. T
he sh
aded
blu
e va
lues
for 1
995
and
1997
are
max
imum
tota
ls e
xclu
ding
th
e st
orm
s in
Aug
ust 1
995
and
July
199
7, re
spec
tivel
y, th
at re
sulte
d in
maj
or fl
oodi
ng a
cros
s are
as o
f Cha
rlotte
and
Mec
klen
burg
Cou
nty.
Whe
re e
xclu
sion
of t
he A
ugus
t 199
5 an
d Ju
ly 1
997
stor
m d
ata
does
not
resu
lt in
diff
eren
t sto
rm to
tals
, val
ues a
re d
enot
ed a
s “n/
c” a
nd th
e pr
ecip
itatio
n an
d da
te/ti
me
valu
es a
re th
e sa
me
as th
ose
show
n in
the
row
s lis
ted
abov
e th
e “n
/c”
desi
gnat
ion.
Val
ues d
enot
ed a
s “N
/A”
wer
e re
mov
ed fr
om
anal
ysis
follo
win
g an
ass
essm
ent o
f mis
sing
uni
t-val
ue d
ata]
Year
15 m
inu
tes
30 m
inu
tes
1 h
ou
r (6
0 m
inu
tes)
2 h
ou
rs
(120
min
ute
s)3
ho
urs
(1
80 m
inu
tes)
6 h
ou
rs
(360
min
ute
s)12
ho
urs
(7
20 m
inu
tes)
24 h
ou
rs
(1,4
40 m
inu
tes)
Dep
th,
inch
es
Dat
e an
d
du
rati
on
per
iod
en
din
g
Dep
th,
inch
es
Dat
e an
d
du
rati
on
per
iod
en
din
g
Dep
th,
inch
es
Dat
e an
d
du
rati
on
per
iod
en
din
g
Dep
th,
inch
es
Dat
e an
d
du
rati
on
per
iod
en
din
g
Dep
th,
inch
es
Dat
e an
d
du
rati
on
per
iod
en
din
g
Dep
th,
inch
es
Dat
e an
d
du
rati
on
per
iod
en
din
g
Dep
th,
inch
es
Dat
e an
d
du
rati
on
per
iod
en
din
g
Dep
th,
inch
es
Dat
e an
d
du
rati
on
per
iod
en
din
g
CR
N13
, U.S
. Geo
logi
cal S
urve
y of
fice,
Tyv
ola
Roa
d
1994
1.06
07/1
9 @
18:
001.
8107
/19
@ 1
8:15
2.24
07/1
9 @
18:
402.
3807
/19
@ 1
9:20
2.55
07/1
9 @
20:
202.
5607
/19
@ 2
0:30
3.31
08/1
5 @
14:
103.
7908
/16
@ 0
2:35
1995
1.06
05/0
1 @
21:
251.
1005
/01
@ 2
1:30
1.32
09/2
2 @
16:
301.
4609
/22
@ 1
6:35
1.62
05/0
2 @
00:
002.
2808
/27
@ 0
4:25
3.59
08/2
7 @
14:
055.
1908
/27
@ 1
5:40
1995
n/c
n/c
n/c
n/c
n/c
n/c
n/c
n/c
n/c
n/c
1.77
05/0
2 @
01:
301.
7905
/02
@ 0
2:05
2.14
09/2
3 @
15:
0019
960.
5405
/29
@ 1
6:45
0.96
08/1
1 @
22:
151.
4708
/11
@ 2
2:10
2.03
08/1
1 @
22:
452.
0408
/11
@ 2
3:15
2.48
08/1
1 @
23:
552.
5108
/12
@ 0
1:20
3.10
08/1
2 @
18:
3019
970.
6007
/22
@ 2
3:05
1.02
07/2
2 @
23:
201.
7707
/22
@ 2
3:50
2.44
07/2
3 @
00:
452.
8407
/23
@ 0
1:40
2.93
07/2
3 @
04:
005.
4407
/23
@ 0
9:25
6.31
07/2
3 @
22:
5019
970.
5210
/14
@ 2
0:35
0.71
07/2
9 @
23:
450.
9807
/30
@ 0
0:15
1.05
07/3
0 @
00:
301.
1710
/26
@ 1
2:20
1.50
10/2
6 @
12:
251.
5910
/26
@ 1
5:45
2.10
04/2
8 @
11:
4519
980.
6507
/25
@ 1
3:55
1.08
07/2
5 @
14:
101.
4407
/27
@ 0
6:40
2.39
07/2
7 @
07:
102.
7207
/27
@ 0
7:30
2.85
07/2
7 @
08:
052.
8507
/27
@ 0
8:05
2.91
09/0
4 @
04:
4519
990.
6506
/26
@ 1
7:55
1.07
06/1
0 @
20:
401.
4106
/10
@ 2
1:05
1.48
06/1
0 @
22:
101.
5606
/10
@ 2
3:10
1.89
10/1
0 @
16:
002.
4510
/10
@ 2
0:40
3.87
10/1
1 @
07:
1020
000.
7207
/11
@ 2
1:10
1.12
07/1
1 @
21:
251.
1507
/11
@ 2
1:50
1.16
07/1
1 @
22:
451.
1707
/11
@ 2
3:50
1.20
03/2
0 @
09:
101.
2103
/20
@ 0
9:10
1.70
07/1
2 @
14:
4020
010.
6606
/28
@ 1
7:00
0.82
06/2
8 @
17:
050.
9706
/28
@ 1
7:35
1.09
09/2
4 @
09:
401.
2909
/24
@ 1
0:50
1.62
09/2
4 @
12:
151.
9109
/24
@ 1
2:15
2.04
03/2
9 @
22:
4020
020.
7605
/30
@ 1
7:20
1.49
05/3
0 @
17:
251.
9605
/30
@ 1
7:55
2.42
05/3
0 @
18:
352.
4605
/30
@ 1
9:50
2.47
05/3
0 @
22:
153.
2107
/14
@ 0
9:35
3.75
07/1
4 @
09:
3520
030.
8305
/15
@ 1
9:15
1.14
05/1
5 @
19:
301.
2805
/26
@ 2
3:55
1.44
05/2
6 @
23:
551.
4605
/26
@ 2
3:55
1.77
05/2
1 @
20:
402.
2705
/22
@ 1
5:05
4.36
05/2
2 @
14:
5520
040.
7807
/29
@ 0
6:45
1.24
07/2
9 @
06:
552.
1007
/29
@ 0
7:25
2.28
07/2
9 @
08:
002.
2907
/29
@ 0
8:20
2.29
07/2
9 @
08:
202.
4009
/07
@ 2
1:15
3.66
09/0
8 @
05:
25
CR
N14
, Fir
e St
atio
n 21
, Litt
le R
ock
Roa
d
1994
0.61
08/1
6 @
22:
151.
0008
/16
@ 2
2:25
1.23
08/1
6 @
22:
401.
4108
/16
@ 2
3:20
1.54
08/1
7 @
00:
151.
9108
/17
@ 0
3:30
2.25
08/1
7 @
06:
352.
3308
/17
@ 1
1:50
1995
0.74
04/3
0 @
19:
250.
9110
/27
@ 1
9:25
1.25
10/2
7 @
19:
451.
4510
/27
@ 2
0:45
1.47
10/2
7 @
21:
401.
8710
/04
@ 1
3:00
2.30
10/0
4 @
13:
003.
2208
/27
@ 1
6:05
1995
n/c
n/c
n/c
n/c
n/c
n/c
n/c
n/c
n/c
n/c
n/c
n/c
n/c
n/c
2.57
10/0
5 @
02:
4019
960.
7809
/04
@ 0
5:50
1.12
09/0
4 @
06:
001.
2809
/04
@ 0
6:30
1.41
06/2
0 @
00:
101.
6106
/20
@ 0
1:05
1.81
06/2
0 @
03:
351.
8306
/20
@ 0
3:35
1.83
06/2
0 @
03:
3519
971.
0207
/23
@ 0
0:45
1.80
07/2
3 @
01:
002.
5007
/23
@ 0
1:25
2.96
07/2
3 @
01:
204.
5507
/23
@ 0
3:25
5.46
07/2
3 @
05:
156.
5907
/23
@ 0
8:25
7.28
07/2
3 @
23:
2019
970.
7304
/28
@ 2
0:30
0.80
04/2
8 @
20:
400.
9006
/27
@ 1
3:45
1.21
06/2
7 @
13:
451.
4806
/27
@ 1
4:25
1.94
06/2
7 @
15:
552.
0609
/24
@ 1
6:45
2.26
09/2
5 @
04:
5519
980.
6007
/25
@ 1
3:00
0.94
07/2
5 @
13:
151.
1106
/10
@ 0
9:00
1.56
06/1
0 @
09:
051.
6706
/10
@ 1
0:00
1.85
04/0
9 @
04:
502.
1209
/04
@ 0
0:25
2.51
09/0
4 @
04:
1019
990.
7904
/27
@ 2
0:10
0.97
04/2
7 @
20:
251.
0604
/27
@ 2
0:55
1.20
07/2
4 @
17:
501.
2910
/10
@ 1
4:10
1.84
10/1
0 @
16:
552.
1910
/10
@ 2
0:10
3.50
10/1
1 @
06:
2020
000.
5203
/16
@ 1
8:05
0.90
03/1
6 @
18:
001.
1703
/16
@ 1
8:15
1.22
09/2
2 @
14:
151.
5303
/16
@ 2
0:15
1.58
03/1
6 @
20:
101.
9203
/16
@ 2
0:15
2.28
09/2
3 @
11:
4520
010.
4807
/19
@ 1
5:55
0.65
07/1
9 @
15:
550.
6807
/19
@ 1
6:05
0.69
07/1
9 @
16:
300.
7903
/29
@ 1
7:50
1.29
03/2
9 @
17:
501.
6203
/29
@ 1
8:30
1.90
03/2
9 @
19:
4020
020.
6406
/06
@ 1
7:55
0.90
10/1
3 @
07:
101.
2110
/13
@ 0
7:25
1.27
10/1
3 @
08:
101.
4010
/11
@ 0
6:20
2.21
10/1
1 @
06:
452.
3110
/11
@ 0
7:40
2.32
10/1
1 @
07:
4020
031.
3805
/15
@ 1
8:50
1.81
05/1
5 @
18:
552.
1305
/15
@ 1
9:25
2.22
05/1
5 @
20:
202.
2705
/15
@ 2
0:40
2.37
05/1
5 @
23:
103.
4505
/22
@ 1
4:25
4.48
05/2
2 @
14:
2520
041.
3506
/14
@ 1
7:05
1.61
06/1
4 @
17:
151.
7406
/14
@ 1
7:40
2.01
07/1
7 @
22:
352.
0406
/14
@ 1
9:20
2.52
06/1
4 @
18:
202.
6406
/14
@ 2
2:30
3.43
09/0
8 @
06:
20
4� Frequency of Annual Maximum Precipitation in the City of Charlotte and Mecklenburg County, NC, through 2004
Tabl
e 2.
An
nual
max
imum
pre
cipi
tatio
n to
tals
thro
ugh
Dece
mbe
r 200
4 fo
r sel
ecte
d du
ratio
ns a
t sel
ecte
d U.
S. G
eolo
gica
l Sur
vey
prec
ipita
tion
site
s in
Mec
klen
burg
Cou
nty,
N
orth
Car
olin
a. —
Con
tinue
d[n
/c, n
o ch
ange
; USG
S, U
.S. G
eolo
gica
l Sur
vey;
N/A
, not
ava
ilabl
e; S
R, s
econ
dary
road
. Ann
ual m
axim
um p
reci
pita
tion
tota
ls w
ere
com
pute
d by
usi
ng d
ata
thro
ugh
the
2004
cal
enda
r yea
r, w
hich
is c
onsi
sten
t with
th
e an
nual
per
iod
used
in o
ther
pre
cipi
tatio
n-fr
eque
ncy
stud
ies.
For a
ll si
tes,
annu
al p
reci
pita
tion
tota
ls a
re sh
own
twic
e fo
r 199
5 an
d 19
97. T
he sh
aded
blu
e va
lues
for 1
995
and
1997
are
max
imum
tota
ls e
xclu
ding
th
e st
orm
s in
Aug
ust 1
995
and
July
199
7, re
spec
tivel
y, th
at re
sulte
d in
maj
or fl
oodi
ng a
cros
s are
as o
f Cha
rlotte
and
Mec
klen
burg
Cou
nty.
Whe
re e
xclu
sion
of t
he A
ugus
t 199
5 an
d Ju
ly 1
997
stor
m d
ata
does
not
resu
lt in
diff
eren
t sto
rm to
tals
, val
ues a
re d
enot
ed a
s “n/
c” a
nd th
e pr
ecip
itatio
n an
d da
te/ti
me
valu
es a
re th
e sa
me
as th
ose
show
n in
the
row
s lis
ted
abov
e th
e “n
/c”
desi
gnat
ion.
Val
ues d
enot
ed a
s “N
/A”
wer
e re
mov
ed fr
om
anal
ysis
follo
win
g an
ass
essm
ent o
f mis
sing
uni
t-val
ue d
ata]
Year
15 m
inu
tes
30 m
inu
tes
1 h
ou
r (6
0 m
inu
tes)
2 h
ou
rs
(120
min
ute
s)3
ho
urs
(1
80 m
inu
tes)
6 h
ou
rs
(360
min
ute
s)12
ho
urs
(7
20 m
inu
tes)
24 h
ou
rs
(1,4
40 m
inu
tes)
Dep
th,
inch
es
Dat
e an
d
du
rati
on
per
iod
en
din
g
Dep
th,
inch
es
Dat
e an
d
du
rati
on
per
iod
en
din
g
Dep
th,
inch
es
Dat
e an
d
du
rati
on
per
iod
en
din
g
Dep
th,
inch
es
Dat
e an
d
du
rati
on
per
iod
en
din
g
Dep
th,
inch
es
Dat
e an
d
du
rati
on
per
iod
en
din
g
Dep
th,
inch
es
Dat
e an
d
du
rati
on
per
iod
en
din
g
Dep
th,
inch
es
Dat
e an
d
du
rati
on
per
iod
en
din
g
Dep
th,
inch
es
Dat
e an
d
du
rati
on
per
iod
en
din
g
CR
N15
, Cha
rlot
te-M
eckl
enbu
rg G
over
nmen
t Cen
ter,
Eas
t Fou
rth
Stre
et
1994
0.78
08/1
6 @
22:
351.
0308
/16
@ 2
2:40
1.33
08/1
6 @
23:
101.
5008
/16
@ 2
3:15
1.66
08/1
7 @
00:
301.
8208
/17
@ 0
2:30
2.07
08/1
7 @
06:
452.
0908
/17
@ 0
6:45
1995
0.94
07/2
8 @
16:
051.
1807
/28
@ 1
6:20
1.60
09/1
1 @
08:
402.
1708
/27
@ 1
5:10
2.55
08/2
7 @
15:
202.
9008
/27
@ 1
7:25
5.28
08/2
7 @
15:
156.
7708
/27
@ 1
7:00
1995
n/c
n/c
n/c
n/c
n/c
n/c
2.09
09/1
1 @
09:
052.
1509
/11
@ 0
9:10
2.20
09/1
1 @
09:
102.
2309
/11
@ 0
9:10
2.23
09/1
1 @
09:
1019
960.
7104
/30
@ 0
0:20
0.82
04/3
0 @
00:
251.
0208
/11
@ 2
2:10
1.40
09/3
0 @
23:
251.
5609
/30
@ 2
3:25
2.32
10/0
1 @
02:
352.
6410
/01
@ 0
2:55
2.67
10/0
1 @
04:
3019
971.
4207
/23
@ 0
1:30
2.44
07/2
3 @
01:
403.
5507
/23
@ 0
1:45
4.18
07/2
3 @
02:
304.
6207
/23
@ 0
3:25
5.37
07/2
3 @
06:
107.
6207
/23
@ 0
9:20
8.44
07/2
3 @
23:
1019
970.
4707
/17
@ 1
5:50
0.89
07/1
7 @
15:
550.
9807
/17
@ 1
6:10
1.06
04/2
8 @
09:
451.
1306
/13
@ 2
3:00
1.26
02/2
8 @
18:
051.
6304
/28
@ 0
9:15
2.27
04/2
8 @
11:
3019
980.
7008
/08
@ 1
7:40
0.97
08/0
8 @
17:
551.
2407
/27
@ 0
7:10
1.72
07/2
7 @
07:
201.
9404
/09
@ 0
3:20
2.13
04/0
9 @
05:
052.
1304
/09
@ 0
5:05
2.58
09/0
4 @
05:
2019
990.
8101
/23
@ 1
4:25
1.18
01/2
3 @
14:
301.
4801
/23
@ 1
4:30
1.85
01/2
3 @
15:
251.
9301
/23
@ 1
6:20
2.05
01/2
3 @
18:
102.
4210
/10
@ 2
0:45
4.07
10/1
1 @
06:
5520
000.
9607
/07
@ 0
2:15
1.41
07/0
7 @
02:
301.
5607
/07
@ 0
3:00
1.61
07/1
2 @
15:
151.
6107
/12
@ 1
5:15
1.61
07/1
2 @
15:
151.
6509
/23
@ 0
5:45
2.27
09/2
3 @
06:
2020
010.
7306
/13
@ 1
9:15
0.95
06/1
3 @
19:
301.
0406
/13
@ 1
9:40
1.05
06/1
3 @
20:
001.
2109
/24
@ 1
0:55
1.51
09/2
4 @
12:
201.
7403
/29
@ 1
8:20
2.06
03/2
9 @
20:
1520
020.
6005
/30
@ 1
7:00
0.90
05/3
0 @
17:
100.
9805
/30
@ 1
7:30
1.02
05/3
0 @
18:
351.
2810
/11
@ 0
6:40
1.88
10/1
1 @
07:
052.
0010
/11
@ 0
7:40
2.31
07/1
4 @
09:
4020
030.
8407
/30
@ 1
9:20
1.22
06/0
7 @
19:
551.
6107
/30
@ 1
9:20
2.03
06/0
7 @
21:
152.
0406
/07
@ 2
1:45
2.05
06/0
7 @
23:
202.
2103
/20
@ 0
9:55
3.66
05/2
2 @
14:
4520
040.
8206
/25
@ 1
8:00
1.14
08/1
2 @
20:
251.
5707
/17
@ 2
2:35
2.57
07/1
7 @
22:
502.
7407
/17
@ 2
3:20
2.75
07/1
7 @
23:
202.
7507
/17
@ 2
3:20
3.88
09/0
8 @
05:
30
CR
N16
, Ree
dy C
reek
Par
k E
nvir
onm
enta
l Cen
ter,
Roc
ky R
iver
Roa
d
1994
1.02
08/1
6 @
23:
451.
3808
/16
@ 2
3:45
1.65
08/1
6 @
23:
501.
8408
/16
@ 2
3:50
1.90
08/1
6 @
23:
501.
9608
/16
@ 2
3:50
1.98
08/1
6 @
23:
502.
0808
/16
@ 2
3:50
1995
1.04
07/1
6 @
16:
201.
3707
/16
@ 1
6:35
1.81
08/1
8 @
20:
051.
9808
/27
@ 0
4:50
2.46
08/2
7 @
05:
104.
1008
/27
@ 0
5:20
4.84
08/2
7 @
09:
556.
4008
/27
@ 1
9:20
1995
n/c
n/c
n/c
n/c
n/c
n/c
1.94
08/1
8 @
21:
052.
0708
/18
@ 2
2:00
2.18
08/1
8 @
22:
452.
5510
/04
@ 1
5:35
2.78
10/0
5 @
04:
3519
960.
6705
/29
@ 1
6:10
1.02
05/2
9 @
16:
251.
6805
/29
@ 1
6:45
1.77
05/2
9 @
17:
001.
7705
/29
@ 1
7:00
1.77
05/2
9 @
17:
002.
0104
/30
@ 0
1:05
2.27
04/3
0 @
06:
0519
970.
8607
/23
@ 0
2:10
1.48
07/2
3 @
02:
202.
3307
/23
@ 0
2:45
4.03
07/2
3 @
03:
405.
2107
/23
@ 0
4:05
6.64
07/2
3 @
04:
358.
5907
/23
@ 0
9:20
9.37
07/2
3 @
20:
4519
970.
7606
/21
@ 1
3:45
0.93
06/2
1 @
13:
501.
2006
/21
@ 1
4:00
1.20
06/2
1 @
14:
001.
2910
/26
@ 1
2:25
1.68
10/2
6 @
12:
452.
1410
/19
@ 0
9:35
2.35
10/1
9 @
11:
3019
980.
7608
/09
@ 1
7:25
1.24
08/0
9 @
17:
351.
3208
/09
@ 1
7:55
1.83
04/0
9 @
03:
252.
1904
/09
@ 0
3:25
2.37
04/0
9 @
05:
102.
5109
/04
@ 0
1:50
3.25
09/0
4 @
05:
4019
990.
6301
/23
@ 1
3:35
0.98
01/2
3 @
13:
501.
1901
/23
@ 1
4:10
2.05
01/2
3 @
15:
102.
1401
/23
@ 1
6:00
2.26
01/2
3 @
19:
002.
6501
/24
@ 0
0:25
3.84
10/1
1 @
08:
0520
000.
8108
/18
@ 1
6:55
1.00
08/0
4 @
00:
151.
3609
/23
@ 0
5:20
1.92
09/2
3 @
05:
552.
0409
/23
@ 0
6:40
2.61
09/2
3 @
06:
252.
8809
/23
@ 0
6:40
4.16
09/2
3 @
06:
4020
010.
8007
/04
@ 1
8:40
1.52
07/0
4 @
18:
402.
1307
/04
@ 1
9:10
2.33
07/0
4 @
19:
502.
4907
/04
@ 2
1:05
2.64
09/2
4 @
12:
202.
8109
/24
@ 1
2:20
2.83
09/2
4 @
21:
4020
020.
8908
/24
@ 1
5:30
0.93
08/2
4 @
15:
351.
0310
/13
@ 0
8:25
1.10
10/1
3 @
09:
201.
3010
/11
@ 0
6:55
1.99
10/1
1 @
07:
052.
2610
/11
@ 0
7:55
2.32
09/0
1 @
01:
2020
030.
7007
/29
@ 1
8:00
0.93
06/2
7 @
18:
401.
7007
/17
@ 0
3:05
2.05
07/1
7 @
03:
552.
1407
/17
@ 0
4:35
2.15
07/1
7 @
06:
252.
6405
/22
@ 1
4:50
4.63
05/2
2 @
15:
2020
040.
7907
/27
@ 0
1:55
1.21
07/1
7 @
22:
051.
5009
/27
@ 2
2:55
2.85
07/1
7 @
23:
302.
9907
/17
@ 2
3:45
3.62
09/2
8 @
02:
504.
5009
/28
@ 0
2:50
5.06
09/2
8 @
08:
10
Table 2 4�
Tabl
e 2.
An
nual
max
imum
pre
cipi
tatio
n to
tals
thro
ugh
Dece
mbe
r 200
4 fo
r sel
ecte
d du
ratio
ns a
t sel
ecte
d U.
S. G
eolo
gica
l Sur
vey
prec
ipita
tion
site
s in
Mec
klen
burg
Cou
nty,
N
orth
Car
olin
a. —
Con
tinue
d[n
/c, n
o ch
ange
; USG
S, U
.S. G
eolo
gica
l Sur
vey;
N/A
, not
ava
ilabl
e; S
R, s
econ
dary
road
. Ann
ual m
axim
um p
reci
pita
tion
tota
ls w
ere
com
pute
d by
usi
ng d
ata
thro
ugh
the
2004
cal
enda
r yea
r, w
hich
is c
onsi
sten
t with
th
e an
nual
per
iod
used
in o
ther
pre
cipi
tatio
n-fr
eque
ncy
stud
ies.
For a
ll si
tes,
annu
al p
reci
pita
tion
tota
ls a
re sh
own
twic
e fo
r 199
5 an
d 19
97. T
he sh
aded
blu
e va
lues
for 1
995
and
1997
are
max
imum
tota
ls e
xclu
ding
th
e st
orm
s in
Aug
ust 1
995
and
July
199
7, re
spec
tivel
y, th
at re
sulte
d in
maj
or fl
oodi
ng a
cros
s are
as o
f Cha
rlotte
and
Mec
klen
burg
Cou
nty.
Whe
re e
xclu
sion
of t
he A
ugus
t 199
5 an
d Ju
ly 1
997
stor
m d
ata
does
not
resu
lt in
diff
eren
t sto
rm to
tals
, val
ues a
re d
enot
ed a
s “n/
c” a
nd th
e pr
ecip
itatio
n an
d da
te/ti
me
valu
es a
re th
e sa
me
as th
ose
show
n in
the
row
s lis
ted
abov
e th
e “n
/c”
desi
gnat
ion.
Val
ues d
enot
ed a
s “N
/A”
wer
e re
mov
ed fr
om
anal
ysis
follo
win
g an
ass
essm
ent o
f mis
sing
uni
t-val
ue d
ata]
Year
15 m
inu
tes
30 m
inu
tes
1 h
ou
r (6
0 m
inu
tes)
2 h
ou
rs
(120
min
ute
s)3
ho
urs
(1
80 m
inu
tes)
6 h
ou
rs
(360
min
ute
s)12
ho
urs
(7
20 m
inu
tes)
24 h
ou
rs
(1,4
40 m
inu
tes)
Dep
th,
inch
es
Dat
e an
d
du
rati
on
per
iod
en
din
g
Dep
th,
inch
es
Dat
e an
d
du
rati
on
per
iod
en
din
g
Dep
th,
inch
es
Dat
e an
d
du
rati
on
per
iod
en
din
g
Dep
th,
inch
es
Dat
e an
d
du
rati
on
per
iod
en
din
g
Dep
th,
inch
es
Dat
e an
d
du
rati
on
per
iod
en
din
g
Dep
th,
inch
es
Dat
e an
d
du
rati
on
per
iod
en
din
g
Dep
th,
inch
es
Dat
e an
d
du
rati
on
per
iod
en
din
g
Dep
th,
inch
es
Dat
e an
d
du
rati
on
per
iod
en
din
g
CR
N17
, Pin
ey G
rove
Ele
men
tary
Sch
ool,
Eag
lew
ind
Dri
ve
1994
0.91
07/1
9 @
17:
501.
4206
/28
@ 2
2:15
1.56
06/2
8 @
22:
451.
7706
/28
@ 2
3:45
1.80
06/2
9 @
00:
152.
3308
/15
@ 1
1:00
3.05
08/1
5 @
14:
303.
2908
/15
@ 2
3:40
1995
1.04
05/0
1 @
21:
401.
2505
/01
@ 2
1:45
1.88
08/2
7 @
04:
052.
5108
/27
@ 0
4:15
3.00
08/2
7 @
04:
505.
0908
/27
@ 0
4:50
5.63
08/2
7 @
09:
556.
9408
/27
@ 1
8:30
1995
n/c
n/c
n/c
n/c
1.37
07/0
3 @
01:
151.
4407
/03
@ 0
1:40
1.72
05/0
2 @
00:
151.
9405
/02
@ 0
2:05
2.51
10/0
4 @
15:
352.
6410
/05
@ 0
2:40
1996
1.15
08/2
6 @
14:
001.
7708
/26
@ 1
4:10
2.13
08/2
6 @
14:
252.
1508
/26
@ 1
4:30
2.16
08/2
6 @
16:
152.
2108
/26
@ 1
7:10
2.21
08/2
6 @
17:
102.
7904
/30
@ 0
6:10
1997
0.96
07/2
3 @
07:
551.
7707
/23
@ 0
7:55
2.99
07/2
3 @
08:
153.
6707
/23
@ 0
8:20
3.99
07/2
3 @
08:
404.
7607
/23
@ 0
9:20
6.55
07/2
3 @
09:
108.
1707
/23
@ 2
3:45
1997
0.64
07/2
9 @
23:
500.
9407
/29
@ 2
3:55
1.03
07/3
0 @
00:
251.
2204
/27
@ 2
2:10
1.48
04/2
7 @
22:
401.
9310
/19
@ 0
7:30
2.47
10/1
9 @
08:
502.
7310
/19
@ 1
0:50
1998
1.06
07/2
5 @
14:
401.
4807
/25
@ 1
4:50
1.75
07/2
7 @
07:
103.
1007
/27
@ 0
7:55
3.28
07/2
7 @
08:
053.
3407
/27
@ 0
8:30
3.35
07/2
7 @
12:
153.
8409
/04
@ 0
6:30
1999
0.79
07/0
7 @
16:
150.
8507
/07
@ 1
6:25
1.29
07/0
6 @
18:
252.
1601
/23
@ 1
5:15
2.28
01/2
3 @
15:
552.
4101
/23
@ 1
8:20
2.77
01/2
4 @
00:
304.
0910
/11
@ 0
7:20
2000
1.27
07/1
2 @
14:
302.
0307
/12
@ 1
4:35
2.43
07/1
2 @
14:
552.
4307
/12
@ 1
4:55
2.43
07/1
2 @
14:
552.
4307
/12
@ 1
4:55
2.43
07/1
2 @
14:
553.
5207
/12
@ 1
4:55
2001
0.51
10/2
5 @
02:
000.
6010
/25
@ 0
2:15
0.60
10/2
5 @
02:
150.
7409
/24
@ 1
0:10
0.86
09/2
4 @
10:
101.
0509
/24
@ 1
2:20
1.21
09/2
4 @
12:
201.
4103
/21
@ 0
1:30
2002
0.85
05/3
0 @
16:
251.
1408
/16
@ 2
2:55
1.77
05/3
0 @
17:
102.
3608
/31
@ 0
8:35
2.85
08/3
1 @
08:
453.
8708
/31
@ 1
1:00
4.44
08/3
1 @
16:
254.
5809
/01
@ 0
0:55
2003
1.06
04/2
6 @
13:
451.
1206
/07
@ 2
2:00
1.77
06/0
7 @
22:
302.
1506
/07
@ 2
2:30
2.48
06/0
7 @
22:
402.
4906
/07
@ 2
2:40
2.68
06/0
7 @
22:
404.
3806
/07
@ 2
2:40
2004
0.83
08/1
3 @
16:
501.
1707
/17
@ 2
1:55
1.89
07/1
7 @
22:
252.
7407
/17
@ 2
2:55
2.76
07/1
7 @
22:
552.
8509
/28
@ 0
2:45
3.61
09/2
8 @
06:
404.
1209
/28
@ 0
8:35
CR
N18
, USG
S St
atio
n 02
1429
00, L
ong
Cre
ek n
ear
Paw
Cre
ek
1994
0.77
07/2
6 @
22:
301.
1407
/26
@ 2
2:35
1.24
07/2
6 @
23:
001.
2407
/26
@ 2
3:00
1.28
08/1
7 @
00:
351.
6508
/17
@ 0
3:40
2.02
08/1
7 @
06:
502.
1508
/17
@ 1
1:30
1995
1.02
05/1
3 @
21:
151.
2705
/13
@ 2
1:25
1.49
05/1
3 @
21:
351.
6310
/27
@ 2
0:50
1.75
09/1
1 @
09:
202.
1110
/04
@ 1
3:00
2.57
10/0
4 @
13:
003.
6308
/27
@ 1
7:25
1995
n/c
n/c
n/c
n/c
n/c
n/c
n/c
n/c
n/c
n/c
n/c
n/c
n/c
n/c
2.84
10/0
5 @
02:
5019
960.
9209
/04
@ 0
6:15
1.16
09/0
4 @
06:
251.
2109
/04
@ 0
6:45
1.60
08/1
1 @
22:
451.
6508
/11
@ 2
3:15
1.95
08/1
1 @
22:
452.
1208
/12
@ 0
4:00
2.83
08/1
2 @
16:
1519
970.
8407
/23
@ 0
3:25
1.30
07/2
3 @
03:
302.
1307
/23
@ 0
3:45
2.88
07/2
3 @
04:
403.
5407
/23
@ 0
4:15
5.39
07/2
3 @
04:
406.
4307
/23
@ 0
8:55
6.71
07/2
3 @
22:
5019
970.
5509
/09
@ 1
9:00
0.72
02/2
8 @
13:
200.
9002
/28
@ 1
3:35
1.11
10/2
6 @
11:
501.
3710
/26
@ 1
2:00
2.06
09/2
4 @
16:
003.
3209
/24
@ 1
7:30
3.53
09/2
5 @
05:
2519
980.
7607
/16
@ 1
2:35
1.29
07/1
6 @
12:
401.
5807
/16
@ 1
3:00
1.58
07/1
6 @
13:
001.
5807
/16
@ 1
3:00
1.64
09/0
3 @
19:
102.
2509
/04
@ 0
0:20
2.65
09/0
4 @
04:
0019
990.
9411
/11
@ 1
4:20
1.13
11/1
1 @
14:
251.
6307
/24
@ 1
7:05
1.88
07/2
4 @
17:
351.
8907
/24
@ 1
8:30
1.92
10/1
0 @
16:
202.
2810
/10
@ 2
0:05
3.84
10/1
1 @
07:
2520
001.
0708
/18
@ 1
6:40
1.31
07/0
7 @
02:
301.
5907
/07
@ 0
2:40
1.60
07/0
7 @
03:
001.
6007
/07
@ 0
3:00
1.65
03/1
6 @
20:
152.
0303
/16
@ 2
0:20
2.04
03/1
7 @
02:
1020
010.
4607
/19
@ 1
5:25
0.76
06/2
6 @
12:
450.
9306
/26
@ 1
3:20
1.43
06/2
6 @
13:
501.
4306
/26
@ 1
3:50
1.43
06/2
6 @
13:
501.
7903
/29
@ 1
8:35
2.07
03/2
9 @
19:
5520
020.
5905
/11
@ 0
2:30
0.88
05/1
3 @
17:
150.
9205
/13
@ 1
7:20
1.46
10/1
1 @
06:
001.
8710
/11
@ 0
6:40
2.65
10/1
1 @
06:
402.
7110
/11
@ 0
7:55
2.71
10/1
1 @
07:
5520
030.
7808
/04
@ 1
8:15
1.30
08/0
4 @
18:
251.
5308
/04
@ 1
8:45
1.74
09/2
2 @
23:
102.
1009
/22
@ 2
3:10
2.46
09/2
3 @
00:
102.
9805
/22
@ 1
4:25
4.50
05/2
2 @
13:
4020
041.
0206
/14
@ 1
7:15
1.40
06/1
4 @
17:
251.
5406
/14
@ 1
7:55
1.78
06/1
4 @
18:
551.
8506
/14
@ 1
9:55
2.26
06/1
4 @
18:
452.
6509
/07
@ 2
2:10
3.75
09/0
8 @
05:
45
4� Frequency of Annual Maximum Precipitation in the City of Charlotte and Mecklenburg County, NC, through 2004
Tabl
e 2.
An
nual
max
imum
pre
cipi
tatio
n to
tals
thro
ugh
Dece
mbe
r 200
4 fo
r sel
ecte
d du
ratio
ns a
t sel
ecte
d U.
S. G
eolo
gica
l Sur
vey
prec
ipita
tion
site
s in
Mec
klen
burg
Cou
nty,
N
orth
Car
olin
a. —
Con
tinue
d[n
/c, n
o ch
ange
; USG
S, U
.S. G
eolo
gica
l Sur
vey;
N/A
, not
ava
ilabl
e; S
R, s
econ
dary
road
. Ann
ual m
axim
um p
reci
pita
tion
tota
ls w
ere
com
pute
d by
usi
ng d
ata
thro
ugh
the
2004
cal
enda
r yea
r, w
hich
is c
onsi
sten
t with
th
e an
nual
per
iod
used
in o
ther
pre
cipi
tatio
n-fr
eque
ncy
stud
ies.
For a
ll si
tes,
annu
al p
reci
pita
tion
tota
ls a
re sh
own
twic
e fo
r 199
5 an
d 19
97. T
he sh
aded
blu
e va
lues
for 1
995
and
1997
are
max
imum
tota
ls e
xclu
ding
th
e st
orm
s in
Aug
ust 1
995
and
July
199
7, re
spec
tivel
y, th
at re
sulte
d in
maj
or fl
oodi
ng a
cros
s are
as o
f Cha
rlotte
and
Mec
klen
burg
Cou
nty.
Whe
re e
xclu
sion
of t
he A
ugus
t 199
5 an
d Ju
ly 1
997
stor
m d
ata
does
not
resu
lt in
diff
eren
t sto
rm to
tals
, val
ues a
re d
enot
ed a
s “n/
c” a
nd th
e pr
ecip
itatio
n an
d da
te/ti
me
valu
es a
re th
e sa
me
as th
ose
show
n in
the
row
s lis
ted
abov
e th
e “n
/c”
desi
gnat
ion.
Val
ues d
enot
ed a
s “N
/A”
wer
e re
mov
ed fr
om
anal
ysis
follo
win
g an
ass
essm
ent o
f mis
sing
uni
t-val
ue d
ata]
Year
15 m
inu
tes
30 m
inu
tes
1 h
ou
r (6
0 m
inu
tes)
2 h
ou
rs
(120
min
ute
s)3
ho
urs
(1
80 m
inu
tes)
6 h
ou
rs
(360
min
ute
s)12
ho
urs
(7
20 m
inu
tes)
24 h
ou
rs
(1,4
40 m
inu
tes)
Dep
th,
inch
es
Dat
e an
d
du
rati
on
per
iod
en
din
g
Dep
th,
inch
es
Dat
e an
d
du
rati
on
per
iod
en
din
g
Dep
th,
inch
es
Dat
e an
d
du
rati
on
per
iod
en
din
g
Dep
th,
inch
es
Dat
e an
d
du
rati
on
per
iod
en
din
g
Dep
th,
inch
es
Dat
e an
d
du
rati
on
per
iod
en
din
g
Dep
th,
inch
es
Dat
e an
d
du
rati
on
per
iod
en
din
g
Dep
th,
inch
es
Dat
e an
d
du
rati
on
per
iod
en
din
g
Dep
th,
inch
es
Dat
e an
d
du
rati
on
per
iod
en
din
g
CR
N19
, Fre
eodm
Par
k, C
umbe
rlan
d D
rive
1994
N/A
N/A
N/A
N/A
N/A
N/A
N/A
N/A
N/A
N/A
N/A
N/A
N/A
N/A
N/A
N/A
1995
1.19
05/0
1 @
21:
301.
3607
/22
@ 2
2:30
1.77
08/2
7 @
04:
352.
6208
/27
@ 1
4:20
3.31
08/2
7 @
14:
403.
6908
/27
@ 1
7:15
6.48
08/2
7 @
14:
458.
4308
/27
@ 1
6:35
1995
n/c
n/c
n/c
n/c
1.39
07/2
2 @
22:
351.
5309
/11
@ 0
9:10
1.88
05/0
2 @
00:
052.
1105
/02
@ 0
1:40
2.14
05/0
2 @
04:
502.
2910
/05
@ 0
2:35
1996
1.07
06/1
9 @
22:
501.
2406
/19
@ 2
3:05
1.32
06/1
9 @
23:
351.
4506
/20
@ 0
0:35
1.63
01/2
7 @
04:
352.
4910
/01
@ 0
2:15
2.83
10/0
1 @
02:
352.
8610
/01
@ 0
6:10
1997
1.20
07/2
3 @
01:
351.
7307
/23
@ 0
1:35
2.37
07/2
3 @
01:
453.
2307
/23
@ 0
1:45
3.94
07/2
3 @
01:
554.
1507
/23
@ 0
4:15
7.19
07/2
3 @
09:
107.
9507
/23
@ 2
2:55
1997
0.59
02/2
8 @
14:
100.
7902
/28
@ 1
4:15
0.98
09/2
8 @
16:
301.
2602
/28
@ 1
5:45
1.35
02/2
8 @
16:
451.
6110
/26
@ 1
2:30
1.73
10/1
9 @
11:
502.
2502
/28
@ 1
8:05
1998
0.99
08/0
9 @
17:
101.
3608
/09
@ 1
7:25
1.43
08/0
9 @
17:
402.
0504
/09
@ 0
3:15
2.40
04/0
9 @
03:
152.
6004
/09
@ 0
5:05
2.60
04/0
9 @
05:
052.
9309
/04
@ 0
5:15
1999
0.85
01/2
3 @
14:
201.
3101
/23
@ 1
4:30
1.66
01/2
3 @
14:
302.
0801
/23
@ 1
5:20
2.17
01/2
3 @
16:
202.
3101
/23
@ 1
9:25
2.65
01/2
4 @
01:
204.
2510
/11
@ 0
8:40
2000
0.75
07/1
1 @
21:
151.
0507
/11
@ 2
1:30
1.09
07/1
1 @
21:
351.
0907
/11
@ 2
1:35
1.09
07/1
1 @
21:
351.
3609
/23
@ 0
5:30
1.60
09/2
3 @
05:
402.
0909
/23
@ 1
2:00
2001
0.49
06/2
2 @
17:
000.
6409
/24
@ 0
8:20
0.78
09/2
4 @
08:
501.
2509
/24
@ 0
9:45
1.49
09/2
4 @
10:
501.
8209
/24
@ 1
2:35
1.98
09/2
4 @
12:
352.
0009
/24
@ 2
3:15
2002
0.53
05/3
0 @
17:
050.
8705
/30
@ 1
7:20
1.15
05/3
0 @
17:
351.
3707
/14
@ 0
8:30
1.71
07/1
4 @
09:
401.
9307
/14
@ 0
9:50
2.69
07/1
4 @
07:
403.
3107
/14
@ 0
9:50
2003
0.71
05/1
5 @
19:
151.
2606
/07
@ 2
0:20
2.10
06/0
7 @
20:
302.
8606
/07
@ 2
1:25
2.88
06/0
7 @
21:
402.
8906
/07
@ 2
1:40
3.10
06/0
7 @
22:
304.
3505
/22
@ 1
4:35
2004
0.88
06/2
3 @
16:
351.
0509
/08
@ 0
5:25
1.43
07/2
7 @
18:
201.
7207
/17
@ 2
3:05
2.07
06/2
3 @
19:
202.
2006
/23
@ 2
0:00
2.29
06/2
4 @
00:
203.
6209
/08
@ 0
5:45
CR
N20
, Fir
e St
atio
n 14
, Nor
th S
haro
n A
mity
Roa
d
1994
0.99
08/1
8 @
23:
101.
5808
/18
@ 2
3:25
1.86
08/1
8 @
23:
502.
0108
/19
@ 0
0:50
2.04
08/1
9 @
01:
502.
1608
/19
@ 0
3:50
2.78
08/1
5 @
14:
203.
0008
/16
@ 0
3:05
1995
1.31
06/2
8 @
17:
251.
9308
/27
@ 0
4:10
2.70
08/2
7 @
04:
403.
5708
/27
@ 0
4:50
3.90
08/2
7 @
05:
154.
8908
/27
@ 0
4:45
6.28
08/2
7 @
14:
308.
7108
/27
@ 1
6:35
1995
n/c
n/c
1.58
06/2
8 @
17:
401.
6606
/28
@ 1
8:00
1.68
06/2
8 @
18:
201.
6806
/28
@ 1
8:20
1.71
10/0
4 @
12:
502.
2510
/04
@ 1
5:40
2.37
10/0
5 @
02:
3019
960.
8108
/24
@ 1
6:45
1.25
08/2
4 @
17:
001.
5108
/24
@ 1
7:20
1.56
08/2
4 @
18:
201.
6708
/24
@ 1
9:10
2.25
10/0
1 @
02:
302.
6410
/01
@ 0
3:15
2.68
10/0
1 @
07:
3019
970.
8107
/20
@ 1
5:45
1.10
07/2
3 @
08:
051.
6707
/23
@ 0
8:15
2.40
07/2
3 @
08:
502.
5507
/23
@ 0
9:00
3.00
07/2
3 @
09:
004.
6407
/23
@ 0
9:20
5.94
07/2
4 @
01:
3019
97n/
cn/
c1.
0507
/20
@ 1
5:45
1.61
07/2
0 @
16:
151.
6507
/20
@ 1
6:30
1.65
07/2
0 @
16:
301.
6507
/20
@ 1
6:30
1.65
07/2
0 @
16:
301.
9804
/28
@ 1
2:15
1998
0.98
05/3
0 @
13:
501.
3605
/30
@ 1
4:00
1.78
07/2
7 @
07:
252.
8307
/27
@ 0
7:35
3.07
07/2
7 @
08:
003.
1507
/27
@ 0
8:20
3.15
07/2
7 @
08:
203.
2209
/04
@ 0
5:40
1999
0.90
07/0
6 @
17:
451.
6707
/06
@ 1
8:00
2.26
07/0
6 @
18:
252.
3707
/06
@ 1
9:20
2.37
07/0
6 @
19:
202.
3707
/06
@ 1
9:20
2.37
07/0
6 @
19:
203.
7610
/11
@ 0
7:25
2000
0.82
07/1
1 @
21:
201.
2707
/11
@ 2
1:30
1.37
07/1
1 @
21:
501.
3807
/11
@ 2
2:25
1.47
09/2
3 @
05:
402.
2109
/23
@ 0
5:30
2.47
09/2
3 @
05:
553.
1509
/23
@ 0
6:55
2001
0.64
08/1
3 @
14:
050.
8108
/13
@ 1
4:15
0.88
09/2
4 @
11:
151.
2009
/24
@ 1
1:30
1.73
09/2
4 @
11:
302.
0609
/24
@ 1
3:25
2.24
09/2
4 @
13:
252.
2509
/24
@ 1
7:45
2002
1.21
05/3
0 @
16:
501.
4705
/30
@ 1
7:05
1.53
05/3
0 @
17:
301.
5705
/30
@ 1
8:30
1.81
08/3
1 @
09:
101.
9508
/31
@ 0
9:15
2.53
07/1
4 @
07:
303.
0007
/14
@ 1
0:15
2003
0.88
08/3
0 @
17:
151.
2308
/30
@ 1
7:25
1.37
06/0
7 @
21:
001.
8506
/07
@ 2
2:10
2.17
06/0
7 @
22:
302.
1706
/07
@ 2
2:30
2.45
03/2
0 @
09:
454.
1505
/22
@ 1
5:05
2004
0.91
06/2
3 @
16:
451.
1607
/17
@ 2
2:30
2.25
07/1
7 @
22:
302.
4407
/17
@ 2
2:40
2.46
07/1
7 @
22:
552.
4607
/17
@ 2
2:55
3.18
09/0
7 @
21:
554.
6309
/08
@ 0
5:35
Table 2 4�
Tabl
e 2.
An
nual
max
imum
pre
cipi
tatio
n to
tals
thro
ugh
Dece
mbe
r 200
4 fo
r sel
ecte
d du
ratio
ns a
t sel
ecte
d U.
S. G
eolo
gica
l Sur
vey
prec
ipita
tion
site
s in
Mec
klen
burg
Cou
nty,
N
orth
Car
olin
a. —
Con
tinue
d[n
/c, n
o ch
ange
; USG
S, U
.S. G
eolo
gica
l Sur
vey;
N/A
, not
ava
ilabl
e; S
R, s
econ
dary
road
. Ann
ual m
axim
um p
reci
pita
tion
tota
ls w
ere
com
pute
d by
usi
ng d
ata
thro
ugh
the
2004
cal
enda
r yea
r, w
hich
is c
onsi
sten
t with
th
e an
nual
per
iod
used
in o
ther
pre
cipi
tatio
n-fr
eque
ncy
stud
ies.
For a
ll si
tes,
annu
al p
reci
pita
tion
tota
ls a
re sh
own
twic
e fo
r 199
5 an
d 19
97. T
he sh
aded
blu
e va
lues
for 1
995
and
1997
are
max
imum
tota
ls e
xclu
ding
th
e st
orm
s in
Aug
ust 1
995
and
July
199
7, re
spec
tivel
y, th
at re
sulte
d in
maj
or fl
oodi
ng a
cros
s are
as o
f Cha
rlotte
and
Mec
klen
burg
Cou
nty.
Whe
re e
xclu
sion
of t
he A
ugus
t 199
5 an
d Ju
ly 1
997
stor
m d
ata
does
not
resu
lt in
diff
eren
t sto
rm to
tals
, val
ues a
re d
enot
ed a
s “n/
c” a
nd th
e pr
ecip
itatio
n an
d da
te/ti
me
valu
es a
re th
e sa
me
as th
ose
show
n in
the
row
s lis
ted
abov
e th
e “n
/c”
desi
gnat
ion.
Val
ues d
enot
ed a
s “N
/A”
wer
e re
mov
ed fr
om
anal
ysis
follo
win
g an
ass
essm
ent o
f mis
sing
uni
t-val
ue d
ata]
Year
15 m
inu
tes
30 m
inu
tes
1 h
ou
r (6
0 m
inu
tes)
2 h
ou
rs
(120
min
ute
s)3
ho
urs
(1
80 m
inu
tes)
6 h
ou
rs
(360
min
ute
s)12
ho
urs
(7
20 m
inu
tes)
24 h
ou
rs
(1,4
40 m
inu
tes)
Dep
th,
inch
es
Dat
e an
d
du
rati
on
per
iod
en
din
g
Dep
th,
inch
es
Dat
e an
d
du
rati
on
per
iod
en
din
g
Dep
th,
inch
es
Dat
e an
d
du
rati
on
per
iod
en
din
g
Dep
th,
inch
es
Dat
e an
d
du
rati
on
per
iod
en
din
g
Dep
th,
inch
es
Dat
e an
d
du
rati
on
per
iod
en
din
g
Dep
th,
inch
es
Dat
e an
d
du
rati
on
per
iod
en
din
g
Dep
th,
inch
es
Dat
e an
d
du
rati
on
per
iod
en
din
g
Dep
th,
inch
es
Dat
e an
d
du
rati
on
per
iod
en
din
g
CR
N21
, Ken
nedy
Jun
ior
Hig
h Sc
hool
, Gal
lant
Lan
e
1994
0.85
08/1
9 @
18:
151.
1708
/19
@ 1
8:25
1.35
08/1
9 @
18:
551.
3808
/19
@ 1
9:35
1.43
08/1
9 @
20:
451.
4408
/19
@ 2
2:40
1.75
10/1
0 @
11:
201.
8310
/10
@ 1
2:05
1995
0.90
05/0
1 @
21:
250.
9105
/01
@ 2
1:25
0.98
10/2
7 @
20:
051.
2110
/04
@ 1
0:00
1.40
10/0
4 @
10:
352.
2010
/04
@ 1
2:40
2.79
10/0
4 @
13:
003.
9208
/27
@ 1
5:45
1995
n/c
n/c
n/c
n/c
n/c
n/c
n/c
n/c
n/c
n/c
n/c
n/c
n/c
n/c
3.00
10/0
5 @
03:
0519
960.
6204
/30
@ 0
0:10
0.83
05/2
9 @
16:
551.
0409
/04
@ 0
6:30
1.52
01/2
7 @
03:
251.
7201
/27
@ 0
4:25
1.84
01/2
7 @
06:
451.
8601
/27
@ 1
2:40
1.99
04/3
0 @
11:
0019
970.
9906
/02
@ 1
4:20
1.28
10/1
4 @
20:
451.
8907
/23
@ 0
0:20
2.53
07/2
3 @
00:
552.
6807
/23
@ 0
1:25
2.73
07/2
3 @
04:
354.
4707
/23
@ 1
0:25
5.60
07/2
3 @
23:
1519
97n/
cn/
cn/
cn/
c1.
6010
/14
@ 2
1:10
2.19
06/1
3 @
22:
252.
2606
/13
@ 2
2:35
2.26
06/1
3 @
22:
352.
3606
/14
@ 0
8:10
2.79
06/1
3 @
22:
3019
980.
9907
/17
@ 1
8:55
1.09
07/2
0 @
21:
101.
9307
/20
@ 2
1:40
3.01
07/2
0 @
21:
503.
1407
/27
@ 0
7:20
3.35
07/2
1 @
00:
403.
3607
/21
@ 0
6:40
3.36
07/2
1 @
06:
4019
990.
5807
/10
@ 1
2:50
0.95
06/1
0 @
21:
001.
2606
/10
@ 2
1:20
1.40
06/1
0 @
22:
201.
4806
/10
@ 2
3:10
2.18
10/1
0 @
16:
452.
7210
/10
@ 2
0:45
4.24
10/1
1 @
07:
1020
000.
6807
/11
@ 2
1:00
1.05
07/1
1 @
21:
151.
1107
/11
@ 2
1:25
1.13
07/1
1 @
22:
351.
1407
/11
@ 2
3:10
1.29
06/2
8 @
20:
101.
5403
/20
@ 1
7:50
1.79
03/2
0 @
20:
2020
011.
5106
/28
@ 1
6:45
1.85
06/2
8 @
16:
551.
9206
/28
@ 1
7:05
1.95
06/2
8 @
17:
451.
9506
/28
@ 1
7:45
2.33
09/2
4 @
12:
152.
7809
/24
@ 1
3:00
2.79
09/2
4 @
16:
5020
020.
6107
/14
@ 0
8:30
0.90
07/1
4 @
08:
301.
4507
/14
@ 0
8:45
1.62
07/1
4 @
08:
452.
0807
/14
@ 0
9:10
2.21
07/1
4 @
08:
552.
8107
/14
@ 0
8:55
2.94
07/1
4 @
09:
1020
030.
6108
/09
@ 0
0:25
0.98
08/0
9 @
00:
351.
2808
/09
@ 0
0:40
1.44
08/0
9 @
01:
251.
4608
/09
@ 0
2:05
1.52
08/0
9 @
02:
052.
5003
/20
@ 1
0:10
3.39
05/2
2 @
16:
2520
040.
5806
/08
@ 1
8:00
0.68
06/1
3 @
08:
350.
9607
/27
@ 0
1:50
1.24
09/2
7 @
22:
451.
3409
/27
@ 2
3:00
1.67
09/2
7 @
23:
302.
0808
/12
@ 2
2:30
3.08
09/0
8 @
05:
25
CR
N22
, Lak
e W
ylie
Ele
men
tary
Sch
ool,
Erw
in R
oada
1994
1.11
09/2
4 @
20:
051.
9209
/24
@ 2
0:15
2.88
08/1
5 @
06:
553.
6808
/15
@ 0
7:45
4.05
08/1
5 @
08:
405.
2608
/15
@ 1
1:50
6.23
08/1
5 @
13:
506.
2908
/16
@ 0
2:35
1995
N/A
N/A
N/A
N/A
N/A
N/A
N/A
N/A
N/A
N/A
N/A
N/A
N/A
N/A
N/A
N/A
1995
N/A
N/A
N/A
N/A
N/A
N/A
N/A
N/A
N/A
N/A
N/A
N/A
N/A
N/A
N/A
N/A
1996
N/A
N/A
N/A
N/A
N/A
N/A
N/A
N/A
N/A
N/A
N/A
N/A
N/A
N/A
N/A
N/A
1997
N/A
N/A
N/A
N/A
N/A
N/A
N/A
N/A
N/A
N/A
N/A
N/A
N/A
N/A
N/A
N/A
1997
N/A
N/A
N/A
N/A
N/A
N/A
N/A
N/A
N/A
N/A
N/A
N/A
N/A
N/A
N/A
N/A
1998
1.08
07/2
0 @
21:
402.
0007
/20
@ 2
1:50
2.56
07/2
0 @
22:
153.
5707
/27
@ 0
7:10
4.17
07/2
7 @
07:
154.
3807
/27
@ 0
8:55
4.38
07/2
7 @
08:
554.
3807
/27
@ 0
8:55
1999
0.79
05/1
9 @
00:
550.
7905
/19
@ 0
0:55
0.83
05/1
9 @
00:
550.
9906
/10
@ 2
2:30
1.37
10/1
0 @
15:
102.
1010
/10
@ 1
5:40
2.84
10/1
0 @
20:
404.
4110
/11
@ 0
8:40
2000
N/A
N/A
N/A
N/A
N/A
N/A
N/A
N/A
N/A
N/A
N/A
N/A
N/A
N/A
N/A
N/A
2001
0.48
04/1
2 @
11:
350.
9304
/12
@ 1
1:35
1.16
04/1
2 @
12:
051.
9204
/12
@ 1
2:40
1.92
04/1
2 @
12:
401.
9204
/12
@ 1
2:40
2.06
03/2
9 @
18:
052.
4203
/29
@ 2
2:55
2002
0.81
05/1
3 @
17:
201.
1605
/13
@ 1
7:35
1.16
05/1
3 @
17:
351.
1605
/13
@ 1
7:35
1.16
05/1
3 @
17:
352.
0810
/11
@ 0
6:55
2.19
10/1
1 @
07:
202.
2910
/11
@ 0
7:20
2003
0.85
08/0
9 @
00:
001.
3208
/09
@ 0
0:20
1.91
08/0
9 @
00:
302.
0108
/09
@ 0
1:25
2.03
08/0
9 @
02:
002.
0308
/09
@ 0
2:00
2.58
03/2
0 @
09:
403.
6405
/22
@ 1
5:00
2004
0.66
09/0
8 @
05:
050.
7809
/08
@ 0
5:15
1.08
08/1
2 @
20:
501.
1909
/27
@ 2
2:45
1.30
09/2
7 @
22:
551.
5209
/27
@ 2
2:55
2.13
08/1
2 @
20:
553.
2009
/08
@ 0
5:25
�0 Frequency of Annual Maximum Precipitation in the City of Charlotte and Mecklenburg County, NC, through 2004
Tabl
e 2.
An
nual
max
imum
pre
cipi
tatio
n to
tals
thro
ugh
Dece
mbe
r 200
4 fo
r sel
ecte
d du
ratio
ns a
t sel
ecte
d U.
S. G
eolo
gica
l Sur
vey
prec
ipita
tion
site
s in
Mec
klen
burg
Cou
nty,
N
orth
Car
olin
a. —
Con
tinue
d[n
/c, n
o ch
ange
; USG
S, U
.S. G
eolo
gica
l Sur
vey;
N/A
, not
ava
ilabl
e; S
R, s
econ
dary
road
. Ann
ual m
axim
um p
reci
pita
tion
tota
ls w
ere
com
pute
d by
usi
ng d
ata
thro
ugh
the
2004
cal
enda
r yea
r, w
hich
is c
onsi
sten
t with
th
e an
nual
per
iod
used
in o
ther
pre
cipi
tatio
n-fr
eque
ncy
stud
ies.
For a
ll si
tes,
annu
al p
reci
pita
tion
tota
ls a
re sh
own
twic
e fo
r 199
5 an
d 19
97. T
he sh
aded
blu
e va
lues
for 1
995
and
1997
are
max
imum
tota
ls e
xclu
ding
th
e st
orm
s in
Aug
ust 1
995
and
July
199
7, re
spec
tivel
y, th
at re
sulte
d in
maj
or fl
oodi
ng a
cros
s are
as o
f Cha
rlotte
and
Mec
klen
burg
Cou
nty.
Whe
re e
xclu
sion
of t
he A
ugus
t 199
5 an
d Ju
ly 1
997
stor
m d
ata
does
not
resu
lt in
diff
eren
t sto
rm to
tals
, val
ues a
re d
enot
ed a
s “n/
c” a
nd th
e pr
ecip
itatio
n an
d da
te/ti
me
valu
es a
re th
e sa
me
as th
ose
show
n in
the
row
s lis
ted
abov
e th
e “n
/c”
desi
gnat
ion.
Val
ues d
enot
ed a
s “N
/A”
wer
e re
mov
ed fr
om
anal
ysis
follo
win
g an
ass
essm
ent o
f mis
sing
uni
t-val
ue d
ata]
Year
15 m
inu
tes
30 m
inu
tes
1 h
ou
r (6
0 m
inu
tes)
2 h
ou
rs
(120
min
ute
s)3
ho
urs
(1
80 m
inu
tes)
6 h
ou
rs
(360
min
ute
s)12
ho
urs
(7
20 m
inu
tes)
24 h
ou
rs
(1,4
40 m
inu
tes)
Dep
th,
inch
es
Dat
e an
d
du
rati
on
per
iod
en
din
g
Dep
th,
inch
es
Dat
e an
d
du
rati
on
per
iod
en
din
g
Dep
th,
inch
es
Dat
e an
d
du
rati
on
per
iod
en
din
g
Dep
th,
inch
es
Dat
e an
d
du
rati
on
per
iod
en
din
g
Dep
th,
inch
es
Dat
e an
d
du
rati
on
per
iod
en
din
g
Dep
th,
inch
es
Dat
e an
d
du
rati
on
per
iod
en
din
g
Dep
th,
inch
es
Dat
e an
d
du
rati
on
per
iod
en
din
g
Dep
th,
inch
es
Dat
e an
d
du
rati
on
per
iod
en
din
g
CR
N23
, Cha
rles
T. M
eyer
s Gol
f Cou
rse,
Har
risb
urg
Roa
d
1994
0.85
06/2
8 @
22:
101.
0706
/28
@ 2
2:20
1.36
06/2
8 @
22:
501.
5006
/28
@ 2
3:45
1.57
06/2
9 @
00:
451.
6306
/29
@ 0
3:40
1.81
10/1
0 @
10:
451.
8310
/10
@ 1
1:30
1995
N/A
N/A
N/A
N/A
N/A
N/A
N/A
N/A
N/A
N/A
N/A
N/A
N/A
N/A
N/A
N/A
1995
1.29
08/1
8 @
19:
551.
8908
/18
@ 2
0:05
2.17
08/1
8 @
20:
202.
3308
/18
@ 2
1:15
2.47
08/1
8 @
22:
202.
5708
/18
@ 2
2:55
2.98
10/0
4 @
13:
153.
2210
/05
@ 0
3:20
1996
1.34
06/1
9 @
23:
551.
8006
/20
@ 0
0:00
2.36
08/2
4 @
17:
152.
4608
/24
@ 1
8:15
2.62
08/2
4 @
19:
152.
6508
/24
@ 1
9:55
2.65
08/2
4 @
19:
552.
6708
/25
@ 1
3:20
1997
0.96
07/2
3 @
02:
101.
2907
/23
@ 0
0:25
1.53
07/2
3 @
02:
552.
7507
/23
@ 0
3:55
3.20
07/2
3 @
04:
155.
5607
/23
@ 0
7:50
8.45
07/2
3 @
07:
508.
7207
/23
@ 2
0:25
1997
0.73
07/0
9 @
18:
050.
9707
/09
@ 1
8:15
1.36
10/1
9 @
05:
001.
9510
/19
@ 0
5:05
2.38
10/1
9 @
05:
203.
3610
/19
@ 0
7:55
4.16
10/1
9 @
09:
004.
4210
/19
@ 1
1:05
1998
0.80
04/0
3 @
21:
450.
8808
/09
@ 1
7:35
0.99
04/2
2 @
18:
501.
1407
/27
@ 0
8:15
1.31
07/2
7 @
08:
151.
6509
/03
@ 1
9:15
2.55
09/0
4 @
01:
503.
2809
/04
@ 0
5:40
1999
0.73
09/2
9 @
16:
150.
7909
/29
@ 1
6:15
0.89
07/0
6 @
18:
401.
5909
/29
@ 1
6:25
1.61
09/2
9 @
17:
401.
7410
/11
@ 0
6:40
2.14
10/1
0 @
22:
154.
0010
/11
@ 0
7:45
2000
0.69
07/1
2 @
14:
101.
0307
/12
@ 1
4:15
1.14
07/1
4 @
22:
001.
2307
/12
@ 1
5:25
1.25
09/2
3 @
06:
251.
7609
/23
@ 0
6:15
2.00
09/2
3 @
06:
252.
6009
/23
@ 0
6:25
2001
0.67
06/2
2 @
17:
150.
8705
/19
@ 1
9:55
1.04
05/1
9 @
20:
051.
1306
/22
@ 1
9:00
1.16
06/2
2 @
19:
551.
3209
/24
@ 1
2:20
1.60
03/2
9 @
18:
201.
9303
/29
@ 1
9:00
2002
0.92
07/2
4 @
18:
001.
2507
/24
@ 1
8:10
1.44
08/1
6 @
23:
351.
8808
/31
@ 0
9:00
2.44
08/3
1 @
09:
302.
9608
/31
@ 1
1:30
3.51
08/3
1 @
16:
453.
7109
/01
@ 0
0:30
2003
1.06
08/0
5 @
17:
001.
3005
/27
@ 0
0:00
1.71
06/0
7 @
20:
552.
7806
/07
@ 2
1:50
3.97
06/0
7 @
22:
504.
0206
/08
@ 0
1:35
4.21
06/0
7 @
22:
555.
7306
/07
@ 2
2:55
2004
0.93
07/1
7 @
23:
101.
5507
/17
@ 2
3:15
2.28
07/1
7 @
23:
203.
5307
/17
@ 2
3:20
3.58
07/1
7 @
23:
353.
5907
/17
@ 2
3:35
4.38
09/2
8 @
02:
455.
0009
/28
@ 0
7:55
CR
N24
, USG
S St
atio
n 02
1426
51, M
cDow
ell C
reek
at W
estm
orel
and
Roa
d ne
ar C
orne
lius
1995
0.96
07/0
6 @
21:
551.
2607
/06
@ 2
2:05
1.28
07/0
6 @
22:
101.
6205
/10
@ 0
2:05
1.66
05/1
0 @
02:
402.
5410
/04
@ 1
3:15
2.92
10/0
4 @
16:
453.
5808
/27
@ 1
6:30
1995
n/c
n/c
n/c
n/c
n/c
n/c
n/c
n/c
n/c
n/c
n/c
n/c
n/c
n/c
3.46
02/1
6 @
21:
3019
960.
9308
/26
@ 1
5:00
1.08
07/2
5 @
17:
551.
6107
/25
@ 1
8:00
1.82
07/2
5 @
18:
501.
8907
/25
@ 1
9:50
2.47
08/1
2 @
00:
502.
7808
/12
@ 0
4:05
3.12
08/1
2 @
15:
4519
970.
6107
/23
@ 0
4:30
0.90
07/2
3 @
04:
451.
6407
/23
@ 0
5:15
1.99
07/2
3 @
06:
102.
6407
/23
@ 0
7:10
3.22
07/2
3 @
08:
054.
2407
/23
@ 0
8:35
4.53
07/2
3 @
22:
2519
970.
5208
/04
@ 1
8:25
0.70
04/2
8 @
19:
251.
0704
/28
@ 2
0:05
1.63
04/2
8 @
20:
551.
6604
/28
@ 2
1:05
1.94
09/2
4 @
15:
252.
9209
/24
@ 1
7:45
3.16
09/2
5 @
04:
3519
980.
4508
/09
@ 1
8:05
0.56
08/0
9 @
18:
150.
6004
/17
@ 0
4:05
0.81
04/1
7 @
04:
250.
9104
/17
@ 0
5:25
1.27
09/0
3 @
19:
301.
7209
/04
@ 0
0:00
1.86
09/0
4 @
03:
3519
990.
4209
/28
@ 1
5:10
0.64
09/2
8 @
15:
200.
8109
/28
@ 1
5:50
1.21
07/2
4 @
17:
501.
3710
/11
@ 0
4:00
1.80
10/1
1 @
05:
352.
0010
/11
@ 0
5:35
3.01
10/1
1 @
06:
0520
001.
9007
/07
@ 0
1:30
2.71
07/0
7 @
01:
403.
2807
/07
@ 0
2:05
3.29
07/0
7 @
02:
153.
2907
/07
@ 0
2:15
3.30
07/0
7 @
04:
253.
3007
/07
@ 0
4:25
3.30
07/0
7 @
04:
2520
010.
8607
/05
@ 1
8:30
1.18
06/2
2 @
16:
151.
4106
/22
@ 1
6:20
1.49
06/2
2 @
16:
351.
5206
/22
@ 1
7:55
1.60
09/2
4 @
12:
051.
8709
/24
@ 1
2:05
1.99
03/2
9 @
19:
2020
021.
2507
/24
@ 1
7:05
1.99
07/2
4 @
17:
152.
3607
/24
@ 1
7:40
2.41
07/2
4 @
18:
402.
5007
/24
@ 1
9:35
2.54
07/2
4 @
20:
352.
5407
/24
@ 2
0:35
2.67
07/2
5 @
11:
4520
030.
7105
/31
@ 1
4:40
1.05
09/2
2 @
22:
151.
3909
/22
@ 2
2:30
1.87
09/2
2 @
22:
252.
3909
/23
@ 0
0:40
3.17
09/2
3 @
00:
453.
2509
/23
@ 0
1:00
3.46
05/2
2 @
18:
4520
040.
7008
/31
@ 1
3:15
1.07
07/2
7 @
01:
351.
4607
/27
@ 0
1:35
1.81
07/2
7 @
02:
301.
8807
/27
@ 0
2:45
2.17
09/2
8 @
02:
552.
8309
/28
@ 0
6:30
3.23
09/0
8 @
06:
15
Table 2 �1
Tabl
e 2.
An
nual
max
imum
pre
cipi
tatio
n to
tals
thro
ugh
Dece
mbe
r 200
4 fo
r sel
ecte
d du
ratio
ns a
t sel
ecte
d U.
S. G
eolo
gica
l Sur
vey
prec
ipita
tion
site
s in
Mec
klen
burg
Cou
nty,
N
orth
Car
olin
a. —
Con
tinue
d[n
/c, n
o ch
ange
; USG
S, U
.S. G
eolo
gica
l Sur
vey;
N/A
, not
ava
ilabl
e; S
R, s
econ
dary
road
. Ann
ual m
axim
um p
reci
pita
tion
tota
ls w
ere
com
pute
d by
usi
ng d
ata
thro
ugh
the
2004
cal
enda
r yea
r, w
hich
is c
onsi
sten
t with
th
e an
nual
per
iod
used
in o
ther
pre
cipi
tatio
n-fr
eque
ncy
stud
ies.
For a
ll si
tes,
annu
al p
reci
pita
tion
tota
ls a
re sh
own
twic
e fo
r 199
5 an
d 19
97. T
he sh
aded
blu
e va
lues
for 1
995
and
1997
are
max
imum
tota
ls e
xclu
ding
th
e st
orm
s in
Aug
ust 1
995
and
July
199
7, re
spec
tivel
y, th
at re
sulte
d in
maj
or fl
oodi
ng a
cros
s are
as o
f Cha
rlotte
and
Mec
klen
burg
Cou
nty.
Whe
re e
xclu
sion
of t
he A
ugus
t 199
5 an
d Ju
ly 1
997
stor
m d
ata
does
not
resu
lt in
diff
eren
t sto
rm to
tals
, val
ues a
re d
enot
ed a
s “n/
c” a
nd th
e pr
ecip
itatio
n an
d da
te/ti
me
valu
es a
re th
e sa
me
as th
ose
show
n in
the
row
s lis
ted
abov
e th
e “n
/c”
desi
gnat
ion.
Val
ues d
enot
ed a
s “N
/A”
wer
e re
mov
ed fr
om
anal
ysis
follo
win
g an
ass
essm
ent o
f mis
sing
uni
t-val
ue d
ata]
Year
15 m
inu
tes
30 m
inu
tes
1 h
ou
r (6
0 m
inu
tes)
2 h
ou
rs
(120
min
ute
s)3
ho
urs
(1
80 m
inu
tes)
6 h
ou
rs
(360
min
ute
s)12
ho
urs
(7
20 m
inu
tes)
24 h
ou
rs
(1,4
40 m
inu
tes)
Dep
th,
inch
es
Dat
e an
d
du
rati
on
per
iod
en
din
g
Dep
th,
inch
es
Dat
e an
d
du
rati
on
per
iod
en
din
g
Dep
th,
inch
es
Dat
e an
d
du
rati
on
per
iod
en
din
g
Dep
th,
inch
es
Dat
e an
d
du
rati
on
per
iod
en
din
g
Dep
th,
inch
es
Dat
e an
d
du
rati
on
per
iod
en
din
g
Dep
th,
inch
es
Dat
e an
d
du
rati
on
per
iod
en
din
g
Dep
th,
inch
es
Dat
e an
d
du
rati
on
per
iod
en
din
g
Dep
th,
inch
es
Dat
e an
d
du
rati
on
per
iod
en
din
g
CR
N25
, USG
S St
atio
n 02
1426
6075
, Gar
Cre
ek a
t SR
212
0 (M
cCoy
Roa
d) n
ear
Oak
dale
1995
0.88
07/1
6 @
16:
051.
0910
/20
@ 2
0:30
1.32
07/1
6 @
16:
501.
4910
/27
@ 2
0:45
1.56
10/2
7 @
21:
352.
1108
/27
@ 0
8:35
3.03
08/2
7 @
09:
154.
1208
/27
@ 1
6:15
1995
n/c
n/c
n/c
n/c
n/c
n/c
n/c
n/c
n/c
n/c
2.00
10/0
4 @
13:
052.
4010
/04
@ 1
5:55
2.61
10/0
5 @
02:
4519
960.
7409
/04
@ 0
6:25
1.29
06/1
9 @
23:
302.
2006
/19
@ 2
3:35
2.56
06/2
0 @
00:
302.
7206
/20
@ 0
1:30
2.80
06/2
0 @
03:
152.
9008
/12
@ 0
4:05
3.41
08/1
2 @
16:
2019
970.
5107
/23
@ 0
2:00
0.77
07/2
3 @
02:
101.
1007
/23
@ 0
7:30
1.59
07/2
3 @
03:
402.
3607
/23
@ 0
4:25
3.82
07/2
3 @
04:
355.
3207
/23
@ 0
9:30
5.53
07/2
3 @
22:
2519
970.
4309
/09
@ 1
9:10
0.57
02/2
8 @
13:
250.
8002
/28
@ 1
3:30
0.98
10/2
6 @
11:
501.
3210
/26
@ 1
2:05
2.25
09/2
4 @
14:
103.
7509
/24
@ 1
7:25
3.94
09/2
5 @
05:
1519
980.
7007
/16
@ 1
2:50
1.17
07/1
6 @
13:
051.
3607
/16
@ 1
3:20
1.36
07/1
6 @
13:
201.
3607
/16
@ 1
3:20
1.52
09/0
3 @
19:
152.
1009
/04
@ 0
0:20
2.42
09/0
4 @
04:
2519
991.
0109
/28
@ 1
4:30
1.52
09/2
8 @
14:
401.
5809
/28
@ 1
5:00
1.59
09/2
8 @
16:
051.
5909
/28
@ 1
5:00
1.68
10/1
0 @
16:
252.
2409
/29
@ 0
0:15
3.70
10/1
1 @
07:
3020
000.
7908
/03
@ 2
2:55
1.23
08/0
3 @
23:
101.
5707
/07
@ 0
2:25
1.64
07/0
7 @
03:
151.
6407
/07
@ 0
3:15
1.65
07/0
7 @
05:
051.
6507
/07
@ 0
5:05
1.65
07/0
7 @
05:
0520
010.
8105
/22
@ 1
5:00
1.17
05/2
2 @
15:
101.
2505
/22
@ 1
5:35
1.33
05/2
2 @
16:
251.
3305
/22
@ 1
6:25
1.48
03/2
9 @
18:
101.
8703
/29
@ 1
8:25
2.12
03/2
9 @
20:
3520
020.
7506
/06
@ 1
7:45
1.12
06/0
6 @
18:
001.
3508
/16
@ 1
9:05
1.84
06/0
6 @
19:
301.
9206
/06
@ 2
0:20
2.57
10/1
1 @
06:
402.
6310
/11
@ 0
9:25
2.63
10/1
1 @
09:
2520
030.
7807
/13
@ 1
7:40
1.13
07/1
3 @
17:
551.
5907
/13
@ 1
8:25
2.97
07/1
3 @
19:
253.
0807
/13
@ 2
0:00
3.09
07/1
3 @
20:
203.
2005
/22
@ 1
3:00
4.49
07/1
3 @
20:
2020
040.
9906
/14
@ 1
7:25
1.25
06/1
4 @
17:
351.
3806
/14
@ 1
7:55
1.64
09/0
7 @
14:
051.
9209
/27
@ 2
3:30
2.50
09/2
8 @
00:
003.
0309
/07
@ 2
2:15
4.09
09/0
8 @
06:
05
CR
N26
, Bra
dfor
d A
irfie
ld, H
unte
rsvi
lle-C
onco
rd R
oad
(Hun
ters
ville
)
1995
N/A
N/A
N/A
N/A
N/A
N/A
N/A
N/A
N/A
N/A
N/A
N/A
N/A
N/A
N/A
N/A
1995
0.75
07/0
6 @
22:
051.
0607
/27
@ 1
7:45
1.29
10/2
7 @
19:
501.
5410
/27
@ 2
0:50
1.59
10/2
7 @
21:
251.
8510
/27
@ 2
1:05
2.19
10/0
4 @
16:
302.
6602
/16
@ 2
1:40
1996
0.91
08/0
9 @
17:
001.
7208
/09
@ 1
7:10
1.92
08/0
9 @
17:
201.
9308
/09
@ 1
7:45
1.93
08/0
9 @
17:
451.
9308
/09
@ 1
7:45
1.93
08/0
9 @
17:
452.
1908
/12
@ 1
9:25
1997
0.80
07/2
3 @
07:
501.
1907
/23
@ 0
8:00
1.88
07/2
3 @
08:
002.
4807
/23
@ 0
8:40
2.64
07/2
3 @
04:
404.
9907
/23
@ 0
8:00
6.69
07/2
3 @
09:
056.
8607
/23
@ 2
1:55
1997
0.61
06/0
2 @
13:
000.
6406
/02
@ 1
3:10
0.77
04/2
2 @
01:
201.
2204
/28
@ 2
1:05
1.29
09/2
4 @
13:
552.
4109
/24
@ 1
4:15
3.69
09/2
4 @
17:
403.
9109
/25
@ 0
4:45
1998
0.86
08/0
8 @
18:
251.
3108
/08
@ 1
8:35
1.42
05/3
0 @
13:
301.
5205
/30
@ 1
4:05
1.52
05/3
0 @
14:
051.
5205
/30
@ 1
4:05
1.96
09/0
4 @
00:
102.
2709
/04
@ 0
5:15
1999
0.43
09/2
8 @
14:
400.
6309
/28
@ 1
4:55
0.81
01/2
3 @
14:
400.
9701
/23
@ 1
5:20
1.14
10/1
1 @
05:
001.
5910
/11
@ 0
5:45
1.80
10/1
1 @
05:
503.
2310
/11
@ 0
6:30
2000
0.55
08/0
3 @
22:
550.
9508
/03
@ 2
3:10
1.21
08/0
3 @
23:
201.
3108
/03
@ 2
3:30
1.72
08/0
4 @
01:
151.
8008
/04
@ 0
1:15
1.80
08/0
4 @
01:
152.
1809
/23
@ 0
6:15
2001
1.06
07/0
5 @
18:
501.
2307
/05
@ 1
8:55
1.23
07/0
5 @
18:
551.
2307
/05
@ 1
8:55
1.24
07/0
5 @
21:
251.
5609
/04
@ 1
1:05
1.76
03/2
9 @
19:
202.
2609
/04
@ 1
0:05
2002
0.88
07/0
3 @
17:
501.
0307
/24
@ 1
7:40
1.11
07/2
4 @
17:
551.
6806
/06
@ 1
9:40
1.84
06/0
6 @
20:
402.
2610
/11
@ 0
6:55
2.40
10/1
1 @
08:
002.
4110
/11
@ 0
8:00
2003
1.13
08/0
7 @
18:
001.
3808
/07
@ 1
8:05
1.55
08/0
7 @
18:
302.
1409
/22
@ 2
3:10
2.50
09/2
2 @
23:
302.
9609
/23
@ 0
0:30
3.08
05/2
2 @
13:
204.
0405
/22
@ 1
3:30
2004
1.21
09/2
7 @
22:
501.
5309
/27
@ 2
3:00
1.83
09/2
7 @
23:
052.
2609
/28
@ 0
0:05
2.67
09/2
8 @
00:
003.
9409
/28
@ 0
3:00
4.72
09/2
8 @
06:
155.
1909
/28
@ 0
7:35
�2 Frequency of Annual Maximum Precipitation in the City of Charlotte and Mecklenburg County, NC, through 2004