FRESH MARKET TOMATO 2003 Variety & Disease Control Trials In San Joaquin and Stanislaus Counties Including Results From THE STATEWIDE FRESH MARKET TOMATO COMBINED VARIETY TRIALS University of California Cooperative Extension 420 S. Wilson Way Stockton, CA 95205
Transcript
FRESH MARKET TOMATO
2003
Variety & Disease Control Trials In San Joaquin and Stanislaus
Counties
Including Results From THE STATEWIDE FRESH MARKET TOMATO
COMBINED VARIETY TRIALS
University of California Cooperative Extension
420 S. Wilson Way Stockton, CA 95205
2003 SAN JOAQUIN AND STANISLAUS COUNTIES
FRESH MARKET TOMATO VARIETY AND DISEASE CONTROL TRIALS
Conducted by: Bob Mullen, UCCE Farm Advisor, San Joaquin County
and Dr. Jan Mickler, UCCE Farm Advisor, Stanislaus
Contributing Authors:
Marita Cantwell de Trejo, Extension Postharvest Specialist, UC Davis Don Colbert, Extension Field Assistant, San Joaquin County
Scott Whiteley, Extension Field and Laboratory Technician, San Joaquin County Nick Prichard, Student Assistant, San Joaquin County
The need to find fresh market tomato varieties with disease and nematode resistance, as well as improved horticultural characteristics (fruit size, firmness, color, smoothness, easy stemming or jointless stems, small blossom and stem scars, less fruit cracking and better flavor), along with yield potential, continues to be of great importance to fresh market tomato growers and shippers in both San Joaquin and Stanislaus Counties. Contributing to this increased need is the fact that all of the suitable ground for tomatoes has been cropped to either fresh market or processing tomatoes at one time or another over the years and particularly over the past few seasons. Resistance of varieties to both Races 1 and 2 Fusarium wilt is very common. Virtually all lines have resistance to Race 1 of Verticillium wilt, but there is no known resistances to Verticillium wilt Race 2. Presence of the disease in local fresh market tomato fields has been limited but is increasing. Potential loss of soil fumigation materials has caused seed breeders to develop nematode resistance in most of their newer lines. Many of the newer lines also possess tobacco mosaic, Alternaria and Stemphyllim resistance, and a few have bacterial speck resistance. Additional concerns by growers and shippers relate to effective management of powdery mildew and Phytophthora late blight, particularly with anticipated and actual losses of fungicides due to recent and proposed legislation, as well as current pathogen resistance to some existing fungicides. Possible loss of certain insecticides increased the need for varietal resistance efforts in this area. Insect resistance to insecticides is a continuing concern as well. Another source of concern to growers is the nagging uncertainty of an adequate labor force to harvest the crop. Acreage in the San Joaquin-Stanislaus district has stabilized, after increasing dramatically over the past few years. Interest is high in developing varieties that will retain good horticultural and yield characteristics and yet lend themselves to hand picking and/or mechanical harvest. With this in mind, a number of varieties from private seed company breeding programs have been evaluated for both jointless or “arthritic” stem characteristics. The bottom line in varietal development and acceptance revolves around having cultivars that yield and ship well enough to offset increased production costs, while providing the quality and flavor characteristics buyers and consumers demand.
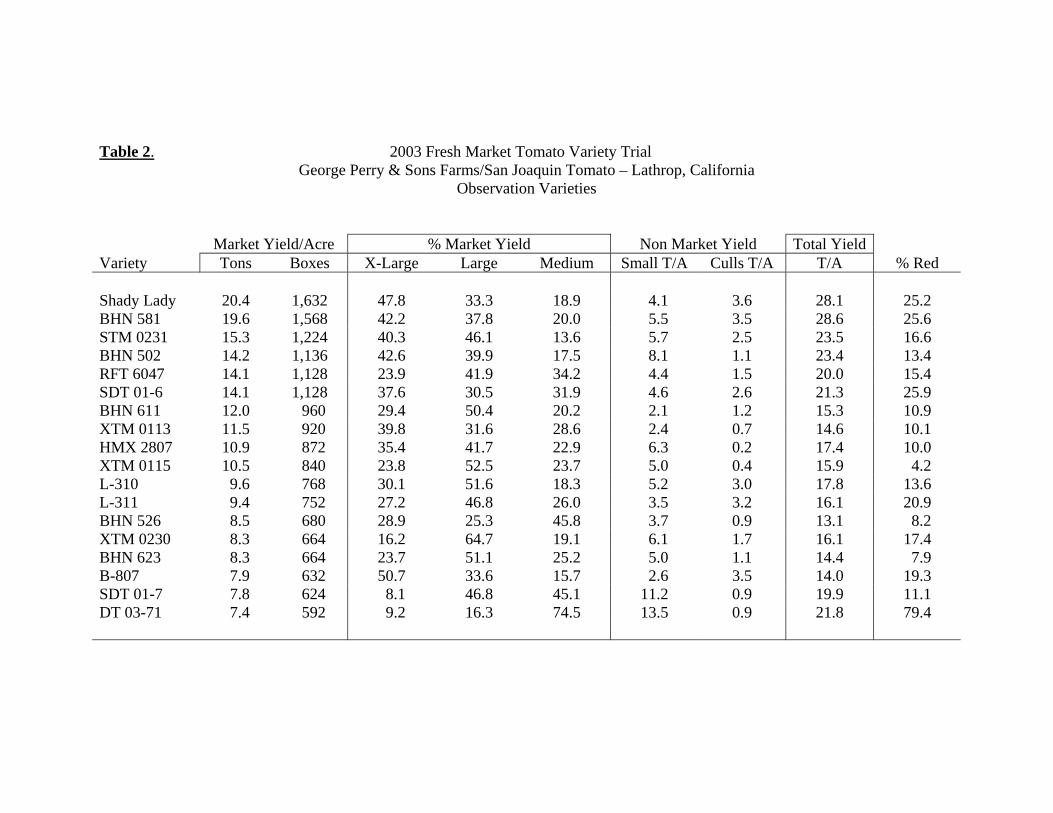
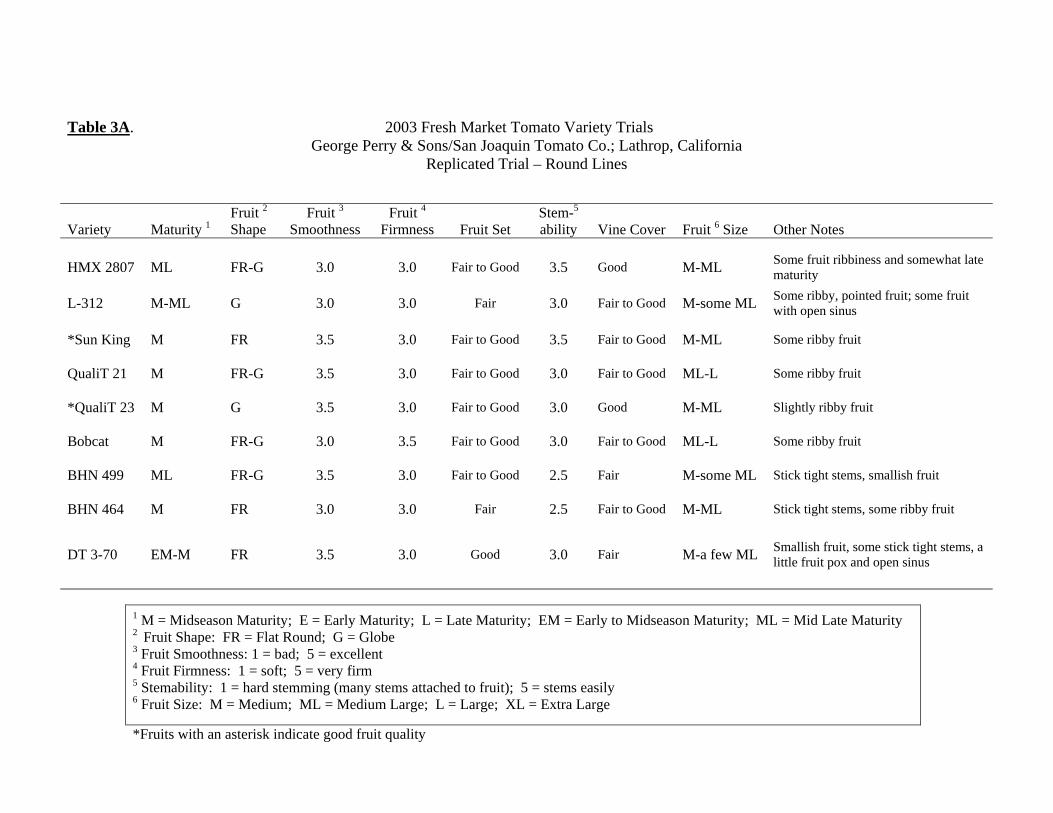
2003 Variety Trials During 2003, two fresh market tomato variety trials (one with standard commercial Round lines and the other with commercial “Roma-type” cultivars) were cooperatively conducted in the northern San Joaquin Valley with George Perry & Sons Farms (George Perry, Art Perry and Paul Gomes) and San Joaquin Tomato Co. (Tom Perez, Earl Perez and Charlie Duncan) near Lathrop, California on Stewart Tract. Additional monetary support for conducting the trials was provided by the California Tomato Commission and its President, Ed Beckman, and Research Coordinator, John Le Boeuf, as well as the participating seed companies. Input from the field managers of a number of fresh market shippers in the San Joaquin Valley on selection of varieties evaluated in the trials was most appreciated. The trial of Round varieties contained 9 replicated lines with an additional 19 cultivars in single replication observation plots. The “”Roma-type” trial contained 6 replicated lines with another 6 varieties in observation. Transplants for both trials were produced by Craven Transplants (Todd Craven) near Crows Landing, California. The field variety at the trial site was Bobcat. Both trials were transplanted on June 16, 2003 under very hot climatic conditions. The heat, coupled with some planter problems not providing sufficient water to the plants as they were field set, resulted in considerable crop stand loss in some plots; furrow irrigation of the trial followed about 8 days later. The soil type at the trial field was a Columbia fine sandy loam/silty clay loam mix. Despite the stand loss early vine growth was good but persistent high temperatures during July resulted in the loss of fruit set with many of the varieties in both trials, but particularly in the “Roma-type” trial. Periods of water stress coupled with the heat, caused a lot of Blossom End Rot to develop in fruit of the “Roma trial, severely reducing yield potential. The trials were hand harvested on 9/15/03 and 9/16/03. Some worm damage occurred in fruit of the “Roma” varieties, but only minimally so in the Round lines. Complete data on yield and fruit size for the Replicated Round varieties are given in Table 1. The best yield of marketable red and green fruit was achieved by Bobcat at 14.6 tons/acre, followed by QualiT 21 (14.2 tons/acre), L-312 (14.0 tons/acre), Sun King (12.0 tons/acre) and QualiT 23 (11.9 tons/acre). Fruit size was large to extra large for most replicated varieties in the trail. In the single replication Observation Round variety block, the highest yield of marketable red and green fruit occurred with Shady Lady at 20.4 tons/acre, followed by BHN 581 (19.6 tons/acre), STM 0231 (15.3 tons/acre), BHN 502 (14.2 tons/acre) and RFT 6047 and SDT 01-6, both at 14.1 tons/acre. As with the replicated trial most observation lines had predominately large and extra large size fruit. Table 2 provides complete yield and fruit sizing data for Round lines in the observation block. Fruit quality characteristics such as crop maturity, fruit shape and size, fruit smoothness, fruit set and firmness, stemability of fruit, along with observations on vine cover and other notes are provided on Table 3A for the Replicated Round varieties and Table 3B for the Observation Round lines. In the “Roma-type” fresh market tomato trial, due to the aforementioned problems of heat and water stress, yields were considerable lower than previous years of trials, and fruit size was also smaller. Cullage of fruit with Blossom End Rot was quite high in both replicated and observation “Roma”
lines. The best yield of marketable red and green fruit in the Replicated “Roma” block was attained by Miroma at 9.62 tons/acre, followed by SD 257 (8.40 tons/acre), BHN 621 (8.38 tons/acre) and BHN 523 (8.33 tons/acre). Yield, crop maturity and fruit sizing data are presented in Table 4. In the Observation “Roma” trial area, the best yield of marketable red and green fruit was achieved by HA 3816 (8.1 tons/acre), HA 3817 (7.00 tons/acre) and HA 382 (6.00 tons/acre). Table 5 gives data on yield, crop maturity and fruit size for all the lines evaluated in the “Roma” observation block. Observations on crop maturity, fruit shape, fruit smoothness and firmness, fruit set and size, stemability of fruit, along with notes on vine cover and other variety comments are show in Table 6A and Table 6B for both the replicated and observation “Roma-type” cultivars in the trial. From the standpoint of overall fruit quality, the leading Round replicated lines were Sun King and QualiT 23, while the best Round observational varieties were Shady Lady, BHN 581 and BHN 611. Best overall fruit quality in the “Roma-type” replicated trial was attained by Miroma, Mariana and BHN 621, while in the observation Roma trial, the best fruit quality cultivars were HA 3816 and HA 3817. A comprehensive report by Marita Cantwell, Extension Postharvest Specialist at UC Davis, on postharvest evaluation of fruit form replicated lines and selected observation cultivars in the four variety trials (three Round and one Roma) that were conducted this year by farm advisors in Tulare/Kings, Merced and San Joaquin/Stanislaus Counties is available at our office by request. Factors such as fruit color, firmness, soluble solids (°Brix), titrateable acidity and fruit composition at the mature green and vine-ripe stage of maturity were evaluated.
MANY THANKS
Many thanks to George Perry, Art Perry and Paul Gomes (George Perry & Sons Farms) and Tom Perez, Earl Perez and Charlie Duncan (San Joaquin Tomato Co.) for their participation and cooperation in the two variety trials. Much appreciation is also expressed to David and Robert Celli (Celli Brothers Farms), Tom Guido and Nate and Joe Esformes (Triple “E” Produce) and Joe Schenone (Western Farm Service) for their help and guidance in the conduct of the fresh market tomato powdery mildew control trial north of Thornton, California in 2003. Thanks also to Ed Beckman and John Le Boeuf and the other members of the California Tomato Commission Research Committees for their continued support of variety evaluation and pest management research. Thanks also to Marita Cantwell (UC Cooperative Extension Postharvest Specialist at UC Davis) and her crew for their continued and tireless help in postharvest evaluation of the fruit from many of the cultivars tested in the variety trials. Also, a special thanks to Michelle Le Strange (Farm Advisor in Tulare and Kings Counties) for the outstanding Statewide Combined Variety Trial report she prepared. It took a great deal of time to combine the data from the three Round variety trials conducted in 2003 in the San Joaquin Valley and to statistically analyze the results. Finally, thanks also to the participating seed companies for providing the basic materials for the trials as well as their continued financial support to the UC Farm Advisor Statewide Fresh Market Tomato Variety Evaluation project.
George Perry & Sons/San Joaquin Tomato Co.; Lathrop, California Replicated Trial – Round Lines
Variety Maturity 1 Fruit 2 Shape
Fruit 3 Smoothness
Fruit 4 Firmness Fruit Set
Stem-5
ability Vine Cover Fruit 6 Size Other Notes
HMX 2807 ML FR-G 3.0 3.0 Fair to Good 3.5 Good M-ML Some fruit ribbiness and somewhat late maturity
L-312 M-ML G 3.0 3.0 Fair 3.0 Fair to Good M-some ML Some ribby, pointed fruit; some fruit with open sinus
*Sun King M FR 3.5 3.0 Fair to Good 3.5 Fair to Good M-ML Some ribby fruit
QualiT 21 M FR-G 3.5 3.0 Fair to Good 3.0 Fair to Good ML-L Some ribby fruit
*QualiT 23 M G 3.5 3.0 Fair to Good 3.0 Good M-ML Slightly ribby fruit
Bobcat M FR-G 3.0 3.5 Fair to Good 3.0 Fair to Good ML-L Some ribby fruit
BHN 499 ML FR-G 3.5 3.0 Fair to Good 2.5 Fair M-some ML Stick tight stems, smallish fruit
BHN 464 M FR 3.0 3.0 Fair 2.5 Fair to Good M-ML Stick tight stems, some ribby fruit
DT 3-70 EM-M FR 3.5 3.0 Good 3.0 Fair M-a few ML Smallish fruit, some stick tight stems, a little fruit pox and open sinus
1 M = Midseason Maturity; E = Early Maturity; L = Late Maturity; EM = Early to Midseason Maturity; ML = Mid Late Maturity 2 Fruit Shape: FR = Flat Round; G = Globe 3 Fruit Smoothness: 1 = bad; 5 = excellent 4 Fruit Firmness: 1 = soft; 5 = very firm 5 Stemability: 1 = hard stemming (many stems attached to fruit); 5 = stems easily 6 Fruit Size: M = Medium; ML = Medium Large; L = Large; XL = Extra Large
*Fruits with an asterisk indicate good fruit quality
Table 3B. 2003 Fresh Market Tomato Variety Trials George Perry & Sons/San Joaquin Tomato Co.; Lathrop, California
Observation Trial – Round Lines
Variety Maturity 1 Fruit 2 Shape
Fruit 3 Smoothness
Fruit 4 Firmness Fruit Set
Stem-5
ability Vine Cover Fruit 6 Size Other Notes
HMX 2807 ML FR-G 3.0 3.0 Good 3.5 Good M-L Some fruit ribbiness, somewhat late maturity
L-310 M FR 3.0 3.0 Fair to Good 3.0 Fair to Semi-Open M Lot of powdery mildew, some small & ribby fruit
L-311 M FR-G 3.0 3.5 Fair to Good 3.0 Fair to Good M-L Some ribby fruit
B-807 EM-M FR-G 3.0 3.0 Fair 3.0 Fair to Semi-Open M- a few ML Lot of ribby fruit
RFT 6047 ML FR 3.0 3.0 Fair to Good 2.5 Fair M-L Some stick tight stems and some ribby fruit
XTM 0113 M-ML FR 3.0 3.0 Fair to Good 2.5 Fair to Good M-L Some stick tight stems; some ribby, open-sinus fruit
XTM 0115 ML FR-G 3.0 3.0 Fair to Good 2.5 Good M-some ML Some stick tight stems
XTM 0230 ML FR 3.0 3.5 Fair to Good 2.5 Good M-some ML Some stick tight stems and ribby fruit
STM 0231 M FR 3.0 3.0 Fair 2.5 Fair to Good M-some ML Some stick tight stems and ribby fruit
BHN 502 M FR 3.0 3.0 Fair to Good 3.0 Fair to Good M-L Some ribby fruit
BHN 526 L FR-G 3.0 3.0 Fair 3.0 Fair M-a few L Some ribby and open sinus fruit; poor stand
*BHN 581 EM-M FR-G 3.0 3.5 Good 3.0 Fair M-L Some ribby fruit
*BHN 611 M FR-G 3.5 3.5 Fair to Good 3.0 Fair to Good M-ML Some ribby and pointy fruit
BHN 623 ML-L FR-G 3.0 3.0 Fair to Good 2.5 Fair M-ML Some stick tight stems and ribby fruit, late maturity
DT 03-71 EM FR 3.5 3.5 Good 3.0 Fair to Good S-M Small fruit, green shoulder, smooth fruit
SDT 01-7 ML FR 3.0 3.0 Good 3.0 Fair to Good S-M Small ribby fruit, green shoulder, poor stand
SDT 01-6 M FR 3.0 3.0 Fair to Good 3.0 Good M Some stick tight stems, some ribby fruit
*Shady Lady EM-M FR 3.0 3.5 Good 3.5 Good M-L Some ribby fruit and a few fruit with open sinus
1 M = Midseason Maturity; E = Early Maturity; L = Late Maturity; EM = Early to Midseason Maturity; ML = Mid Late Maturity 2 Fruit Shape: FR = Flat Round; G = Globe 3 Fruit Smoothness: 1 = bad; 5 = excellent 4 Fruit Firmness: 1 = soft; 5 = very firm 5 Stemability: 1 = hard stemming (many stems attached to fruit); 5 = stems easily 6 Fruit Size: S = Small; M = Medium; ML = Medium Large; L = Large; XL = Extra Large
*Fruits with an asterisk indicate good fruit quality
2003 Fresh Market Tomato Varieties
“Roma” Lines Seed Company Replicated Observation
BHN Seed BHN 523 BHN 621
Hazera Seeds HA 3816 HA 3817 HA 3821
LSL Plant Science SD 257 SD 256
Sakata Seed Monica Mariana
Syngenta Miroma Supra
United Genetics UG 8105
Table 4. 2003 Fresh Market Tomato “Roma” Variety Trial George Perry & Sons Farms/San Joaquin Tomato – Lathrop, California
“Roma” Sizing Criteria: Extra Large > 165 grams; Large 130 to 165 grams; Medium 90 to 130 grams; Small 50 to 90 grams
Table 5. 2003 Fresh Market Tomato “Roma” Variety Trial George Perry & Sons Farms/San Joaquin Tomato – Lathrop, California
Observation Varieties
Market Yield/Acre % Market Yield Non Market Yield Total Yield Variety Tons Boxes X-Large Large Medium Small Immature T/A Culls T/A T/A % Red HA 3816 8.10 648 0.0 5.7 58.2 36.1 10.0 2.7 20.8 25.1 HA 3817 7.00 560 0.0 0.0 35.2 64.8 7.5 1.3 15.8 26.3 HA 3821 6.00 480 10.6 11.4 36.8 41.2 6.1 1.3 13.4 18.2 SD 256 5.20 416 0.0 2.6 49.6 47.8 9.6 2.0 16.8 13.3 Supra 3.70 296 0.0 0.0 58.8 41.2 7.2 2.2 13.1 5.9 UG 8105 0.70 56 0.0 0.0 54.5 45.5 6.6 0.8 8.1 50.0
Roma Sizing Criteria: Extra Large > 165 grams; Large 130 to 165 grams; Medium 90 to 130 grams; Small 50 to 90 grams
2003 Fresh Market Tomato Variety Trials
George Perry & Sons/San Joaquin Tomato Co.; Lathrop, California Table 6A. Replicated Trial – “Roma” Lines
Variety Maturity 1 Fruit Shape Fruit 2
Smoothness Fruit 3
Firmness Fruit Set Stem-4
ability Vine Cover Fruit 5 Size Other Notes
SD 257 M Long Pear 3.5 3.0 Fair to Good 4.0 Semi-Open M-ML Blossom end rot and worm damaged fruit
*Miroma EM Long Pear 3.5 3.0 Fair to Good 3.5 Fair to Good M-ML Worm damaged fruit
Monica ML Blocky Long Pear 3.0 4.0 Fair to Good 4.0 Fair to Good M Blossom end rot and worm damage, some gold fleck and smallish fruit
*Mariana M Blocky Semi-Long Pear 3.5 3.5 Fair 4.0 Semi-Open M Some blossom end rot and worm damage,
smallish fruit
BHN 523 M Semi-Long Blocky Pear 3.5 3.5 Fair 4.0 Fair M-ML Blossom end rot and worm damage,
smallish fruit
*BHN 621 EM Semi-Long Blocky Pear 3.5 3.5 Fair to Good 4.0 Semi-Open M-ML Blossom end rot and worm damage,
smaller than normal fruit
Table 6B. Observation Trial – “Roma” Lines
Variety Maturity 1 Fruit Shape Fruit 2
Smoothness Fruit 3
Firmness Fruit Set Stem-4
ability Vine Cover Fruit 5 Size Other Notes
SD 256 M Elongated Blocky Pear 3.5 4.0 Fair 3.0 Fair M-ML Some worm damage, smallish fruit
*HA 3816 M-ML Blocky Pear 3.5 4.0 Fair to Good 4.0 Fair to Good M-ML Some worm damage, some nice fruit but somewhat late
*HA 3817 M Blocky Pear 3.0 3.5 Fair to Good 4.0 Fair to Good M-ML Some worm damage and ribby fruit, poor stand
HA 3821 ML Blocky Pear 3.0 3.5 Fair 4.0 Fair M-ML Somewhat late; light fruit set, some worm damage and fruit cracks
Supra ML Elongated Pear 3.5 3.5 Fair 4.0 Fair to Good S-M Somewhat late; some worm damage and fruit cracks, poor stand and small fruit
UG 8105 M-ML Square Round 3.0 4.0 Fair 4.0 Good S Somewhat late, small fruit, nontraditional fruit shape
1 M = Midseason Maturity; E = Early Maturity; L = Late Maturity; EM = Early to Midseason Maturity; ML = Mid Late Maturity 2 Fruit Smoothness: 1 = bad; 5 = excellent 3 Fruit Firmness: 1 = soft; 5 = very firm 4 Stemability: 1 = hard stemming (many stems attached to fruit); 5 = stems easily 5 Fruit Size: S = Small; M = Medium; ML = Medium Large; L = Large; XL = Extra Large
*Varieties marked with an asterisk indicate varieties with good to excellent fruit quality
Michelle Le Strange, Scott Stoddard, Bob Mullen, and Jan Mickler
Farm Advisors, Tulare & Kings, Merced & Madera, San Joaquin, and Stanislaus Counties
Introduction Fresh market tomato variety trials are con-ducted in major tomato-growing regions in California to evaluate the performance of new varieties and breeding lines from commercial plant breeder programs and universities. Vari-ety trials provide the opportunity to evaluate and compare fruit quality characteristics and yield under the same field conditions. It is important to test the varieties in several areas to assess performance under different climatic conditions and soils. The objective is to identify dependable, higher yielding and higher quality variety releases that can be grown over a wide geographic area under varying environmental conditions. To determine which varieties/lines are tested, growers/packers/shippers and seed company representatives are surveyed throughout the state. Replicated varieties have been previ-ously tested in grower fields in California. Observed lines usually represent the plant breeder’s most promising lines for California’s commercial growing conditions and markets. Trial Locations County farm advisors conduct the statewide variety trials in a uniform fashion so that local results can be compared with other locations. Three round variety trials and one roma variety trial were grown and harvested in commercial fields in 2003.
Kings County: April 16 - July 17 (92 days) with Jones Farms (O.P. Murphy & Sons) near Kettleman City
(Michelle Le Strange).
Merced County: May 13 - August 4 (83 days) with Live Oak Farms in LeGrand (Scott Stoddard).
San Joaquin County: June 16 - Sept.
15 (90 days) with George Perry & Sons (San Joaquin Tomato) on Stewart Tract; round and roma tomato variety trials (Bob Mullen and Jan Mickler).
Approximately 10 varieties were replicated and 13-27 lines/varieties were grown under single plot observation at each site, representing ten commercial seed companies. The three round tomato variety trials had 7 replicated and 15 observed (non-replicated) varieties in common. These are listed on the next page. Production results are presented in a series of tables which are described below. Postharvest samples from all replicated varieties were collected from all trials at the time of harvest and transported to the Mann Laboratory at UC Davis for color, firmness, and composition evaluations at the table-ripe stage. Fruit were harvested as mature greens, but some cultivars were also harvested as vine ripe. A complete summary of the postharvest results follows this field evaluation report. Each farm advisor prepares a research progress report that lists the production and postharvest performance of the varieties in their county location. These reports are mailed to the tomato industry and interested persons. They are available upon request and should be obtained and consulted with regard to variety performance in market yield, fruit sizing data, and fruit quality observations for that particular trial location.
Varieties in Common at Kings, Merced, and San Joaquin Counties 2003 Fresh Market Tomato Uniform Trials
Discussion Weather and growing conditions Kings County Trial – Cool weather early in the season slowed vegetative growth. Crown set was extremely good, but exceedingly hot weather in mid to late growth stages limited fruit set. Vines were pushed and grew wild and rank in part because later fruit set was affected by the hot weather. Merced County Trial – Hot weather prevailed from planting through harvest. Vines were medium in size. San Joaquin County Trial – Some stand problems were encountered at planting and hot temperatures affected crown set. Vines were small. Most fruit was set later in the growing season. Yields were extremely light and plots were skimpy at harvest. The summary tables are included as an aid to assess and compare performances among varieties at the different locations. In this report the same data is sorted and presented in many different ways. This is at the request of the California Tomato Commission, since individuals select a variety for different reasons. REPLICATED VARIETIES Market Yield – Tables 1, 1A, & Figure 1: Market yield of the seven replicated varieties ranged from 28.1 to 20.8 tons (2250 to 1663 boxes) per acre, a difference of 7.3 tons. (Last year in 2002 yields ranged from 31.5 to 27.3 tons per acre with a difference of 4.2 tons separating 11 replicated varieties.) The Least Significant difference (LSD) was 1.8 tons (140 boxes). The average marketable yield at all locations was 24.9 tons/acre (1992 boxes). The same seven varieties averaged 30.2 tons in Kings, 32.1 in Merced, and 12.4 tons per acre in San Joaquin County.
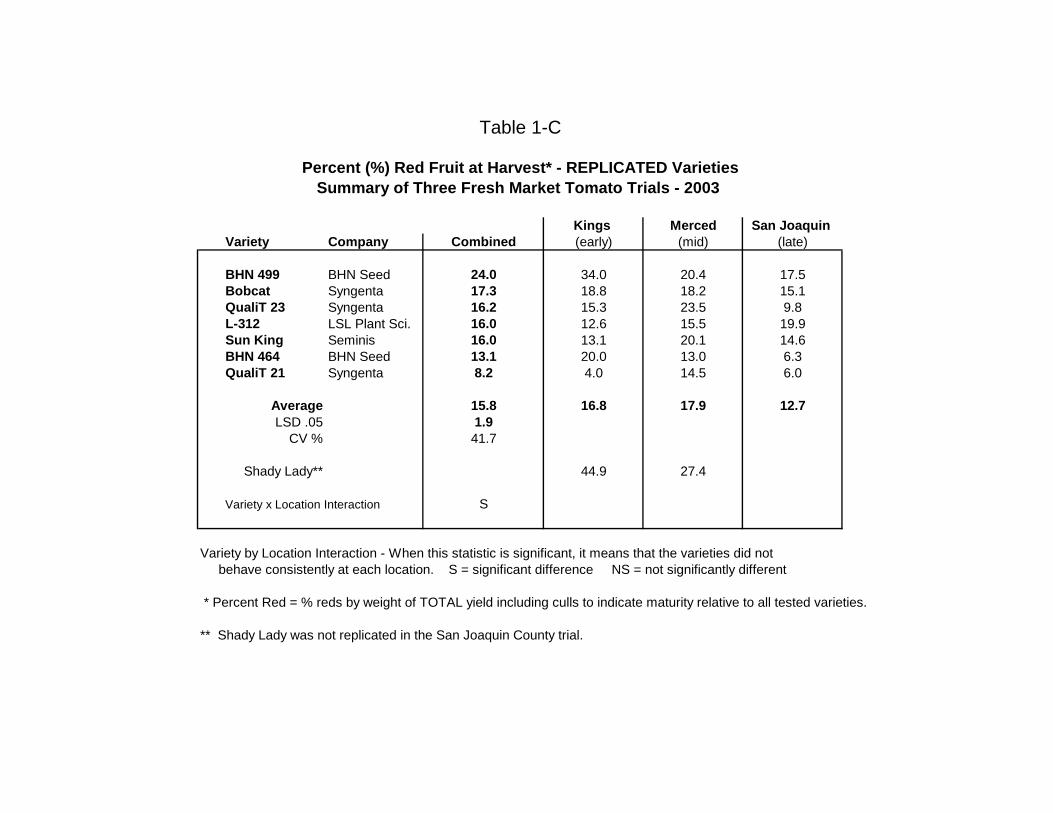
BHN 499 and Sun King yielded more marketable fruit than Bobcat and QualiT 21. All varieties exceeded the performance of BHN 464. Total Yield – Tables 1 and 1B: Total yield of the seven replicated varieties ranged from 39.7 to 30.8 tons per acre and averaged 34.3 tons (2745 boxes). Total yield includes all small sized and culled fruit. QualiT 23 was the only variety to change in rank. It placed lower in total yield but higher in marketable yield, indicating fewer fruit were small or culled compared to L-312 and Bobcat. BHN 499 was the top producer in both the Kings and Merced trial, whereas L-312 and Bobcat were the high yielders in the San Joaquin trial and BHN 499 was the lowest. QualiT 21 was the low performer in Kings county, whereas in previous years it has been a high yielding performer. There was little difference between varieties at the Merced trial. Shady Lady was only replicated in Kings and Merced where it had comparable yields to Sun King. Percent Reds – Table 1 and 1C: BHN 499 was the earliest of the seven varieties and QualiT 21 was the latest. Sun King, L-312, QualiT 23 and Bobcat were of the same maturity class. When Shady Lady is included in the comparison it is the earliest of all the tested varieties. Percent Size Grades- Table 1, 1D & Figure 1: The seven replicated varieties averaged 38-40-22% extra large, large, and medium size fruit. Kings county had significantly more extra large fruit and significantly fewer medium fruit than the other two trials, which reflected its high crown set yield and subsequent reduced fruit set yield as the season progressed. The San Joaquin County trial had a higher percentage of medium fruit reflecting that hot weather affected the crown set.
OBSERVED VARIETIES The observed varieties from each location were combined and analyzed as a replicated field trial. There was much variability within varieties between locations, so the results should be viewed with less confidence than replicated tests.
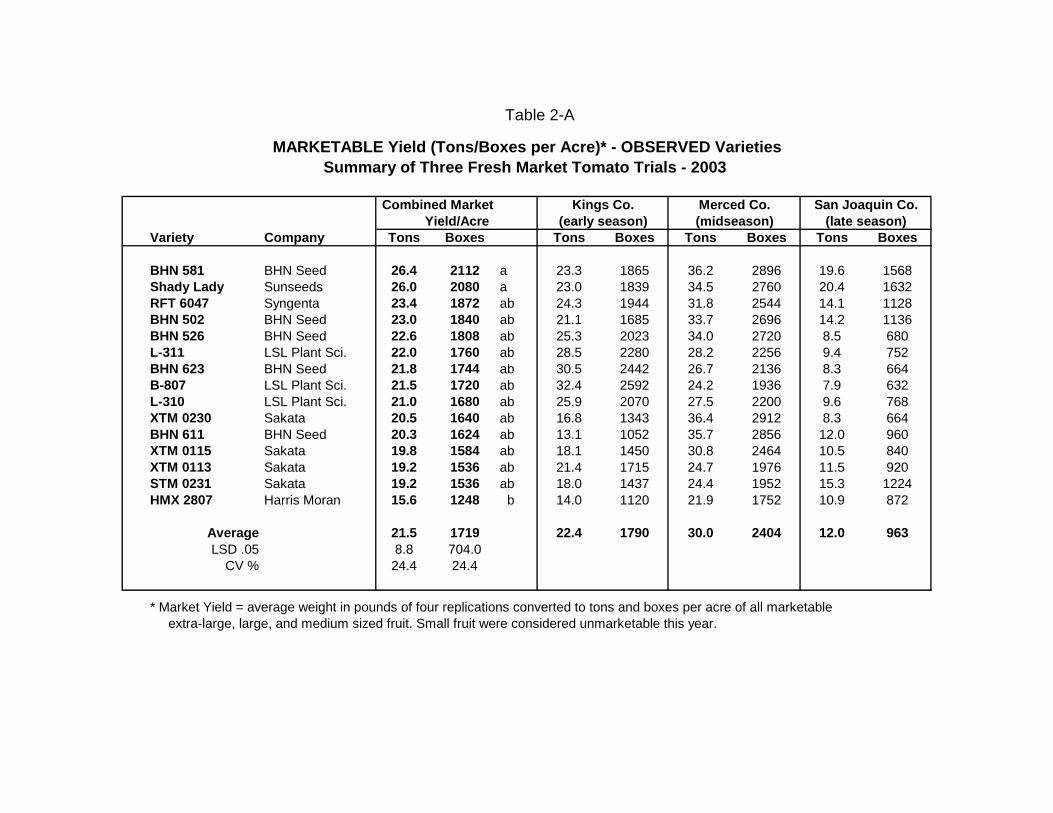
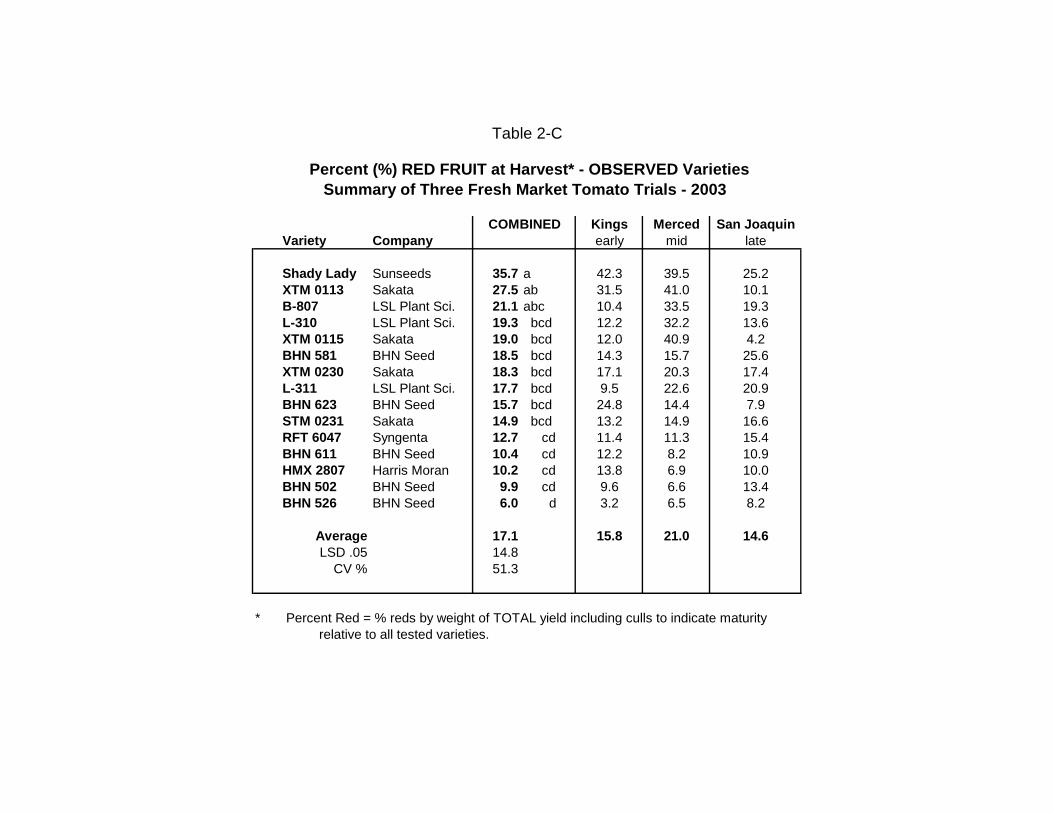
Market Yield – Table 2, 2A, & Figure 2: Market yield of the 15 observed varieties ranged from 26.4 tons (2112 boxes) to 15.6 tons (1238 boxes) and averaged 21.5 tons (1719 boxes) per acre. Because there is variability within varieties and only 3 locations (replications) statistics indicate that it takes an 8.8 ton difference to recognize a real market yield difference. Total Yield – Tables 2 and 2B: As in the replicated test small sizes and culled fruit accounted for approximately 10 tons of fruit per variety. Total yield ranged from 40.7 to 24.0 tons (3256 to 1920 boxes) per acre. BHN 623, XTM 0230, and STM 0231 ranked higher in total yield than in market yield indicating higher nonmarketable fruit than the other lines. Percent Red Fruit at Harvest – Table 2 & 2C: There was a lot of variability between trials in % red fruit at harvest. Shady Lady and XTM 0113 tended to be early and RFT 6047, BHN 611, HMX 2807, BHN 502, and BHN 526 tended to be later. All other lines were in between. Assuming that Kings is early, Merced is midseason, and San Joaquin is late, then under the growing conditions of this year, in general: Some perform better EARLY than LATE: Market yield: B-807, BHN 623, L-311, L-310 Total yield: B-807, BHN 623, BHN 526 Percent red: BHN 623, XTM 0113 Some perform better LATE than EARLY: Market yield: BHN 581, STM 0231, HMX 2807 Total yield: BHN 581, STM 0231, HMX 2807 Percent red: L-311, B-807 Some perform BETTER in MIDSEASON: Market yield: XTM 0230, BHN 611 Total yield: XTM 0230 Percent red: XTM 0115 Some perform CONSISTENTLY at all sites: Market yield: RFT 6047, XTM 0113 Total yield: RFT 6047, XTM 0113 Percent red: RFT 6047, Shady Lady, BHN502, BHN 526, L-310, XTM 0230
ROMA TRIAL – Table 3 Performance results of the 6 replicated and 6 observed varieties are listed in Table 3. For a complete report and discussion of this trial please contact Bob Mullen in San Joaquin County. Replicated Varieties Market yield of the replicated varieties ranged from 9.6 to 6.7 tons with an average of 8.1 tons (651 boxes) per acre. The vast majority of fruit were medium and small sizes. Immature fruit averaged 6.4 tons and culls averaged 2.6 tons per acre. Total yield ranged from 18.8 to 15.5 tons (1506 to 1242 boxes) per acre. Percent red fruit at harvest ranged from 43.1 to 2.3% and averaged 25.7%. BHN 621 had the most red fruit and Monica had the least. Observed Varieties The market yield of the six observed lines ranged from 8.1 tons (648 boxes) to 0.7 tons (56 boxes) per acre. HA 3821 had a substantial amount of extra large and large fruit compared to all other lines including the replicated varieties. Immature fruit averaged 7.8 tons and culled fruit averaged 1.7 tons per acre. Total yield ranged from 20.8 to 8.1 tons (1664 to 648 boxes) per acre. Percent red fruit at harvest averaged 23.1%; UG 8105 had the most and SUPRA had the least amount of reds. Final Remarks Determining what variety to plant for a complex fresh market industry is outside the scope of this evaluation. The purpose of this research is to assist growers, packers, shippers, and the seed industry with variety selections and evaluations. The strength of the farm advisors’ variety trial is in side-by-side comparisons of yields and quality characteristics in a commercial setting across a range of conditions. The ultimate test of variety performance is commercial scale success on individual farms over a number of seasons.
% % % %Variety Company Market Total Reds Market Total Reds Market Total Reds Market Total Reds
Variety by Location Interaction - When this statistic is significant, it means that the varieties did not behave consistently at each location. S = significant difference NS = not significantly different
* Market Yield = average weight in pounds of four replications converted to tons and boxes per acre of all marketable extra large, large, and medium sized fruit. Small fruit were considered unmarketable this year. TOTAL Yield = Marketable Yield plus small sized and cull fruit. Percent Red = % reds by weight of TOTAL yield including culls to indicate maturity relative to all tested varieties.
** Shady Lady was not replicated in the San Joaquin County trial.
Variety by Location Interaction - When this statistic is significant, it means that the varieties did not behave consistently at each location. S = significant difference NS = not significantly different
* Market Yield = average weight in pounds of four replications converted to tons and boxes per acre of all marketable extra large, large, and medium sized fruit. Small fruit were considered unmarketable this year.
** Shady Lady was not replicated in the San Joaquin County trial.
Table 1-A
Marketable Yield (TONS/Boxes per Acre)* - REPLICATED VarietiesSummary of Three Fresh Market Tomato Trials - 2003
Variety by Location Interaction - When this statistic is significant, it means that the varieties did not behave consistently at each location. S = significant difference NS = not significantly different
* TOTAL Yield = Marketable Yield plus small sized and cull fruit.
** Shady Lady was not replicated in the San Joaquin County trial.
Table 1-B
TOTAL Yield (TONS/Boxes per Acre)* - REPLICATED VarietiesSummary of Three Fresh Market Tomato Trials - 2003
Variety by Location Interaction - When this statistic is significant, it means that the varieties did not behave consistently at each location. S = significant difference NS = not significantly different
* Percent Red = % reds by weight of TOTAL yield including culls to indicate maturity relative to all tested varieties.
** Shady Lady was not replicated in the San Joaquin County trial.
Table 1-C
Percent (%) Red Fruit at Harvest* - REPLICATED VarietiesSummary of Three Fresh Market Tomato Trials - 2003
Variety Company XL L Med XL L Med XL L Med XL L Med
Variety by Location Interaction - When this statistic is significant, it means that the varieties did not behave consistently at each location. S = significant difference NS = not significantly different
* Market Yield = average weight in pounds of four replications converted to tons and boxes per acre of all marketable extra large, large, and medium sized fruit. Small fruit were considered unmarketable this year.
FRUIT SIZES:XL = 2 7/8 to 3 15/16 inches diameterL = 2 17/32 to 2 7/8 "M = 2 9/32 to 2 17/32 "S = 2 1/8 to 2 9/32 "
** Shady Lady was not replicated in the San Joaquin County trial.
Table 1-DSize Grades of Fresh Market Tomatoes - REPLICATED VarietiesResults Summary of Three Fresh Market Tomato Trials - 2003
COMBINED RESULTS Kings Co. Merced Co. San Joaquin Co.
* Market Yield = average weight in pounds of four replications converted to tons and boxes per acre of all marketable extra large, large, and medium sized fruit. Small fruit were considered unmarketable this year. TOTAL Yield = Marketable Yield plus small sized and cull fruit. Percent Red = % reds by weight of TOTAL yield including culls to indicate maturity relative to all tested varieties.
* Market Yield = average weight in pounds of four replications converted to tons and boxes per acre of all marketable extra-large, large, and medium sized fruit. Small fruit were considered unmarketable this year.
(midseason) (late season)
Table 2-A
Yield/Acre
MARKETABLE Yield (Tons/Boxes per Acre)* - OBSERVED VarietiesSummary of Three Fresh Market Tomato Trials - 2003
Kings Co. Merced Co. San Joaquin Co.(early season)
Combined TOTAL
Variety Company Tons Boxes Tons Boxes Tons Boxes Tons Boxes
* Market Yield = average weight in pounds of four replications converted to tons and boxes per acre of all marketable extra large, large, and medium sized fruit. Small fruit were considered unmarketable this year. TOTAL Yield = Marketable Yield plus small sized and cull fruit. Percent Red = % reds by weight of TOTAL yield including culls to indicate maturity relative to all tested varieties.
FRUIT SIZES:XL = 2 7/8 to 3 15/16 inches diameterL = 2 17/32 to 2 7/8 "M = 2 9/32 to 2 17/32 "S = 2 1/8 to 2 9/32 "
Roma Sizing Criteria: Extra Large = >165 grams Large = 130 to 165 grams Medium = 90 to 120 grams Small = 50 to 90 grams
2003 Disease Control Trials
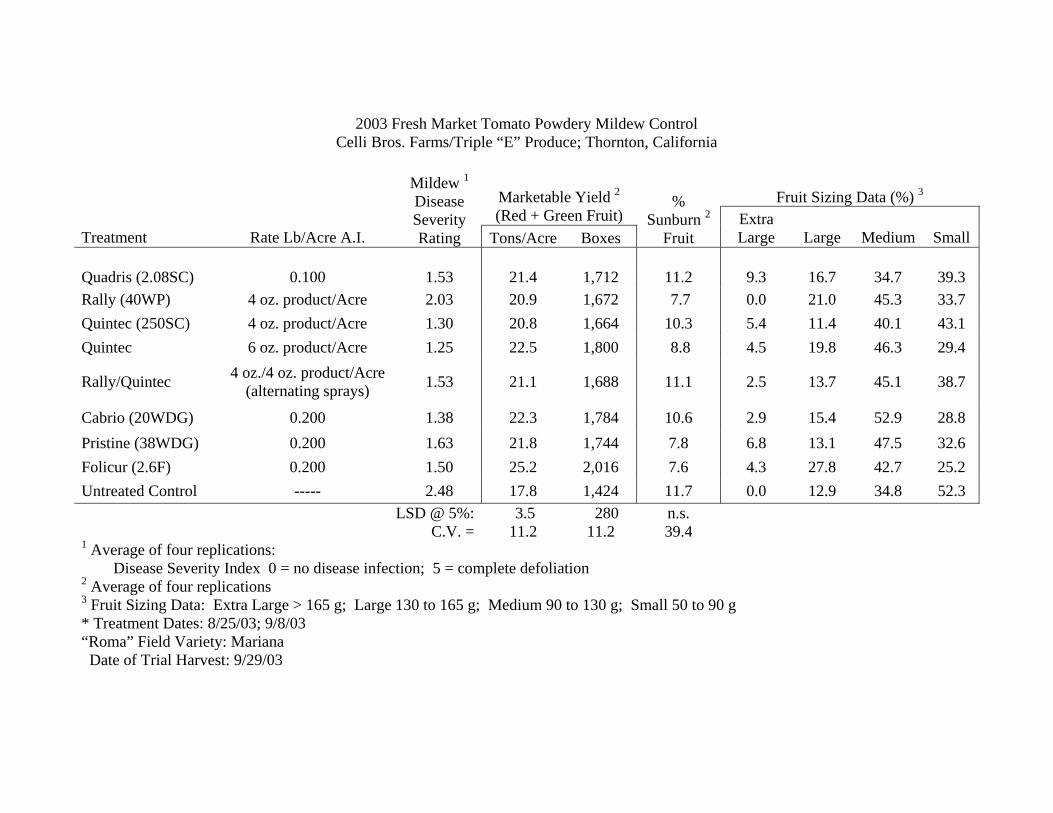
A Powdery Mildew Control Trial in Fresh Market Tomatoes Robert J. Mullen, Donald Colbert, Randall Wittie and Scott Whiteley Powdery Mildew (Leveillula taurica) occurs commonly in California’s Central Valley, where the majority of both processing and fresh market tomatoes are grown. The disease causes a drying of the crop’s leaves from the ground up, resulting in fruit being exposed to the sun. Considerable loss of yield can occur, particularly in fresh market tomatoes where even slightly sunburned fruit have to be culled. A good preventative fungicide spray program, utilizing weather station data on temperature, relative humidity and leaf wetness, is essential to disease management. This year a trial was established, evaluating six fungicides as stand alone treatments, with one additional treatment alternating two fungicides. The trial was located near Thornton, California with Triple “E” Produce (Tom Guido, Nate and Joe Esformes) and the grower cooperators were Robert and David Celli (Celli Bros. Farms). Initial treatments were made on August 25, 2003, with an additional application occurring September 8, 2003. All treatments were applied over and into the crop canopy at mid fruit development (1.5 to 3.0 inch diameter) as soon as disease development was detected. There were four replications of each treatment and the plot design was a randomized complete block. Treatments were made using a handheld CO2 backpack sprayer with 8004 nozzles at 30 psi in a spray volume of 50 gallons per acre water. The soil type at the trial site was a Columbia silty loam, the field variety was Mariana, a “Roma-type” line and the field was furrow irrigated on a 5 to 7 day schedule throughout the fruit development to harvest period. Moderate disease pressure developed and a disease severity rating was made on 9/22/03. Best control occurred with Quintec (quinoxyfen) alone, at the higher rate, followed by Quintec at the lower rate, Cabrio (pyraclostrobin) alone and Folicur (tebuconazole) alone. The least control, other than the untreated control, occurred with Rally (myclobutanil) alone. The trial was hand harvested on September 29, 2003. All treatments outyielded the untreated control led by Folicur alone, followed by the high rate of Quintec alone, Cabrio alone, Pristine (pyraclostrobin + nicobifen) alone and Quadris (azoxystrobin) alone. There was a nonsignificant trend toward reduced fruit sunburn, compared to the untreated control, particularly with the Folicur, Rally and Pristine treatments. Work on evaluating existing and new fungicide chemistry for Powdery Mildew in tomatoes must continue. The need to identify effective fungicide materials, used in a rotational spray program to prevent disease organism resistance, is critical.
2003 Fresh Market Tomato Powdery Mildew Control
Celli Bros. Farms/Triple “E” Produce; Thornton, California
Cabrio (20WDG) 0.200 1.38 22.3 1,784 10.6 2.9 15.4 52.9 28.8 Pristine (38WDG) 0.200 1.63 21.8 1,744 7.8 6.8 13.1 47.5 32.6 Folicur (2.6F) 0.200 1.50 25.2 2,016 7.6 4.3 27.8 42.7 25.2 Untreated Control ----- 2.48 17.8 1,424 11.7 0.0 12.9 34.8 52.3 LSD @ 5%: 3.5 280 n.s. C.V. = 11.2 11.2 39.4 1 Average of four replications: Disease Severity Index 0 = no disease infection; 5 = complete defoliation 2 Average of four replications 3 Fruit Sizing Data: Extra Large > 165 g; Large 130 to 165 g; Medium 90 to 130 g; Small 50 to 90 g * Treatment Dates: 8/25/03; 9/8/03 “Roma” Field Variety: Mariana Date of Trial Harvest: 9/29/03
Evaluation of Fungicides for the Control of Powdery Mildew
(Leveillula taurica) in Fresh Market Tomatoes
Jan Mickler, Farm Advisor, Stanislaus County Bob Mullen, Farm Advisor, San Joaquin County
A tomato powdery mildew fungicide efficacy trial was conducted near Gustine (Merced
County) with cooperation by the DiMare Company. This site is adjacent to the Garzas Creek and was selected because this environment favors the development of both powdery mildew and late blight tomato. The field was transplanted on July 21, 2003 with a fresh market tomato variety developed by the cooperator(s).
The test plot was designed as a randomized complete block with nine treatments replicated
four times. Individual plots were 25’ in length by 5’ in width. The treatments evaluated were: (1) Rally 40WP (0.125 lb a.i./A), (2) Quintec 250 SC (0.067 lb a.i./A), (3) Quintec 250 SC (0.100 lb a.i./A), (4) a rotation of Rally 40 WP(0.125 lb a.i./A) followed by Quintec 250 SC (0.067 lb a.i./A), (5) Cabrio 20 WDG (0.15 lb a.i./A), (6) Pristine 38 WDG (0.30 lb a.i./A), (7) Topsin M (0.70 lb a.i./A), (8) Quadris 2.08 SC (0.100 lb a.i./A) and, (9) an untreated control.
Prior to the first application, (late August) environmental conditions prevailed that favored
the development of powdery mildew. By the time the first fungicide applications were made (Sept. 12), the disease had become well established throughout the field. Despite a baseline level of mildew, the treatments for evaluation were applied on September 12, September 26, October 6, and October 17. All of the fungicides were applied in a 50 gallon/acre spray volume using a CO2-pressurized backpack sprayer, operated at 30 psi, and a handheld boom. The boom was 60” wide and had 3 evenly-spaced nozzles fitted with 8002 flat-fan spray tips. The severity of powdery mildew in each plot was assessed on October 8 and October 20. On October 30, tomatoes from plants in the middle 10’of each plot were hand-harvested, sorted into 4 classes (red, green, sunburn damaged, and other culls), and weighed.
An analysis of variance was conducted on the disease severity and fruit yield data to
determine if the differences observed among plot means were a result of fungicide treatment. When this analysis indicated a statistically significant effect by treatment, the treatment means were separated using the least significant difference test.
At the first disease rating, powdery mildew was significantly more severe in control plots
than in any of the fungicide-treated plots. However, by the final rating, mildew severity in Quintec (0.100 lb a.i. /A), Topsin M, or Cabrio 20 WDG plots was statistically equivalent to that of the untreated control plots. The most consistent mildew control was provided by the Quadris, Pristine, and Rally/Quintec treatments. In this trial, there was no effect of treatment on either the marketable yield (reds + greens) or the yield of red, green, sunburn-damaged, or other culls. These results suggest that once mildew has become established in a field, there is no economic benefit in making scheduled fungicide applications. This supports the recommendation for a preventative approach toward tomato powdery mildew control.
2003 Fresh Market Tomato Powdery Mildew Control Trial (Cooperator: The DiMare Company - Newman, CA)
Mildew Severity Ratinga Crop Maturity at Harvest (%) Treatmentb
Rate
(lb a.i./A)
10/1/03
10/8/03
Marketable Yield (Reds + Greens)
Tons/Acre
Red
Green
Sunburn
Other Culls
Control ---------- 2.75 Ac 3.25 A 18.6 14.3 48.7 18.5 18.6 Quadris 2.08SC 0.100 2.08 B 2.53 BC 17.9 12.7 45.6 19.0 22.8 Topsin M 0.700 1.95 BC 2.88 AB 16.0 17.2 42.0 20.3 26.5 Quintec 250SC 0.067 1.88 BC 2.38 BC 13.8 17.3 36.4 25.1 21.2 Rally 40WP 0.125 1.88 BC 2.45 BC 16.9 11.6 49.8 19.4 19.8 Pristine 38WDG 0.300 1.75 BCD 2.00 C 17.3 16.3 40.6 19.9 23.2 Quintec 250 SC 0.100 1.75 BCD 2.63 ABC 16.5 18.7 46.9 18.9 15.5 Rally 40WP / Quintec 250SC
0.125 / 0.067
1.63 CD 2.38 BC 17.7 21.4 41.5 24.4 12.7
Cabrio 20WDG 0.150 1.38 D 2.63 ABC 22.3 21.2 46.1 18.9 13.8 LSD 0.05d 0.44 0.69 NSe NS NS NS NS C.V. f 15.9 18.3 22.5 47.3 21.1 40.1 36.4 a Disease Severity Index: 0 = no disease infection; 5 = complete plant defoliation b Treatments were applied on a 10-14 day schedule. c Treatment means within each column that share the same letter are not significantly different according to the least significant difference test (P=0.05). d LSD = least significant difference. e NS = not significant. f C.V. = coefficient of variation.
CAUTION This publication is a research progress report of fresh market tomato cultivar evaluation trials and a pest management study conducted in San Joaquin County during 2003. This report presents results of a fresh market tomato disease management trial conducted with local grower cooperators. It should not, in any way, be interpreted as a recommendation of the University of California. Chemical or common names of pesticides are used in this report instead of the more common trade names of these products. No endorsement of products mentioned or criticism of similar products is intended. The rates of pesticides in this report are always expressed as active ingredients (a.i.) of the material per treated acre, unless otherwise indicated. Trade Name Common or Chemical Name Manufacturer
Products) Rally (40WP) myclobutanil Dow Agro Sciences Folicur (3.6F) tebuconazole Bayer Ag Chemicals Topsin M (70WP) theophanate-methyl Cerex Agri, Inc.
This is a report of work in progress only. The chemicals and uses contained in this publication are experimental data and should not be considered as recommendations for use. Until the products and their uses given in this report appear on a registered pesticide label or other legal, supplementary direction for use, it is illegal to use the chemicals as described.
WARNING ON THE USE OF CHEMICALS Pesticides are poisonous. Always read and carefully follow all precautions and safety recommendations given on the container label. Store all chemicals in their original labeled containers in a locked cabinet or shed, away from food or feeds, and out of the reach of children, unauthorized persons, pets, and livestock. Recommendations are based on the best information currently available, and treatments based on them should not leave residues exceeding the tolerance established for any particular chemical. Confine chemicals to the area being treated. THE GROWER IS LEGALLY RESPONSIBLE for residues on his crops as well as for problems caused by drift from his property to other properties or crops. Consult your County Agricultural Commissioner for correct methods of disposing of leftover spray material and empty containers. Never burn pesticide containers.
PHYTOTOXICITY Certain chemicals may cause plant injury if used at the wrong stage of plant development or when temperatures are too high or when overcast conditions occur. Injury may also result from excessive amounts or the wrong formulation or mixing incompatible materials. Inert ingredients such as wetters, spreaders, emulsifiers, diluents, and solvents, can cause plant injury. Since formulations are often changed by manufacturers, it is possible that plant injury may occur, even though no injury was noted in previous seasons.
No endorsement of named products is intended, nor is criticism implied
of similar products which are not mentioned.
University of California Cooperative Extension of San Joaquin County 420 South Wilson Way, Stockton, California 95205-6243 Telephone (209) 468-2085
The University of California prohibits discrimination against or harassment of any person on the basis of race, color, national origin, religion, sex, physical or mental disability, medical condition (cancer-related or genetic characteristics), ancestry, marital status, age, sexual orientation, citizenship, or status as a covered veteran (special disabled veteran, Vietnam-era veteran or any other veteran who served on active duty during a war or in a campaign or expedition for which a campaign badge has been authorized).
University Policy is intended to be consistent with the provisions of applicable State and Federal laws.
Inquiries regarding the University's nondiscrimination policies may be directed to the Affirmative Action/Staff Personnel Services Director, University of California,
Agriculture and Natural Resources, 1111 Franklin, 6th Floor, Oakland, CA 94607-5200, (510) 987-0096.
Cooperative Extension Work in Agriculture and Home Economics; U.S. Department of Agriculture, University of California and San Joaquin County Cooperating