TIRDS3 r INANZG4 0 Institute of Freshwater Ecology River Corridor Strategic Overview Feasibility Study A report to the National Rivers Authority I .g4 ,4 • Natural Environment Research Council
Transcript
TIRDS3r INANZG4
0
InstituteofFreshwaterEcology
River Corridor Strategic OverviewFeasibility Study
A report to the National Rivers Authority
I.g4,4
•
Natural Environment Research Council
INSTITUTE OF FRESHWATER ECOLOGYRiver Laboratory, East Stoke, Wareham, Dorset BII20 6BB
F.H. DawsonMarch 1992National Rivers AuthorityProject Director Dr P. RavenConservation Officer, Head Office
RI/1'110530/1TFS/11053r1
This is an unpublished report the contents of which are the sole property of theNational Rivers Authority. The contents should not be cited withoutpermission of the NRA Project Director.
The Institute of Freshwater Ecology is part of the Terrestrial and FreshwaterSciences Directorate of the Natural Environment Research Council.
CONTENTS
Page
EXECUTIVESUMMARY 1
INTRODUCTION 31.1 Background 31.1.1 The need for an overviewand its benefits 31.2 Method of approach 41.2.1 Key issues 41.2.2 Detailed objectives 5
METHODS 72.1 Approach 72.2 Other potential approaches 72.2.1 Conservationstatus of rivers in South Africa 7
RIVER CORRIDORSURVEYAND ASSOCIATEDMETHODOLOGIES 93.1 Comparisonof RCS with other surveys 93.2 RCS costs 103.3 Potentialfor predictivemethods 103.4 Summary 12
PHOTOGRAPHICREMOTELYSENSEDDATA 134.1 Introduction 134.2 Air Photography 134.2.1 Availabilityof air-photography 134.3 Other sources 164.3.1 Ministry of Agriculture,Fisheries and Food Air Photo Unit 164.3.2 Royal Commissionfor HistoricMonuments,Air-PhotoLibrary 164.3.3 GEONEX UK Limited 164.3.4 Hunting Aerofilms Limited 174.3.5 Other aerial photography 174.3.6 Other platforms 174.4 Aerial video 174.5 Cost of air-photography 174.5.1 Air photo acquisitioncosts 174.6 Air photo interpretationcosts 184.7 Air-photography;informationcontent 194.8 Air-photography;informationcapture 234.8.1 Photogrammeticmapping 274.9 Date of baseline survey 28
5. MULTI-SPECTRALIMAGERY 315.1 Satellite imagery 315.1.1 LANDSATThematicMapper (TM) 325.1.2 SPOT 335.1.3 Other satellite sensors 335.1.4 Satellitecosts; data and processing 335.2 Airborneimagery 345.2.1 Airbornethematicmapper (ATM) 345.2.1.1 ATM costs 365.2.2 Imaging spectrometry- CASI 365.2.3 Other scanners 395.2.4 Other data 395.3 Comparativesummaryof photographicand digital imagery 39
6. ENVIRONMENTALDATA SOURCESAND INFORMATIONSYSTEMS 416.1 Introduction 416.2 Environmentaldata sources 416.2.1 OrdnanceSurvey (OS) 416.2.2 Institute of Hydrology(IH) 416.2.3 SSLRCLand InformationSystem - LANDIS 416.2.4 42ITE land classificationsystem6.2.5 ITE satellite land cover map of Great Britain 426.2.6 NationalPark land cover data 426.2.7 Other digitised data 456.3 Ancillarymap information 456.4 Environmentaldata summary 456.5 Geographicand other informationsystems 466.5.1 Water InformationSystem (WIS) 466.5.2 Other InformationSystems (IS) or GeographicalInformation
Systems (GIS) in use/plannedand contacts 47
7. DISCUSSION 497.1
49River Corridor Survey(RCS)7.2 Remotelysensed data 507.3 Availabilityof data 517.4 Data managementsystems 537.5 Assessmentof the potential for an hierarchicalclassification 53
8. SUMMARYAND PROPOSALS 558.1 Summary 558.2 The way forward - progressivestages 57
9. ACKNOWLEDGEMENTS 59
10. REFERENCES 61
APPENDICES
1ADDRESSES OF ORGANISATIONSRCS, GIS or related interestscontactedAir photographicorganisations
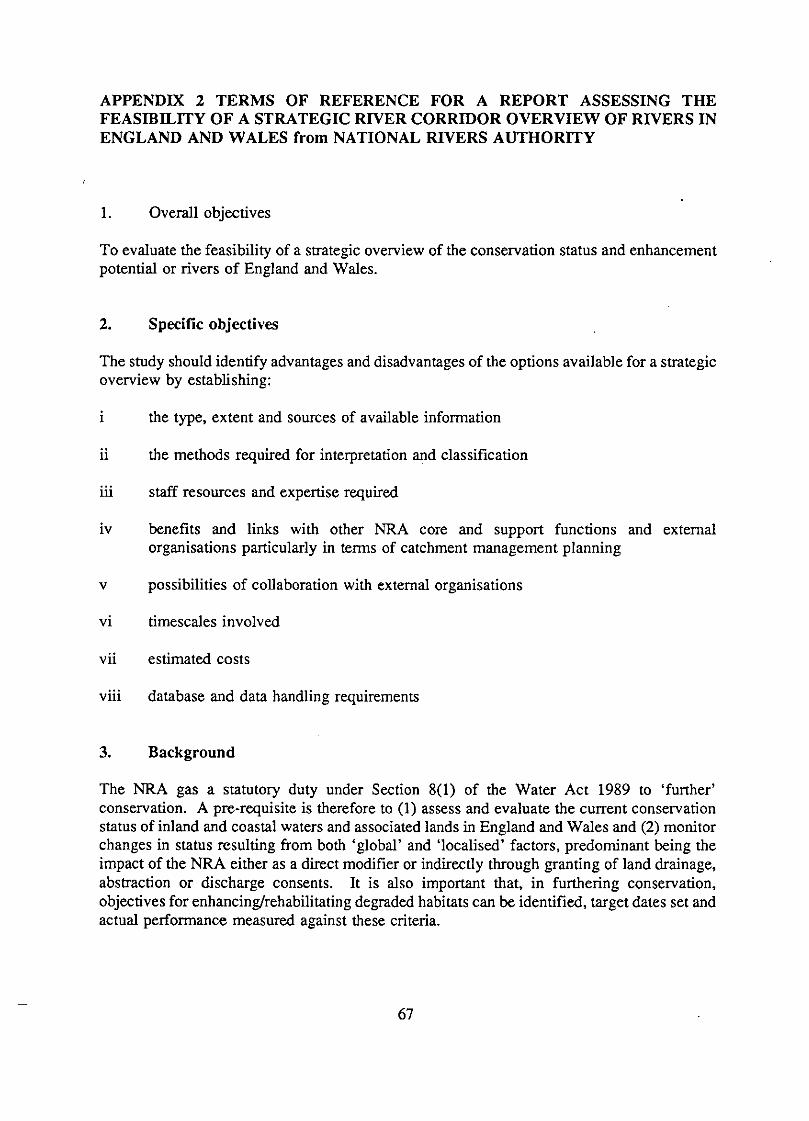
2Terms of reference for a report assessingthe feasibilityof a strategicriver corridor overviewof rivers in Englandand Wales from NationalRivers Authority
6366
67
3 Proposal from the Institute of FreshwaterEcology toNational Rivers Authority 71
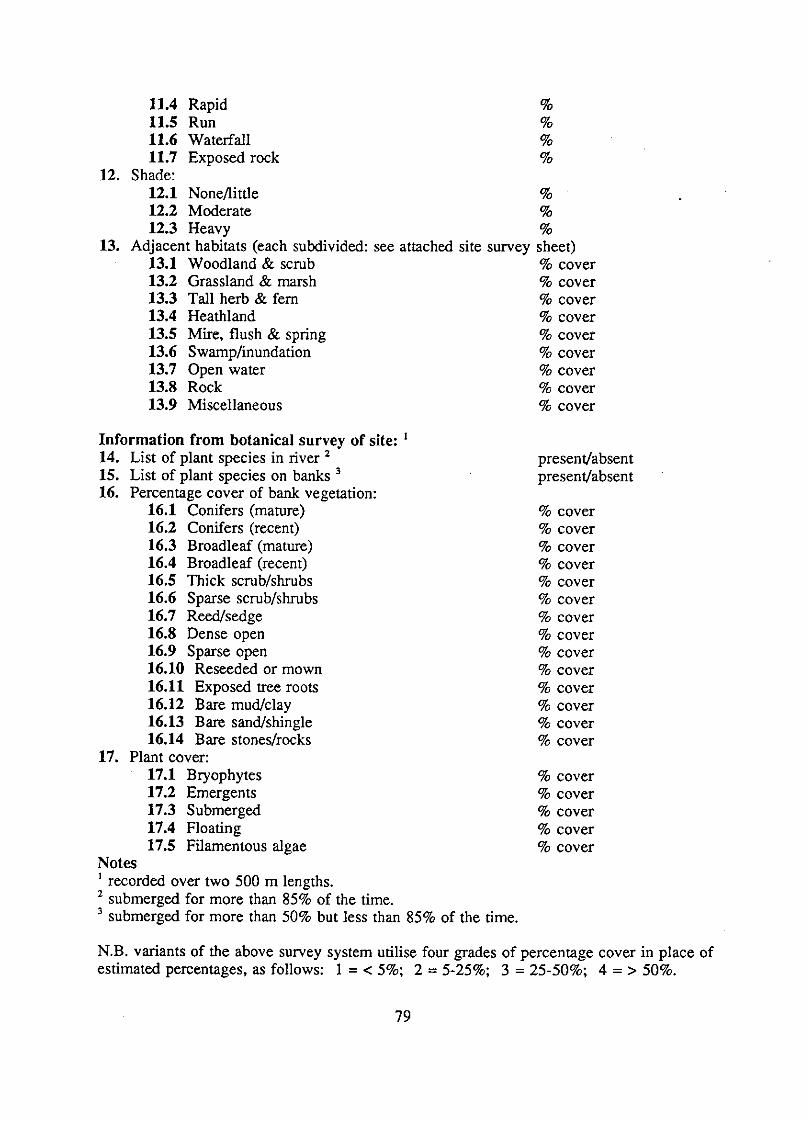
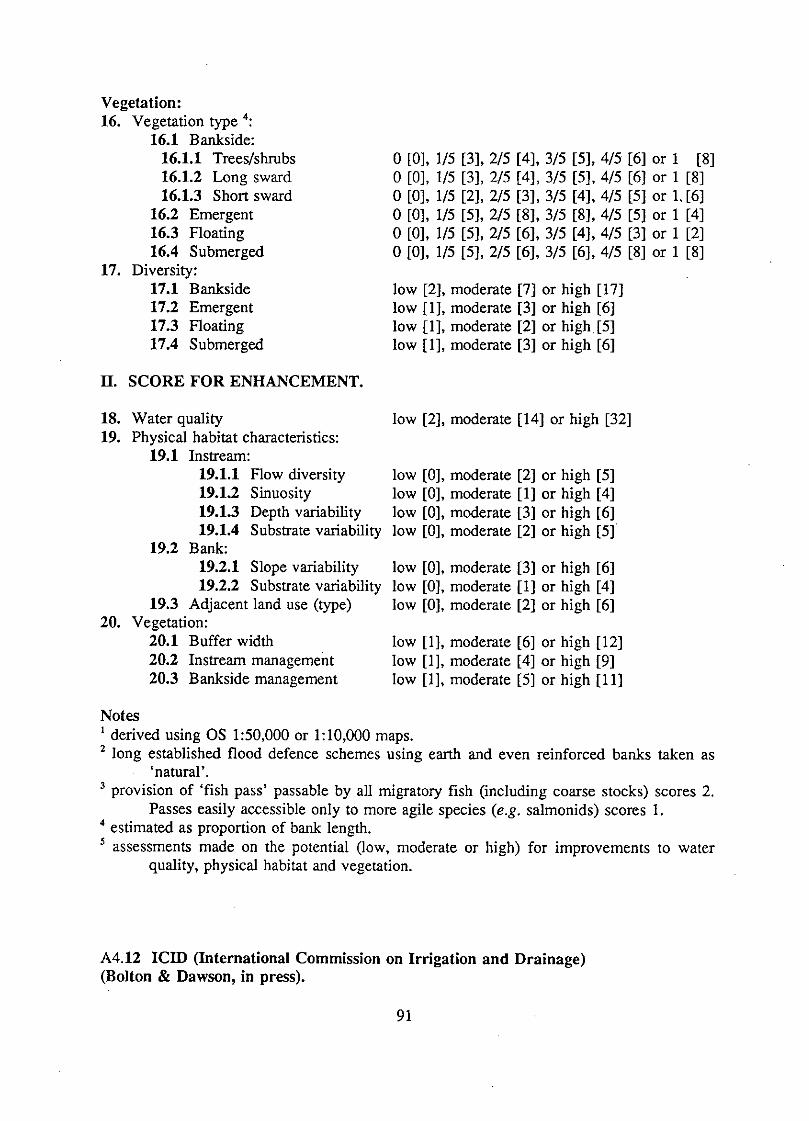
4 Surveyparametersfrom River CorridorSurvey and similar surveys 77
5 Progressreport on River Corridor StrategicOverviewFeasibilityStudy 93
i i i
LIST OF TABLES
3.1 Sunmiaryof parametersused in surveymethodologies
Page
for watercourses .114.1 Availabilityof air photography 144.2 Variationsin drainagenetworkdensity (Kent)from 1:50,000map 194.3 Trial comparisonof photo interpretationof air photography
from R. Kennet into NCC RCS classificationclasses 255.1 Sensor characteristics 325.2 Swath width and flying for AADS-1268ATM 345.3 Spectral response of AADS-1268ATM channels 356.1 Spatial data LANDISand II1 446.2 Spatial data from IH 446.3 Land cover classes for satelliteand cover map produced by ITE 456.4 Lent of RCS in main river in each NRA region 477.1 Summaryof parametersneeded or availablefor predictiveuse in RCS 538.1
A strategic overview of conservationvalue and enhancementpotential would bringmany benefits to NRA as a whole; it is a prerequisiteof policy decisions and future strategy
An overviewis feasible by remote sensing if combined with existing map data•
The most feasibleoptionsare aerialphotographyat 1:101000or imagery by ATM or CASIsupplementedwith infrared;availablesatellite imageryis only useful in a catchment context
Trial interpretations of aerial photographs have distinguished a large number offeatures but not always significantones to environmentalassessment
Aerialphotographssince 1986for half of England& Wales from a variety of sourcesat an estimatedcost of £0.24 M; completionwith new photographsmay cost £0.57 M
Photographs require correction,visual interpretationand digitization; the estimatedminimumcost is £0.6 M
Digital data are more versatile and computer processible but the technology andanalysismethodologyare still beingdeveloped;data can be analysed at appropriate scales indifferent areas. Simulatedcolour pictures of mediumresolution can be made available
The overall cost of a remotelysensed overviewis estimated at £2 M which is abouta tenth the cost of field RCS surveyswhich are also limited seasonally
Estimatesare basedupon45,000 km of mainriver and 181,000of headwater streams,althoughthe total could be 365,000km
Photographsor computer images are of use to many NRA functions esp. as a firstfilter for operationalwork; they are a tangible asset for sale and acquisition costs could besignificantlyreduced by internaland external collaboration
Rivercorridorsurveyproducewell-annotatedhabitatdiagramswith a stronglandscapecomponent There is no overall assessment index or national standard and no analysis ofcriticalparametersresultingin muchredundancyof data;the methodologyneeds improvementto match strategicand operationalneeds and the biologicalassumptionsinvestigated
Progressivevalidationphases are required:An initial phase with detailedcostingswill be required with respect to:
- obtainingphotographs,map & data sets; commissionnew imagery or photographycorrecting,interpretingand digitisingdata
- developingand validatinga hierarchicalclassificationfor conservation valuechoice of a computersoftware& system and integrationof data
A secondphase extendingthe overviewby producinga predictive system based upon layersof map and environmentaldata in a GeographicInformationSystem is proposed from whichto obtainestimatesof biotafor pristinesitesprior to modificationby input of remotely senseddata; interactivefeaturesallowingmanagementscenariosto be tested following field testing
1
á
1. INTRODUCTION
The NationalRivers Authority(NRA) has recognisedthe need for a more strategicapproachto the classification and assessment of rivers with respect to conservation value andenhancementpotential. A feasibilitystudy into this strategicoverview approach is thereforean essentialpre-requisiteto any policy considerationswhich will shape future NRA strategyin this field and may necessarilyinvolve significantcapital expenditure.
An assessmentof the feasibilityof a strategicoverviewof rivers in England and Wales wasthe main objectiveof this particularstudy. Full terms of reference are given in Appendix 2,but the specific objectiveswere to identify the advantagesand disadvantagesof the optionsavailable by establishing:
the type, extent and sources of availableinformation,ii the methods required for interpretationand classification,iii staff resources and expertise required,iv benefits and links with other NRA core and support functions and external
organisationsparticularlyin terms of catchmentmanagementplanning,possibilitiesof collaborationwith externalorganisations,
vi timescalesinvolved,vii estimated costs andviii database and data handlingrequirements.
1.1 Background
1.1.1 The need for an overview and its benefits
The NRA has a statutoryduty under Section 16 of the Water Resources Act 1991 to furtherconservation. Conservationis takento includewildlife,habitats,landscapeand naturalbeautyand features of archaeologicaland historical interest. A pre-requisite, therefore, is to (1)assessand evaluatethe currentconservationstatusof inland andcoastal watersand associatedlands in Englandand Wales and (2) monitorchangesin statusresulting from both global andlocalised factors, the impact of the NRA being predominanteither as a direct modifier orindirectly through granting of land drainage, abstraction or discharge consents. It is alsoimportantthat, in furtheringconservation,objectivesfor enhancingor rehabilitatingdegradedhabitats can be identified, target dates set and actual performance measured against thesecriteria.
Rivers represent a major focus of NRA responsibilities. The river channel and associatedlands, therefore, have become the focus for a major effort involving habitat surveys andimpact assessments. However, a national strategic overview to provide planners at thenational and regional level with an index of river conservationvalue, is still lacking.
Conservationoften emphasisesthe protectionof the best examples of habitats or rare plantsand animals. As a result, developersand others,all too often, mistakenlyregard features thatoccur outside the "ring-fence"designatingan SSSI as having no conservation status.
Only 369 km of river-length in England and Wales is currently designated specifically as riverine SSSI. Although it is of paramount importance that the best rivers need to be protected,it is onlyright thatproportionatelymoreeffortshouldbe directedtowardenhancing
3
the conservation value of the remaining 99% of river length. All rivers have someconservation value or potential. There is an urgent need to evaluate the rivers of England andWales so that the best stretches can be identified and protected while the remainder can bemaintained or enhanced.
A strategic overview also has•major potential in terms of a holistic approach to catchmentmanagement planning, incorporating other core NRA functions (Water Resources, WaterQuality, Flood Defence, Fisheries, Recreation and Navigation) and outside organisations suchas English Nature, Countryside Commission and English Heritage.
The methodology for a strategic overview needs to be simple, rapid, robust but flexible andreadily repeatable. In terms of staffing resources, it should be entirely independent from, butcomplementary to, the current programme of river corridor surveys. It should also becompatible with survey methodologies used by the NRA to monitor the general and specialecosystem use-related Environmental Quality Objectives.
1.2 Method of approach
The method of approach was a desk study, literature search and contact with relevantpersonnel from the NRA and outside organisations. This report details existing information,outlines the options available and recommends the most appropriate methodology for theNRA. Additional emphasis was placed on conservation enhancement potential andconsideration of how an overview would fit into a hierarchical classification system(Appendix 3).
This feasibility study is an essential precursor for the proposed strategic overview. Itidentifies cross-functional benefits and possible collaboration/cross-funding for the overviewexercise.
1.2.1 Key issues
Potential methodologies for a strategic overview of the conservation value and enhancementpotential of English and Welsh rivers were identified and assessed (IFE proposal, Appendix3). Techniques needed to allow meaningful, reliable data to be obtained, made simplyavailable and able to be analysed rapidly. The NRA would use the data as a first phaseassessment, but also to underpin environmental protection, general improvement ordetermination of the potential for enhancement of special habitats in a cross-functionalcontext, which would also benefit other agencies and government departments. Thesignificance of biotic and geomorphological features such as the presence of trees on banks,the variation in river form, e.g. riffle-pool sequences, overhangs, sinuosity, in relation to fishpopulations but also to other biota, e.g. macroinvertebrates or plants and their diversity, hasto be assessed in the context of other catchment characteristics.
One specific objective of the study is to compile a 'matrix' of the advantages anddisadvantages of the different potential methodologies. This is determined by the extent andquality of the available information sources, implementation and classification requirements,and the benefits to both the NRA and other organisations. The best options and arecommendation for the most appropriate methodology for the NRA is the final output.
4
1.2.2 Detailed objectives
This report identifiesand evaluates the following:
informationavailability,its type, extent,sources,coverage, scale and the access costsdata for sources including:
maps and geographicdata base information;satellite imagery;aerial photographywith interpretationfrom single and stereo pairs;aerial video photography;aerial multi-spectraland imaging scanners;ground-basedsurveysextracts especiallyriver corridors;other potential sources or computationsfrom databases.
The methodsrequiredfor interpretationand classification, including factors such asthe economicbalancebetweensurveyeffort versus the effort required for dataelucidationand processingfrom the chosen media;informationquality andreproducibility.
The data obtainedby various methodswas assessed in biotic and geomorphicterms.
the type of informationthat can be derivedefficientlyfrom air photography/videoetcto provide data for categorisingthe conservationvalue of rivers in terms of
level of management from evidence of river straightening, culverts andcanalization,water uses, upstreamand adjacent,adjacent land-use, i.e. distinguish between semi-natural and intensivelycultivatedriver flow pattern;potentiallevelsof disturbanceto wildlifeand vegetation; presence of footpath,buildings, tow-path,building,moorings,then
techniquesto incorporaterelevantdata, includingRCS, into a simple classificationofriver conservationvalue,
the most appropriateformat for presentationof final classification and the associateddatabase, (e.g. GIS)
waysin whichGIS could be used as a managementtool to record, display and providefigures on conservationstatus of rivers.
5
6
2. METHODS
2.1 Approach
The existing River CorridorSurvey(RCS)methodin its variousdraft forms, was examined.The parameters were isolated in an attempt to find those which could be satisfied.fromremotely-senseddata. It is obvious that the ideal RCS parameters require specialists toundertake surveys. In additionmany surveysonly include data on landscape and land usefeatures combinedwith habitats in whichplants were identifiedto species, and some simplemorphologicalparameters. Althoughthese surveysare of direct use in response to specificoperationalconstructionor maintenancework,thereis no overallassessmentvalue whichputsthe site-speciesdetail into a wider sub-catchment,catchment, regional or national context.No analysis of factors or parameters,commonto sites judged to be "good" or "bad" seemsto have been undertakenas yet, althoughthere is a some qualitativeconsensus of opinion inthe general scientificcommunity. Initialexaminationof photographicmaterial indicatedthatseveral habitat and morphologicalparameterse.g. sinuosity,continuity of tree or bush line,etc., could be determinedbut there was no frameworkinto which they could be integrated.It is therefore necessary to consider other assessments and predictive methodologies todetermine if habitat quality can be assessed from parameters which could either beremotely-sensedor derived from existingdata sources.
The approachhas thereforebeen to assess:
field survey RCS and similar (or more extensive) methodologies including thecollection of physical,chemicaland biotic data;
ii remotely sensed data and techniques primarily high resolution air imagery withsupplementarysatellitedata;
iii a hierarchicalapproachcombiningboth field survey and remotely-senseddata;
iv a predictiveor modellingapproachbased on 'layers' of environmentaldata analysedwithin a data managementor geographicalinformation system (GIS) and calibratedwith respect to a sampleof remote sensing/fielddata (availabilityof existing map anddata sets of use to predictivemodels).
2.2 Other potential approaches
2.2.1 Conservation status of rivers in South Africa
An expert system computer program has been implementedin S.A. for the assessment ofconservation status (O'Keeffe et al 1987). The system is based upon the user supplyinginformation about specific river attributes such as fish numbers, quantities and types ofeffluent etc. These parametersare then weighed against rules derived from expert opinion,and a river conservationsystemstatus (scorefrom 0 to 100) is given as a first approximationencapsulating what are generally accepted to be the more important components ofconservation status. A modified version of this approach called 'SERCON' (System forEvaluatingRiver Conservation)is being developedby P.J. Boon (ScottishNatural Heritage)with some involvementfrom the NRA (P. Raven pers. comm.).
7
_
8
3. RIVER CORRIDOR SURVEY AND ASSOCIATED METHODOLOGIES
3.1 Comparison of RCS with other surveys
Various methodologieswere compared to the River Corridor Survey (RCS) methodologywhose output is descriptive and generally given as annotated, site-specific diagramsrepresenting 500 m lengths of watercourse, despite the proposals outlined in the originalNCC/Holmesdraft methodology.The mapsare usefulin providingbasic data for operationalwork; particularly on-site assessment between contractors and conservation personnel.Anglian NRA have been using field survey techniques to produce maps of river corridor(100 m wide?) characteristicsincluding fauna, flora etc. along 500 m lengths, their RiverEnvironmentalDatabase (RED).
Parametersincludedin the standardRCS are habitator adjacentland-use with flora identifiedto determine uncommonor rare species and specific areas of plants or other features to beretained where possible.
These surveys do not have an overall assessment in simplistic form and often require considerableskill or experienceto interpret. An overviewis required for both strategic and operationalpurposes,especiallyat siteswheredecisionsondevelopmentmay be controversial.
Except for sinuosity, tree distributionetc., RCS survey parameters are not particularly easyto determineby several of the remote sensingmethods.
The straightforwardfield survey technique is capable of providing a very wide range ofparametersof potential interestfor evaluatingthe environmentalquality of a river. However,a number of methodologicalproblems are present:
Site specific; the time and costs involvedin collectingsuch a wealth of data are veryhigh, hence restricting survey to regions/sampleareas. An intensive field surveyapproach is therefore more suitable for site-specificproblems, e.g. in response to aspecificproposal for development. In particular they are useful for providing basicdata for operational work during on-site negotiations between contractors andconservationpersonnel,but not really appropriatefor a strategic overview of the typeenvisaged.
No well-defined methodologyexists to translate the data collected into a simplemeasureof environmentalquality/conservationvalue. Interpretationof the informationrequiresexperienceand consistencyis not assured.
Data redundancy;research is required to determine which RCS parameters explainmost of the variationin derived indices of river environmentalquality. In this wayit should be possible to determine a minimumnumber of parameters of importancewhich provide maximumdiscriminationbetween sites.
9
3.2 RCS costs
The overalldirectcosts of standardfield surveysandreport writingvary greatly (£50-160perlcm). Surveyscommissionedby North West NRA have cost £57 per km and 1.6 km per dayduring late spring,summerandearly autumn. The cost of the RiversEnvironmentaldatabase(RED) for NRA Anglianis £0.5 M for 6,000 km or £83 per km but includes more detailedornithologicalsurveys.
This is £13 M for 45,000 km of main river and 181,000 km of headwaters and wouldtake 140,000 person days.
Other figuresare availablefor the lengthof rivers and streamother than main river. Figuresin Table 6.4 indicate that this value could be too low by a factor of two. Thus, neglectingvariation in survey requirementse.g. access to sites, site quality etc., and not includingstanding water, the cost of a comprehensive RCS-based survey could be as much as£21 M and take 230,000 man-days to complete; it would need to be resurveyedat somepredeterminedfrequencyof perhaps 10- 20 years.
3.3 Potential for predictive methods
Other methodologieswere investigatedon the assumptionthat a good river corridor is likelyto have good aquatic or riparian biota (Table 3.1). Only one main predictive system wasfound to be in operationaluse in Britain, i.e. RIVPACS,which predicts the probabilityofaquatic macro-invertebrate occurrence using environmental data, although other moreextensive systems are under development. In this system 8 or 12 parameters are used inpredictionsof macro-invertebratefaunaexpectedfor unpollutedsites; the probabilitiesderivedare then compared to samplesto assess the degree of degradation. If this type of approachcouldbe used(byextrapolationbeyondthoselimitscurrentlyconsideredacceptable)thendataon
positionalparameterscan be found from maps, e.g. altitude, bed slopes and distancefrom the source;specialised maps of river discharge class, air temperature (and hence watertemperature);derived data to a lower level of detail, for water width, water depth and substratumcomposition (surface geology reduced/sortedby stream velocities), alkalinityof thewater (retentionand drift geology).
There is of course an element of a circular argument in this as, for example, riverclassificationis also derived (butby a differentmethod). This range of parametersmay needto be altered or broadenedto include all biota but could be biased in favour of a choice ofmap parameters for predictionof potential conservationvalue before downgradingthis byremotely sensed data to derive enhancementpotential.
Further research and developmentwill be requiredfor predictivetechniquesbefore they canbe used for a national strategicoverviewof the conservationvalue of rivers. Problemsneedto be resolved on the:
10
Table 3.1 Summary of parameters used in survey methodologies for watercourses(from Saunders and Dawson 1992, see also Appendix 4)(Key: 1.. = number of classes of parameter;cc= identified as far as possibleor measuredas far as practical; * = defined by surveyor)
1 2 3 4 5 6 7 8 9 10 11
LOCATION:Lac/Long.or NGR 0.0 ... co ... 00 1 . 00 c.
Dist, river source co ...
TOPOGRAPHY:
Altitude c. 00 c. «.
Channelsize Wklth Water 4 00 c. 4 . ce 0, . 4 ..Bankfull c. 4 . co
Depth Water 4 oc c. 3 00. c. . c. c. 5 3Bankfull ca 4 . .
restricted spatial dimensionin which assessmentis specific to a particular stretch ofriver within a water catchmentof specific landscapecharacteristics,and
the assumptionin predictivesystemsbased upon aquaticand riparian biota that a highscore for these parametersis indicative of a river corridor with high environmentalquality.
Further research is required to support this assumptionand to determine which additionalparametersare required to provide a reliable overall index of river corridor quality.
3.4 Summary.
The standard RCS and its derivatives result in essentially well annotated diagrams ofvegetationand morphologicalcharacteristics.StandardRCSmethodologyis best seen simplyas a recordingtechniqueto showthat a reach of river has been examinedthoroughly,but thisis not necessarilytranslatableinto a robust and repeatable index of environmentalquality.There is plenty of scope therefore for improving the methodology in both biological andlandscape terms.
The high cost of a field-basedapproach to RCS and the methodologicalproblems involvedin translatingthe wealth of detaileddata into simpleand consistentindices of environmentalquality conservationgrade suggests that such an approach is neither practical nor desirablefor a national survey. Sections4 and 5 consider the contributionthat remotely sensed data(air-photography,airbornescannersand satelliteimagery)provideto RCS as a possiblemeansof obtainingless detailed data but over much larger areas.
12
4. PHOTOGRAPHIC REMOTELY SENSED DATA
4.1 Introduction
This sectiondescribesthe availabilityof remotelysensedphotographicand video data suitablefor river corridor survey assessmentfrom aircraft. The type, extent, sources and availabilityof these data, together with an appraisalof othercritical aspects such as the status, coverage,scale and the access cost is also presented.
4.2 Air Photography
The acquisitionof air-photographyin Englandand Wales is largely undertaken in responseto specific requests from county councils, private developers for smaller areas and, moreroutinely, by Ordnance Survey (OS) for map revision.
Until the establishment of the Air PhotographicAdvisory Service (APAS) at the OS inSouthampton,purchasersof air-photographyin Englandwere obligedto contact the air surveycompanydirectly,to obtaindetails about air-photocoveragefor a particular area. Air surveycompaniesnow submit quarterlyupdates of flight index maps to APAS. These are availablefor customers to consult.
Wales has had its own centralregister of air-photographyfor a number of years, operated bythe Welsh Office. The Air PhotographsUnitholds an extensivecollection of air photographsof Wales at various dates and scales. The unit is alsoresponsiblefor indexing all air surveysflown by the RAF, OS, Governmentbodies and commercialair survey companies in Wales.
WithinEnglandandWales,a varietyof organisationseitherhold nationallyimportantarchivesof air-photography,or fly new air-photography. A list of the major organisations holdingexistingphotographyor flying new air-photographyis included in Appendix lb, but a briefdescriptionof the most importantwithin the contextof the proposed River Corridor StrategicOverview,is presented in Table 4.1.
The extent of air video was not explored althoughdata held within NRA is covered by theAir UtilisationStudy Report of January 1992 (Projectleader: Dave Stanley).
4.2.1 Availability of air-photography
Air-photography,in blocks greater than 250 km2, acquired at 1:10,000 scale or greaterbetween 1986-91by the variousair-surveyorganisationsbelow,covers an estimated total areaof 84,000km2. This represents56% of Englandand Wales (151,000km2). More than 50%of England and Wales is flown at large scale every 5 years, though the distribution isvariable. For example,Wales and the South of Englandis better covered than the north andeast of England.
13
Table 4.1 Availability of blocks (> 250 km2) of large-scale air-photography 1986-91
County/Region Area (km') Date Black/white Scale Company
colour (1:n,000)
Avon 1300 1991 C 8 AEBeds 1200 1991 C 10 AEBerks 1250 1986 C 10 GEBerks 1250 1991 C 10 AEBucks 1900 1988/9 C 10 GECheshire 2000 1988 C 10 CUCornwall 3600 1988 C 10 GECornwall
(Bodmin) 300 1986-90 B 10 MAFFCumbria
(Eden Valley) 500 1986-90 B 10 MAFFDurham 2400 1991 C 10 AEEssex 3400 1990 B 12 AEEast Sussex 1800 1988 C 10 GEHampshire 3800 1991 C 10 GEHertfordshire 1600 1990 B 12 AEHumberside 3500 1989 C 10 GEIsle of Wight 400 1986 B 10 CUKent 3400 1990 C 10 GELanes 3100 1988/89 C 10 GELeics 2500 1991 C 10 GELines (part) 400 1986-90 B 10 MAFFLondon 1600 1991 C 5 AEManchester 1300 1988-89 C 10 GEMerseyside 650 1989 C 10 GENorthants 2400 1990 C 10 GENorfolk 5400 1988 C 10 BKSNorfolk (coast) 800 1986-90 *FC/BW 10 MAFFNorfollc(part)
Yorks(part) ,
10 MAFF
North Yorks 2100 1986-90 B 10 MAFFOxon 2600 1991 C 10 GEShropshire (part) 700 1986-90 B 10 MAFFSomerset (part) 800 1986-90 FC 10 MAFFStaffs 2400 1991 C 10 GESuffolk 3800 1986 C 10 GESuffolk (coast) 800 1986-90 C 10 GE
14
County/RegionArea (km') Date Black/white Scale Company
colour (1:n,000)
Surrey 1700 1988 C 10 GES. Yorks 1600 1989 C 1
Tyne and Wear 500 1991 C 15 GEWilts 3500 1991 C 10 GEWest Midlands 1600 1989 B 8 AEWest Midlands (part) 400 1986-90 B 10 MAFFWest Sussex 2000 1986 C 10 GE
2. WALES
Dyfed
(Carmarthen) 1200 1986 BW 10 MAFFDyfed
(Cardigan) 700 1989 C 10 CUGwynedd
Snowdonia 4000 1986 C 10 GENational ParkLleyn 300 1991 C 10 MAFF
Gwent 1400 1991 C 5/10 GEPowys i)West 900 1981 BW 10 MAFFii) North East 900 1990 BW 10 MAFF
Radnor 400 1986-89 C 10 MAFFMid Glarnorgan 1000 1991 C 5/10 GESouth Glamorgan 400 1991 C 5/10 GEWest Glamorgan 800 1991 C 5/10 GE
KeyAE AerofilmsLimitedGE GEONEXUK LimitedCU CambridgeUniversityMAFF Ministry AgricultureAir Photo Unit
Infrared
15
4.3 Other sources
4.3.1 Ministry of Agriculture, Fisheries and Food Air Photo Unit
The MAFF Air-Photo Unit in Cambridge acquires photography in support of MAFF activitiesin agricultural research and monitoring. A flight index map of recent photography (1986onwards) is available and regular updates are sent to APAS at OS. The Unit holds recent,medium scale (1:20,000) photography of eight of the national parks in England and Wales andregularly acquires large scale (1:10,000) air-photography within Environmentally SensitiveAreas (ESAs). In addition, since 1986 the MAFF air photo unit has flown large blocks ofphotography dispersed throughout England and Wales, frequently in colour and mostly at1:10,000 scale.
MAFF air-photography is likely to provide a useful source of information for a strategic rivercorridor overview, in the more remote areas of England and Wales.
4.3.2 Royal Commission for Historic Monuments, Air-Photo Library
The Department of Environment (DoE) air-photo library is now housed with the RoyalCommission for Historic Monuments. The library is divided into two main sections:
a specialist collection of 500,000 oblique air photographs illustratingarchitectural, archaeological and landscape subjects;a general collection (various scales, dates) of 4 million vertical air photographsderived from OS, RAF and various commercial sources covering the period 1929-85.
The majority of the vertical air photography is black and white and medium scale (1:20,000).Post 1985 photography is not being added to the archive of vertical air-photographs. In thecontext of the NRA river corridor survey, this source of photography will only be useful inproviding historical information. The patchy coverage of oblique photography makes itunsuitable for a survey of the sort envisaged unless landscape attributes are deemed important.However, it could be a useful factor in planning rehabilitation of degraded sites to previousstatus.
4.3.3 GEONEX UK Limited
GEONEX (formerly G.A. Storey and Partners) of Mitcham, Surrey, is a commercial airsurvey company with an extensive archive of air-photography of large to medium scales, oftenin colour. Much of this is county cover, the most recent of which (Oxfordshire, Hampshire,Wiltshire, Leicestershire, Staffordshire, West and East Sussex) was flown at 1:10,000 scalein colour to coincide with the 1991 population census.
The extensive coverage of large scale and mostly recent air-photography acquired byGEONEX represents a potentially important source of information for a river corridoroverview.
16
4.3.4 Hunting Aerofilms Limited
Aerofilmsfly a considerableamountof air-photographyeach year, mostlyfor countycouncilsat 1:10,000scale in colour. The regular update of county-levelair-photography,means thatAerofilms is another importantpotential source of photography for a national overview ofriver corridors.
4.3.5 Other aerial photography
Other sources of aerial photographsinclude NRA Thames,Wessex and Southernregions. Astrong landscape element is inherent in most of the source material.
4.3.6 Other platforms
Remotely controlled blimps, model planes and even kites have been used for small scale orsite specificdata collection. In termsof a nationaloverview,these are unlikelyto be of muchvalue.
4.4 Aerial video
Extensiveaerialvideo surveyshavebeenflownby NRASevernTrentregion initiallyassessedon the Severn-Vyrnwyand then on the River Tame, R. Avon and the Severn Estuary (seeAircraft (and Helicopter)UtilisationStudy 1992).
4.5 Cost of air-photographv
The acquisition of new air-photos in England and Wales remains uncoordinated. Anationwidesurvey(EnglandandWales) as proposedfor the StrategicOverviewwill thereforehave to rely upon obtainingcoveragefrom a numberof different sourcesplus commissioningnew flights of the remaining areas.
4.5.1 Air photo acquisition costs
The costs of purchasingexisting air-photoprints vary according to the organisationand thenumberof prints ordered. At 1:10,000scaleeachprint covers approximately5 km2,requiring48,000 prints (including 60 per cent stereo overlap) to cover England and Wales(151,000km2). At an average cost of f10-15 per print, the total cost would be E480,000-720,000 or E3.20-4.75/km2.
The costs of acquiring new air photographyare much higher, but an average figure wouldbe E7.50/km2,for full stereo, roughly twice the cost of purchasingexisting photography. Itwould therefore cost more than O. M (£1,132,500)to acquire new air-photography forthe whole of England and Wales.
17
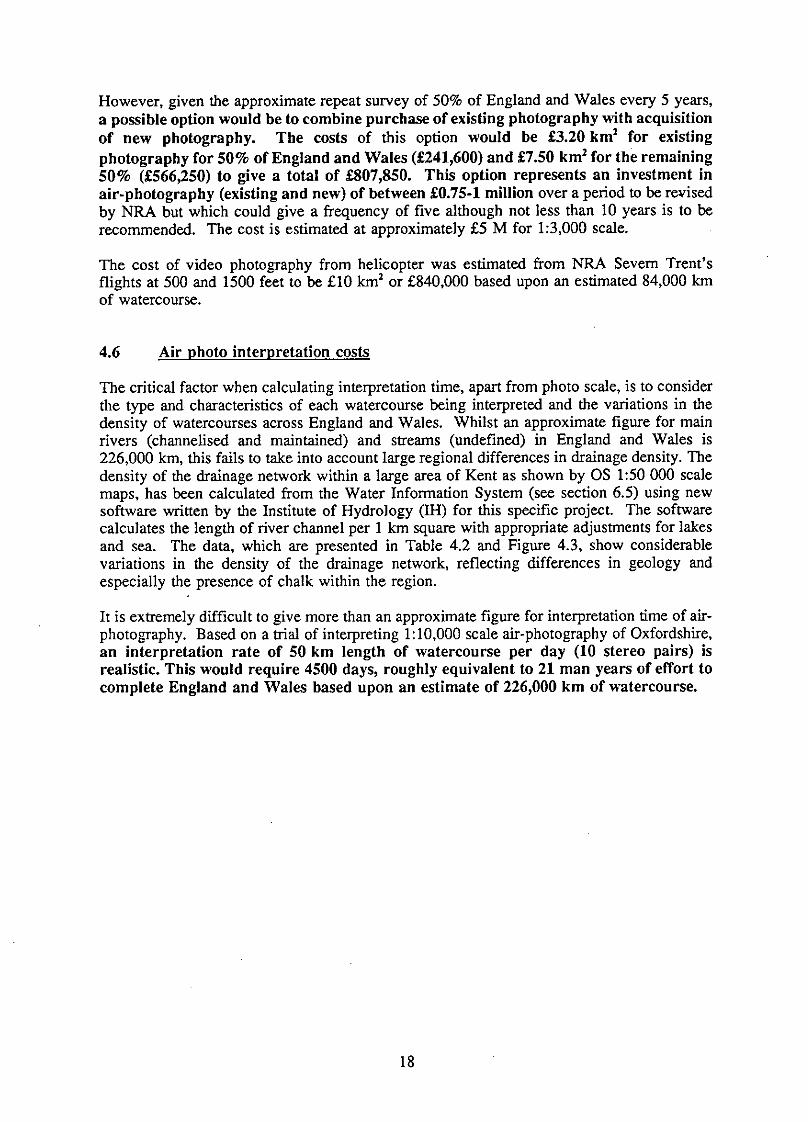
However,given the approximaterepeat survey of 50% of England and Wales every 5 years,a possible option would be to combine purchase of existing photography with acquisitionof new photography. The costs of this option would be £3.20 km2 for existingphotography for 50% of England and Wales (£241,600) and £7.50 km2for the remaining50% (£566,250) to give a total of £807,850. This option represents an investment inair-photography (existing and new) of between £0.75-1 million over a period to be revisedby NRA but which could give a frequency of five although not less than 10 years is to berecommended. The cost is estimated at approximately£.5M for 1:3,000scale.
The cost of video photographyfrom helicopter was estimated from NRA Severn Trent'sflights at 500 and 1500feet to be £10 km2or £840,000based upon an estimated84,000kmof watercourse.
4.6 Air photo interpretation costs
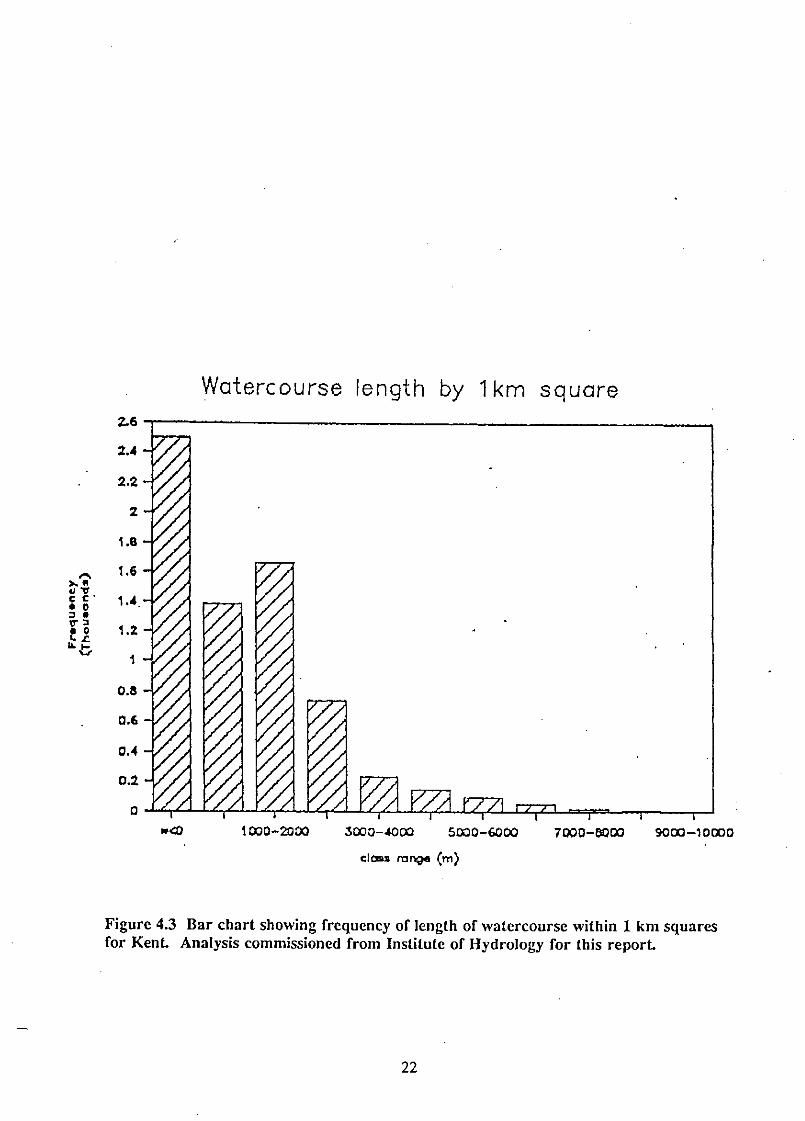
The critical factor whencalculatinginterpretationtime, apart from photo scale, is to considerthe type and characteristicsof each watercoursebeing interpretedand the variationsin thedensity of watercoursesacross England and Wales. Whilst an approximatefigure for mainrivers (channelised and maintained) and streams (undefined) in England and Wales is226,000 km, this fails to take into accountlarge regionaldifferencesin drainagedensity.Thedensity of the drainagenetwork within a large area of Kent as shown by OS 1:50000 scalemaps, has been calculated from the Water InformationSystem (see section 6.5) using newsoftware written by the Institute of Hydrology (IH) for this specific project. The softwarecalculatesthe length of river channelper 1 km squarewith appropriateadjustmentsfor lakesand sea. The data, which are presented in Table 4.2 and Figure 4.3, show considerablevariations in the density of the drainage network, reflecting differences in geology andespecially the presence of chalk within the region.
It is extremelydifficultto give more than an approximatefigure for interpretationtime of air-photography. Based on a trial of interpreting1:10,000scaleair-photographyof Oxfordshire,an interpretation rate of 50 km length of watercourse per day (10 stereo pairs) isrealistic. This would require 4500 days, roughly equivalent to 21 man years of effort tocomplete England and Wales based upon an estimate of 226,000 km of watercourse.
18
Table 4.2 Variations in drainage network density (Kent) expressed by 1 km square from1:50,000 digitised map
Extrapolationfor river/streamlength in Englandand Walesmean estimate
(1.35)
162,000maximumestimate 365,000
NRA quoted figures kmMain river - statutory 45,000Headwaters(post order streamsestimate, Lyle & Smith) 181,000Combinedlength of channel 226,000Drains within InternalDrainageBoards and outside 150-250,000(Dawson 1985,report to WRc)
4.7Air-photo2raphy; information content
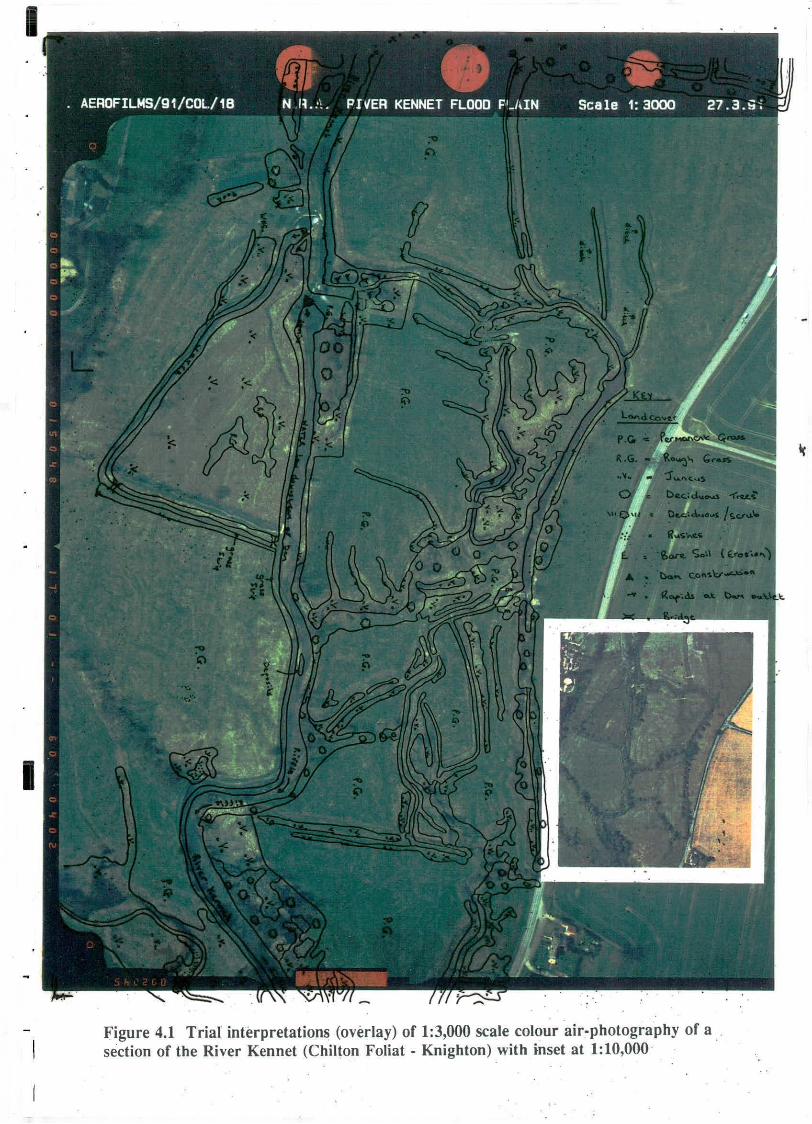
A trial interpretationof 1:10,000and 1:3,000scalecolour air-photographyof a section of theRiver Kennet (ChiltonFoliat - Knighton)was undertakento determine the type and qualityof river corridor informationthat could be interpretedfrom these two scales of photography(Figures 4.1 and 4.2).
This is summarisedin Table 4.3, in which the type of features of interest for a river corridorsurvey (NCC draft, Appendix4) are comparedwith those interpreted for the River Kennet.The table also includesan assessmentof whichfeaturesof interest in environmentsother thana typical lowland river, could be interpretedfrom air-photography. This is based partly onexperience gained from interpretingair-photographyfor the Monitoring Landscape Change(MLC) study (HTS, 1986)in which a sample of air-photographywas used to map changesin land cover in England and Wales between 1947 and 1982. There is little availableinformationon the use of air-photographyfor mappingmany of the smaller features of riverbank and river habitat. Air-photographycoveringa widerrange of environmentswould needto be evaluatedduringthe validationstagebeforemakingdefinitivestatementsabout its valuefor detailed river habitat mapping.
19
Figure 4.1 Trial interpretations (overlay) of 1:3,000 scale colour air-photography of asection of the River Kennet (Chilton Foliat - Knighton) with inset at 1:10,000
. AEROFILMS/91/COL/1B NILA. RIVER KENNETFLOODPLAIN Scale 1:3000 27.3.G1 •
5 dr- re
AEROFILMS/131/COL/132
Figure 4.2 Trial interpretations (overlay) of 1:10.000, scale colour air-photography of11section of the River Kennet (Chilton Fohat - Knightow s‘ith inset at 1:25,000 scale ofsimilar data
Figure 4.3 Bar chart showing frequency of length of watercourse within 1 km squaresfor Kent. Analysis commissioned from Institute of Hydrology for this report.
22
Two sets of aerial photographywere acquiredin differentmonthsduring 1991. The 1:3,000scale photographyacquired under winter vegetationconditions in March gave much betterdiscriminationbetween certain land cover types, e.g., rough pasture and marshy grassland.At full summer growth in September, these differences were much less apparent on the1:10,000 scale air-photography. An additional problem is deriving information onwatercoursecharacteristicsalong stretcheswhich are fringed with trees.
In general, both the 1:10,000scale and 1:3,000scale air photos could be used to map areafeatures (Table 4.3) but the larger scale (>1:5,000)photographyfacilitates interpretationofmore detailedriver bank and habitatfeatures. It will be importantto interpretdifferenttypes(black and white/colour)scales (1:20,000-1:3,000)and dates of air-photographyfor a rangeof environmentsto establisha workableclassification. This will require a limited amount offieldworkto validate interpretation.
Processing potential
Aerial photographs
It is now feasible and relativelycheap to digitise air-photography,enabling the image to beprocessed using standard image processingtechniques and should be explored as part of avalidationexercise. The cost of digitising(perhapsEl0-20 per print) and the large quantitiesof data involved, may mean that this is impracticalexcept for priority areas. For example,a standard (23 cm x 23 cm) 1:10,000scalephotographdigitisedat 50 microns (i.e. 0.5 m onground)representsmore that 20 Mb of data or 700 Gb per colourfor Englandand Wales; thedata producedby this processcould be reducedby only digitising,at this high resolution,thecorridorwithin say 100 m either side of watercoursesor by computerwithin say 150 m fromthe OrdnanceSurvey blue-linewatercoursedigitiseddata.
Existing image classificationsoftwarefails to utilise importantpattern, context and textureparametersthat are essentialfor successfulclassificationof very highresolutionimagerysuchas air-photography. However,in the mediumit may be feasible to mosaic a large numberofair-photoprints for a region of interest and store the imagery on optical disc, enabling theuser to display an area of interest for detailed interpretation on a colour monitor.Interpretationwould be assistedby overlayingancillary vector map information (drainage,woods, settlementsetc.) onto the photo image.
Aerial video
The apparentlyhigh resolutionof aerialvideodata is primarilyrelated to interpretationby thehuman eye. Despite the use of good quality (broadcast) video cameras with 450 lineresolution,spatialcorrectiontechniquesforcapturedframesanddensityenhancement,thedatacontentis relativelylow andall the abovementionedproblemsof imageclassificationremain.
4.8 Air-photography; information capture
Whatevermethod is adopted,there will be a basic requirementfor the data to be rectified toa base map. This can be achievedat different levels of precision depending upon the typeof data and the extent of the relief.
23
Table 4.3 A trial comparison of photo interpretation of air photography from RiverKennet into NCC RCS classification classes
Tall Herb and Fen1.Bracken no yes2.Upland mixed no no3.Tall ruderal and
ephemeral no no
24
River corridor Identifiedon Possible tohabitat R. Kennet identify fromclassification air-photography colour air-
photography
Heathland1.Drydwarf-scrub no yes2.Wet dwarf-scrub no yes3.Lichenand bryophyte
heath no ) upland) heath
4.Mountainheath no5.Heath/grassmoor no yes
Mire, Flush and Spring1.Bog/fen no yes2.Bog flushes no yes
Swamp inundationcommunities1.Swamp yes yes
Open Water1.Canals no yes2.Ditches yes yes3.Ponds,pools,
cut-off meanders yes yes4.Lakes (Iochs/llyns) no no5.Gravelpits no yes6.Reservoirs no yes7.Steams yes yes
Coastland
Rock1.Naturalrock no yes2.Quarries/mines no yes
MiscellaneousLArable yes yes2.Amenitygrassland yes yes3.Ephemeral/shortherb no difficult4.Hedges yes yes
25
River corridor Identifiedon Possible tohabitat R. Kennet identify fromclassification air-photography colour air-
photography
BANK FEATURESBank morphology
1.Shelves no yes2.Earth/rockcliffs yes3.Artificialbanks no yes4.Canalised yes yes5.Flood banks no yes6.Bank height no large scale7.Bank width no large scale8.Bank slope no no
Bank Composition1.Mud no yes2.Sand no yes3.Earth no yes4.Bare shingle no yes5.Vegetatedshingle no yes6.Naturalcobbles/boulders no yes
Bank vegetation1.Conifers no yes2.Broadleaf yes not to species3.Scrub yes yes4.Reed yes yes5.Ruderals,herbs,
grasses (densecover) yes yes
RIVER HABITATS
Inlets yes yes
Depth no no
Width yes yes
26
River corridor Identifiedon Possible tohabitat R. Kennet identify fromclassification air-photography colour air-
photography
Substrates- bed rock no no- boulders no no- cobble/pebble/gravel no no- mud/silt/clay no no- peat no no
Flow- pool/slack yes yes-riffle yes yesrun no norapids no yeswaterfall no yes
-protrudingrocks no difficultmargins (shingle,
mud, sand) yes yes
FLORA
Emergent marginalfringe yes yes
River flora no no
Algal cover no possible if dense
4.8.1 Photogrammetric mapping
A standardphotogrammetricplotter or more advancedanalyticalplotter (approx. £100,000),is used to create a 3-D model of the surfacefrom pairs of stereo air-photographsfrom a setof ground control points (GCPs). The interpreteris then able to map directly onto a base,e.g., 1:10,000 scale. The results can be encoded into a GIS simultaneously or digitisedsubsequently. A comparisonof the two methodswill be necessaryespecially with respect toaccuracy.
The high precisionattainablefrom photogrammetricmappingis achieved at a relatively high cost compared with other methods, but in areas of very steep terrain this may be the only method that providesresults of acceptableaccuracy. This was the conclusion of the Nature
27
Conservancy Council (now English Nature) National Countryside Monitoring Scheme(NCMS), which used a sample of air-photography to map habitats in selected counties ofEngland and Wales and for Scotland.
Zoom Transferscope
A lower cost option is to match the air-photo interpretation to a base map using a zoomtransferscope (cost of machine £10,000). This instrument allows the user to match two maps(i.e. interpretation and base map) of different scale and plan. With some instruments digitalencoding can be accomplished at the same time. The advantage of including the base mapat the interpretation stage is that the river network from Ordnance Survey is visible to assistwith interpretation as some OS maps are not entirely accurate with respect to rivers, especiallyat 1:50,000 scale.
Rectification of digital maps
A correction for scale distortion in digital air-photography is relatively straightforward inareas of gentle relief. GCPs identifiable on both the digitised air-photography and the base-map are recorded, enabling the air-photo data to be rectified to the base by re-sampling theimage data (£10-£20 each). To correct for distortion introduced by topography would requirea digital terrain model (DTM). Whilst DTMs of the UK exist (see section 6), the costs ofpurchasing high resolution data (5 m contour interval) to give sufficient accuracy are unlikelyto justify the additional accuracy (or to be available).
A more practical technique would be to rectify interpretation maps derived from air-photography within the GIS. Different riverine attributes, e.g., bank morphology, riparianvegetation, stream-bed substrate, could be digitised as separate files and analysed within theGIS using a model that relates these and other attributes from ancillary data, e.g., soils,adjacent land cover to river corridor quality.
Rectification, for example, of oblique video frames is required and various techniquescontinue to be developed by The Geodata Unit at Southampton University.
4.9 Date of baseline survey
(a) Establishing a baseline
The variable dates for which air photographs are likely to be acquired across England andWales means that the date of the baseline survey will have to cover a specified number ofyears. For example, for a survey commencing in 1993, the baseline could be 1990-94, witha repeat every 5-10 years. Alternatively as recent data already exists for half the county thena frequency of 10 years could be used if the remaining half could be flown within five years.It may be advantageous to undertake the survey progressively over an extended period, witha repeat survey of each county, catchment, etc., every 5-10 years depending upon monitoringrequirements. This would simplify the acquisition of new air photography which could thenbe spread over a longer period. This is an important logistical point given that one air surveycompany is unlikely to be able to fly more than four or five counties (5-10% of county) ineach season under typical weather conditions.
28
(b) Monitoring requirements
It is also likely that the conservationstatus of particular reaches of river will change morequickly in areas subject to greater human pressure. The repeat cycle should therefore beshorter in these areas. Similarly,more effort should be concentrated on these stretches ofriver possibly involving a range of survey techniquesfrom air photography to detailed,fieldsampling including flora, fauna, fish and water chemistry. The larger rivers and theirfloodplainswould be included in this category,especially those where the potential impactof flood defence activitiesis large and which may also be important for fisheries, recreation,navigationetc.
A hierarchicalsystem is thereforeenvisagedinvolvingdifferent intensities of monitoring inboth fime and space based upon a range of techniques. Considerationwill need to be givento the samplingproblemsassociatedwith selectingrivers for more intensive monitoring,theirdistributionwithin England and Wales and the repeat frequency of surveys.
29
30
5. MULTI-SPECTRAL IMAGERY
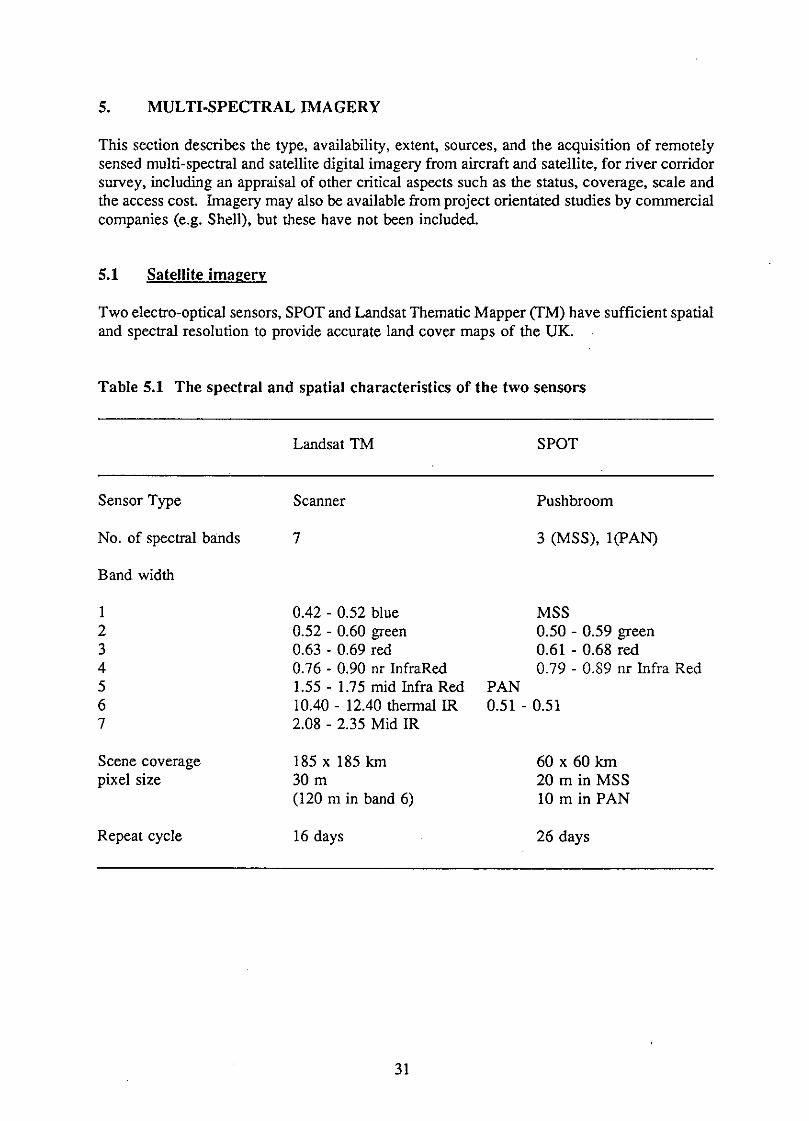
This section describes the type, availability,extent, sources, and the acquisition of remotelysensedmulti-spectraland satellitedigitalimageryfrom aircraftand satellite, for river corridorsurvey, includingan appraisalof other criticalaspectssuch as the status, coverage, scale andthe accesscost. Imagerymay alsobe availablefromproject orientatedstudiesby commercialcompanies(e.g. Shell), but these have not been included.
5.1 Satellite imagery
Twoelectro-opticalsensors,SPOTandLandsatThematicMapper(TM)have sufficientspatialand spectralresolution to provide accurate land cover maps of the UK.
Table 5.1 The spectral and spatial characteristics of the two sensors
LandsatTM SPOT
Sensor Type Scanner Pushbroom
No. of spectralbands 7 3 (MSS), l(PAN)
Band width
1234567
Scene coveragepixel size
Repeat cycle
0.42 - 0.52 blue0.52 - 0.60 green0.63 - 0.69 red0.76 - 0.90 nr InfraRed1.55- 1.75 mid Infra Red10.40- 12.40thermalIR2.08 - 2.35 Mid IR
185 x 185km30 m(120 m in band 6)
16 days
MSS0.50 - 0.59 green0.61 - 0.68 red0.79 - 0.89 nr Infra Red
PAN0.51 - 0.51
60 x 60 km20 m in MSS10 m in PAN
26 days
31
The advantages of satellite imagery include:
large area coverage (Landsat 185 km x 185 km),repeat imaging (typically 16 days under cloud-free conditions),digital image data with wavelengths ranging from visible blue (TM1; 0.45 - 0.52microns) to thermal infrared (TM7; 10.4 -12.5 microns),good geometric propertiesrelatively low cost
All these attributes need to be assessed in relation to information content compared withhigher resolution airborne photographic and scanning systems.
The digital nature of the image data enables scenes to be contrast-enhanced for maximumbrightness and contrast to facilitate interpretation and for each scene to be rectifiedgeometrically, for example to the GB National Grid. Multi-spectral image data can also beclassified using rapid computer-assisted techniques into broad land cover types over largeareas. For these reasons satellite imagery is a valuable tool for mapping at regional levelnotably river catchment, county, national park and national level.
5.1.1 LANDSAT Thematic Mapper (TM)
The TM sensor was launched in 1982 on-board the Landsat series of satellites. With 7spectral bands, including near and middle infrared and a spatial resolution (pixel size) of30 m, this sensor represented a major improvement on the earlier multi-spectral scanner(MSS). The 30 m pixel size appears to be optimal for mapping landcover in UK, giventypical field size (Townshend, 1984). The inclusion of a mid-infrared waveband (TM5:1.55-1.75 microns) provides considerable additional discriminatory power for vegetationmapping.
The sensor has been used for a number of land cover mapping projects in the UK. Thecurrent land cover map of the UK being produced by ITE (Monkswood) is the mostimportant of these. Hunting Technical Services Limited (HTS, 1986) produced a land covermap from classified TM data as part of the Monitoring Landscape Change (MLC) project.These data are summarised by county and a copy of the land class map is archived with theRural Areas Database (RAD), at the University of Essex. Particularly relevant in the contextof river corridor survey is the project undertaken by the National Remote Sensing Centre(NRSC, 1990) for IFE, to map land cover change in two water catchments (River Hodder andRiver Axe). A land cover map for each catchment was produced at two dates fromcomputer-assisted classification of the multi-spectral image data and the results presented byparish, sub-catchment and river corridor. GIS software was used to delimit a 100 m zonearound each watercourse and this buffer was intersected with each class map to show changein land cover adjacent to each watercourse over a 12 year period.
Once the ITE satellite land cover map is completed (1993) and incorporated into a database or geographical information system, land cover adjacent to each watercourse inEngland and Wales could be determined by integrating the land cover map with adigitised drainage network.
32
5.1.2 SPOT
SPOT 1 was launchedin 1986,and SPOT2 in 1990. With a 20 m pixel size in multi-spectral(XS) mode and a 10 m pixel size in panchromatic(Pan) mode, a considerable improvementin spatialdetail was obtained. However,by adoptingsolid state array (CCD)technology,thenumber of wavebands is limited to 3 (visible green, visible red and near-infrared), therebylimiting discriminationof vegetationtypes. Each scene is only 60 x 60 km, compared with185 km x 185 km for Landsat,resulting in an increasein cost per square kilometre.
The most important development available from SPOT imagery is the interpretation ofrelatively large scale (1:25,000) hard-copy imagery based on combining the spectralinformationof the multi-spectraldata (XS) with the spatial detail of the panchromatic(pan)data. This SPOT image integrationtechniquehas been used recently by Hunting TechnicalServicesto produce enhancedhard-copyimageryof Cambridgeshire. Whilst spatial detail isconsiderably enhanced, allowing for very accurate interpretation of land cover features,resolutionis not sufficient to map river corridor habitats in the detail shown in Table 5.1.
5.1.3 Other satellite sensors
ERS-1
Data from this satellite,whichcarriesa rangeof microwaveremote sensingequipment,is justbeginning to become available. The main instrumentis the Active Microwave Instrument(AMI) which can operate as a SyntheticApertureRadar (SAR) which produces high qualityradar images over a 100km swath width and can operate through heavy cloud cover. Usesare expectedto be include land use surveys,ice or oil slick movementsat sea and warm/coolair front movementsplus seawatertemperaturefrom the Along Track Scanning Radiometerand a radar altimeter for ice sheet and sea level variation. The SAR (image mode) has a30 m pixel size providingdata suitablefor land cover mapping. The advantageof the systemis all-weather capability but techniques for derivation of land cover information are lessadvanced than for optical sensors.
5.1.4 Satellite costs; data and processing
Approximately15 LandsatTM scenesare needed to cover England and Wales. At a cost of£2000 per scene, total cover would cost £30,000. In addition, image rectification to thenational grid, computer classification and summary of results by, for example watercatchment, would probably cost a further £150,000. However, much more accurate resultscan be obtainedby classifyingtwo scenes acquiredat different times in the growing season.This is the techniqueadoptedsuccessfullyby ITE Monk's Wood to classify TM data of UKinto a maximum of 22 land classes. The additional accuracy is obtained by effectivelyobtainingtwo spectral signaturesfrom each land parcel, but the penalty is a doubling in datacosts.
It would be possible to buy from ITE the TM derived land class map of England andWales to correspond to the first strategic River Corridor Overview. However, futuresurveys would need to update this databasefrom additionalLandsat scenes.
33
Experiencewith SPOT suggests that despite its superior spatial resolution, the absenceof amid-infraredchannelis a majordisadvantagecomparedwith TM for land classification. Thealternative,integrationof SPOT XS/Pan to produce enhanced hard-copy imagery for visualinterpretationis a feasiblebut costly alternative. A minimumof 50 SPOT scenesis requiredto cover EnglandandWales. At £1300 for XS data and £1550 for SPOT Pan data, total costis £65,000 for XS and £77,500for Pan, to give a total of £142,000for the cost of raw dataalone.
SPOT data can be acquiredin stereo but there is very little availablefor the UK.
5.2 Airborne imagery
5.2.1 Airborne thematic mapper (ATM)
The DaedalusAADS 1268is an 11-channel,digital airbornescannerrecordingvarious bandwidths of approx.0.05-.3micronin the 0.42-13.00micronregion. With a fixed instantaneousfield of view (IFOV)of 2.5 milli-radians,pixel size is a functionof flying height. At 1000mfor example, pixel size is 2.5 m and swath width is 716 pixels x 2.5 m (1790 m). Theadvantageof this electro-opticalscannercompared with conventionalair-photographyis theavailabilityof spectral channelsfrom the visible, near-infrared,short and long wavelengthinfrared, providingpotentiallymuch greater discriminationof surfacefeatures.
Table 5.2 Swath width and flying height for AADS-1268 ATM
flown witha 5 m pixel size(nominal)overBourton-on-the-Water(River Windrushand RiverDickler)revealsconsiderablevariationin landcoverinformationidentifiableon 1:10,000scalehard-copyimagery. In particular,water bodies are displayed more clearly on the imagerycontaining middle and thermal infrared channels (ATM 9, 10, 11),whilst differentiationof marsh/swamp vegetation is more apparent on imagery containing visible andnear-infrared (VNIR) channels (ATM 3, 5, 7).
Research would be required to determine the optimal combination of spectral channelsrequiredfor specificriverinehabitats. Hooper(1990)has used various band combinationsofATM data (7, 10, 5; 11, 5, 3) with a 2 m pixel size to develop relationships betweenbiophysicaland spatial characteristicsof vegetationand fluvial processes.
The followingvegetativeand morphologicalattributescould be identified:
1. Vegetationgraminaceousspeciesseparablefrom tree and herbaceous species on the basisof vigour and textureaquatic plants on riffle sequenceslarge monospecificstands of some submergedand emergent aquatic species
35
2. Hydrogeomorphic featuresover-topping level inferred from vegetation characteristicslongitudinal and point bars: separable on the basis of vegetation and substratecharacteristicspool/riffle sequencesbank slope
One potential advantage of using scanner data is the scope for rapid classification of featuresfrom digital multi-spectral data. Contextual classification systems i.e. analysis of the spatialarrangement of pixels, can considerably aid classification but the software is currentlyprimitive and misclassification, especially of mixed pixels, and the absence of contextualinformation within the classification procedure, considerably reduces the level and accuracyof detail that can be obtained from classification of ATM data.
A major problem with scanner data is its poor geometric properties. In the turbulent loweratmosphere, variations in aircraft altitude and attitude induce major geometric errors in thescanner data. The Natural Environment Research Council (NERC) in collaboration with theUniversity of Cambridge (Bernard Devereaux, Department of Geography), is investigating thepossibility of using a calibrated video camera on the aircraft nose to identify GCPs on bothvideo image and corresponding map to enable the precise orientation of the aircraft to bereconstructed. This information can be used to calculate the appropriate correction to theimage data.
5.2.1.1 ATM costs
In the UK, the Daedalus scanner is operated by Global Earth Sciences. The system is hiredon a day rate, the amount dependent upon the number of days of hire. It is not possible,without consulting the operator directly, to calculate data costs for a region. The NRArecently commissioned flying of the south coast of England. However, the enormous amountsof data generated by the scanner suggest that flying selected areas is the only practical option,possibly along the course of a number of rivers of contrasting flow and environmentalcharacteristics.
5.2.2 Imaging spectrometry - CASI
The Compact Airborne Spectrographic Imager (CASI) is an imaging spectrometer operatingin the pushbroom sampling mode, that is, being solid state matrix of charged couple device(CDD) detectors (288 x 576). It receives reflected visible light continuously and samples aline of these data simultaneously across a swath of 512 columns. The field of view is 30/45°in width and therefore the size of pixels are dependant on the flying height. In contrast tothe 11 relatively broad bands of the Daedalus ATM, the spectral response of CASI is dividedinto 288 channels of 1.8 nm band width spectral resolution over the more limited 400-900 nmband width without full infra-red. CASI can be programmed for specific requirements whichcan be changed in-flight.
36
Figure 5.1 A comparison of three different waveband combinations (simulated true colour, with near infrared and with thermal bands) from digital Airborne ThematicMapper data (see text); the original sheets have been reduced from 1:10,000 to approx.1:20,000to show the range of variation in colour and thus interpretation, available.
á
A demonstration of CASI data output was arranged at Chilworth Manor on 8 January 1992.This comprised survey flight data by ATM over the three mile coastal zone of SouthernBritain from London to Bristol together with examples of CASI data; this was funded by theNRA and project lead by Dave Palmer of NRA Wessex Region as a feasibility study underthe auspices of the Chief Scientist, Jan Pentraeth.
5.2.3 Other scanners
Other systems include:
GER (Geophysics Environmental Research) high resolution and radiometric resolutionscanners. It has two scanner systems; the first combines 63 channels, 24 channels of25 nm-wide in the visible/near infra-red in the 0.5-1.08 micron region, 7 of 120 nmwidth in the near infra-red and 32 of 16 nm width in the infra-red 2-2.5 micronregion; the second scanner system has 24 channels of various widths in the 0.4-14micron range.
ATTA Advanced Terrain Tracking Radar Altimeter. This was available for test byNERC in 1990 on behalf of Rutherford Appleton Laboratory, for significantwave-height measurements.
The choice of an imaging spectrometer-based survey technique for rivers is less straight-forward than for marine coastal use because of the significance of geometric corrections andthe objectives of coastal surveys. The possible selection and ordering of a CASI scanner withits modified ancillary thermal spectrometer must in economic terms bias the choice especiallyas the proposed quarterly flights of the English and Welsh coasts will only utilise half thepotential flight time. This may allow flying the land area of England and Wales within a fiveyear period presuming that the NRA has total control of the use of the aircraft.
Sideways microwave scanners could be investigated for use in the assessment ofgeomorphological features.
5.2.4 Other data
NERC Register of imagery
ESA landsat LEDA data base on ESA Information Retrieval System, Frascati, Italy.
5.3 Comparative summary of photographic and digital imagery
Rapid developments in remote sensing technology, both in data acquisition and analyticaltechniques, makes it difficult to specify a particular technique for all areas. However, anumber of factors are important when comparing the potential contributions of differentimaging systems for a national survey of river corridors including:
39
data availability; stereo air-photography is available and continues to be flown forlarge areas of England and Wales. By contrast, data from airborne scanners/imagingspectrometers is restricted in coverage and likely to remain so;
data resolution; air-photography is very high resolution but is limited spectrally to thevisible wavelengths. Alternatively, airborne scanners have a relatively coarse spatialresolution compared with air-photography but acquire data in the middle and thermalinfrared giving considerably greater discriminatory power.
The spectral range of imaging spectrometers varies (CASI is restricted to the visibleand near-infrared) but their very narrow bandwidths may assist with vegetation speciesdiscrimination and assessment of water quality. Detailed research is required todemonstrate this; there has been very little substantive work published to date.
The spatial resolution of current satellite systems is too coarse for detailed rivercorridor studies, but the large area coverage and frequent image acquisition is ideallysuited to mapping land cover change at the regional, especially catchment, level;
data processing; air-photography requires time-consuming visual interpretation andmanual digitising of interpretation results prior to machine processing and analysis.Digital data from scanners etc. are in a machine compatible format but the techniquesfor information extraction are primitive compared with the very detailed level ofinformation that can be interpreted by the human eye from high resolution air-photography. It is unlikely that substantial improvements in information extractionprocedures from digital imagery will be developed in the short-term; this will have toawait developments in knowledge-based systems.
Rectification to a map base of all imagery, including from satellites and air-photography, is needed prior to data entry into a GIS for analysis and display. Theprocedures for digital rectification of satellite imagery and air-photography are well-established and relatively straightforward, although expensive for air-photography inareas of steep topography where high precision is required. Although the geometricproperties of imaging spectrometer data are superior to airborne scanner data,considerable research is required to develop accurate techniques and practicaltechniques for both types of system;
data costs; satellite imagery is the cheapest option but information content isconsiderably lower compared with airborne systems. Acquisition of large-scale air-photography (existing and new) for England and Wales is less than El M. It isdifficult to estimate costs for airborne scanner/imaging spectrometer data but fullcoverage (England and Wales) would be expensive.
In summary, it is clear that the basic data source should be large scale (e.g. 1:10,000-1:3,000)colour air photography. Interpretation of this photography should be supplemented by datafrom the airborne scanner and imaging spectrometer at a number of contrasting sample sitesduring the validation stage of the project to assess the potential of these systems for derivinginformation, especially for detailed species mapping of aquatic and riparian vegetation, notvisible on colour air-photography.
40
6. ENVIRONMENTAL DATA SOURCES AND INFORMATION SYSTEMS
6.1 Introduction
A major task during the validationstage of the project will be to examine the possibility ofincorporatingvarious 'layers' of environmentaldata into a GIS as the first step towardsestablishinga predictive system for measuringenvironmentalquality/conservationvalue ofriver corridors. This will require firstly, a consideration of the databases available andsecondly,the informationsystemsavailablefor analysisof environmentaldata, includingdataderived from air-photography/fieldsurvey specificallyfor the national RCS.
A numberof nationalenvironmentaldatabasesand informationsystems are described below,with comments on status, data content, coverage, resolution, cost and applicability of thesystemfor river corridor survey.
6.2 Environmental data sources
6.2.1 Ordnance Survey (OS)
A wide variety of digital map data are availablefrom Ordnance Survey but, apart from themethodologyof collection,data are constrainedby thepositionalrequirementsof printed mapproduction. For example, the position of watercoursesare displaced when in proximity toroads.
Map data of interest include:
• Scale digital height data as 1:10,000height, 1:50,000contours/DTMwithaccuracyto 3 m, in 5/20 km squares
• Boundaryrecord data at 1:10,000for county,district,parish and constituencies(fromMarch 1992)
(BartholomewGB digitisedheight)
6.2.2 Institute of Hydrology (IH)
Hydrologicaldata are kept in the Surface Water Archive on an ORACLE database at IH.Rainfall and discharge data on some 1750 sites over the last two decades together with arecord of number of years and their completenessare regularly updated.
6.2.3 SSLRC Land Information System - LANDIS
The aim of the Soil Survey and Land ResearchCentre (SSLRC), Land Information System(LandIS) is to organise existing soil data to facilitate its effective use. SSLRC has usedLandIS to capture soil data and maps in a digital form for statistical, tabular and graphicaloutput via a reladonal databasemanagementsystem.
41
The type and resolution (cell size) of data held within LANDIS are given in Table 6.1. Anumber of these parameters, particularly soil type, rainfall and temperature couldprovide valuable inputs for the prediction of the environmental quality of a watercourseat a given site.
6.2.4 ITE land classification system
The ITE Land ClassificationSystem provides a frameworkfor sampling variability in thelandscape. The system incorporates a wide range of environmentalvariables, includingclimate, topography,humangeography,solid and superficialgeology.The principle behindthe land classification is that the significant ecological variables are associated withenvironmental variables, e.g. altitude. A statisticalprocedureis then used to allocate oneof 32 Land Classes to each 1 km square in Great Britain.
The land classes show well-definedgeographicaldistributionswhichreflect combinationsofenvironmentalfeatures,therebyprovidinga convenientsamplingframefor ecologicalsurvey.The classificationhas been used as the basis for three major national surveys; 1978, 1984,1990. In the most recent survey, 508 squares of 1 km were visited and sampled, spreadproportionatelyacross the 32 Land Classes,with informationrecordedon plant speciesalongstreams in addition to other habitats.
The robust nature of the Land ClassificationSystem samplingframe, enables regional andnationalpredictionsof these surveyedparametersto be made. In the context of the proposedstrategic River Corridor Overview,the ITE Land Classification System provides both asuitable sampling frame for selecting river sample areas and a potentially useful data-seton land use and plant species in stream habitats.
6.2.5 ITE satellite land cover map of Great Britain
The EnvironmentalInformationCentre (EIC) of ITE Monkswood,is producinga land covermap of Great Britain from Landsat Thematic Mapper Satellite data. The multi-temporalsatellitedata is being classifiedinto22 land coverclasses(fable 6.3) usingcomputerassistedtechniques,with a minimummappablearea of approximately1 ha.The output gives the landcover of each 25 metre cell of the British National Grid. The project is due forcompletion in mid-1993, although all fieldwork and 70% of England and 30% of Waleshas been completed.
6.2.6 National Park land cover data
The CountrysideCommissionfor England and Wales and DoE funded a project at SilsoeCollege to map change in land cover within each of the NationalParks. This is a potentialuseful data-set, providing relatively detailed information on land cover within areas ofhigh conservation value and covering approximately 10% of the land area of Englandand Wales. The most recent interpretationdata is for the period 1986-88and the data areheld within a raster-basedGIS (SpatialAnalysis System- SPANS).
42
Table 6.1 Spatial data held in LANDIS in raster form
CostData Resolution flkm2
Soil map of England and Wales (1:250000)
Selecteddetailed soil maps (1:25 000 and 1:50000)
Altitude (m)Local Authorityboundariesof England and WalesMean annual monthly, summerand excess winterrainfall totals (withstandarddeviations)Accumulatedtemperature(day °C above 0, 5.6 and 10.0; day °Cbelow 0)Growing season - start and end datesPotential soil moisture deficit (PSMD)Crop adjusted soil moisturedeficit for cereals,sugar beet and potatoesField capacity start and end datesMachinery work days and safe grazingdays
100 m1 km50 m5 km5 km1 km5 km
5 km
5 km5 km5 km5 km5 km
0.440.055
Table 6.2 Spatial data from Institute of Hydrology (January 1992)
Data set Type Source Vkm2 Notes
1 km grid 1 km grid
1 km grid
WRAPSAAR
PE
2 day M52 hr rain24 hr rain2 day MS/SAAR25 day MS/SAARTAD barsnowmelt
monthly rainfalls
1:50 k riversDTM grids and rivers
LF grids
IFI 0.02 Winter rainfall acceptance potential0.02 Cunently 1941-70 average annual
rainfallIH 0.01 Potentialevaporation(1941-70)-
grass0.01 (FSR- rainfallstatistic)0.01 (FSR)0.01 (FSR)0.01 (FSR)0.01 (FSR)0.01 (FSR)0.005 (FSR)0.01 (FSR)0.02 pluscommissionto MetOffice/year (whereapplicable)1.003.00 pluslicencefee to OS
Other data sources with subjectdetails and scale or form include:
Boundaries of Sites of Special Scientific Interest (SSSI) from JNCC together withother data of conservationinterestResearch Council data bases and systems EIC, NUTIS, and for classification andground-truthcomparisonsSmallerdatabasesof riverdataeg IFE/SouthamptonUniversitysurveyof managementon main rivers (Brookeset al 1987)GIS databases within the ResearchCouncilsand elsewhere;National rivers water quality surveys 1980, 1985, 1990
6.3 Ancillary map information
A potentially valuable source of informationare maps, both contemporary and historical.Contemporary mapping (1:10,000, 1:25,000 and 1:50,000 scale OS) provide importantthematic information on the distribution of built-up areas, woodland and semi-naturalvegetation and a pattern of drainage includingcut-off meanders. Cover informationis onlyavailablein digitalform for EnglandandWalesat smallscale (1:250,000)but digitalmappingat very large scale (1:1250/urbanplan scale) is available for most urban areas. Restrictedareas are digitised at 1:10,000 scale. The 1:50,000 scale maps (Landranger series) arebeing raster digitised and can be displayed as an image backdrop to other data sets.These could include the distribution of sites of Special Scientific Interest, areas ofOutstanding Natural Beauty and Statutory landscape/conservation designations. Apotentially useful application of this technique is the coincidence of public rights of wayadjacent to rivers as a possible way to evaluate levels of wildlife disturbance. Historicalmaps, e.g. pre-war at 1:25,000scale, may provide useful information on former courses ofrivers.
6.4 Environmental data summary
Databaseswhich may be requiredare variousbut most are of suitable scale, format, type andaxeavailablefor purchaseif not alreadyavailableor previouslyimplementedfor NRA withinits regions. The choice of database or geographical information is of prime importanceparticularly in view of the current IS review within the NRA but cannot be decided uponwithout testing its input requirements, its capability, versatility, simplicity, and output.Informationsourceshave thereforebeen assembledto show the potential range (or gaps) ofdata available for use if the RCS strategicoverviewis taken further.
NRA producedor commissionedground based surveysof river corridors will be importancein testing the approach proposed in this report but will need to be integrated or transferredinto the informationsystem selected.Surveysare howeverselectivein being producedfor thebetter quality sites or as a brief operationalassessmentin response to a proposed change egdredging,development,etc. The currentestimateof strategicfield RCS completedis 13%ofmain river or at minimum 2% of a total estimatedlength of all watercourses (Table 6.4).
This sectionthereforeaims to determinethe informationavailable,its type,extent and sourcestogether with other critical aspects such as the status, coverage, scale and the access cost.
45
Table 6.4 Length of strategic River Corridor Surveys undertaken in main river in eachNRA region to May 1991
The water informationsystem(WIS)has been developedby the Institute of Hydrology(IH),Wallingford more intensively since 1989, with recent collaboration from InternationalComputersLimited (ICL)for potential use by NRA North West.
The system has been designed to assist with national requirementsfor water management,planning and research. A geographicalinformationsystem(GIS) approachhas been adoptedto handle both spatial and time-seriesdata.
The first componentof the system is based on a digital network of watercoursesderivedfrom 0.5. map 1:50,000 scale. A denser drainage network is represented with greateraccuracy on larger scale maps (e.g. 1:25,000 scale), but the expense of recoding contourerrors and joining gaps in the drainage network on the original 0.5. map sheets,precludeddigitising at larger scales, except in restricted areas (e.g. North West National RiversAuthority Region).
The second important component of the system is the raster-based digital terrain model(DTM). al have purchasedcontour data from the 0.5., captured originally from 1:50,000scale maps with a 10 m contourinterval and convertedto a grid of heights with a 50 m cellsize. A major task has been to ensure compatibility between the DTM and watercoursenetwork, requiring a very high level of accuracy during data capture of watercourses.Given the relatively coarse resolution of the DTM, considerable time has had to bedevoted to ensure that watercourses drain downslope along the lowest part of a valleyat all points on the river. By combining the watercoursenetwork and DTM, the user canderive a number of importantparameters of importancefor hydrologicalmodellingand for
46
the managementand planning of water resources in catchments. These include mappingcatchment boundaries and measuring areas, and calculating flow directions and slope ofsteepestdescent.
The third component of the system is the database of River Quality Survey (RQS) dataderived from a network of samplepoints across the country. The system allows the user tooutput results on water characteristics(chemical,biological) at a given location and for aspecified period. By combining spatial data (drainage network) with time-series data(pollution levels) the system can be used to draw river quality survey maps. These mapsshow a river networkwith the width of the river related to flow, and the colour to the degreeof pollution. The river quality survey data provides a potentially important data-set forcombination with other environmental data (soils, climate, vegetation) for thedevelopment of models to predict the overall environmental quality of rivers.
WIS provides a useful model for the developmentof a similar system for river corridorsurvey overviewfor both strategicand operationaluses. This system could incorporate theDTM/watercoursenetworkdevelopedby IH, whichrepresentsa major investmentin softwaredevelopmentand data compilation.
River networkdensity is needed to assess the cost basis for interpretationof aerial and thishas been commissioned(withinthe contract)from IFIusing the WIS data base (Table4.2 andFigure 4.3).
6.5.2 Other Information Systems (IS) or Geographical Information Systems (GIS) inuse/planned and contacts
ROD YorkshireWater plc
CORINEinformationsystemof EC. The use of GIS was explored for a variety of purposesbut was nearly confounded by requirementsfor the large geographic content (2.3,000,000km2)with the requirement for a relatively fine resolution (< 1 km2)and the wide range ofdata sets not thematicallyor spatiallyrelated but also on time and resources (Briggs 1991).Data on biotopes, areas designated for wild birds, water resources, soil, climate, slopes,coastal erosion, soil erosion risk and other related parameters but mostly at a scale of1:100,000or greater.
Germinal,Lausanne, Switzerland
a Dutch system,Prof Verheyen,Holland
NRA GIS task group (KeithAnnand,Thames NRA) Final Report
NRA Head Office (Phil Rees)
GIS Softwaresystems availableinclude:
ARC/INFO,vector based industry standard, can handle large data sets but only two planedirect comparisonspossible; £30,000pa in commercialenvironment
47
Laser-Scan,another major standard
Spans
SysScan
Intergraph
Antec - Datascape(currentlyin use at NRA Severn-Trentand SouthernRegions)
Jazzmaps
ILWIS Integrated Land and Water InformationSystem. Developed by ITC (InternationalTraining Centre)Netherlands
IDRISI Raster-basedlow-cost system
GRASS US Corp of Army Engineersraster-basedGIS with vector capabilities
48
7. DISCUSSION
This object of this report was to assess the feasibility of a strategic overview of theconservation status and enhancement potential of English and Welsh rivers. The terms ofreference required that methodologies should be explored which are simple, rapid, robust yetflexible and repeatable. However current standard River Corridor Survey (RCS)methodology embody much detail and could be described as well annotated diagrams ofvegetation with some morphology and other features. This immediately raises the problemof the enormity of the size of data sets required in order to provide site data in sufficientdetail, to assess the conservation status for the length of watercourse in England and Walesof some quarter of a million kilometres distributed over 151,000 square kilometres of land.A balance therefore needs to be established between the large volume of data and therequirement for sufficient site specific detail to allow the conservation status to be determinedin full consideration of the known range of differences at the regional and topographical levelbut also the nature of human interactions with the water environment.
An initial examination of a potential methodology, remote data sources, availability ofgeographic data and systems for data management, particularly Geographic InformationSystems (GIS), a possible strategy has become apparent. This basically comprises a proposalto examine the prediction of pristine quality for sections of river from existing data, thendegrading this by real data from interpretation of remotely sensed data before classifyingsections of watercourse at a suitable level. To achieve this, alternative survey methodologieshave been examined, sources of data assembled, alternative methodologies of remote datacapture examined, trial interpretations undertaken, and possible methods of integration ofremotely sensed data sources with existing map data examined to allow the establishment ofsome classification of output of conservation status.
7.1 River Corridor Survey (RCS)
Thereare several RCS methodologies used for routine operational work or part of strategicsurveys, not just within the NRA but elsewhere in conservation and commerce. The standardRCS and its derivatives result in essentially well annotated diagrams of vegetation with somesite morphology and other features; they have a strong landscape component but do not seemfully integrated. Standard RCS are undertaken by specialists and need specialistinterpretation, and as such are not easily or directly transferable. Standard RCS methodologyis best seen simply as a recording technique to show that a reach of river has been examinedthoroughly and assessed. There is plenty of scope for improving the methodology in both.biological and landscape terms. Indeed, the basis as originally produced in draft form (NCC)contained elements not now incorporated. The standard RCS output is not very amenable tohandling or processing in any machine compatible form. The following actions are required:
a sensitivity analysis to allow quality assessment or grading of output for strategic, operational and site specific uses. This should enable regional and topographicalaspects to be compatible with remotely sensed data.
The biological basis of inputs especially flora should be closely examined and set in a national and sound ecological context. Problems of rare biota and local occurrencesmust be confronted.
49
Aquatic faunal data should be incorporated on a nationally agreed basis.
RCS diagrams should be produced in a standard machine readable and storable formfor easy handling and display.
Ground truth data will be required in support of remote sensed data, and existing surveys willnaturally be a first choice. A representative selection across the range of RCS will berequired. However, consideration will need to be given to developing an appropriateconservation classification of rivers and optimising methods of data capture compatible withother NRA functions. Landscape should have a higher priority than at present.
7.2 Remotely sensed data
The technology is currently available to provide data at many levels of detail from satelliteto low overflights by aircraft. The cost can be viewed as high but it is likely to be lessthan one tenth of ground-based RCS. The acquisition of remotely sensed data is only thestart of the process whether by photography or multi-spectral or full spectral means. Theimages need to be processed in a single or resampling process, to standard co-ordinates(National Grid Reference), the data captured and then integrated into a processing andretrieval system for use.
Available satellite data gives sufficient detail for general adjacent land or catchmentclassification use. The costs of buying, flying or interpreting the full cover of England andWales are relatively high, but seems to represent a sound multi-use investment in anorganisation with an annual budget of over £450 M. Coordination of flights and a registerof flight requirements within NRA is currently needed to minimise costs. Externalcooperation should be considered. However, a complete organised set of aerial images doeshave considerable commercial value by itself. Seasonal flights to allow interpretation ofrivers banks under deciduous vegetation may be needed. If integration is not possible thena sampling procedure would be required, possibly based on ITE land class system but theneed for site specific information is known to exist. Remote sensed images can supply agood first level approach suitable for operational requirements. As a quick reference, thisis particularly cost-effective in terms of decision-making.
The current choice is apparently between:
large scale colour air-photography which is the most practical and proven tool fora survey of this type having very high resolution, relatively low cost and available incolour and stereo; (at 1:10,000 scale or the intermediate option of 1:25,000 acquisitionflight enlarged to 1:10,000). However, data will need to be digitised and exists onlyin three visible broad bands; or
imaging spectrometry, particularly by CASI, at a similar scale to above. Thistechnique is however prone to problems relating changes in attitude during in flightand in addition NERC has found the addition of an upward facing spectro-radiometerof use with imaging data acquisition interpretation. Imaging spectrometry has or willhave, greater versatility in processing and automatic classifying; pictures can bedirectly produced in simulated real colour; data is available in digital form to a muchextended density range than by photography.
50
The less complexolder technologymulti-spectralbroad band ATM has more disadvantagesparticularlyof resolutionbut does take measurementsin the infra-redregion which have beenreasonable successful in identifyinggroups of riparian vegetation. The human eye is veryefficientat interpretingriparianand similarfeaturesbut with the expectedadvancesin texturalanalysis programs automatic classificationmay be possible. Such distinction based uponresolution by photography or from images, may be considered academic as unless in theunlikelyevent seasonal flightsare undertakenfor the better sites partially vegetated by trees,little will be seen of the bank in any case. It is therefore recommended that these twosystems are compared over a wide range of conditions before a decision is made. Thismay include validation of photo interpretation from ground truth surveys or from overflights of previously surveyed sites, determination of time required for validation overthe full range of habitats and at various scales, for direct transfer to raster or vectorsingle class files in the data management system.
The recentNRA aircraftutilisationsurvey(Jan 1992)summarisesthe need for proper analysisto evaluate the need, extent and image format for RCS, together with observations thatregions are undertaking flights on a piecemeal basis in a variety of formats, that they areunawareof the technicaloptionsand that formatsshouldbe compatiblewith GIS and WAMS.There is also the need to make data compatiblewith other functions especially coastal andflood defence. '
No estimate of cost has been made for interpretation of video data although a figureequivalentthose above is likely. Howevera solutionto the major problems of rectification,resolutionof capturedframesand data transferto a databaseneeds to be addressedand costedin detail during the validationphase.
7.3 Availability of data
There are many and various sources of data available both for construction of aframeworkfor an overview systemand for use in the proposed predictive part of the system(Table 7.1). Several obvious sources have already been explored and are in the process ofbeing mademore useful or correctedfor use in the waterenvironment;these shouldobviouslybe consideredin the first instance.
Other sources can be used in the prediction of pristine quality values for sites or by withfurther developmentthe prediction of degraded values by, for example, the input of waterchemistry. One example already in use for use as a standard with which to compare fieldsamples,is RIVPACS. It is interestingto see that eight of the input variable required can bedirectly found from a range of map data, two or three more can be determined with lesseraccuracy, leaving one variable with only a low accuracy of prediction and another optionalvariable not frequently used. The resultant of this is the prediction for the probability ofoccurrenceof tens of macroinvertebratespecies or taxa but whilst it should strictly not beused in this manner it is likely to be of use incorporatedin a five or ten point conservationscale. Other similar systems and more extensive systems are under development forprediction of general aquatic or riparian biota (e.g. IFE 'plantpacs' or biomorpho-pacsor NCC systems.
51
Table 7.1 Summary of parameters needed, available or potentially computable/derivablefor use in RCS assessments and indices
LOCATION:Latitude, longitude or NGRDist. river source
TOPOGRAPHY:AltitudeChannel size Width Water
BankfullDepth Water
BankfullChannel morphology Slope of bed
Substrate
Shape Bank slope
mapmapmap, data base or calculate from OS blueline
map (satellite radar?)remote, deduce from river class data
deduce?
from contour mappossibly deduce from geology map anddischarge class (or rain)possible from hydrographic range andgeological data
ShadeErosionWater velocityDischarge
Water colourMaintenanceAdjacent land use
Features u/s & d/sWATERCHEMISTRY:pHConductivityCaCO3Ions
Temperature
BIOLOGY:Flora
Soilsland use and cover
FormSinuosity remote, map
remote(as shape above?)deduceclass from map (+ NRA harmonisedsampling)occasionally possible e.g. peat land classesremote, historical data baseavailable from satellite or sample basedclassificationremote
AnionsCationsIon balanceAirWater
present% cover
from remote and geology?from remote and geology?from remote and geology?unlikelyunlikely(as conductivity)available as equations (Met.Office)from air temps
under development (by IFE and JTNC?)from shade estimate from remote dataRIVPACS etc.available available
52
7.4 Data management systems
The most challenging part of the proposed overview is integrating and modelling the data, e.gfrom remote sensing, fieldwork, biological and chemical samples etc. within the datamanagement system to derive a single, practical environmental quality grade for a specificstretch of river before classifying its conservation status and the potential to improve itsstatus. This may not be able to operate in a truly interactive way without considerable effortbut must be considered in specifying the parameters of the data management system.
Firm recommendations are difficult in light of continually changing or upgrading ofcomputing hardware and software, technologies and methodologies. However, several itemsshould be given serious consideration:
compatibility of output tape formats not just physical size are very important toefficient transfer of data.determine best GIS to allow integration of 6,000 NRA National River Qualitysamples with remotely sensed datacompromise situation - major rivers by ATM/CASI rectified to OS-blue line 1;50,000and filled-in with colour stereo-pair photography at 1:10,000; a feasible and costeffective system but technically difficult to fit data into raster data base.choice of workstations for testing would need say with 250-500 mb and 1-5 Gb tapeserver (Sun, HP, Dec, micro-VAX, IBM)a main GIS work station at Bristol could be regularly updated and data kept semi-permanently or circulated in a reduced or interpreted form to regions or catchmentstogether with real or simulated site images using optical disc technology in preferenceto magnetic tapes but again there is much updating of technology in hand.Distribution on a type of CD-ROM optical disc (644 mb) to each of the 10 regions,or 30 subregions or divisions, 50 hydrometric areas, or the 150 main catchmentsGIS information data layers need to be transferable between industry standardmachines
As improvements in both methodology, software and hardware are continually being made,such choices should be made during the next or test phase but incorporate the selection ofindustry standard hardware GIS systems, actual trials in both compatibility of handlingoverflight data from digitized photographic and imaging spectrometry and commercial mapdata expected to be used.
7.5 Assessment of the potential for an hierarchical classification
The assessment of the extent, derivation and determination to which a hierarchicalclassification could be taken is currently difficult on the extent of coverage of the survey (fullor sampled) and the degree of inclusion of regional, topographical and other sources of dataeg chemical. However, a regional five point scale or ten point national scale seems quitefeasible from full overflight data. However realistic consideration must be given to a rangeof sampling strategies and integration of other NRA functions. This will be addressed in aforthcoming NRA research project on conservation classification.
53
The costs of (i) purchasingexisting and acquiringnew photography to ensure countrywidecover and interpretingthe large number of prints are high. This suggests that the feasibilityof a sample-basedsurveyshouldbe consideredfroma comparisonwith the costs and benefitsof a census survey (ie strategic versus operational requirements). The overwhelmingadvantageof a censussurveyis that site specificinformationis provided,e.g. the conservationvalue of every stretch of river is coded based upon a set of observations. The samplingapproach only provides a prediction of river conservation value based on a sample ofobservations,but with the advantageof considerablylower costs. This would be a betteroption for repeat surveysto monitorchange.
If a sample-basedsurvey were adopted, England and Wales could be stratified by someenvironmentalparameter(Jib land class, soil type, etc.) to improve sampling efficiency. A10 per cent sample (8,400km) of watercoursesin Englandand Wales would requireentirelynew flying,but given the muchreducedarea this could be undertakenat large scale (1:5,000or greater)withinone flyingseason. Interpretationtime wouldbe less than 200 days enablingthe whole survey to be completedwithin one year and repeated as required.
A sample-basedsurvey wouldenable nationalpredictionsof river conservationquality, withconfidence limits, to be made for each category of the sampling system. Repeat surveyswould show the extent to which the river had improved or degraded over the interveningperiod.
This projecthas been complexdue to a varietyof factors includingabsence of interpretationof RCS results,variationin bothRCSmethodologyand overviewtechniquesbetweenregions.Thus although a hierarchicalclassificationsystem, together with some suggestionsfor itslevels, could be proposed,its potentialdegree of reliabilityit is a yet unclear.
54
8. SUMMARY AND PROPOSALS
8.1 Summary
A River Corridor Strategic Overview is feasible by remote sensing if the approach ofincluding existing map data and utilising a geographic information system is included.River Corridor Surveys (RCS) are essentially well annotated diagrams of vegetation withsome site morphologyand other features;they have a strong landscape component. Remotesensing can supply a good first level approach suitable for operational requirements.RCS data are prepared by specialistsand need specialist interpretation but as such are noteasily or directlytransferablefor strategicoverviews. To satisfy this componenta predictiveelement is proposed to produce, in RIVPACS style, a probability of quality for aquaticenvironment and biota. This value for pristine quality for sites can then be modified byremotelysenseddata before hierarchicallyclassifyingthe stretchof watercourse. Image scaleis importantas the watercourse only occupiesa minute part of any image but interpretationrequire a minimum size.
The cost of a strategic overview by on-site survey for the 45,000 km of main river and181,000km of headwater, is estimated to cost at least £13,000,000 and require 140,000person-days (Table 8.1) excluding the incorporationof the data in an machine accessibleformat (£1-2,000,000?). In contrast, the estimatedcost of a remote survey may vary fromaround£1,500,000at 1:10,000scale to almost ten times this for 1:3,000 scale. A first aerialsurvey at 1:10,000would be less as half the photographyis available but interpretationetc.will still be required. A set of detailed images would be available for initial filtering foroperational needs and a tangible asset would be available for sale. Mixed scales areenvisaged but the costs balance out and a combined figure of £2,000,000 including somepurchase or hire of data sets is the current best estimate.
The next (validation) phase needs to address several aspects of the overview survey,particularlyeconomics and data compatibility. It should include considerationof:
changesto current RCS methodologyto improveits compatibilityfor use at all levelsfrom local operational to strategicoverviewlevel including examining the biologicalassumptionsbeing made;
the choice of image acquisitionand processing between colour stereo photographyversus imaging spectrometry. 50% of Englandand Wales has been overflownwithinthe last 5 years. Image spectrometryis moreversatile and has greater potential depthof interpretation but is newer technology; full integration of image acquisitionthroughout the NRA is essential but cost savingsmay limit the choice of method;
data sets, their compatibility and detailed supply costs, for prediction of pristinequality of sites e.g. land-use, soils, geology, river channels and catchment or otherboundaries;
data handling and integrating systems available to accommodate both the largequantitiesof map and imagedata, currentand historicalphotographicdata. These areneededto facilitate usefulinteractionof differingtypes of data and to produce output
55
Table 8.1 Comparison of methodologies with current costs and effort for surveys of45,000 km main river plus 181,000 km of headwater streams and for a maximum of365,000 km of watercourse
Methodology Cost, Time person-days 'M
On-site field based RCS (10 or 20 year cycle) integration of survey 13-21 150,000-230,000into machine readable and accessible form (1-2)
Air photography - colour stereo
1:10,000 scale existing 0.24
new 0.57
full reconnaissance 1.1
rectification and interpretation 0.3 4,500
digitization and classification (0.3-0.5?) ?
1:3,000 new survey 5-8 40,000-60,000
interpretation 5?
Imagery
1:25,000 equivalent
Satellite SPOT (10 x 10 m - 60 x 60 m pixel size, land use only) 0.07-0.2
1:10,000 equivalent
ATM with rectification and classification, e.g. 1 x 1 m pixel size 1?
CASI as above 1-2?
56
for distribution for strategic but also operational work at useful levels ie from reachesand catchments to regional level; and,
5) fully integrating RCS methodology and data gathering into other NRA functions, dataacquisition especially images, interpretation and distribution or access systems
8.2 The way forward - progressive stages
In view of:
• The requirement for the collection of large amounts of data and production of verydetailed annotated diagrams of vegetation and river morphology characteristicsresulting from existing standard techniques for river corridor survey;
• It is clear that such a methodology is neither feasible nor appropriate, given the sizeof England and Wales (>250,000 km of watercourse distributed within a land area of151,000 km2) and the requirement for a strategic overview of the current and potentialconservation status.
• A balance therefore needs to be established between the large volumes of datarequired for site-specific information and the need to implement a national monitoringsystem with sufficient detail to be useful for strategic planning at national and regionallevels. Thus
• Following an initial examination of the existing methodologies for river corridorsurvey, an analysis of the potential of remote sensing, especially large scale colour air-photography and other environmental data-sets, two separate but not exclusive optionshave been identified.
Stage 1 - Air-photography with field-based RCS validation
This option is a relatively simple, low technology route based on the interpretation of anational coverage of air-photography with derivation and validation of a simple index of riverconservation grade (1-5) using the standard, field-based RCS methodology. This would bethe preferred option at the start of the implementation stage, providing data andmethodological procedures for incorporation into the second more sophisticatedpredictive system.
Establish period for baseline survey, e.g. 1990-94 or 1986-95.Obtain existing photographic or spectral images for this baseline period; commission flying of new air-photography to ensure full national coverage (preferably on acollaborative basis.Develop a classification system based on interpretation of photographs/images in selected study areas for contrasting landscape types.Validate classification with reference to field-based standard RCS methodology by a detailed investigation of the relationship between parameters mapped from air-photography and detailed RCS measurements with other biotic and physicochemical
57
data available.Refine classification to derive a standard, consistent, repeatable index of river corridorconservation value and apply to entire data-set (air-photography and sample ofairborne scanner/imaging spectrometer data) for England and Wales.Assess validity of index from sample of new RCS sitesIncorporate index of conservation into GIS, with facilities for rapid display andinterrogation of data and ancillary information including:- designated conservation areas, e.g. SSSI, national park boundaries
water catchment boundaries, and probablywater chemistry
Sub-stage 1: Sample-based survey
See 7.5).
Stage 2: Development of a predictive system: modelling approach
The development of a predictive system with the capability to determine the consequences,possibly at the catchment level, of changes in land use/cover, new discharge consents,persistent low flow etc. for river corridor quality.
Develop a model to predict the 'pristine' status of a watercourse under contrastingconditions of scale, geology, climate, soil, altitude. This is analogous to theRIVPACS approach and the model would need to be implemented within a GISincorporating national environmental data-sets.
Integrate and relate different data-sets, including interpretation from air-photography,to derive an index of river corridor environmental quality. Determine the parametersexplaining most of the variation in river corridor quality in order to minimise datarequirements. The development of the predictive system and integration ofremotely sensed data with other national environmental data-sets may, in thelonger term therefore, considerably reduce data needs.
Test under field conditions includingassessment of watercourse degradation;analysis of the departure of watercourse from predicted status based onstandard field-based RCS methodology and sampled air-photography; andprediction of the consequences of new development, e.g. drainage, land usechange, agricultural change etc. on river conservation value.
58
9. ACKNOWLEDGEMENTS
Thanks for contributions are due to:
Geodata Unit, Southampton University - consultation on techniques(Mike Clark, Chris Hill & Angela Gurnell)
Institute of Hydrology - demonstration of WIS and network calculations(Roger Moore, Isabella Tindell, David Melvis)
Dept of Oceanography, Southampton University - demonstration of ATM & CASI f o rcoastal regions (Simon Boxall)
Hunting Aerofilms (Peter O'Connell)
Global Earth Sciences (Chris Jewett)
and for general comments, Patrick Armitage, Mike Furse, Ian Farr, Glen George, Mike Ladleand John Wright of the Institute of Freshwater Ecology.
59
10. REFERENCES
Bolton, P. & Dawson, F.H. In press. The use of a check-list in assessing possibleenvironmental impacts in planning watercourse improvements. In: Effects ofWatercourse Improvements: Assessment, Methodology, Management Assistance.International Symposium, Namur, Belgium, 10-12 September 1991.
Briggs D. 1991. GIS development for broad-scale policy applications: the lessons fromCORINE. Geographic Information, AGI, 113-123.
Budd W.W., Cohen P.L., Saunders P.R. & Steiner F.R. 1987. Stream corridor managementin the Pacific Northwest: I Determination of stream corridor widths. EnvironmentalManagement 11, 587-597.
Bunce R.G.H., Barr C.J. & Whittaker H.A. 1981. A stratification system for ecologicalsampling. In Ecological Mapping for ground, air and space Ed. R.H. Fuller. ITESymposium number 10, monkswood,Nov 25-27 1981, 39-46.
Furse, M.T., Moss, D., Wright, J.F. & Armitage, P.D. 1987. Freshwater site assessment usingmulti-variate techniques. In: Luff, M.L., The Use of Invertebrates in Site Assessmentfor Conservation. Proc. Meeting Univ. Newcastle-upon-Tyne, 7 January 1987.Agric. Environ. Res. Group, Univ. Newcastle-upon-tyne.
Haslam, S.M. & Wolseley, P.A. 1981. River Vegetation: Its Identification, Assessment andManagement. A Field Guide to the Macrophytic Vegetation of British Watercourses.Cambridge Univ. Press, Cambridge.
Holmes, N. 1983. Typing British Rivers According to their Flora. Focus on NatureConservation No. 4. Nature Conservancy Council, Huntingdon.
Hooper I 1990. Remote sensing riverine environments. Proceedings of a symposium onairborne remote sensing, British Geological Survey, Keyworth, Nottingham,18/19 December 1990, 183-192.
Hunting Technical Services 1986. Monitoring landscape change Volume ILearner M.A., Bowker D.W. & Halewood J. 1990. An assessment of bank slope as a
predictor of conservation status in River corridors. Biological Conservation 54, 1-13.Moss, D., Furze, M.T., Wright, J.F. & Armitage, P.D. 1987. The prediction of the macro-
invertebrate fauna of unpolluted running-water sites in Great Britain usingenvironmental data. Freshwater Biol. 17: 41-52.
National Remote Sensing Society 1990. The impact of land-use change on aquaticcommunities. Mapping land cover change in water catchments from satellite imagery30 pp
O'Keeffe J.H., Danilewitz D.B. & Bradshaw J.A. 1987. An expert system approach to theassessment of the conservation status of rivers. Biological Conservation 40, 69-84.
Saunders R.M.K. & Dawson F.H. 1992. Environmental Assessment Parameters. Institute ofFreshwater Ecology, 145 pp.
Slater F.M., Curry P. & Chadwell C. 1987. A practical approach to the evaluation of theconservation status of vegetation in river corridor in Wales. Biological Conservation40, 53-56.
Townshend T.R.G. 1981. The spectral resolving power of earth resources satellites. Progressin Physical Geography 5,32-55.
61
Wright, J.F., Moss, D., Armitage,P.D. & Furze, M.T. 1984. A preliminaryclassificationofrunning-water sites in Great Britain based on macro-invertebrate species and theprediction of communitytype using environmentaldata. Freshwater Biol. 14: 221-256.
Wilson A.K. 1990. The NERC 1989 Compact Airborne Spectrographic Imager (CAST)campaign.Proceedingsof a symposiumon airborneremotesensing,BritishGeologicalSurvey,Keyworth,Nottingham,18/19December 1990, 259-283.
Other sources
Briggs S.A., Plummer S.E., George D.G., RobertsG., Sewell I., HuthnanceJ., Gurney R.J.,Wyatt B.K. & Aitken J. (Draft,1991).A review of remote sensing, A Report toNational Rivers Authority(No.311/01/H0).Natural EnvironmentResearch Council,approx 350 pp 2 vols.
NERC Scientific Services 1990.Proceedingsof a symposiumon airborne remote sensing,BritishGeologicalSurvey,Keywonh,Nottingham,18/19December 1990,NERC,342pp.
NRA 1992.Aircraft Utilisationstudy, 143 pp
ITE rnonkswoodSteven Briggs/AndrewWilson (04873-381/8)Editors & authors of remotesensing review for NRA (GarethLlewllyn)with IS/CASI data (+ATM?)and with a reviewon aquatic aspect of remote sensingfreshwatersby Glen George of IFE (+PaulCarling?)
62
APPENDIX la Addresses of organisations with RCS, GIS or related interests contactedduring project (in Bold)
Telephone Fax
AlconburyConsultants(Nigel Holmes)
Prof. J.A. Allen 071-637-2388 -436-3844Centre for Near & Middle African Studies (-323-6159)School of Oriental& African StudiesUniversityof London, ThomhaughStreet,Russell Square,London WC1H OXGVice chairmanRemote Sensing Society
British National Space Centre 04873-381 -467-Remote SensingApplicationsDevelopmentUnitNERC Monks Wood ExperimentalStationAbbots Ripton, HuntingdonPE17 2LS
Virginia CarterUS GeologicalSurvey
CountrysideCommission
CountrysideCouncil for Wales
CSIR Water Technology -12-841-4794 -4785Water Quality InformationSystemsPO BOX 395 Pretoria 0001 South Africa(NicholasKing)
English NatureNature ConservancyCouncil for EnglandNorthminsterHousePeterboroughPE1 lUA(Mark Felton)
Institute of HydrologyWallingford(Roger Moore, Isabella Tindall,T12057a5)
MAFF
National Remote Sensing CentreSpace Dept. R190 BuildingRoyal AerospaceEstablishment,Farnborough,Hants GU13 6TD
0252-541464
National Rivers Authority
Head OfficeRivers House, WatersideDrive, Aztec Park, 0454-624400 -624409Almondsbuiy,Bristol BS12 415D(Dr K O'Grady Head of Fisheries,Recreation,Conservation& Navigation)
(Dr Paul Raven, ConservationOfficer,4343)(MervynE. Bramley, Head, R & D; Gareth Llewellyn)(LindsayPickles, Flood DefenceOfficer)(Richard Sweeter,Water ResourcesOfficer)(John Seager, -Water Quality)
Royal Commissionon the HistoricalMonumentsof EnglandNational MonumentRecordNational Libraryof Air PhotographsAlexanderHouse, 19 FlemingWay, Swindon,Wilts SN1 2N0
0703-792584
0493-414100
Geonex UK Limited 081-640-197192-94 ChurchRoad 081-685-9393Mitcham, SurreyCR4 3TD
APPENDIX 2 TERMS OF REFERENCE FOR A REPORT ASSESSING THEFEASIBILITY OF A STRATEGIC RIVER CORRIDOR OVERVIEW OF RIVERS INENGLAND AND WALES from NATIONAL RIVERS AUTHORITY
1. Overall objectives
To evaluatethe feasibilityof a strategicoverviewof the conservationstatus and enhancementpotential or rivers of England and Wales.
2. Specific objectives
The studyshouldidentifyadvantagesanddisadvantagesof the optionsavailablefor a strategicoverviewby establishing:
the type, extent and sources of availableinformation
ii the methods required for interpretationand classification
iii staff resources and expertiserequired
iv benefits and links with other NRA core and support functions and externalorganisationsparticularlyin terms of catchmentmanagementplanning
The NRA gas a statutory duty under Section 8(1) of the Water Act 1989 to 'further'conservation. A pre-requisiteis thereforeto (1) assess and evaluate the current conservationstatusof inland and coastalwatersand associatedlandsin Englandand Wales and (2) monitorchanges in status resulting from both 'global' and 'localised' factors, predominant being theimpactof the NRA either as a direct modifieror indirectlythrough granting of land drainage,abstraction or discharge consents. It is also important that, in furthering conservation,objectivesfor enhancing/rehabilitatingdegradedhabitatscan be identified, targetdates set andactual performance measuredagainst these criteria.
67
River representa majorfocusof NRA responsibilities.Theriver channeland associatedlandshave therefore become the focus for a major effort involving habitat surveys and impactassessments. However,a national strategic overviewis still lacking.
Conservationoften emphasisesthe protectionof the best examples of habitats or rare plantsand animals. As a result, all too often, developers and others regard habitats that occuroutside the ring-fence line designating an SSSI or National Nature Reserve as fair game,because they apparentlyhave no conservationstatus.
Only 369 km of river-lengthin England and Wales is currently designated specificallyasriverine SSSI. Althoughit is of paramount importancethat the best rivers in conservationterms need to be adequatelyprotected,it is only right that proportionatelymore effort shouldbe directedtowardenhancingthe conservationvalue of the remaining99% of the rive-length.All rivers have some conservationvalue however low. There is an urgent need to evaluatethe rivers of England and Wales so that the best stretches can be identified and protectedwhile the remaindercan be maintainedor enhance.
A strategic overview also has major potential in terms of a holistic approach to catchmentmanagementplanning, incorporatingother core NRA functions such as Water Resources,Water Quality,Flood Defence,Fisheries,Recreationand Navigation.
A Phase I strategicoverviewof the conservationvalue and enhancementpotential of riversin Englandand Wales is required. The method needs to be simple, rapid, robust but flexibleand readilyrepeatable.In terms of staffing resources,it shouldbe entirely independentfrom,but complementaryto, the currentprogrammeof river corridor surveys.
It also needsto be compatiblewith survey methodologieswhich will be used by the NRA tomonitor the general and specialecosystem use-relatedEnvironmentalQuality Objectives.
Method of Approach
Desk study/literaturesearch
ii Contactwithrelevantpersonnelfrom the NRA and outsideorganisations(e.g.EnglishNature, CountrysideCouncil for Wales, MAFF)
Timescale
The deadlinefor a completedreport is 31 January 1992.
Output
Report detailingexisting information,outlining the optionsavailableand recommendingthemost appropriatemethodologyfor the NRA.
68
The contents of the report shall be the sole property of the National Rivers Authority.
Benefits
This feasibilitystudy is essentialfor the strategicoverview. It will identify cross-functionalbenefits and possible collaboration/cross-fundingfor the overview exercise.
Additional Terms of Reference
More emphasiswill be placed on conservationenhancementpotential.
Considerationof how an overviewwould fit into a hierarchicalclassificationsystem will betaken into account.
The NRA would be agreeable if, under the auspices of WE project management, specificexpertise on geomorphicand other aspects related to interpretation of aerial photographs isundertakenby another party, provided this is included within the quoted budget
69
70
APPENDIX 3 PROPOSAL from THE INSTITUTE OF FRESHWATER ECOLOGY toNATIONAL RIVERS AUTHORITY
Introduction
Within the NRA's statutoryresponsibilityto further conservationin England and Wales, itis clear that an essentialprerequisiteis to assessand evaluatethe conservationstatusof inlandand coastalwaters togetherwith the associatedland, and to monitorchanges in status broughtabout by both local and more general factors. It is howevernecessaryto identify the factorswhich enhance habitat and to avoid or minimise those leading to degradation. One majorproblemis the sharpdivisionbetweendesignatedreservesand adjacentland which apparentlyhave no conservationstatus but are integral to the former.
Only a minute proportion of rivers (369 km) have so far been specifically designated asriverine SSSIs and although it is most important that such rivers should be protected, it isequally important that effort should be given to enhancing the conservation value of theremainderas all rivers have some conservationvalueno matter how low. There is an urgentneed by NRA to evaluate the rivers of EnglandandWales in order to identify and protect thebest stretchesand to maintainor enhance the remainder. It has been a source of puzzlementto IFE staff during surveys that some rivers are protected whereas others of even betterquality are not. Thus it is apparent that an overview is necessary. However as Phase Ispecifies, such work must pragmatically use a methodologywhich is both simple, rapid,robust but also flexible, repeatable and compatiblewith existing survey methodologies.
The Institute of Freshwater Ecology
The IFE has not only a wide and probablyunparalleledexperiencein fundamentalbiologicalresearchinto habitat and communityrelationshipsin UK rivers but an establishedfamiliaritywith surveywork for suchprojectsas RIVPACSand in EnvironmentalAssessmentfor majorinternationalcompanies. Suchsurveyshavenot onlybeen based on the ground but at variouslevels in the air. Current projects include the use of multi-spectral scanners mounted onaircraftto identifyaquaticand riparianvegetationwhileotherprojects utilise satelliteimageryparticularlyin land-water use interactions.
In order to ensure that the broadest possible experience is available for this project, the Instituteof FreshwaterEcology(WE)has associatedwithHuntingTechnicalServicesLimited (HTS)who have a broadbase in aerial andremotelysenseddata collectionand interpretation.
HTS was formed in 1953with the aim of providingservicesto land resources development,particularly in the developing world. HTS is now one of the largest independent landresourcecompaniesin the worldemployingover 100graduatespecialistsand having workedin over 100 countries. The main activities of HTS are the survey of renewable and non-renewable resources, land use planning, agricultural management, rural development andenvironmentalconservation. HTS staff cover a wide range of disciplines and the companyhas access to many specialist consultancy companies and independent specialists, someassociatedon a retainer basis.
71
Resident specialists and permanent staff of HTS can offer expertise including the following:
land resource evaluationenvironmental planning and managementirrigation and drainageremote sensing and geographic information systemscartography, reports and map productionlivestockagriculturemarine and aquatic resourcesenvironmental impactmonitoring and evaluationgeology
HTS services include:
acquisition/procurement (satellite imagery can be acquired or procured with allnecessary processing carried out in house)image processing (all forms of image processing can be performed - image restoration,geometric correction, image enhancement and information extraction)precision hard copygeographic information systems from various sources of data; ground data, mappedinformation and remotely sensed datadigital cartography (GIS, digitise thematic or base maps)micro-computer for image processing and GIS with integrated remote sensing projectson renewable resource applicationsgeological and ffdneral services and research for the European research and spaceagencies
HTS has undertaken a number of projects in which a combination of satellite imagery, air-photography and ground survey have been used to collect information on landscape featuresof conservation value.
The Monitoring Landscape Change Project, commissioned jointly be DoE and CountrysideCommission in 1980, used a sample of multi-date air photographs to map change in area andlinear features in England and Wales. The project demonstrated the feasibility of obtainingnational statistics on changes in small scale landscape features, many of conservation value,as well as providing a summary of changes in land use.
More recently HTS staff on secondment to the National Remote Sensing Centre, wereinvolved with the IFE to map change in land cover in two water catchments (River Hodderand River Axe) from satellite imagery. Geographical Information System (GIS) techniqueswere used to output the land cover data by river corridor (eg within a zoom zone) and by subcatchment. Land cover adjacent to a river or stream is an important determinant of'naturalness' and could be incorporated into a scheme to assess the conservation value of aparticular length of drainage channel.
HTS has recently been involved in the development of remote sensing and GIS techniques
72
for environmental impact assessment. This has involved producing maps of landscape'quality', enablingthe impactof new developmentson the landscapeto be evaluated. Similartechniques, involving mapping and measurementof important riverside features (riverinevegetationcharacteristics,levelof management,adjacentland cover, soils and geology)couldbe used to develop a simple classification of stream conservation value, similar to thatproposed by NRA.
The Project
Methodologieswhich are feasible for a strategic overview of the conservation value andenhancementpotentialof EnglishandWelshriverswillbe studied. Such techniqueswill needto allow meaningfulreliable data to be repeatedlyobtained,made simply available and ableto be assessed rapidly for use in NRA activitiesas a first phase, but also later to underpinenvironmentalprotection,generalimprovementor determinationof potential for enhancementof special habitats. The role of cross-functionbenefits between the various agencies andgovernmentdepartmentwill also be investigatedas would the biotic and geomorphologicalsignificanceof data obtainedin these various ways. Such factors would need to include notjust the presence of trees on banks but the variationin river form, eg riffle-pool sequences,overhangs, sinuosity, in relation to fish populations but also to other biota, egmacroinvertebratesor plants and their diversity.
Specific objectives of the study include an overview or 'matrix' of the advantages anddisadvantagesof the differentpotential methodologiestogether with determining the extentand quality of the information sources available, implementation and classificationrequirements,and the benefits to NRA activities both internally and in its interaction withorganisations,togetherwith the best optionsand a recommendationfor the most appropriatemethodologyfor the NRA.
The project will be undertakenas a desk studywith appropriatecontacts being establishedtodetermine
i) informationavailable, its type, extent and sources, which will be appraised togetherwith other critical aspects such as the status,coverage, scale and the access cost. Itis proposed to investigatedata sourcesincluding:
mapsand geographicdatabaseinformationparticularlyfrom OrdnanceSurvey,databasesof river data eg IFE/SouthamptonUniversity survey of managementon main rivers and GIS databaseswithinthe Research Council and elsewhere;satellite imageryincludingdata for land use surveys by MAFF and possiblyCountryside Commission data, together with the possibilities of sidewaysscannersfor assessmentof geomorphologicalfeatures, data held by the formerRural Areas,ESRC/NERCData Archive,Institute of Hydrology and ResearchCouncildatabases;aerial still photographywith interpretationfrom single and stereo pairs fromsuch sourcesas the NRA Thames,Wessexand Southernregions, but probablyincluding others such as, from the Welsh Office, some County Councils andcommercialregisters and centres;aerial video photographyfrom NRA regions such as Severn Trent, but also
73
from project orientated studies by commercial companies eg Shell, asavailable;aerial multi-spectral scanners such as flow by NERC for river corridor studies,and for lake studies (with and without image enhancement);ground based surveys extracts especially river corridors, Research Council databases and systems EIC. NUTIS, and for classification and groundrtruthcomparisons; and
• other potential sources or computations of databases.It is assumed that access for appraisal will be available to examples of NRA regional information such as held on video tape by Severn Trent and Riparian Corridor Survey data.
ii) The methods required for interpretation and classification which includes factors suchas the balance between survey effort versus the effort required for data elucidation andprocessing from the chosen media, information quality and reproducibility. In-houseexpertise on interpretation and usefulness of the data obtained by various methods willbe assessed in biotic and geomorphic terms.
Thus the proposal will also
investigate the type of information that could be derived efficiently from airphotography/video etc to provide data for categorising the conservation valueof each stretch of river such as
level of management from evidence of river straightening, culverts andcanalization,water uses, upstream and adjacent,adjacent land cover, ie distinguish between semi-natural and intensivelycultivated (satellite imagery could be used to achieve this mapping),river flow pattern; fast (pool and rapid), slow,probable levels of disturbance to wildlife and vegetation; presence offootpath, buildings, tow-path, building, moorings, then
investigate techniques to incorporate these data, including RCS data, into asimple classification of river conservation value,
consider the most appropriate format for presentation of final classification andthe associated database, probably using GIS; and,
d) suggest ways in which GIS could be used as a management tool to record,display and provide figures on conservation status of rivers.
iii) Staff resources and expertise required
In view of the breadth of the objectives, the time-scale required and the varyingbreadth of experience of specialists, it is proposed that scientists will investigate theirown specialisation but the whole will be coordinated, integrated and assessed by theproject leader. The latter will, in addition, be the main contact with relevant NRA andnon-NRA personnel including English Nature, Countryside Council for Wales, MAFF.
74
Expertise is availablewithin the consultancygroup, IFE and FITS,on all aspects ofsection (i) above. IFE will provide seniorand principal scientists with experience inremote sensing surveyby the above techniques,computeranalysis, and ground-truthsurvey whilst this will be supportedby seniorconsultantsfrom HTS.
Benefits and links with other NRA care and support functions and externalorganisationsespeciallyre catchmentplanning will be investigated,particularly thelinks at local level but also broader planning issues with Countryside Commission,MAFF and DoE.
The time-scalecurrently proposed will be in accordancewith a final report date of31 January 1992 with intermediatedeadlines from an assumed acceptance of quote11.11.91:end of Novemberfor first joint meetingwith detailed proposals for investigation;end of December(pre-Christmas)for secondjoint discussion meeting with results ofinternal searchesand discussionof emergentproblems,data or technique shortfall;end of second week of January, draft reports for integration and emergent proposalsfor further investigation;third week of January,draft report availablefor comment;fourth week of January,final report preparationand distribution.
Costs for the project are estimatedat £12,000(excludingVAT) based upon
Ed-1 day Ek
Senior and Principalday rates 250-435 35 10.4Typing and report preparation 135-215 3 0.5Consumables
0.3Travel and subsistence(finalpresentation,coordinationanddata status and quality visits)
0.8
Total
12.0
This does not includepurchaseor use of trial sets of informationas may be availablealready within or outside NRA. No intermediatemeetings with NRA have beenincluded in this costing.
Database and data handlingrequirementswill be available in house, at minimal costoutside or exist within NRA regions.
The contents of the report are acknowledgedas the sole property of the NRA although thereport may contain data etc as examplesfrom many sources and the property of others.
75
-
76
APPENDIX 4 Survey parameters from River Corridor Survey and similar surveys offluviatile habitats (from Saunders and Dawson 1992)
CONTENTS
SurveyparametersRBSQ/RiverCorridorSurveyRIVPACSIFE (Reconnaissanceand full EIA surveys)Faunal Richness of HeadwaterStreams (Land-UseSurvey)Fluvial AuditingHABSCOREMacrophyteand VertebrateSurvey (NRA)Biological Survey (NRA)Haslam SurveyDorset EnvironmentalRecords CentreCPI (ConservationPotentialIndex)ICIDMiscellaneous
SummaryReferences
77
A.4.1 RBSQ (River and bank, selected species, quantitative analysis)/River CorridorSurvey(Holmes, 1983)
Units:Information from maps:
GeologyAltitudeSlopeHydrology
Information from morphological survey of site:Substrate:
Water depth:6.1 < 0.25 m6.2 0.25-0.5 m6.3 0.5-1.0 m6.4 > 1.0 m
Water velocityRiver width:
8.1 < 5 m8.2 5-10 m8.3 10-20m8.4 > 20 rn
Bank slope9.1 < 30°9.2 30-60°9.3 60-90°9.4 > 90°
Bank type10.1 Shelf10.2 Solid earth cliff10.3 Soft earth cliff10.4 Rock cliff10.5 Artificial10.6 Flood bank adjacent10.7 Levee set back
Habitats within river:11.1 Pool11.2 Slack11.3 Riffle
78
11.4 Rapid11.5 Run11.6 Waterfall11.7 Exposed rock
Shade:12.1 None/little12.2 Moderate12.3 Heavy
Adjacent habitats (each subdivided: see attached site survey sheet)13.1 Woodland & scrub % cover13.2 Grassland & marsh % cover13.3 Tall herb & fern % cover13.4 Heathland % cover13.5 Mire, flush & spring % cover13.6 Swamp/inundation % cover13.7 Open water % cover13.8 Rock % cover13.9 Miscellaneous % cover
Informationfrom botanicalsurvey of site:List of plant species in river 2 present/absentList of plant species on banks 3 present/absentPercentage cover of bank vegetation:
16.1 Conifers (mature) % cover16.2 Conifers (recent) % cover16.3 Broadleaf (mature) % cover16.4 Broadleaf (recent) % cover16.5 Thick scrub/shrubs % cover16.6 Sparse scrub/shrubs % cover16.7 Reed/sedge % cover16.8 Dense open % cover16.9 Sparse open % cover16.10 Reseeded or mown % cover16.11 Exposed tree roots % cover16.12 Bare mud/clay % cover16.13 Bare sand/shingle % cover16.14 Bare stones/rocks % cover
2 submerged for more than 85% of the time.3 submerged for more than 50% but less than 85% of the time.
N.B. variants of the above survey system utilise four grades of percentage cover in place ofestimated percentages, as follows: 1 = < 5%; 2 = 5-25%; 3 = 25-50%; 4 = > 50%.
79
4.2 RIVPACS(Wright et al 1984; Furse et al 1987; Moss et al 1987)
UnitsInformation from maps:
Latitude of site ° N/SLongitude of site ° E/WAltitude of siteDistance of site from source km
S. Slope 2 m
Information from site:Mean width of waterMean depth of water cmSubstratumcomposition phi (0) 3
4 average daily flow.5 0.31 cumecs; 2 0.62; 3 1.25; 4 2.50; 5 5.0; 6 10.0; 7 20.0$ 40. 0 ;9 80.0.6 derivedusinginformationfromClimatologicalMemorandum(MeteorologicalOffice,1975).7 mean of January, April, July and October means.8 July mean-Januarymean.
80
A.4.3 WE (Reconnaissance and Full EIA surveys)
Information from maps:Units
Latitude of site 2 ° N/S Longitude of site 2 ° E/W National Grid Reference2
Distance from source of watercourse km Altitude of survey section m (to ca 5 m)
Physical characteristics of channel:6. Mean width of water (at time of survey) 111
7. Mean depth of water (at time of survey)3
8. Mean width of channel (bankfull)
9. Mean depth of channel (bankfull)
10. Water velocity (estimatedmean) -1TT1S
11. Water discharge In3 S•1
12. Slope of channel bed over survey length O (tO ca 1°)
13. Type of bed or water flow 7 categories 414. Relative stream power estimated 1-10 515. Channel form in plan 3 categories 6
16. Channel sinuosity 7 4 categories 8
17. Channel section 4 categories 9
18. Erosion as percentage of stream bank of section 5 categories 12
19. Substratum:
19.1 Bedrock or outcrops19.2 Boulders (> 256 mm)19.3 Cobbles (65-255mm)19.4 Pebbles and gravel (2.1-64.0mm)19.5 Sand (0.06-2.0 mm)19.6 Silt and clay (0.004-0.06mm)19.7 Organic or peat
Colour & natureof water (e.g. presence of particles)
Characteristics of adjacent land:Land use on watercoursebanks, and
visual features within 0.5 kmUpstreamfeaturesDownstreamfeaturesMaintenanceFishery interest
Biological information:List of all macroinvertebratefamilies 12or genera 13
in the watercourse14List of all plant genera 12or species '3growing in
channel and adjacentlandSketch map, detailing position and degree of cover of
the various plant stands 13,15
% cover, or proportion II% cover, or proportion "% cover, or proportion "% cover, or proportion "% cover, or proportion "% cover, or proportion "% cover, or proportion "description
Major cations present.34.1 Calcium34.2 Magnesium34.3 Sodium34.4 Potassium
Ion balance, derived from (33) & (34),(expressed as a ratio)
° CpH valuepsmg rl
m.e.l.mg 1-1mgmg 11 mg p mg 1.1
mg 11mg rlmg r'mg r'm.e.l.
Scoring:
Environmental data on physical parameters, flora and animals are summarised together witha score for environmental quality based on scales of 0-10 for flora and invertebrates togetherwith a correlation for management. Maintenance effects were scored on a -2 to +2 scalebroadly based on:-2 for channel resectioning and realignment;-1 for either channel realignment or for channel resectioning of both banks;-1/2for either channel realignment or for channel resectioning of one bank;0 a neutral score, for possible or historical management;+1 for unmanaged but agricultural banks especially rough grazing etc.;+2 for near natural conditions.(Combinations of these scores are also used).
The overall score is calculated by adding floral and invertebrate scores, correcting formaintenance score, and dividing by two.
NotesI determined from 1:25,000 0.5. maps.2 use of latitude/longitude or National Grid Reference optional.3 mean depth of pools noted in parentheses if present.4 waterfall; stepped; long riffle; riffle-pool with sequence distance (in m); glide or run;
smooth; or static or ponded.5 0-3 indicates bed and bank stable rivers and streams; 4-5 indicates rivers or large streams
with some bed scour or bank erosion or lateral migration; 6-8 indicates active riverswith rock or worked gravels and erosion or migration or both. Comment should beincluded.
6 Straight; meandering; or braided.
82
7 Current and previous where the situationmay have changed.Straightened; slight; moderate; or extreme. Value (in m) should be included to indicate
actual and previous amplitude.9 Slope; steep; vertical; or trapezoidalif managed,dredged or resectioned.19 Incising; flake or slab; slumpor slide; undercutor block fall; or depositions (with type
of material and position).11Proportionrepresentedby asterisks,where * = 20%.12 In reconnaissancesurveys.13 In full surveys.14 Samples taken by pond net sweepsin deep water and kick sampling in shallow water.15 Accuracy of maps achievedby stretchinga 100 m tape measure along the river bank.
83
A.4.4 Faunal Richness of Headwater Stream (Land-Use Survey)
The various land-use categories are coded alphanumerically (see land-use survey sheets).
A4.5 Fluvial AuditingUnits
Reach lengthPlanform 3 categoriesGradient 3 categories 2Width 3Depth 4Ration width/depthRiffle spacing m (or N/A)Number of points in reach (measured)Number of points in reach (estimated)
Stratification of bank materials yes 6/noBank vegetation categories:
15.1 Trees15.2 Herbs15.3 Grass15.4 Crop
Type of bank erosion where occurring 3 categories 6Structuresinspected in reach that are causing bed
erosion/deposition description, with N.G.R.Signs of river incising bed descriptionSigns of 'fresh' deposition descriptionRemarks/othernotes description
NotesBraided, meanderingor straight.
2 Steep (fall/pool); moderate (riffle/pool); or low (no obvious natural steps).3 Bank to bank at bankfull flow.
Bankfull, avoiding pools.3 If yes, provide sketch to show how.6 Flake, slide or block.
Flow:14.1 Cascade/torrential14.2 Turbulent/riffle/broken14.3 Glide/run - deep (> 30 cm)14.4 Glide/run - shallow (< 30 cm)14.5 Pool - deep (> 30 cm)14.6 Pool - shallow(< 30 cm)
Units
Description
Description
9 categoriesps crn4mg CaCO31-1
FR
categories A, S, C, F or Dwithin DD.5m and >0.5 m ofsurface 2categories A, S, C, F or Dwithin -0.5m and >0.5 m ofsurface 2categories A, S, C, F or D,within rn and >0.5 m ofsurface 2
m (to the nearest 1 m, foreach section, downst. toupstream).m (to nearest 0.1 m)
CM
C111
categories A, S, C, F or Dcategories A, S, C, F or Dcategories A, S, C, F or D 3categories A, S, C, F or D 3categories A, S, C, F or D 3
categories A, S, C, F or D 3categories A, S, C, F or D 3categories A, S, C, F or D 3categories A, S, C, F or D 3categories A, S, C, F or D 3categories A, S, C, F or D 3
85
15. Fish cover:15.1 Boulders/bedrock categoriesA, S, M, C or F15.2 Tree-root systems categoriesA, S, M, C or F °15.3 Branches/logs categoriesA, S, M, C or F15.4 Undercut banks (not incl. above) categoriesA,S, M, C or F °15.5 Instream vegetation categoriesA,.S, M, C or F °15.6 Deep water (not included above) 5 categoriesA, S, M, C or F 415.7 Other (specify) categoriesA, S, M, C or F °
Absent = 0%; Scarce = 1-5%; Common = 6-20%; FrequeriDen2he511%;>50%.4 percentageof stream bed area that provides cover suitablefor 10-20cm trout, estimatedas follows:
Absent = 0%; Scarce = < 1%; Moderate = 1-10%; CommoiFrequerW% 20%.5 For sections less than 5 m wide, deep water is > 50 cm; for sections greater than 5 m wide, deep
water is > 10% of width.
A4.7 Macrophyte and Vertebrate Survey, NRA (South West Region)
For subdivisionsof each category, see attachedfield check-list.
Botanical species list:Broad-leavedplants of the waters edgeTall emergents(includinggrasses)FloatingplantsSubmergedfine-leavedplantsSubmergedbroad-leavedmacrophytesLiverwortsMossesBenthic algaeBranchedfilamentousalgaeNet-formingalgaeUnbranchedfilamentousgreen algae
Vertebrates present:FishBirdsMammals
NotesPresence/absenceof species/highertaxa
86
A4.8 Biological Survey, NRA (Southern region)
UnitsNationalGrid ReferenceWidth (mean and range)Depth (mean and range) cmClarity descriptionMacrophytecoverSubstrate:
Physical characteristics:Channel widthAverage depth of channel centre
SubstrateMain flow typesWater clarityBank slopePossible sources of damage other than pollutionLandscape
Botanical characteristics:Plants above normal water level
Plants of the channel
Units
cm (can be estimated tonearest 25 cm).6 categories5 categories 24 categories 34 categories20+ categories 58 categories 6
species species
NotesBoulder; stone; gravel; sand; silt (including mud); or peat.
2 Negligible (water barely moving); slow (water obviously moving, water surface calm, andtrailing plant parts still); moderate (water surface somewhat disturbed and swirling,trailing plant parts moving); fast (water surface disturbed, trailing plant parts movingvigorously); or rapid (water surface broken by boulders or stones, much swirling anddisturbance).
3 Very turbid (bed cannot be seen over 30 cm down); turbid (bed visible between 30 and 75cm); clear (bed visible at over 75 cm down); or shallow clear (sites which appearclear but are too shallow to determine whether they should be rated as somewhatturbid or as clear.
4 Gentle (< 300); moderate (30-60°); steep (60-900); or vertical/undercut.5 Presence/absence of each of the following potential sources of damage: substantial shade
at sides or over whole channel; visitor trampling, paddling or swimming; cattledisturbance, trampling or grazing; boats; recent dredging; recent weed cutting;herbicides sprayed on emerged (or floating) species; aquatic herbicides used in thewater of the channel; roadworks affecting channel or temporarily causing extra mud,etc., to wash into channel; bed made of concrete, boulders or other coarse substrates;bed of man-made unstable substrate; undue turbulence or deep water caused by bridgepiers or other structures; unduly steep banks for the type of channel; unduly shallowor wide (if flow swift enough to cause scour), or unduly deep; in dykes, etc.,particularly, substantial lowering of water level during previous year; summer drying;fierce spates; very swift normal flow; regulation of flow; any other obvious sourceof damage.
6 Alluvial plains; lowland farmland; upland; mountain; very mountainous; lowlandmoorland; bog and hill; or blanket bog plains.
88
A4.10 Dorset Environmental Records Centre
Boxes on card marked as appropriate for parameters on detailed survey card.
AQUATIC HABITAT CARDDORSET ENVIRONMENTAL RECORDS ekNTRE..
SITE NAME.GRID REF.
STSi
SUSYIIII
It
OWNER
•
aCICShectares
AREAft/m (or length or river/ Ream)
ftALTITUDE
nsFreshwater Brackish Tidal
ACCESSPublicfootpath/.bridleway
RoadNo publicaccess
TENANT FLOWINGWATER
Streams leditches
< 21t wide
Slow movingditches. streams ILrivers 2 • I 0
Fast streamsit: riversb, 211 wide
Rivers
> lOft wide
Water flowingthroughout year
Usually dryin summer
STILL WATERSmall pond' up to 20ydz ( < I acre)
Likes
( > I acre)
La rger ponds
Standingwater
throughout year
Usual l y dryin summer
STATUS
Nature reserve
SSSI
Forestry Commission
National Trust
Private
Other
MAXIMUMDErni OFWATER (Approx)
<6in. 61n • I ft I . 2ft- .2 - Sit >5ft
SUBSTRATUM Shingle Sand Mud/Silt Clay Rock Organic detritus
WATERMARGIN
Rank higherthan 2ft
Bank lessthan 2ft
No bank
Wide belt ofmarginalaquatic veg.
>5ft
Narrow belt ofmarginalaquatic veg.
<5ft
No marginalbelt
TREESHADE
> 50% sha.ded by trees
<50% shadedby trees
No shade .
USE
ASSOCIATEDVEGETATION
.
Submergedvegetation
No or verylittle vecetagiun.so water
Reeds.Phragmnes)
Pond sedgestCarex ripanaC.:1011i fornth)
Reed Mace,,,,t 'ypnai
Other dominantvegetationspecify'
Mow/
sallow AlderOther trees/shrtsbsspecif y'.!
RECORDER .
Name: , • .
Address;
' Dale:d:'
.,.,........'tfo. of visits to site.. S./.-...r:e7:.(i....H.:.:..11:.'
ADJACENT LAND USE
Arable/leyPermanentpasture
Wet/water
meadows
scrubWoodland Carr Heathland Marsh/bog
Road/.railway
I louses/industrial
Waste ground(urban)
'
•
OUTSTANDINGINTERESTS
:.-.4.-:!-:'''.
Floweringplants
Other plantsspecify
Mammal, Birds Amphibia.
Fiah
OdonataE
Cal."0" ,nr"Ephemeroptera(mayflks)
Plecoptera
Otonerne4
Tricia optera
(cadthalk0
" Coleoptera
Meeth4.-
'--•Other animals
vecur—
-
89
A4.11 CPI (Conservation Potential Index)
Score assessments for each parameter given in square brackets.
L ASSESSMENT OF CURRENT STATUS.Units
Site details:N.G.R. (upstream and downstream points)Width of stretchGradient '
low [1], moderate [6] or high [12]low [1], moderate [7] or high [14]low [1], moderate [6] or high [12]low [1], moderate [6] or high [12]low [1], moderate [6] or high [12]
0 [0], 1/3 [0], 2/3 [0] or 1 [0]0 [0], 1/3 [1], 2/3 [2] or 1 [3]0 [0], 1/3 [4], 2/3 [6] or 1 [10]regulated [3] or unregulated [6]
yes [0] or no [5] yes [0] or no [5]
0 [0], 1/3 [1], 2/3 [5] or > 1 [10][1], 1-10 [3], 11-20 [6] or > 20 [10]
yes [0] or no [2]yes [0] or no [2]yes [0] or no [2]lA [10], 1B [8], 2 [5], 3 [2] or 4 [0]
Naturalness:Bank type as proportion of bank length 2:
9.1 Concrete9.2 Reinforced9.3 Natural
FlowChannel form.
11.1 Straightened11.2 Overwidened
Vegetated riparian buffer zone:12.1 As a proportion of
low [2], moderate [7] or high [17]low [1], moderate [3] or high [6]low [1], moderate [2] or high [5]low [1], moderate [3] or high [6]
Water qualityPhysical habitat characteristics:
19.1 Instream:
low [2], moderate [14] or high [32]
19.1.1 Flow diversity low [0], moderate [2] or high [5]19.1.2 Sinuosity low [0], moderate [1] or high [4]19.1.3 Depthvariability low [0], moderate [3] or high [6]19.1.4 Substratevariability low [0], moderate [2] or high [5]
19.2 Bank:19.2.1 Slopevariability low [0], moderate [3] or high [6]19.2.2 Substratevariability low [0], moderate [1] or high [4]
19.3 Adjacent land use (type) low [0], moderate [2] or high [6] 20. Vegetation:
20.1 Buffer width low [1], moderate [6] or high [12]20.2 Instream management low [1], moderate [4] or high [9]20.3 Banksidemanagement low [1], moderate [5] or high [11]
NotesI derived using OS 1:50,000or 1:10,000maps.2 long established flood defence schemes using earth and even reinforced banks taken as
'natural'.3 provision of 'fish pass' passable by all migratoryfish (including coarse stocks) scores 2.
Passes easily accessibleonly to more agile species (e.g. salmonids) scores 1.estimated as proportionof bank length.
5 assessments made on the potential (low, moderate or high) for improvements to waterquality, physical habitat and vegetation.
A4.12 IOD (International Commission on Irrigation and Drainage)(Bolton & Dawson, in press).
91
92
Appendix 5INSTITUTE OF FRESHWATER ECOLOGY
Progress report on River Corridor Strategic Overview Feasibility Study
To: National Rivers Authority Project Director, Dr P Raven, Conservation Officer, HeadOffice
This study evaluating the feasibility of a strategic overview of the conservation status andenhancement potential for the rivers of England and Wales has concentrated upon the specificobjectives of identifying the advantages and disadvantages of the options available.
Following an extensive period attempting to evaluate the correct philosophy behind themethodology proposed, data are being gathered on:
the type, extent and sources of available informationii the methods required for interpretation and classificationiii staff resources and expertise requirediv benefits and links with NRA and external organisations
possibilities of collaboration with external organisationsvi timescales involvedvii estimated costs andviii database and data handling requirements especially Geographic Information Systems.
The availability of large scale air-photography between 1986-91 has been tabulated forEngland and Wales together with air photography from:
The Ministry of Agriculture, Fisheries and Food air photo unit at medium scale (1:20,000)photography of eight of the national parks in England and Wales and large scale (1:10,000)air-photography within Environmentally Sensitive Areas and since 1986 large blocks dispersedthroughout England and Wales, frequently in colour and in the majority of cases at 1:10,000scale.
Royal Commission for Historic Monuments, a specialist collection of 500,000 oblique airphotographs and a general collection (various scales, dates) of 4 million vertical airphotographs. The majority of the vertical air photography is black and white and mediumscale (1:20,000) but 1985 photography is not being added to the archive.
Geonex which much of this is county cover (6), the most recent of which was flown at1:10,000 scale in colour to coincide with the 1991 census; this represents a potentiallyimportant source of information for river corridor analysis.
Hunting Aerofilms fly a considerable amount of air-photography each year, mostly forcounty councils at 1:10,000 scale in colour. However, the acquisition of new air-photos inEngland and Wales remains uncoordinated. Air photo acquisition costs are being assessedbut at 1:10,000 scale and at an average cost of £10 per print (£3.20 km2), the total cost tocover England and Wales would be £480,000.
93
To determine information content for river coiridors, a trial interpretation of 1:10,000 and1:3,000 scale colour air-photography of a section of the River Kennet (Chiltern Foliat -Knighton) is being undertaken.
Satellite imagery
SPOT and Landsat Thematic Mapper (TM) have sufficient spatial and spectral resolution toprovide accurate land cover maps of UK but the resolution must be assessed in view ofdeveloping enhancement techniques.
The Landsat Thematic Mapper (TM) has a 30 m pixel size optimal for mapping landcover in UK, given typical field size and includes a mid-infrared waveband (TM5: 1.55 - 1.75 microns) which provides considerable additional discriminatory power for vegetation mapping.
SPOT 2 launched in 1990 has a 20 m pixel size in multispectral (XS) mode and a 10 m pixelsize in panchromatic (Pan) mode, but the choice of adopting solid state array (CCD)technology, limits to 3 (visible green ( ), visible red ( ) and near-infrared ( ), limitingdiscrimination of vegetable types.
Airborne thematic mapper (ATM) records 11-channel in the 0.43 - 13.00 micron region.Depending upon flying height, pixel size varies between 1-20 m and has the advantage of thescanner compared with conventional air-photography is the availability of spectral channelsfrom the visible, near-infrared, short and long wavelength infrared.
Databases of environmental information systems include
Soil Survey and Land Research centre (SSLRC), Land Information System (LandIS) onsoil data and is available in raster format for England and Wales (1:250,000) with less at1:24,000 and 1:50,000 plus altitude, local authority boundaries, mean annual monthly, summerand excess winter rainfall totals, temperature, soil moisture deficit;
the ITE Land Classification System incorporates a wide range of environmental variables,including climate, topography, human geography, solid and superficial geology, with the landclasses showing well-defined distributions;
ITE satellite land cover map of Great Britain with a range of land cover classes for theITE satellite land cover including woodland, semi-natural vegetation, arable, development,water, bare ground, often subdivided several times.
The Water Information System (WIS) developed by the Institute of Hydrology (IH), has beenassessed, as have river corridor and associated surveys including RBSQ/River CorridorSurvey, RIVPACS, 1FE(Botany), Faunal Richness of Headwater Streams (Land-Use Survey),Fluvial Auditing, HABSCORE, Macrophyte and Biological Survey, Haslam Survey, DorsetEnvironmental Records Centre, ICID and other miscellaneous ones.
94
DISTRIBUTION SHEETTo be completed by all Project Leaders completing commissioned research project reports. Pleasebind a copy of this distribution sheet as the final page in all internal (IFE) copies of the report.
Authors:F.H. Dawson, F.H. Griffiths, R.M.K. SaundersTitle: River Corridor Strategic Oerview Feasibility StudyReport Ref.: T11053r1/1Master copy held by: D.M. MortonReport access code (please assign a suitable code from list below):C
DISTRIBUTION LIST (A-G standard distribution; H other) No.copies Date
9.3.924. I.S. Farr 1 9.3.925. G. George 1 9.3.926. G. Dean, Huntings 2 9.3.927. A. Shand 1 9.3.928. Botany 1 9.3.929.
10.
Total number of copies made 69 •
REPORT ACCESS CODESIn strict confidence - restricted access Access to named customer(s) - (could be namedrestricted access individuals), IFE Directorate, Project Leader and all authors.In confidence - restricted access Access to customer, IFE Directorate, Project Leader, allauthors, and IFE staff with permission of Project Leader.'Normal' access Access to customer and all IFE staff Access to visitors and general publicwith permission of Project Leader.General access General access to anyone as required.