Fresno Unified School District Board Communication BC Number EA-1 From the Office of the Superintendent Date: October 23, 2020 To the Members of the Board of Education Prepared by: Kristi Imberi-Olivares, Director Phone Number: 457-3896 Cabinet Approval: Regarding: Academic Progress Update for Quarter 1 The Purpose of this communication is to provide the Board with information regarding academic metrics for Fresno Unified. In 2019/20, 51,430 students (77%) completed i-Ready Diagnostic 1. In 2020/21, 54,286 students (83%) completed i-Ready Diagnostic 1. Please note that students in Kinder were not required to test in 2019/20. The metrics included in this Board communication are: • Quarter 1 2019/20 and 2020/21 academic grades o Only students in grades 3-12 receive letter grades. o Academic grades in elementary are composite grades that combine both writing and reading. • 2020/21 i-Ready Diagnostic 1 performance results for reading and math, including average performance grade level placement, including disproportionality among student groups o i-Ready data is presented in standard view which is used to understand how students are performing during the school year. Standard view considers a student to be on grade level if the student is performing early, mid, or late in current grade level. o Only students in grades K-11 take the i-Ready diagnostic. • 2020/21 Cycle 1 redesignation o Administration of the Summative ELPAC 2019/20 was suspended because of COVID-19- related school closures. To support redesignation of English Learner students who were unable to complete testing in 2019/20, the California Department of Education (CDE) extended an optional administration of the 2019/20 Summative ELPAC to occur in fall 2020. Fresno Unified began the Summative ELPAC 2019/20 optional test administration on September 1, 2020 and will complete testing on October 30, 2020. English Learner students who completed the optional Summative ELPAC 2019/20 this fall and are eligible for redesignation are not included in Cycle 1 redesignation and will be included in Cycle 2. Please note that disproportionality refers to a student group's representation in a particular category that differs from the representation of other student groups in that same category. Ideally, we want each group to have a disproportionality ratio of 1.0. This means that the student group is being equally represented in that specific data measure as they are in our total population. The higher the ratio, the higher they are being represented. Student groups that have a disproportionality ratio above 1.0 are over-represented in a particular category. Student groups that have a disproportionality ratio below 1.0 are under-represented in a particular category. For example, a ratio of 2.0, means that a particular
Transcript
Fresno Unified School District Board Communication
BC Number EA-1
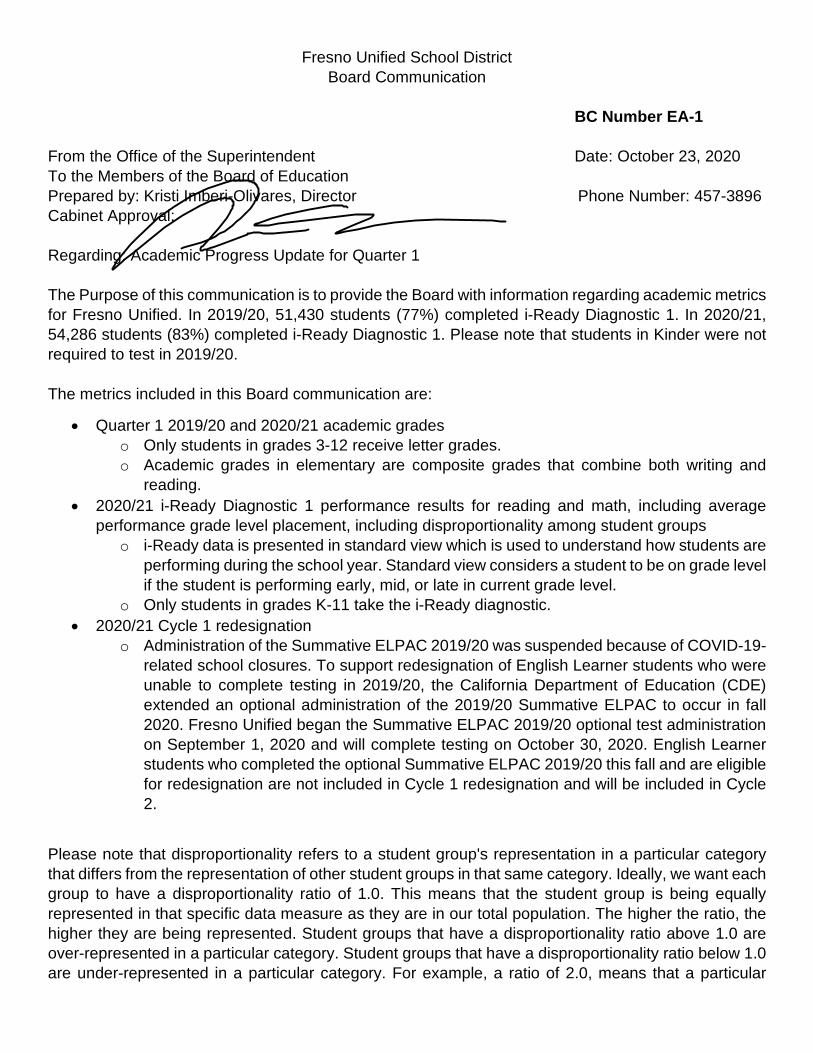
From the Office of the Superintendent Date: October 23, 2020 To the Members of the Board of Education Prepared by: Kristi Imberi-Olivares, Director Phone Number: 457-3896 Cabinet Approval:
Regarding: Academic Progress Update for Quarter 1
The Purpose of this communication is to provide the Board with information regarding academic metrics for Fresno Unified. In 2019/20, 51,430 students (77%) completed i-Ready Diagnostic 1. In 2020/21, 54,286 students (83%) completed i-Ready Diagnostic 1. Please note that students in Kinder were not required to test in 2019/20.
The metrics included in this Board communication are:
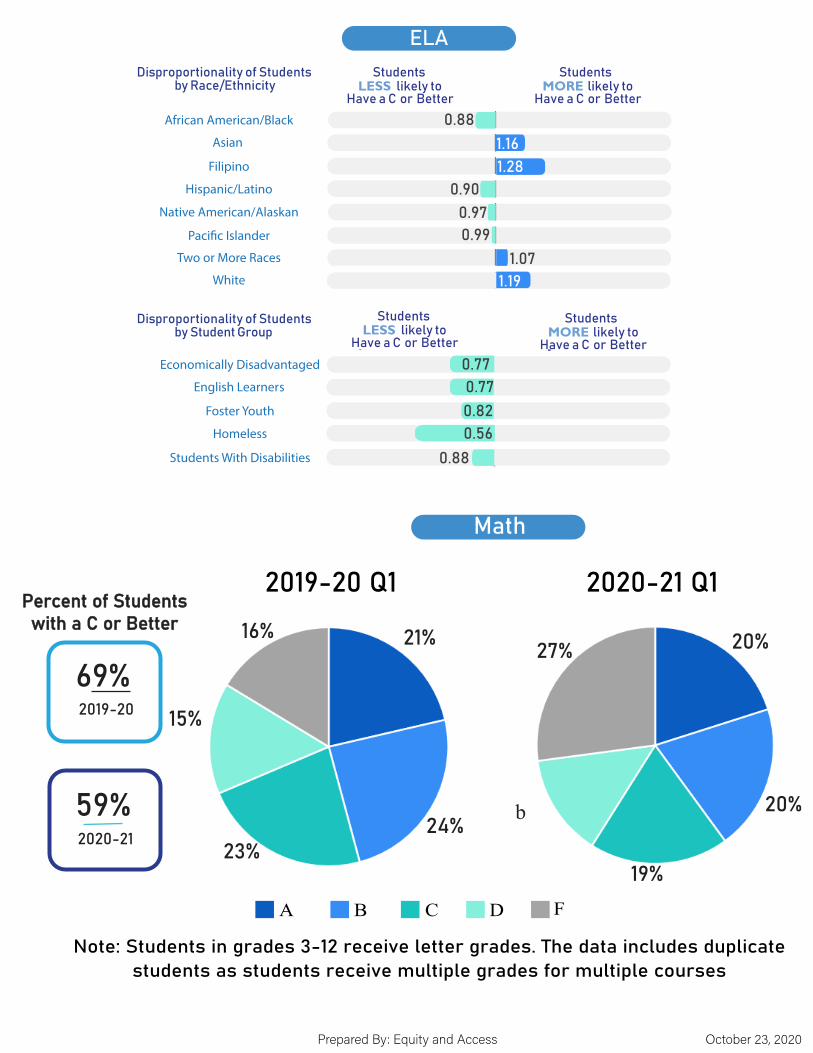
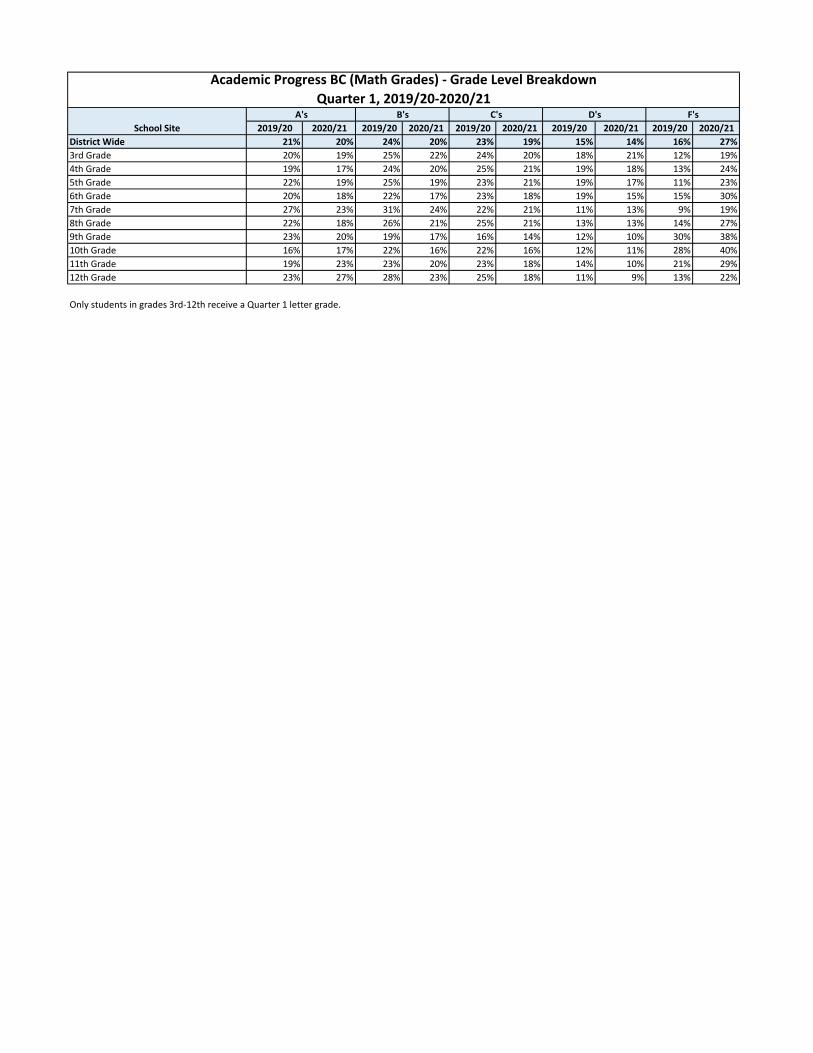
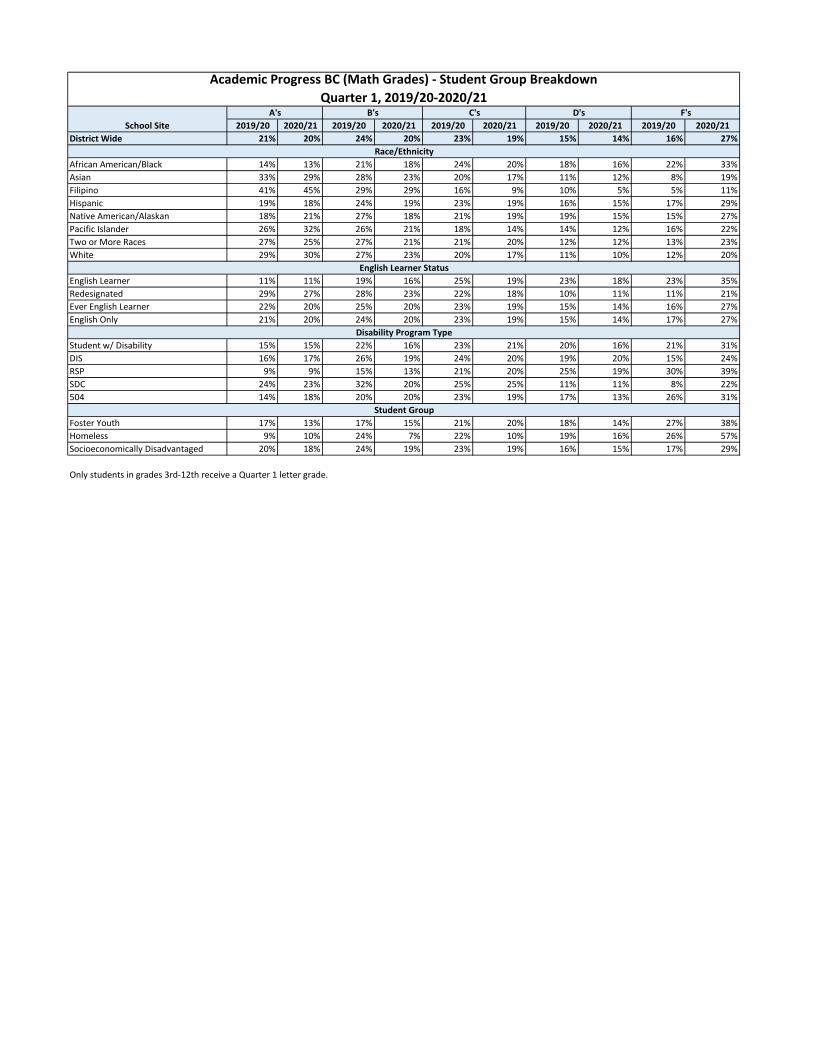
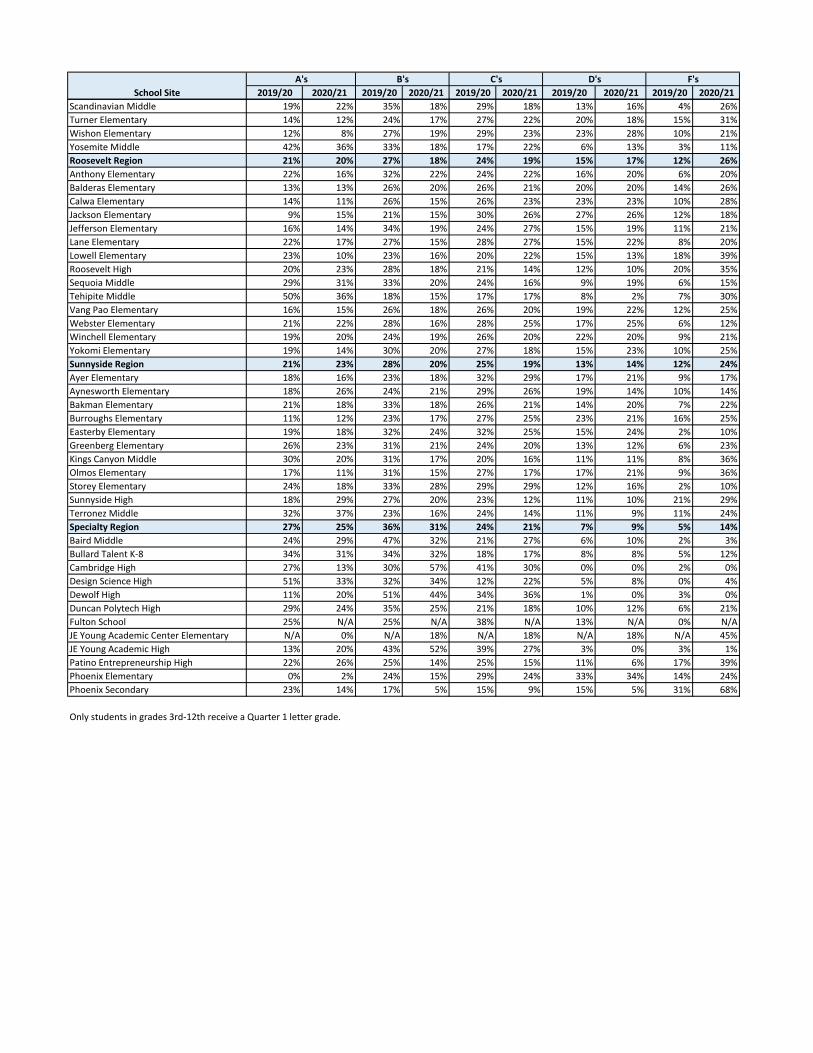
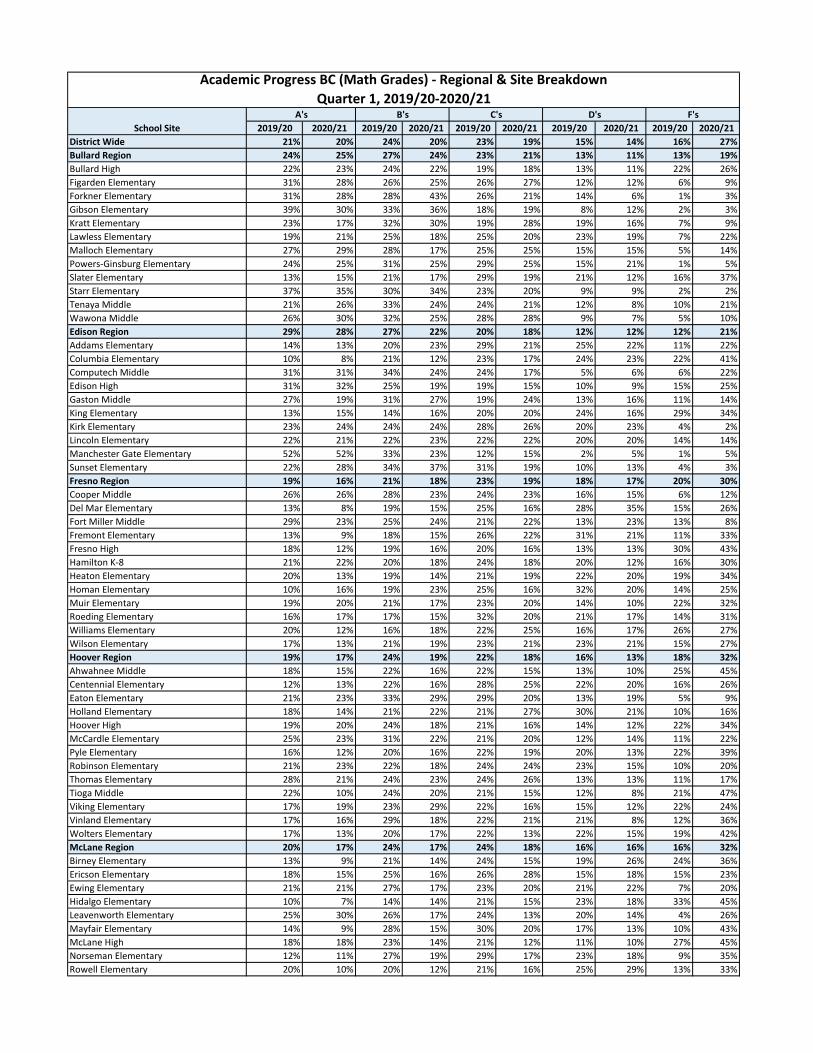
• Quarter 1 2019/20 and 2020/21 academic gradeso Only students in grades 3-12 receive letter grades.o Academic grades in elementary are composite grades that combine both writing and
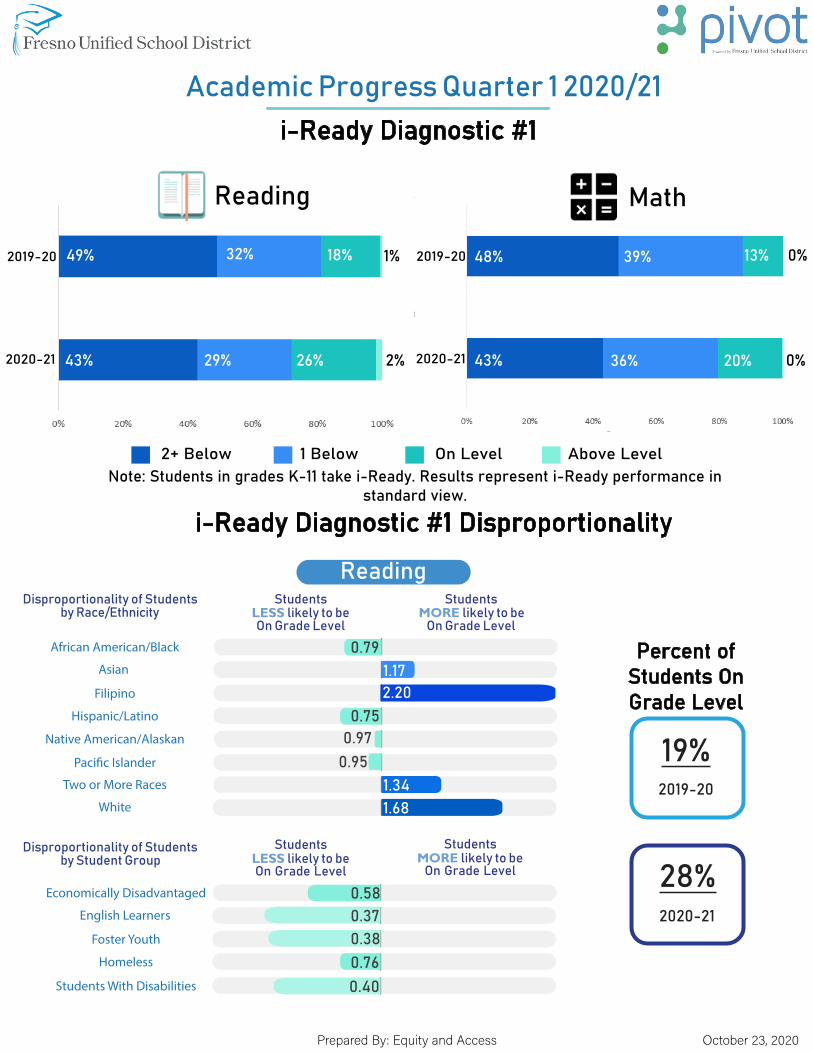
reading.• 2020/21 i-Ready Diagnostic 1 performance results for reading and math, including average
performance grade level placement, including disproportionality among student groupso i-Ready data is presented in standard view which is used to understand how students are
performing during the school year. Standard view considers a student to be on grade levelif the student is performing early, mid, or late in current grade level.
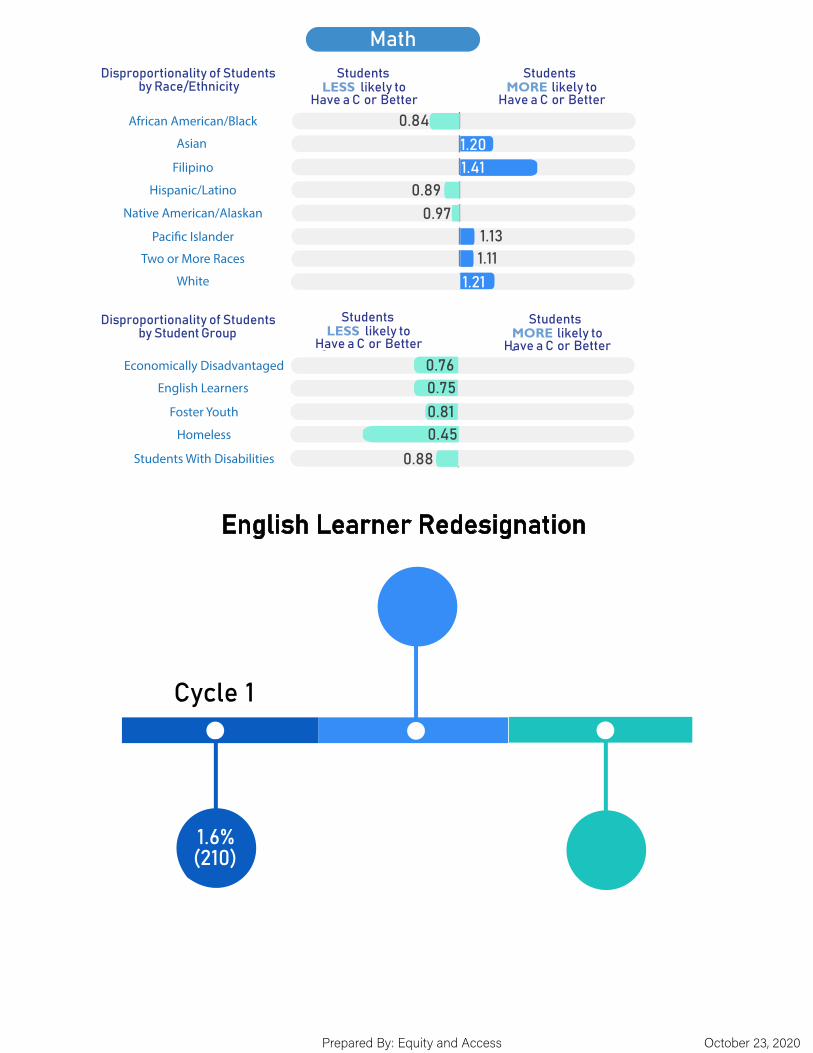
o Only students in grades K-11 take the i-Ready diagnostic.• 2020/21 Cycle 1 redesignation
o Administration of the Summative ELPAC 2019/20 was suspended because of COVID-19-related school closures. To support redesignation of English Learner students who wereunable to complete testing in 2019/20, the California Department of Education (CDE)extended an optional administration of the 2019/20 Summative ELPAC to occur in fall2020. Fresno Unified began the Summative ELPAC 2019/20 optional test administrationon September 1, 2020 and will complete testing on October 30, 2020. English Learnerstudents who completed the optional Summative ELPAC 2019/20 this fall and are eligiblefor redesignation are not included in Cycle 1 redesignation and will be included in Cycle2.
Please note that disproportionality refers to a student group's representation in a particular category that differs from the representation of other student groups in that same category. Ideally, we want each group to have a disproportionality ratio of 1.0. This means that the student group is being equally represented in that specific data measure as they are in our total population. The higher the ratio, the higher they are being represented. Student groups that have a disproportionality ratio above 1.0 are over-represented in a particular category. Student groups that have a disproportionality ratio below 1.0 are under-represented in a particular category. For example, a ratio of 2.0, means that a particular
student group is being represented twice as much in the category compared to their representation in our total student population.
Supervisors of Schools (SOS), Curriculum, Instruction, and Professional Learning (CIPL), and Equity and Access (E&A) departments are leading important actions and next steps associated with these unprecedented times:
• Assessment Committee and Assessment Sub-Committees continue to meet towardrecommending next steps and alignment of assessments. For 2020/21, a recommendation bythe Kindergarten Sub-Committee was the addition of the Foundational Skills Assessments (FSA)tool for capturing data in conjunction with i-Ready data.
• School sites continue to engage in grading conversations and guidance to align their practicesto the Board Policies (BP) and Administrative Regulations (AR).
• Schools continue to leverage school Professional Learning Communities (PLC) and InstructionalLeadership Teams (ILT) toward consistency in grading practices.
• Departments will continue to use data from all sources as opportunities to learn, inform, andguide next steps in the areas of instruction, professional learning, and accountability.
Also included in this Board communication are district-level regional and student group reports for quarter 1 academic grades, i-Ready diagnostic 1 performance and Cycle 1 2020/21 English Learner redesignation rates.
If you have further questions or require additional information, please contact Lindsay Sanders at (559) 457-3471.
Approved by Superintendent Robert G. Nelson Ed.D. Date: 10/23/2020
Academic Progress Quarter 1 2020/21
Disproportionality of Studentsby Race/Ethnicity
StudentsMORE likely to be
Grade Level
StudentsLESS likely to be
Grade Level
Disproportionality of Studentsby Student Group
StudentsMORE likely to be
StudentsLESS likely to be
2020-21
0.791.172.20
0.750.97
0.951.341.68
0.580.370.380.76
0.40
Note: Students in grades K-11 take i-Ready. Results represent i-Ready performance in standard view.
2019-20
2020-21
%
StudentsMORE likely to be
Grade Level
StudentsLESS likely to be
Grade Level
Disproportionality of Studentsby Student Group
StudentsMORE likely to be
Grade Level
StudentsLESS likely to be
Grade Level
Disproportionality of Studentsby Race/Ethnicity
%
2020-21
63%
A B C D F
0.661.27
2.100.760.81
1.061.391.64
0.460.41
0.620.58
0.32
Percent of Students with a C or Better
Note: Students in grades 3-12 receive letter grades. The data includes duplicate students as students receive multiple grades for multiple courses
StudentsMORE likely to
Have a C or Better
StudentsLESS likely to
Have a C or Better
Disproportionality of Studentsby Student Group
Disproportionality of Studentsby Race/Ethnicity
0.88
1.161.28
0.900.970.99
1.071.19
0.770.77
0.820.56
0.88
ELA
StudentsMORE likely to
Have a C or Better
StudentsLESS likely to
Have a C or Better
2019-20
2020-21
59%
A B C D F
Percent of Students with a C or Better
Note: Students in grades 3-12 receive letter grades. The data includes duplicate students as students receive multiple grades for multiple courses
Only students in grades 3rd-12th receive a Quarter 1 letter grade.
Reading i-Ready
D1
Test Taker Counts
On or Above Grade Level
Phon.Awareness
High Frequency
Words Vocabulary LiteratureInformation.
Text
School 2 or More
Grade Levels Below
1
Grade Level Below
Overall PerformancePercentage of Students
Percentage of Students on or Above Grade Level in Reading Domains
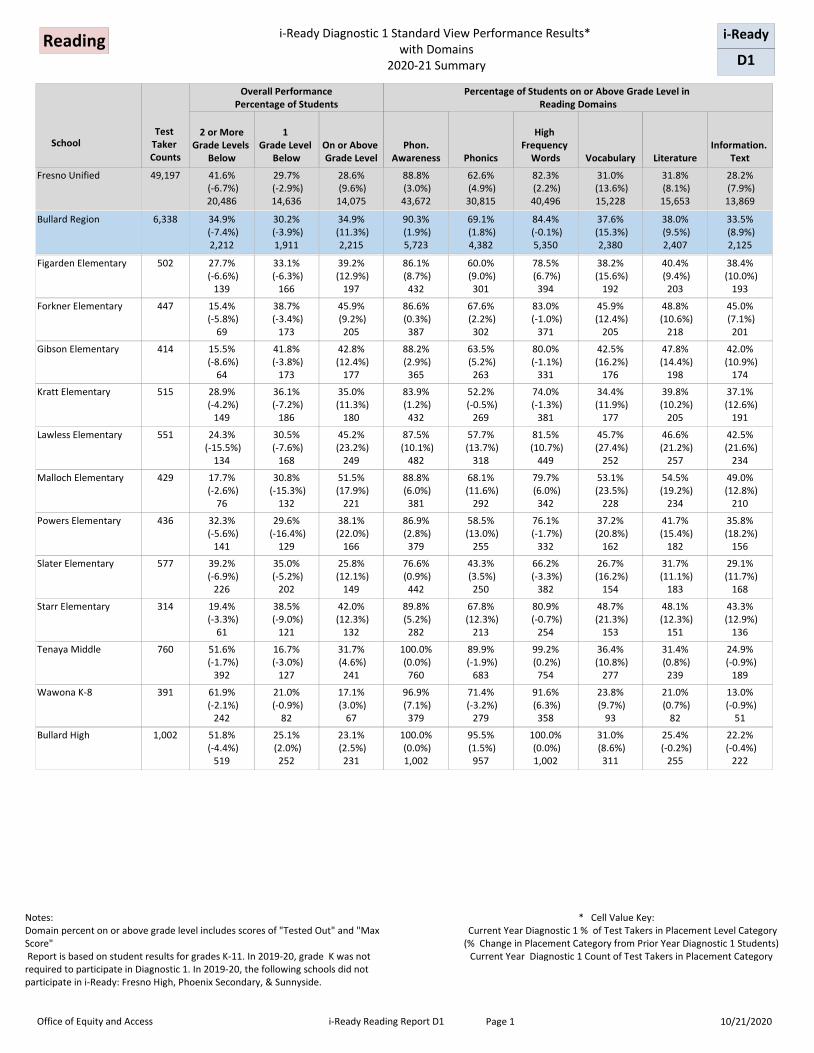
Fresno Unified 49,197 41.6% (-6.7%)20,486
29.7% (-2.9%)14,636
28.6% (9.6%)14,075
88.8% (3.0%)43,672
82.3% (2.2%)40,496
31.0% (13.6%)15,228
31.8% (8.1%)15,653
28.2% (7.9%)13,869
i-Ready Diagnostic 1 Standard View Performance Results* with Domains
2020-21 Summary
Phonics
62.6% (4.9%)30,815
Bullard Region 6,338 34.9% (-7.4%)2,212
30.2% (-3.9%)1,911
34.9% (11.3%)
2,215
90.3% (1.9%)5,723
84.4% (-0.1%)5,350
37.6% (15.3%)
2,380
38.0% (9.5%)2,407
33.5% (8.9%)2,125
69.1% (1.8%)4,382
Figarden Elementary 502 27.7% (-6.6%)
139
33.1% (-6.3%)
166
39.2% (12.9%)
197
86.1% (8.7%)
432
78.5% (6.7%)
394
38.2% (15.6%)
192
40.4% (9.4%)
203
38.4% (10.0%)
193
60.0% (9.0%)
301
Forkner Elementary 447 15.4% (-5.8%)
69
38.7% (-3.4%)
173
45.9% (9.2%)
205
86.6% (0.3%)
387
83.0% (-1.0%)
371
45.9% (12.4%)
205
48.8% (10.6%)
218
45.0% (7.1%)
201
67.6% (2.2%)
302
Gibson Elementary 414 15.5% (-8.6%)
64
41.8% (-3.8%)
173
42.8% (12.4%)
177
88.2% (2.9%)
365
80.0% (-1.1%)
331
42.5% (16.2%)
176
47.8% (14.4%)
198
42.0% (10.9%)
174
63.5% (5.2%)
263
Kratt Elementary 515 28.9% (-4.2%)
149
36.1% (-7.2%)
186
35.0% (11.3%)
180
83.9% (1.2%)
432
74.0% (-1.3%)
381
34.4% (11.9%)
177
39.8% (10.2%)
205
37.1% (12.6%)
191
52.2% (-0.5%)
269
Lawless Elementary 551 24.3% (-15.5%)
134
30.5% (-7.6%)
168
45.2% (23.2%)
249
87.5% (10.1%)
482
81.5% (10.7%)
449
45.7% (27.4%)
252
46.6% (21.2%)
257
42.5% (21.6%)
234
57.7% (13.7%)
318
Malloch Elementary 429 17.7% (-2.6%)
76
30.8% (-15.3%)
132
51.5% (17.9%)
221
88.8% (6.0%)
381
79.7% (6.0%)
342
53.1% (23.5%)
228
54.5% (19.2%)
234
49.0% (12.8%)
210
68.1% (11.6%)
292
Powers Elementary 436 32.3% (-5.6%)
141
29.6% (-16.4%)
129
38.1% (22.0%)
166
86.9% (2.8%)
379
76.1% (-1.7%)
332
37.2% (20.8%)
162
41.7% (15.4%)
182
35.8% (18.2%)
156
58.5% (13.0%)
255
Slater Elementary 577 39.2% (-6.9%)
226
35.0% (-5.2%)
202
25.8% (12.1%)
149
76.6% (0.9%)
442
66.2% (-3.3%)
382
26.7% (16.2%)
154
31.7% (11.1%)
183
29.1% (11.7%)
168
43.3% (3.5%)
250
Starr Elementary 314 19.4% (-3.3%)
61
38.5% (-9.0%)
121
42.0% (12.3%)
132
89.8% (5.2%)
282
80.9% (-0.7%)
254
48.7% (21.3%)
153
48.1% (12.3%)
151
43.3% (12.9%)
136
67.8% (12.3%)
213
Tenaya Middle 760 51.6% (-1.7%)
392
16.7% (-3.0%)
127
31.7% (4.6%)
241
100.0% (0.0%)
760
99.2% (0.2%)
754
36.4% (10.8%)
277
31.4% (0.8%)
239
24.9% (-0.9%)
189
89.9% (-1.9%)
683
Wawona K-8 391 61.9% (-2.1%)
242
21.0% (-0.9%)
82
17.1% (3.0%)
67
96.9% (7.1%)
379
91.6% (6.3%)
358
23.8% (9.7%)
93
21.0% (0.7%)
82
13.0% (-0.9%)
51
71.4% (-3.2%)
279
Bullard High 1,002 51.8% (-4.4%)
519
25.1% (2.0%)
252
23.1% (2.5%)
231
100.0% (0.0%)1,002
100.0% (0.0%)1,002
31.0% (8.6%)
311
25.4% (-0.2%)
255
22.2% (-0.4%)
222
95.5% (1.5%)
957
Office of Equity and Access i-Ready Reading Report D1 10/21/2020Page 1
* Cell Value Key: Current Year Diagnostic 1 % of Test Takers in Placement Level Category (% Change in Placement Category from Prior Year Diagnostic 1 Students)
Current Year Diagnostic 1 Count of Test Takers in Placement Category
Notes: Domain percent on or above grade level includes scores of "Tested Out" and "Max Score" Report is based on student results for grades K-11. In 2019-20, grade K was not required to participate in Diagnostic 1. In 2019-20, the following schools did not participate in i-Ready: Fresno High, Phoenix Secondary, & Sunnyside.
Reading i-Ready
D1
Test Taker Counts
On or Above Grade Level
Phon.Awareness
High Frequency
Words Vocabulary LiteratureInformation.
Text
School 2 or More
Grade Levels Below
1
Grade Level Below
Overall PerformancePercentage of Students
Percentage of Students on or Above Grade Level in Reading Domains
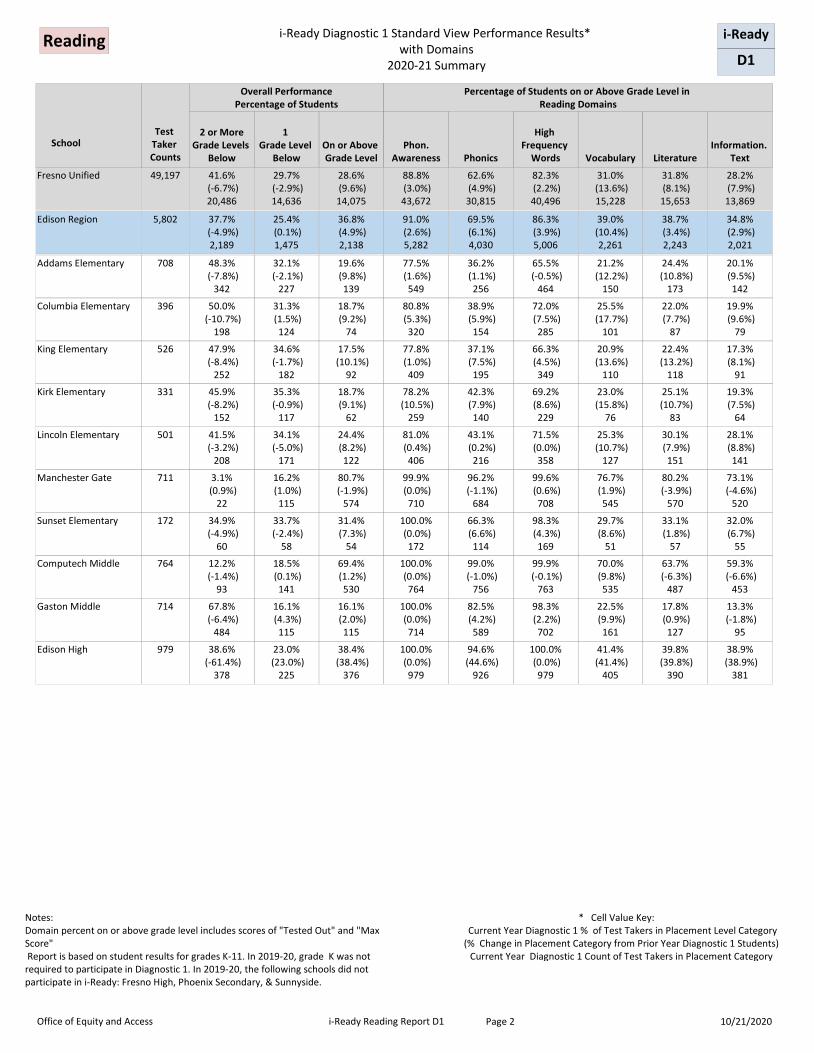
Fresno Unified 49,197 41.6% (-6.7%)20,486
29.7% (-2.9%)14,636
28.6% (9.6%)14,075
88.8% (3.0%)43,672
82.3% (2.2%)40,496
31.0% (13.6%)15,228
31.8% (8.1%)15,653
28.2% (7.9%)13,869
i-Ready Diagnostic 1 Standard View Performance Results* with Domains
2020-21 Summary
Phonics
62.6% (4.9%)30,815
Edison Region 5,802 37.7% (-4.9%)2,189
25.4% (0.1%)1,475
36.8% (4.9%)2,138
91.0% (2.6%)5,282
86.3% (3.9%)5,006
39.0% (10.4%)
2,261
38.7% (3.4%)2,243
34.8% (2.9%)2,021
69.5% (6.1%)4,030
Addams Elementary 708 48.3% (-7.8%)
342
32.1% (-2.1%)
227
19.6% (9.8%)
139
77.5% (1.6%)
549
65.5% (-0.5%)
464
21.2% (12.2%)
150
24.4% (10.8%)
173
20.1% (9.5%)
142
36.2% (1.1%)
256
Columbia Elementary 396 50.0% (-10.7%)
198
31.3% (1.5%)
124
18.7% (9.2%)
74
80.8% (5.3%)
320
72.0% (7.5%)
285
25.5% (17.7%)
101
22.0% (7.7%)
87
19.9% (9.6%)
79
38.9% (5.9%)
154
King Elementary 526 47.9% (-8.4%)
252
34.6% (-1.7%)
182
17.5% (10.1%)
92
77.8% (1.0%)
409
66.3% (4.5%)
349
20.9% (13.6%)
110
22.4% (13.2%)
118
17.3% (8.1%)
91
37.1% (7.5%)
195
Kirk Elementary 331 45.9% (-8.2%)
152
35.3% (-0.9%)
117
18.7% (9.1%)
62
78.2% (10.5%)
259
69.2% (8.6%)
229
23.0% (15.8%)
76
25.1% (10.7%)
83
19.3% (7.5%)
64
42.3% (7.9%)
140
Lincoln Elementary 501 41.5% (-3.2%)
208
34.1% (-5.0%)
171
24.4% (8.2%)
122
81.0% (0.4%)
406
71.5% (0.0%)
358
25.3% (10.7%)
127
30.1% (7.9%)
151
28.1% (8.8%)
141
43.1% (0.2%)
216
Manchester Gate 711 3.1% (0.9%)
22
16.2% (1.0%)
115
80.7% (-1.9%)
574
99.9% (0.0%)
710
99.6% (0.6%)
708
76.7% (1.9%)
545
80.2% (-3.9%)
570
73.1% (-4.6%)
520
96.2% (-1.1%)
684
Sunset Elementary 172 34.9% (-4.9%)
60
33.7% (-2.4%)
58
31.4% (7.3%)
54
100.0% (0.0%)
172
98.3% (4.3%)
169
29.7% (8.6%)
51
33.1% (1.8%)
57
32.0% (6.7%)
55
66.3% (6.6%)
114
Computech Middle 764 12.2% (-1.4%)
93
18.5% (0.1%)
141
69.4% (1.2%)
530
100.0% (0.0%)
764
99.9% (-0.1%)
763
70.0% (9.8%)
535
63.7% (-6.3%)
487
59.3% (-6.6%)
453
99.0% (-1.0%)
756
Gaston Middle 714 67.8% (-6.4%)
484
16.1% (4.3%)
115
16.1% (2.0%)
115
100.0% (0.0%)
714
98.3% (2.2%)
702
22.5% (9.9%)
161
17.8% (0.9%)
127
13.3% (-1.8%)
95
82.5% (4.2%)
589
Edison High 979 38.6% (-61.4%)
378
23.0% (23.0%)
225
38.4% (38.4%)
376
100.0% (0.0%)
979
100.0% (0.0%)
979
41.4% (41.4%)
405
39.8% (39.8%)
390
38.9% (38.9%)
381
94.6% (44.6%)
926
Office of Equity and Access i-Ready Reading Report D1 10/21/2020Page 2
* Cell Value Key: Current Year Diagnostic 1 % of Test Takers in Placement Level Category (% Change in Placement Category from Prior Year Diagnostic 1 Students)
Current Year Diagnostic 1 Count of Test Takers in Placement Category
Notes: Domain percent on or above grade level includes scores of "Tested Out" and "Max Score" Report is based on student results for grades K-11. In 2019-20, grade K was not required to participate in Diagnostic 1. In 2019-20, the following schools did not participate in i-Ready: Fresno High, Phoenix Secondary, & Sunnyside.
Reading i-Ready
D1
Test Taker Counts
On or Above Grade Level
Phon.Awareness
High Frequency
Words Vocabulary LiteratureInformation.
Text
School 2 or More
Grade Levels Below
1
Grade Level Below
Overall PerformancePercentage of Students
Percentage of Students on or Above Grade Level in Reading Domains
Fresno Unified 49,197 41.6% (-6.7%)20,486
29.7% (-2.9%)14,636
28.6% (9.6%)14,075
88.8% (3.0%)43,672
82.3% (2.2%)40,496
31.0% (13.6%)15,228
31.8% (8.1%)15,653
28.2% (7.9%)13,869
i-Ready Diagnostic 1 Standard View Performance Results* with Domains
Office of Equity and Access i-Ready Reading Report D1 10/21/2020Page 3
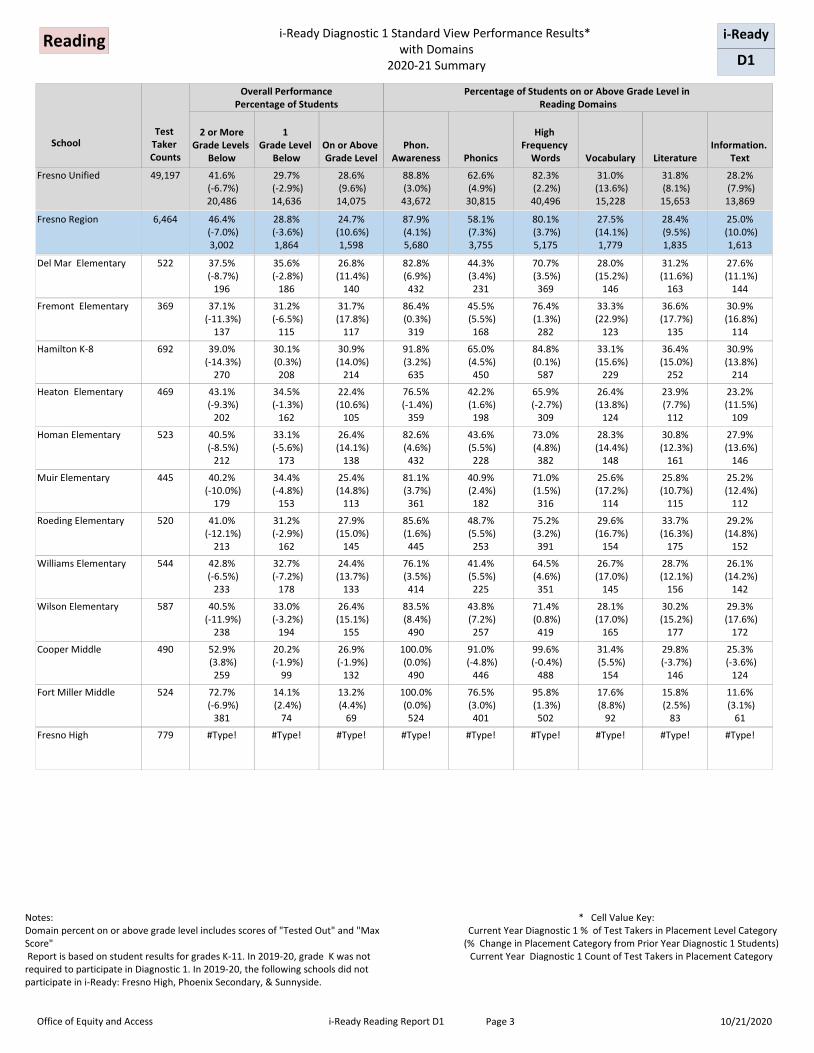
* Cell Value Key: Current Year Diagnostic 1 % of Test Takers in Placement Level Category (% Change in Placement Category from Prior Year Diagnostic 1 Students)
Current Year Diagnostic 1 Count of Test Takers in Placement Category
Notes: Domain percent on or above grade level includes scores of "Tested Out" and "Max Score" Report is based on student results for grades K-11. In 2019-20, grade K was not required to participate in Diagnostic 1. In 2019-20, the following schools did not participate in i-Ready: Fresno High, Phoenix Secondary, & Sunnyside.
Reading i-Ready
D1
Test Taker Counts
On or Above Grade Level
Phon.Awareness
High Frequency
Words Vocabulary LiteratureInformation.
Text
School 2 or More
Grade Levels Below
1
Grade Level Below
Overall PerformancePercentage of Students
Percentage of Students on or Above Grade Level in Reading Domains
Fresno Unified 49,197 41.6% (-6.7%)20,486
29.7% (-2.9%)14,636
28.6% (9.6%)14,075
88.8% (3.0%)43,672
82.3% (2.2%)40,496
31.0% (13.6%)15,228
31.8% (8.1%)15,653
28.2% (7.9%)13,869
i-Ready Diagnostic 1 Standard View Performance Results* with Domains
2020-21 Summary
Phonics
62.6% (4.9%)30,815
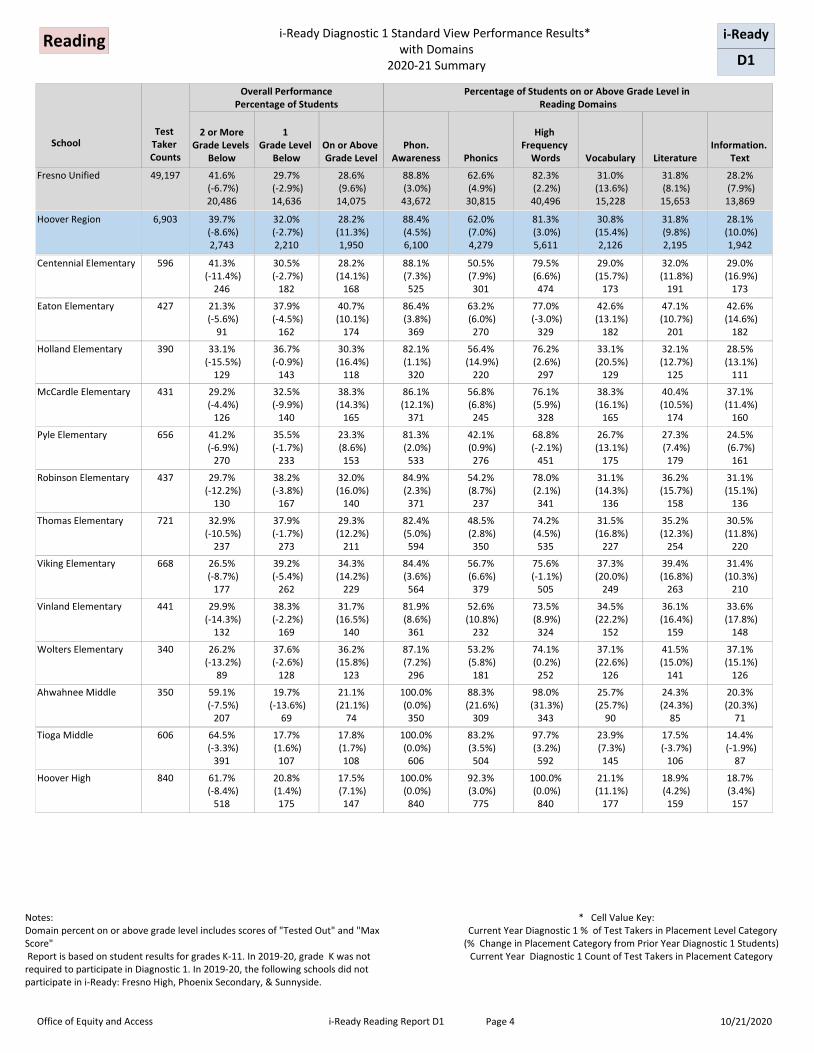
Hoover Region 6,903 39.7% (-8.6%)2,743
32.0% (-2.7%)2,210
28.2% (11.3%)
1,950
88.4% (4.5%)6,100
81.3% (3.0%)5,611
30.8% (15.4%)
2,126
31.8% (9.8%)2,195
28.1% (10.0%)
1,942
62.0% (7.0%)4,279
Centennial Elementary 596 41.3% (-11.4%)
246
30.5% (-2.7%)
182
28.2% (14.1%)
168
88.1% (7.3%)
525
79.5% (6.6%)
474
29.0% (15.7%)
173
32.0% (11.8%)
191
29.0% (16.9%)
173
50.5% (7.9%)
301
Eaton Elementary 427 21.3% (-5.6%)
91
37.9% (-4.5%)
162
40.7% (10.1%)
174
86.4% (3.8%)
369
77.0% (-3.0%)
329
42.6% (13.1%)
182
47.1% (10.7%)
201
42.6% (14.6%)
182
63.2% (6.0%)
270
Holland Elementary 390 33.1% (-15.5%)
129
36.7% (-0.9%)
143
30.3% (16.4%)
118
82.1% (1.1%)
320
76.2% (2.6%)
297
33.1% (20.5%)
129
32.1% (12.7%)
125
28.5% (13.1%)
111
56.4% (14.9%)
220
McCardle Elementary 431 29.2% (-4.4%)
126
32.5% (-9.9%)
140
38.3% (14.3%)
165
86.1% (12.1%)
371
76.1% (5.9%)
328
38.3% (16.1%)
165
40.4% (10.5%)
174
37.1% (11.4%)
160
56.8% (6.8%)
245
Pyle Elementary 656 41.2% (-6.9%)
270
35.5% (-1.7%)
233
23.3% (8.6%)
153
81.3% (2.0%)
533
68.8% (-2.1%)
451
26.7% (13.1%)
175
27.3% (7.4%)
179
24.5% (6.7%)
161
42.1% (0.9%)
276
Robinson Elementary 437 29.7% (-12.2%)
130
38.2% (-3.8%)
167
32.0% (16.0%)
140
84.9% (2.3%)
371
78.0% (2.1%)
341
31.1% (14.3%)
136
36.2% (15.7%)
158
31.1% (15.1%)
136
54.2% (8.7%)
237
Thomas Elementary 721 32.9% (-10.5%)
237
37.9% (-1.7%)
273
29.3% (12.2%)
211
82.4% (5.0%)
594
74.2% (4.5%)
535
31.5% (16.8%)
227
35.2% (12.3%)
254
30.5% (11.8%)
220
48.5% (2.8%)
350
Viking Elementary 668 26.5% (-8.7%)
177
39.2% (-5.4%)
262
34.3% (14.2%)
229
84.4% (3.6%)
564
75.6% (-1.1%)
505
37.3% (20.0%)
249
39.4% (16.8%)
263
31.4% (10.3%)
210
56.7% (6.6%)
379
Vinland Elementary 441 29.9% (-14.3%)
132
38.3% (-2.2%)
169
31.7% (16.5%)
140
81.9% (8.6%)
361
73.5% (8.9%)
324
34.5% (22.2%)
152
36.1% (16.4%)
159
33.6% (17.8%)
148
52.6% (10.8%)
232
Wolters Elementary 340 26.2% (-13.2%)
89
37.6% (-2.6%)
128
36.2% (15.8%)
123
87.1% (7.2%)
296
74.1% (0.2%)
252
37.1% (22.6%)
126
41.5% (15.0%)
141
37.1% (15.1%)
126
53.2% (5.8%)
181
Ahwahnee Middle 350 59.1% (-7.5%)
207
19.7% (-13.6%)
69
21.1% (21.1%)
74
100.0% (0.0%)
350
98.0% (31.3%)
343
25.7% (25.7%)
90
24.3% (24.3%)
85
20.3% (20.3%)
71
88.3% (21.6%)
309
Tioga Middle 606 64.5% (-3.3%)
391
17.7% (1.6%)
107
17.8% (1.7%)
108
100.0% (0.0%)
606
97.7% (3.2%)
592
23.9% (7.3%)
145
17.5% (-3.7%)
106
14.4% (-1.9%)
87
83.2% (3.5%)
504
Hoover High 840 61.7% (-8.4%)
518
20.8% (1.4%)
175
17.5% (7.1%)
147
100.0% (0.0%)
840
100.0% (0.0%)
840
21.1% (11.1%)
177
18.9% (4.2%)
159
18.7% (3.4%)
157
92.3% (3.0%)
775
Office of Equity and Access i-Ready Reading Report D1 10/21/2020Page 4
* Cell Value Key: Current Year Diagnostic 1 % of Test Takers in Placement Level Category (% Change in Placement Category from Prior Year Diagnostic 1 Students)
Current Year Diagnostic 1 Count of Test Takers in Placement Category
Notes: Domain percent on or above grade level includes scores of "Tested Out" and "Max Score" Report is based on student results for grades K-11. In 2019-20, grade K was not required to participate in Diagnostic 1. In 2019-20, the following schools did not participate in i-Ready: Fresno High, Phoenix Secondary, & Sunnyside.
Reading i-Ready
D1
Test Taker Counts
On or Above Grade Level
Phon.Awareness
High Frequency
Words Vocabulary LiteratureInformation.
Text
School 2 or More
Grade Levels Below
1
Grade Level Below
Overall PerformancePercentage of Students
Percentage of Students on or Above Grade Level in Reading Domains
Fresno Unified 49,197 41.6% (-6.7%)20,486
29.7% (-2.9%)14,636
28.6% (9.6%)14,075
88.8% (3.0%)43,672
82.3% (2.2%)40,496
31.0% (13.6%)15,228
31.8% (8.1%)15,653
28.2% (7.9%)13,869
i-Ready Diagnostic 1 Standard View Performance Results* with Domains
2020-21 Summary
Phonics
62.6% (4.9%)30,815
McLane Region 7,345 45.3% (-7.0%)3,329
30.1% (-3.1%)2,208
24.6% (10.2%)
1,808
86.4% (3.1%)6,343
77.8% (2.1%)5,713
26.6% (14.1%)
1,954
27.9% (8.9%)2,049
24.8% (8.3%)1,822
54.0% (4.4%)3,963
Birney Elementary 714 41.2% (-6.2%)
294
34.5% (-1.6%)
246
24.4% (7.8%)
174
80.8% (2.2%)
577
67.9% (-0.5%)
485
26.3% (13.3%)
188
30.0% (10.2%)
214
24.6% (6.6%)
176
45.8% (5.3%)
327
Ericson Elementary 662 37.9% (-6.3%)
251
36.4% (-5.6%)
241
25.7% (12.0%)
170
79.2% (1.2%)
524
69.6% (-3.3%)
461
26.0% (12.8%)
172
30.8% (11.2%)
204
27.3% (10.7%)
181
45.3% (3.8%)
300
Ewing Elementary 597 41.7% (-0.7%)
249
32.2% (-8.2%)
192
26.1% (8.8%)
156
88.1% (4.2%)
526
81.7% (3.3%)
488
27.8% (15.4%)
166
29.8% (5.9%)
178
25.1% (6.8%)
150
53.8% (6.7%)
321
Hidalgo Elementary 504 50.8% (-7.6%)
256
32.9% (-1.3%)
166
16.3% (8.9%)
82
80.2% (8.0%)
404
64.5% (2.6%)
325
17.9% (10.5%)
90
20.8% (8.8%)
105
17.5% (7.3%)
88
36.3% (6.3%)
183
Leavenworth Elementary
626 41.7% (-1.1%)
261
30.4% (-6.2%)
190
28.0% (7.4%)
175
88.5% (6.0%)
554
79.9% (7.5%)
500
28.6% (11.5%)
179
31.0% (7.4%)
194
29.6% (6.1%)
185
51.0% (1.9%)
319
Mayfair Elementary 588 40.0% (40.0%)
235
39.3% (-60.7%)
231
20.7% (20.7%)
122
78.4% (78.4%)
461
70.7% (70.7%)
416
23.6% (23.6%)
139
26.2% (26.2%)
154
24.3% (24.3%)
143
41.7% (41.7%)
245
Norseman Elementary 631 39.9% (-14.6%)
252
30.7% (-4.6%)
194
29.3% (19.2%)
185
83.8% (8.0%)
529
73.7% (9.2%)
465
32.2% (23.1%)
203
31.1% (16.6%)
196
28.7% (16.9%)
181
46.8% (11.9%)
295
Rowell Elementary 513 40.7% (-10.2%)
209
31.8% (-5.0%)
163
27.5% (15.2%)
141
83.4% (0.0%)
428
71.7% (-1.7%)
368
28.8% (17.0%)
148
29.8% (13.5%)
153
30.4% (15.7%)
156
45.8% (4.6%)
235
Turner Elementary 560 37.5% (-6.8%)
210
30.5% (-9.9%)
171
32.0% (16.7%)
179
83.6% (7.1%)
468
71.4% (4.2%)
400
33.6% (22.0%)
188
34.6% (13.2%)
194
30.9% (12.3%)
173
48.4% (10.0%)
271
Wishon Elementary 469 27.5% (-9.9%)
129
35.8% (-8.0%)
168
36.7% (17.9%)
172
83.4% (6.9%)
391
75.9% (5.2%)
356
34.8% (18.3%)
163
40.1% (18.2%)
188
33.7% (12.3%)
158
56.3% (9.6%)
264
Scandinavian Middle 691 60.9% (-6.6%)
421
18.5% (2.0%)
128
20.5% (4.6%)
142
100.0% (0.0%)
691
97.4% (1.3%)
673
26.3% (10.4%)
182
20.7% (1.4%)
143
18.2% (1.7%)
126
82.8% (-1.5%)
572
Yosemite Middle 383 71.0% (-5.3%)
272
13.6% (-0.2%)
52
15.4% (5.5%)
59
100.0% (0.0%)
383
96.3% (0.3%)
369
17.0% (7.8%)
65
17.8% (2.1%)
68
15.1% (3.1%)
58
73.9% (-1.9%)
283
McLane High 407 71.3% (-28.7%)
290
16.2% (16.2%)
66
12.5% (12.5%)
51
100.0% (0.0%)
407
100.0% (0.0%)
407
17.4% (17.4%)
71
14.3% (14.3%)
58
11.5% (11.5%)
47
85.5% (85.5%)
348
Office of Equity and Access i-Ready Reading Report D1 10/21/2020Page 5
* Cell Value Key: Current Year Diagnostic 1 % of Test Takers in Placement Level Category (% Change in Placement Category from Prior Year Diagnostic 1 Students)
Current Year Diagnostic 1 Count of Test Takers in Placement Category
Notes: Domain percent on or above grade level includes scores of "Tested Out" and "Max Score" Report is based on student results for grades K-11. In 2019-20, grade K was not required to participate in Diagnostic 1. In 2019-20, the following schools did not participate in i-Ready: Fresno High, Phoenix Secondary, & Sunnyside.
Reading i-Ready
D1
Test Taker Counts
On or Above Grade Level
Phon.Awareness
High Frequency
Words Vocabulary LiteratureInformation.
Text
School 2 or More
Grade Levels Below
1
Grade Level Below
Overall PerformancePercentage of Students
Percentage of Students on or Above Grade Level in Reading Domains
Fresno Unified 49,197 41.6% (-6.7%)20,486
29.7% (-2.9%)14,636
28.6% (9.6%)14,075
88.8% (3.0%)43,672
82.3% (2.2%)40,496
31.0% (13.6%)15,228
31.8% (8.1%)15,653
28.2% (7.9%)13,869
i-Ready Diagnostic 1 Standard View Performance Results* with Domains
2020-21 Summary
Phonics
62.6% (4.9%)30,815
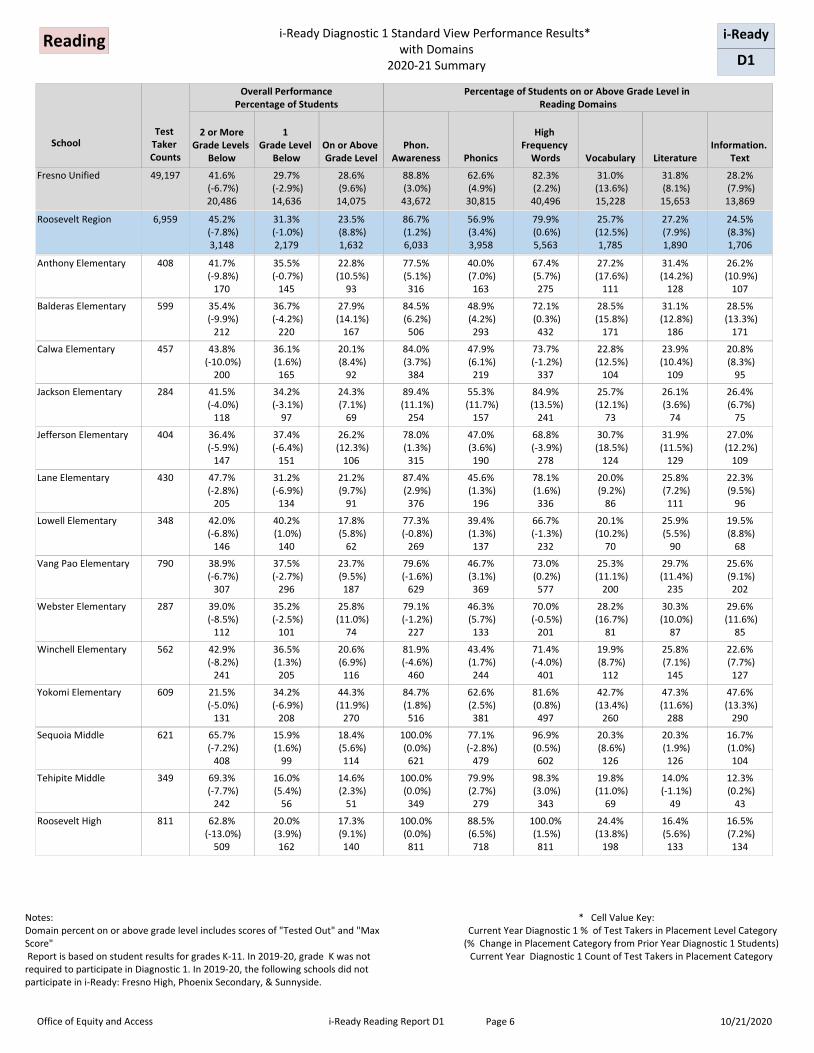
Roosevelt Region 6,959 45.2% (-7.8%)3,148
31.3% (-1.0%)2,179
23.5% (8.8%)1,632
86.7% (1.2%)6,033
79.9% (0.6%)5,563
25.7% (12.5%)
1,785
27.2% (7.9%)1,890
24.5% (8.3%)1,706
56.9% (3.4%)3,958
Anthony Elementary 408 41.7% (-9.8%)
170
35.5% (-0.7%)
145
22.8% (10.5%)
93
77.5% (5.1%)
316
67.4% (5.7%)
275
27.2% (17.6%)
111
31.4% (14.2%)
128
26.2% (10.9%)
107
40.0% (7.0%)
163
Balderas Elementary 599 35.4% (-9.9%)
212
36.7% (-4.2%)
220
27.9% (14.1%)
167
84.5% (6.2%)
506
72.1% (0.3%)
432
28.5% (15.8%)
171
31.1% (12.8%)
186
28.5% (13.3%)
171
48.9% (4.2%)
293
Calwa Elementary 457 43.8% (-10.0%)
200
36.1% (1.6%)
165
20.1% (8.4%)
92
84.0% (3.7%)
384
73.7% (-1.2%)
337
22.8% (12.5%)
104
23.9% (10.4%)
109
20.8% (8.3%)
95
47.9% (6.1%)
219
Jackson Elementary 284 41.5% (-4.0%)
118
34.2% (-3.1%)
97
24.3% (7.1%)
69
89.4% (11.1%)
254
84.9% (13.5%)
241
25.7% (12.1%)
73
26.1% (3.6%)
74
26.4% (6.7%)
75
55.3% (11.7%)
157
Jefferson Elementary 404 36.4% (-5.9%)
147
37.4% (-6.4%)
151
26.2% (12.3%)
106
78.0% (1.3%)
315
68.8% (-3.9%)
278
30.7% (18.5%)
124
31.9% (11.5%)
129
27.0% (12.2%)
109
47.0% (3.6%)
190
Lane Elementary 430 47.7% (-2.8%)
205
31.2% (-6.9%)
134
21.2% (9.7%)
91
87.4% (2.9%)
376
78.1% (1.6%)
336
20.0% (9.2%)
86
25.8% (7.2%)
111
22.3% (9.5%)
96
45.6% (1.3%)
196
Lowell Elementary 348 42.0% (-6.8%)
146
40.2% (1.0%)
140
17.8% (5.8%)
62
77.3% (-0.8%)
269
66.7% (-1.3%)
232
20.1% (10.2%)
70
25.9% (5.5%)
90
19.5% (8.8%)
68
39.4% (1.3%)
137
Vang Pao Elementary 790 38.9% (-6.7%)
307
37.5% (-2.7%)
296
23.7% (9.5%)
187
79.6% (-1.6%)
629
73.0% (0.2%)
577
25.3% (11.1%)
200
29.7% (11.4%)
235
25.6% (9.1%)
202
46.7% (3.1%)
369
Webster Elementary 287 39.0% (-8.5%)
112
35.2% (-2.5%)
101
25.8% (11.0%)
74
79.1% (-1.2%)
227
70.0% (-0.5%)
201
28.2% (16.7%)
81
30.3% (10.0%)
87
29.6% (11.6%)
85
46.3% (5.7%)
133
Winchell Elementary 562 42.9% (-8.2%)
241
36.5% (1.3%)
205
20.6% (6.9%)
116
81.9% (-4.6%)
460
71.4% (-4.0%)
401
19.9% (8.7%)
112
25.8% (7.1%)
145
22.6% (7.7%)
127
43.4% (1.7%)
244
Yokomi Elementary 609 21.5% (-5.0%)
131
34.2% (-6.9%)
208
44.3% (11.9%)
270
84.7% (1.8%)
516
81.6% (0.8%)
497
42.7% (13.4%)
260
47.3% (11.6%)
288
47.6% (13.3%)
290
62.6% (2.5%)
381
Sequoia Middle 621 65.7% (-7.2%)
408
15.9% (1.6%)
99
18.4% (5.6%)
114
100.0% (0.0%)
621
96.9% (0.5%)
602
20.3% (8.6%)
126
20.3% (1.9%)
126
16.7% (1.0%)
104
77.1% (-2.8%)
479
Tehipite Middle 349 69.3% (-7.7%)
242
16.0% (5.4%)
56
14.6% (2.3%)
51
100.0% (0.0%)
349
98.3% (3.0%)
343
19.8% (11.0%)
69
14.0% (-1.1%)
49
12.3% (0.2%)
43
79.9% (2.7%)
279
Roosevelt High 811 62.8% (-13.0%)
509
20.0% (3.9%)
162
17.3% (9.1%)
140
100.0% (0.0%)
811
100.0% (1.5%)
811
24.4% (13.8%)
198
16.4% (5.6%)
133
16.5% (7.2%)
134
88.5% (6.5%)
718
Office of Equity and Access i-Ready Reading Report D1 10/21/2020Page 6
* Cell Value Key: Current Year Diagnostic 1 % of Test Takers in Placement Level Category (% Change in Placement Category from Prior Year Diagnostic 1 Students)
Current Year Diagnostic 1 Count of Test Takers in Placement Category
Notes: Domain percent on or above grade level includes scores of "Tested Out" and "Max Score" Report is based on student results for grades K-11. In 2019-20, grade K was not required to participate in Diagnostic 1. In 2019-20, the following schools did not participate in i-Ready: Fresno High, Phoenix Secondary, & Sunnyside.
Reading i-Ready
D1
Test Taker Counts
On or Above Grade Level
Phon.Awareness
High Frequency
Words Vocabulary LiteratureInformation.
Text
School 2 or More
Grade Levels Below
1
Grade Level Below
Overall PerformancePercentage of Students
Percentage of Students on or Above Grade Level in Reading Domains
Fresno Unified 49,197 41.6% (-6.7%)20,486
29.7% (-2.9%)14,636
28.6% (9.6%)14,075
88.8% (3.0%)43,672
82.3% (2.2%)40,496
31.0% (13.6%)15,228
31.8% (8.1%)15,653
28.2% (7.9%)13,869
i-Ready Diagnostic 1 Standard View Performance Results* with Domains
Office of Equity and Access i-Ready Reading Report D1 10/21/2020Page 7
* Cell Value Key: Current Year Diagnostic 1 % of Test Takers in Placement Level Category (% Change in Placement Category from Prior Year Diagnostic 1 Students)
Current Year Diagnostic 1 Count of Test Takers in Placement Category
Notes: Domain percent on or above grade level includes scores of "Tested Out" and "Max Score" Report is based on student results for grades K-11. In 2019-20, grade K was not required to participate in Diagnostic 1. In 2019-20, the following schools did not participate in i-Ready: Fresno High, Phoenix Secondary, & Sunnyside.
Reading i-Ready
D1
Test Taker Counts
On or Above Grade Level
Phon.Awareness
High Frequency
Words Vocabulary LiteratureInformation.
Text
School 2 or More
Grade Levels Below
1
Grade Level Below
Overall PerformancePercentage of Students
Percentage of Students on or Above Grade Level in Reading Domains
Fresno Unified 49,197 41.6% (-6.7%)20,486
29.7% (-2.9%)14,636
28.6% (9.6%)14,075
88.8% (3.0%)43,672
82.3% (2.2%)40,496
31.0% (13.6%)15,228
31.8% (8.1%)15,653
28.2% (7.9%)13,869
i-Ready Diagnostic 1 Standard View Performance Results* with Domains
Office of Equity and Access i-Ready Reading Report D1 10/21/2020Page 8
* Cell Value Key: Current Year Diagnostic 1 % of Test Takers in Placement Level Category (% Change in Placement Category from Prior Year Diagnostic 1 Students)
Current Year Diagnostic 1 Count of Test Takers in Placement Category
Notes: Domain percent on or above grade level includes scores of "Tested Out" and "Max Score" Report is based on student results for grades K-11. In 2019-20, grade K was not required to participate in Diagnostic 1. In 2019-20, the following schools did not participate in i-Ready: Fresno High, Phoenix Secondary, & Sunnyside.
Math i-Ready
D1
Test Taker Counts
On or Above Grade Level
Number & Operations
Measurement & Data Geometry
School
2 or More
Grade Levels Below
1 Grade Level Below
Overall PerformancePercentage of Students
Percentage of Students on or Above Grade Level in Math Domains
Fresno Unified 49,677 42.4%(-5.5%)21,048
36.8% (-2.6%)18,285
20.8% (8.1%)10,344
33.4% (9.2%)16,615
32.1% (6.9%)15,947
21.6% (6.9%)10,753
i-Ready Diagnostic 1 Standard View Performance Results* with Domains
2020-21 Summary
Algebra
26.0% (7.1%)12,905
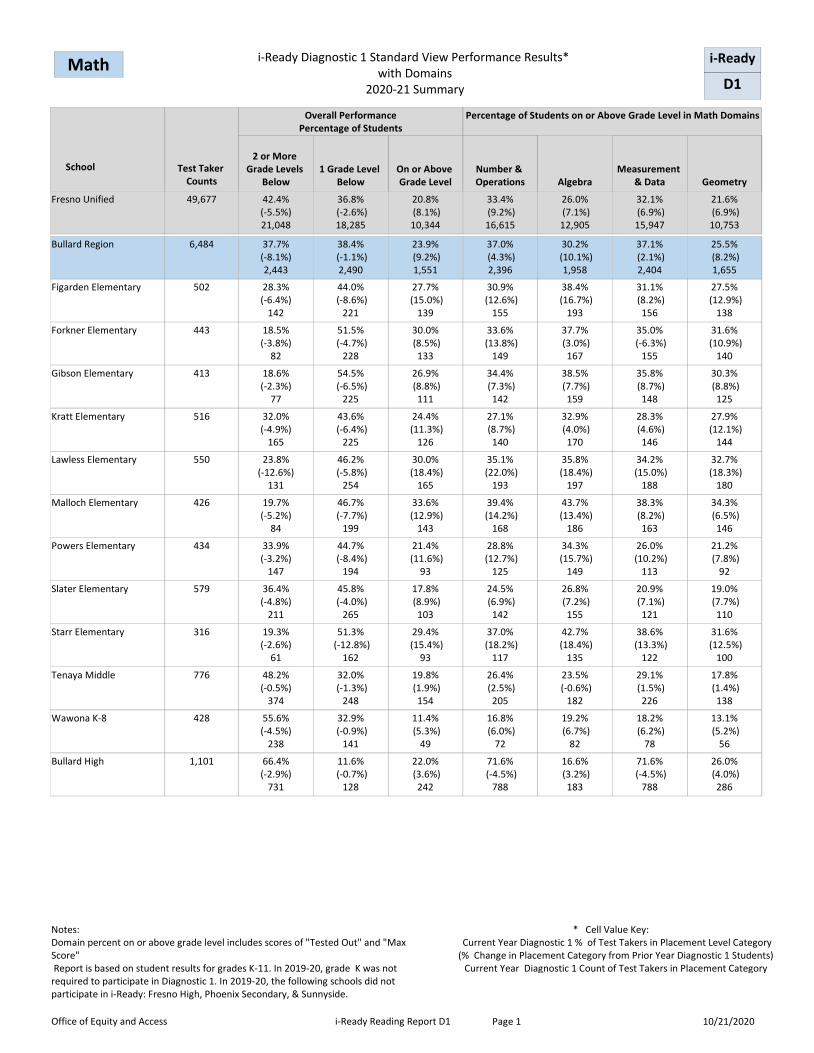
Bullard Region 6,484 37.7%(-8.1%)2,443
38.4% (-1.1%)2,490
23.9% (9.2%)1,551
37.0% (4.3%)2,396
37.1% (2.1%)2,404
25.5% (8.2%)1,655
30.2% (10.1%)
1,958
Figarden Elementary 502 28.3%(-6.4%)
142
44.0% (-8.6%)
221
27.7% (15.0%)
139
30.9% (12.6%)
155
31.1% (8.2%)
156
27.5% (12.9%)
138
38.4% (16.7%)
193
Forkner Elementary 443 18.5%(-3.8%)
82
51.5% (-4.7%)
228
30.0% (8.5%)
133
33.6% (13.8%)
149
35.0% (-6.3%)
155
31.6% (10.9%)
140
37.7% (3.0%)
167
Gibson Elementary 413 18.6%(-2.3%)
77
54.5% (-6.5%)
225
26.9% (8.8%)
111
34.4% (7.3%)
142
35.8% (8.7%)
148
30.3% (8.8%)
125
38.5% (7.7%)
159
Kratt Elementary 516 32.0%(-4.9%)
165
43.6% (-6.4%)
225
24.4% (11.3%)
126
27.1% (8.7%)
140
28.3% (4.6%)
146
27.9% (12.1%)
144
32.9% (4.0%)
170
Lawless Elementary 550 23.8%(-12.6%)
131
46.2% (-5.8%)
254
30.0% (18.4%)
165
35.1% (22.0%)
193
34.2% (15.0%)
188
32.7% (18.3%)
180
35.8% (18.4%)
197
Malloch Elementary 426 19.7%(-5.2%)
84
46.7% (-7.7%)
199
33.6% (12.9%)
143
39.4% (14.2%)
168
38.3% (8.2%)
163
34.3% (6.5%)
146
43.7% (13.4%)
186
Powers Elementary 434 33.9%(-3.2%)
147
44.7% (-8.4%)
194
21.4% (11.6%)
93
28.8% (12.7%)
125
26.0% (10.2%)
113
21.2% (7.8%)
92
34.3% (15.7%)
149
Slater Elementary 579 36.4%(-4.8%)
211
45.8% (-4.0%)
265
17.8% (8.9%)
103
24.5% (6.9%)
142
20.9% (7.1%)
121
19.0% (7.7%)
110
26.8% (7.2%)
155
Starr Elementary 316 19.3%(-2.6%)
61
51.3% (-12.8%)
162
29.4% (15.4%)
93
37.0% (18.2%)
117
38.6% (13.3%)
122
31.6% (12.5%)
100
42.7% (18.4%)
135
Tenaya Middle 776 48.2%(-0.5%)
374
32.0% (-1.3%)
248
19.8% (1.9%)
154
26.4% (2.5%)
205
29.1% (1.5%)
226
17.8% (1.4%)
138
23.5% (-0.6%)
182
Wawona K-8 428 55.6%(-4.5%)
238
32.9% (-0.9%)
141
11.4% (5.3%)
49
16.8% (6.0%)
72
18.2% (6.2%)
78
13.1% (5.2%)
56
19.2% (6.7%)
82
Bullard High 1,101 66.4%(-2.9%)
731
11.6% (-0.7%)
128
22.0% (3.6%)
242
71.6% (-4.5%)
788
71.6% (-4.5%)
788
26.0% (4.0%)
286
16.6% (3.2%)
183
Office of Equity and Access i-Ready Reading Report D1 10/21/2020Page 1
Notes: Domain percent on or above grade level includes scores of "Tested Out" and "Max Score" Report is based on student results for grades K-11. In 2019-20, grade K was not required to participate in Diagnostic 1. In 2019-20, the following schools did not participate in i-Ready: Fresno High, Phoenix Secondary, & Sunnyside.
* Cell Value Key: Current Year Diagnostic 1 % of Test Takers in Placement Level Category (% Change in Placement Category from Prior Year Diagnostic 1 Students)
Current Year Diagnostic 1 Count of Test Takers in Placement Category
Math i-Ready
D1
Test Taker Counts
On or Above Grade Level
Number & Operations
Measurement & Data Geometry
School
2 or More
Grade Levels Below
1 Grade Level Below
Overall PerformancePercentage of Students
Percentage of Students on or Above Grade Level in Math Domains
Fresno Unified 49,677 42.4%(-5.5%)21,048
36.8% (-2.6%)18,285
20.8% (8.1%)10,344
33.4% (9.2%)16,615
32.1% (6.9%)15,947
21.6% (6.9%)10,753
i-Ready Diagnostic 1 Standard View Performance Results* with Domains
2020-21 Summary
Algebra
26.0% (7.1%)12,905
Edison Region 5,702 37.8%(-4.6%)2,157
30.7% (0.3%)1,753
31.4% (4.3%)1,792
42.0% (4.2%)2,392
41.4% (3.1%)2,359
29.4% (3.1%)1,676
34.3% (3.2%)1,956
Addams Elementary 707 46.5%(-6.3%)
329
38.9% (-1.9%)
275
14.6% (8.1%)
103
20.8% (10.8%)
147
18.4% (7.3%)
130
15.6% (5.9%)
110
22.2% (10.5%)
157
Columbia Elementary 403 47.9%(-6.5%)
193
37.2% (-3.0%)
150
14.9% (9.5%)
60
23.8% (14.2%)
96
18.9% (7.6%)
76
12.4% (2.4%)
50
20.1% (8.7%)
81
King Elementary 524 47.7%(-7.8%)
250
39.7% (-0.3%)
208
12.6% (8.1%)
66
18.7% (11.3%)
98
15.6% (8.2%)
82
13.4% (6.1%)
70
19.5% (9.4%)
102
Kirk Elementary 324 48.5%(-10.3%)
157
37.7% (-1.1%)
122
13.9% (11.4%)
45
17.3% (9.8%)
56
17.0% (10.5%)
55
16.0% (9.2%)
52
17.3% (7.6%)
56
Lincoln Elementary 481 35.3%(-4.8%)
170
44.1% (-1.4%)
212
20.6% (6.2%)
99
29.3% (8.5%)
141
25.8% (8.3%)
124
18.7% (3.0%)
90
30.1% (5.5%)
145
Manchester Gate 716 0.8%(0.6%)
6
24.6% (0.9%)
176
74.6% (-1.5%)
534
72.6% (-1.6%)
520
76.5% (-4.1%)
548
67.6% (1.3%)
484
77.0% (-2.4%)
551
Sunset Elementary 184 31.0%(31.0%)
57
51.1% (51.1%)
94
17.9% (-82.1%)
33
29.3% (-70.7%)
54
26.1% (-73.9%)
48
14.1% (-85.9%)
26
26.6% (-73.4%)
49
Computech Middle 737 6.9%(4.2%)
51
30.5% (-3.1%)
225
62.6% (-1.1%)
461
69.7% (-2.0%)
514
72.0% (3.8%)
531
52.0% (-2.8%)
383
60.4% (-8.3%)
445
Gaston Middle 706 63.3%(-4.4%)
447
25.6% (1.2%)
181
11.0% (3.2%)
78
16.7% (5.7%)
118
16.4% (3.3%)
116
10.5% (2.7%)
74
13.2% (2.1%)
93
Edison High 920 54.0%(-13.9%)
497
12.0% (2.8%)
110
34.0% (11.1%)
313
70.4% (0.1%)
648
70.5% (0.2%)
649
36.6% (10.7%)
337
30.1% (10.8%)
277
Office of Equity and Access i-Ready Reading Report D1 10/21/2020Page 2
Notes: Domain percent on or above grade level includes scores of "Tested Out" and "Max Score" Report is based on student results for grades K-11. In 2019-20, grade K was not required to participate in Diagnostic 1. In 2019-20, the following schools did not participate in i-Ready: Fresno High, Phoenix Secondary, & Sunnyside.
* Cell Value Key: Current Year Diagnostic 1 % of Test Takers in Placement Level Category (% Change in Placement Category from Prior Year Diagnostic 1 Students)
Current Year Diagnostic 1 Count of Test Takers in Placement Category
Math i-Ready
D1
Test Taker Counts
On or Above Grade Level
Number & Operations
Measurement & Data Geometry
School
2 or More
Grade Levels Below
1 Grade Level Below
Overall PerformancePercentage of Students
Percentage of Students on or Above Grade Level in Math Domains
Fresno Unified 49,677 42.4%(-5.5%)21,048
36.8% (-2.6%)18,285
20.8% (8.1%)10,344
33.4% (9.2%)16,615
32.1% (6.9%)15,947
21.6% (6.9%)10,753
i-Ready Diagnostic 1 Standard View Performance Results* with Domains
2020-21 Summary
Algebra
26.0% (7.1%)12,905
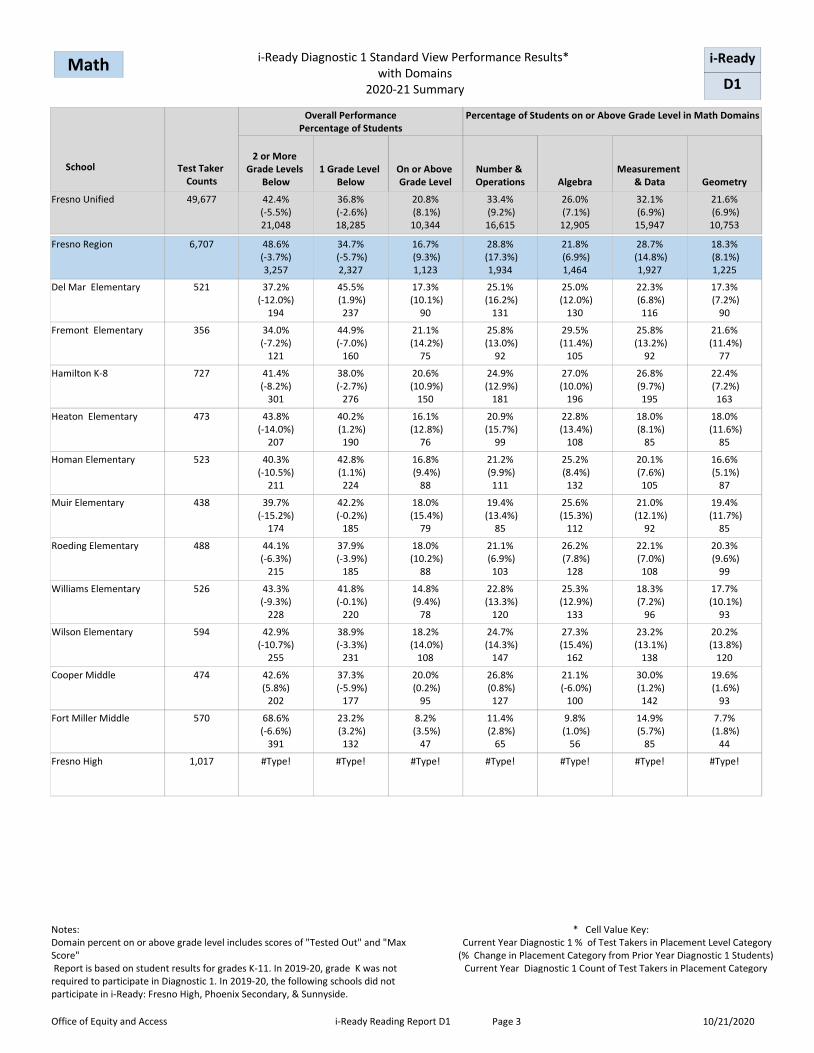
Fresno Region 6,707 48.6%(-3.7%)3,257
34.7% (-5.7%)2,327
16.7% (9.3%)1,123
28.8% (17.3%)
1,934
28.7% (14.8%)
1,927
18.3% (8.1%)1,225
21.8% (6.9%)1,464
Del Mar Elementary 521 37.2%(-12.0%)
194
45.5% (1.9%)
237
17.3% (10.1%)
90
25.1% (16.2%)
131
22.3% (6.8%)
116
17.3% (7.2%)
90
25.0% (12.0%)
130
Fremont Elementary 356 34.0%(-7.2%)
121
44.9% (-7.0%)
160
21.1% (14.2%)
75
25.8% (13.0%)
92
25.8% (13.2%)
92
21.6% (11.4%)
77
29.5% (11.4%)
105
Hamilton K-8 727 41.4%(-8.2%)
301
38.0% (-2.7%)
276
20.6% (10.9%)
150
24.9% (12.9%)
181
26.8% (9.7%)
195
22.4% (7.2%)
163
27.0% (10.0%)
196
Heaton Elementary 473 43.8%(-14.0%)
207
40.2% (1.2%)
190
16.1% (12.8%)
76
20.9% (15.7%)
99
18.0% (8.1%)
85
18.0% (11.6%)
85
22.8% (13.4%)
108
Homan Elementary 523 40.3%(-10.5%)
211
42.8% (1.1%)
224
16.8% (9.4%)
88
21.2% (9.9%)
111
20.1% (7.6%)
105
16.6% (5.1%)
87
25.2% (8.4%)
132
Muir Elementary 438 39.7%(-15.2%)
174
42.2% (-0.2%)
185
18.0% (15.4%)
79
19.4% (13.4%)
85
21.0% (12.1%)
92
19.4% (11.7%)
85
25.6% (15.3%)
112
Roeding Elementary 488 44.1%(-6.3%)
215
37.9% (-3.9%)
185
18.0% (10.2%)
88
21.1% (6.9%)
103
22.1% (7.0%)
108
20.3% (9.6%)
99
26.2% (7.8%)
128
Williams Elementary 526 43.3%(-9.3%)
228
41.8% (-0.1%)
220
14.8% (9.4%)
78
22.8% (13.3%)
120
18.3% (7.2%)
96
17.7% (10.1%)
93
25.3% (12.9%)
133
Wilson Elementary 594 42.9%(-10.7%)
255
38.9% (-3.3%)
231
18.2% (14.0%)
108
24.7% (14.3%)
147
23.2% (13.1%)
138
20.2% (13.8%)
120
27.3% (15.4%)
162
Cooper Middle 474 42.6%(5.8%)
202
37.3% (-5.9%)
177
20.0% (0.2%)
95
26.8% (0.8%)
127
30.0% (1.2%)
142
19.6% (1.6%)
93
21.1% (-6.0%)
100
Fort Miller Middle 570 68.6%(-6.6%)
391
23.2% (3.2%)
132
8.2% (3.5%)
47
11.4% (2.8%)
65
14.9% (5.7%)
85
7.7% (1.8%)
44
9.8% (1.0%)
56
Fresno High 1,017 #Type! #Type! #Type! #Type! #Type! #Type!#Type!
Office of Equity and Access i-Ready Reading Report D1 10/21/2020Page 3
Notes: Domain percent on or above grade level includes scores of "Tested Out" and "Max Score" Report is based on student results for grades K-11. In 2019-20, grade K was not required to participate in Diagnostic 1. In 2019-20, the following schools did not participate in i-Ready: Fresno High, Phoenix Secondary, & Sunnyside.
* Cell Value Key: Current Year Diagnostic 1 % of Test Takers in Placement Level Category (% Change in Placement Category from Prior Year Diagnostic 1 Students)
Current Year Diagnostic 1 Count of Test Takers in Placement Category
Math i-Ready
D1
Test Taker Counts
On or Above Grade Level
Number & Operations
Measurement & Data Geometry
School
2 or More
Grade Levels Below
1 Grade Level Below
Overall PerformancePercentage of Students
Percentage of Students on or Above Grade Level in Math Domains
Fresno Unified 49,677 42.4%(-5.5%)21,048
36.8% (-2.6%)18,285
20.8% (8.1%)10,344
33.4% (9.2%)16,615
32.1% (6.9%)15,947
21.6% (6.9%)10,753
i-Ready Diagnostic 1 Standard View Performance Results* with Domains
2020-21 Summary
Algebra
26.0% (7.1%)12,905
Hoover Region 7,072 41.3%(-8.6%)2,919
39.4% (-1.5%)2,787
19.3% (10.0%)
1,366
31.9% (8.8%)2,257
30.0% (5.7%)2,124
21.3% (9.0%)1,504
25.3% (9.7%)1,792
Centennial Elementary 608 35.2%(-11.2%)
214
43.1% (-2.8%)
262
21.7% (14.0%)
132
26.5% (13.7%)
161
26.0% (13.1%)
158
23.4% (12.3%)
142
28.0% (9.3%)
170
Eaton Elementary 423 22.5%(-4.3%)
95
53.2% (-4.7%)
225
24.3% (8.9%)
103
32.9% (9.6%)
139
30.3% (5.6%)
128
31.9% (11.3%)
135
36.6% (6.4%)
155
Holland Elementary 393 32.6%(-5.7%)
128
44.0% (-8.6%)
173
23.4% (14.2%)
92
26.2% (12.8%)
103
22.9% (9.1%)
90
22.1% (9.6%)
87
29.8% (9.9%)
117
McCardle Elementary 426 32.4%(-2.9%)
138
44.4% (-5.8%)
189
23.2% (8.6%)
99
29.8% (12.1%)
127
29.1% (8.2%)
124
24.6% (7.4%)
105
30.3% (8.6%)
129
Pyle Elementary 660 37.4%(-9.0%)
247
45.0% (-1.4%)
297
17.6% (10.4%)
116
25.9% (14.2%)
171
20.3% (8.3%)
134
18.6% (8.8%)
123
26.4% (13.1%)
174
Robinson Elementary 439 31.7%(-8.9%)
139
46.7% (-4.4%)
205
21.6% (13.4%)
95
28.9% (18.4%)
127
26.7% (9.8%)
117
24.8% (13.2%)
109
30.8% (15.0%)
135
Thomas Elementary 731 35.7%(-9.4%)
261
44.5% (-2.3%)
325
19.8% (11.7%)
145
26.4% (12.9%)
193
24.2% (10.0%)
177
22.3% (12.4%)
163
27.1% (10.4%)
198
Viking Elementary 665 30.2%(-2.9%)
201
51.3% (-8.0%)
341
18.5% (11.0%)
123
27.1% (12.4%)
180
22.6% (8.0%)
150
18.9% (6.6%)
126
26.5% (10.2%)
176
Vinland Elementary 436 31.9%(-15.8%)
139
45.9% (0.1%)
200
22.2% (15.7%)
97
29.1% (16.7%)
127
24.3% (11.2%)
106
23.9% (14.4%)
104
33.5% (19.9%)
146
Wolters Elementary 332 29.8%(-5.9%)
99
46.7% (-7.9%)
155
23.5% (13.7%)
78
29.8% (14.0%)
99
24.7% (4.6%)
82
23.8% (8.9%)
79
31.9% (11.5%)
106
Ahwahnee Middle 379 51.5%(-48.5%)
195
29.8% (29.8%)
113
18.7% (18.7%)
71
24.5% (24.5%)
93
26.4% (26.4%)
100
17.4% (17.4%)
66
22.2% (22.2%)
84
Tioga Middle 626 57.5%(-7.4%)
360
31.2% (5.0%)
195
11.3% (2.4%)
71
17.7% (4.9%)
111
21.1% (6.4%)
132
12.9% (2.5%)
81
14.7% (3.4%)
92
Hoover High 954 73.7%(-8.0%)
703
11.2% (3.5%)
107
15.1% (4.5%)
144
65.6% (-1.0%)
626
65.6% (-1.0%)
626
19.3% (6.8%)
184
11.5% (3.6%)
110
Office of Equity and Access i-Ready Reading Report D1 10/21/2020Page 4
Notes: Domain percent on or above grade level includes scores of "Tested Out" and "Max Score" Report is based on student results for grades K-11. In 2019-20, grade K was not required to participate in Diagnostic 1. In 2019-20, the following schools did not participate in i-Ready: Fresno High, Phoenix Secondary, & Sunnyside.
* Cell Value Key: Current Year Diagnostic 1 % of Test Takers in Placement Level Category (% Change in Placement Category from Prior Year Diagnostic 1 Students)
Current Year Diagnostic 1 Count of Test Takers in Placement Category
Math i-Ready
D1
Test Taker Counts
On or Above Grade Level
Number & Operations
Measurement & Data Geometry
School
2 or More
Grade Levels Below
1 Grade Level Below
Overall PerformancePercentage of Students
Percentage of Students on or Above Grade Level in Math Domains
Fresno Unified 49,677 42.4%(-5.5%)21,048
36.8% (-2.6%)18,285
20.8% (8.1%)10,344
33.4% (9.2%)16,615
32.1% (6.9%)15,947
21.6% (6.9%)10,753
i-Ready Diagnostic 1 Standard View Performance Results* with Domains
2020-21 Summary
Algebra
26.0% (7.1%)12,905
McLane Region 7,394 43.0%(-4.8%)3,178
38.8% (-4.9%)2,872
18.2% (9.6%)1,344
27.7% (13.5%)
2,046
25.9% (11.3%)
1,917
18.7% (7.0%)1,380
23.8% (8.1%)1,762
Birney Elementary 706 36.8%(-7.3%)
260
49.4% (3.4%)
349
13.7% (3.9%)
97
19.5% (5.8%)
138
19.1% (3.7%)
135
15.6% (1.8%)
110
23.2% (6.5%)
164
Ericson Elementary 653 35.4%(-3.6%)
231
48.2% (-4.0%)
315
16.4% (7.6%)
107
21.1% (4.5%)
138
21.7% (7.6%)
142
18.1% (6.5%)
118
23.0% (5.6%)
150
Ewing Elementary 593 35.8%(-2.8%)
212
42.5% (-8.9%)
252
21.8% (11.7%)
129
26.6% (9.2%)
158
25.0% (10.0%)
148
21.9% (9.1%)
130
26.6% (9.7%)
158
Hidalgo Elementary 498 46.8%(-5.4%)
233
40.4% (-0.7%)
201
12.9% (6.1%)
64
20.9% (9.2%)
104
17.3% (7.8%)
86
14.9% (6.4%)
74
22.7% (8.3%)
113
Leavenworth Elementary 615 36.3%(-11.1%)
223
44.2% (-8.4%)
272
19.5% (19.5%)
120
26.2% (15.7%)
161
22.3% (17.0%)
137
20.0% (14.7%)
123
27.0% (11.2%)
166
Mayfair Elementary 589 37.2%(0.3%)
219
42.1% (-11.2%)
248
20.7% (10.9%)
122
27.7% (9.6%)
163
25.5% (8.2%)
150
20.2% (7.3%)
119
26.1% (8.1%)
154
Norseman Elementary 617 38.2%(-12.2%)
236
40.2% (-3.1%)
248
21.6% (15.3%)
133
28.5% (16.9%)
176
24.5% (11.9%)
151
21.2% (9.8%)
131
28.7% (18.4%)
177
Rowell Elementary 456 41.4%(-2.3%)
189
39.0% (-9.0%)
178
19.5% (11.3%)
89
27.0% (11.8%)
123
21.7% (7.0%)
99
18.4% (5.1%)
84
25.7% (10.4%)
117
Turner Elementary 558 35.1%(-10.9%)
196
42.7% (-4.6%)
238
22.2% (15.6%)
124
28.5% (15.4%)
159
25.8% (14.8%)
144
23.5% (11.0%)
131
29.0% (13.0%)
162
Wishon Elementary 458 29.5%(-5.5%)
135
46.9% (-8.3%)
215
23.6% (13.8%)
108
32.1% (14.9%)
147
26.9% (9.2%)
123
24.9% (9.8%)
114
31.9% (11.5%)
146
Scandinavian Middle 690 54.6%(-5.2%)
377
30.0% (0.0%)
207
15.4% (5.2%)
106
20.4% (7.2%)
141
24.2% (6.3%)
167
13.5% (3.5%)
93
18.1% (1.4%)
125
Yosemite Middle 368 56.8%(-9.6%)
209
26.4% (0.7%)
97
16.8% (8.9%)
62
23.1% (12.3%)
85
22.3% (7.3%)
82
14.9% (6.2%)
55
17.1% (4.2%)
63
McLane High 593 #Type! #Type! #Type! #Type! #Type! #Type!#Type!
Office of Equity and Access i-Ready Reading Report D1 10/21/2020Page 5
Notes: Domain percent on or above grade level includes scores of "Tested Out" and "Max Score" Report is based on student results for grades K-11. In 2019-20, grade K was not required to participate in Diagnostic 1. In 2019-20, the following schools did not participate in i-Ready: Fresno High, Phoenix Secondary, & Sunnyside.
* Cell Value Key: Current Year Diagnostic 1 % of Test Takers in Placement Level Category (% Change in Placement Category from Prior Year Diagnostic 1 Students)
Current Year Diagnostic 1 Count of Test Takers in Placement Category
Math i-Ready
D1
Test Taker Counts
On or Above Grade Level
Number & Operations
Measurement & Data Geometry
School
2 or More
Grade Levels Below
1 Grade Level Below
Overall PerformancePercentage of Students
Percentage of Students on or Above Grade Level in Math Domains
Fresno Unified 49,677 42.4%(-5.5%)21,048
36.8% (-2.6%)18,285
20.8% (8.1%)10,344
33.4% (9.2%)16,615
32.1% (6.9%)15,947
21.6% (6.9%)10,753
i-Ready Diagnostic 1 Standard View Performance Results* with Domains
2020-21 Summary
Algebra
26.0% (7.1%)12,905
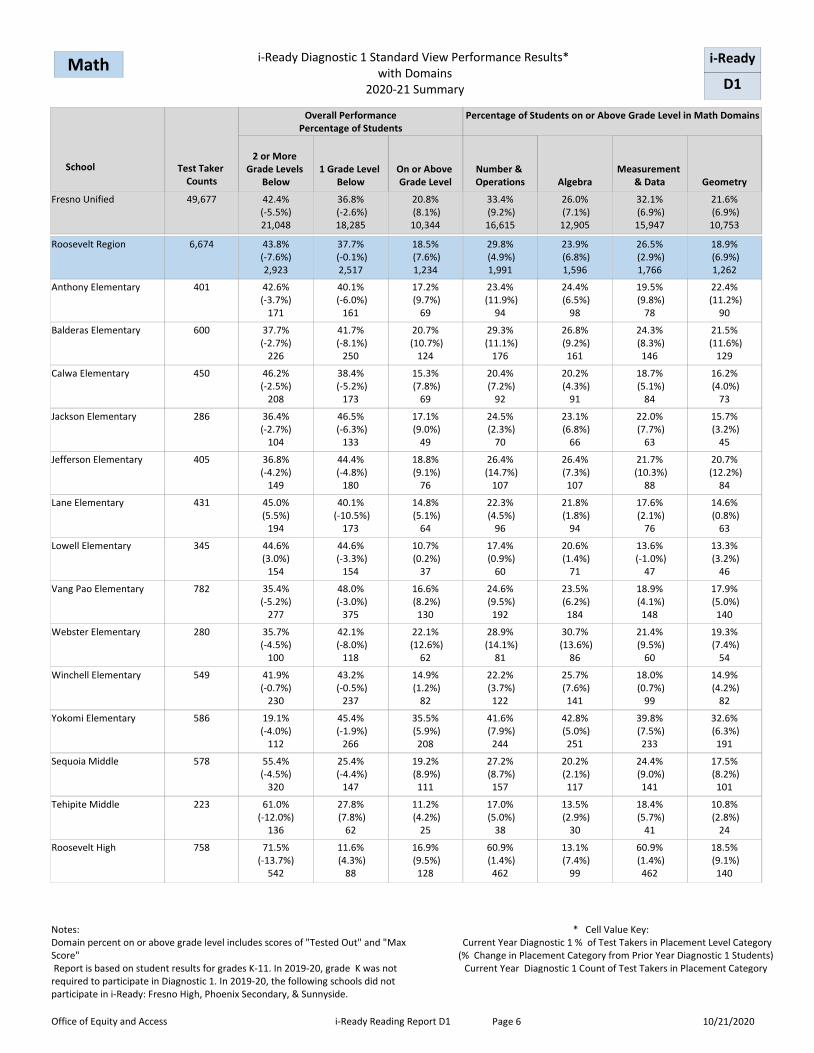
Roosevelt Region 6,674 43.8%(-7.6%)2,923
37.7% (-0.1%)2,517
18.5% (7.6%)1,234
29.8% (4.9%)1,991
26.5% (2.9%)1,766
18.9% (6.9%)1,262
23.9% (6.8%)1,596
Anthony Elementary 401 42.6%(-3.7%)
171
40.1% (-6.0%)
161
17.2% (9.7%)
69
23.4% (11.9%)
94
19.5% (9.8%)
78
22.4% (11.2%)
90
24.4% (6.5%)
98
Balderas Elementary 600 37.7%(-2.7%)
226
41.7% (-8.1%)
250
20.7% (10.7%)
124
29.3% (11.1%)
176
24.3% (8.3%)
146
21.5% (11.6%)
129
26.8% (9.2%)
161
Calwa Elementary 450 46.2%(-2.5%)
208
38.4% (-5.2%)
173
15.3% (7.8%)
69
20.4% (7.2%)
92
18.7% (5.1%)
84
16.2% (4.0%)
73
20.2% (4.3%)
91
Jackson Elementary 286 36.4%(-2.7%)
104
46.5% (-6.3%)
133
17.1% (9.0%)
49
24.5% (2.3%)
70
22.0% (7.7%)
63
15.7% (3.2%)
45
23.1% (6.8%)
66
Jefferson Elementary 405 36.8%(-4.2%)
149
44.4% (-4.8%)
180
18.8% (9.1%)
76
26.4% (14.7%)
107
21.7% (10.3%)
88
20.7% (12.2%)
84
26.4% (7.3%)
107
Lane Elementary 431 45.0%(5.5%)
194
40.1% (-10.5%)
173
14.8% (5.1%)
64
22.3% (4.5%)
96
17.6% (2.1%)
76
14.6% (0.8%)
63
21.8% (1.8%)
94
Lowell Elementary 345 44.6%(3.0%)
154
44.6% (-3.3%)
154
10.7% (0.2%)
37
17.4% (0.9%)
60
13.6% (-1.0%)
47
13.3% (3.2%)
46
20.6% (1.4%)
71
Vang Pao Elementary 782 35.4%(-5.2%)
277
48.0% (-3.0%)
375
16.6% (8.2%)
130
24.6% (9.5%)
192
18.9% (4.1%)
148
17.9% (5.0%)
140
23.5% (6.2%)
184
Webster Elementary 280 35.7%(-4.5%)
100
42.1% (-8.0%)
118
22.1% (12.6%)
62
28.9% (14.1%)
81
21.4% (9.5%)
60
19.3% (7.4%)
54
30.7% (13.6%)
86
Winchell Elementary 549 41.9%(-0.7%)
230
43.2% (-0.5%)
237
14.9% (1.2%)
82
22.2% (3.7%)
122
18.0% (0.7%)
99
14.9% (4.2%)
82
25.7% (7.6%)
141
Yokomi Elementary 586 19.1%(-4.0%)
112
45.4% (-1.9%)
266
35.5% (5.9%)
208
41.6% (7.9%)
244
39.8% (7.5%)
233
32.6% (6.3%)
191
42.8% (5.0%)
251
Sequoia Middle 578 55.4%(-4.5%)
320
25.4% (-4.4%)
147
19.2% (8.9%)
111
27.2% (8.7%)
157
24.4% (9.0%)
141
17.5% (8.2%)
101
20.2% (2.1%)
117
Tehipite Middle 223 61.0%(-12.0%)
136
27.8% (7.8%)
62
11.2% (4.2%)
25
17.0% (5.0%)
38
18.4% (5.7%)
41
10.8% (2.8%)
24
13.5% (2.9%)
30
Roosevelt High 758 71.5%(-13.7%)
542
11.6% (4.3%)
88
16.9% (9.5%)
128
60.9% (1.4%)
462
60.9% (1.4%)
462
18.5% (9.1%)
140
13.1% (7.4%)
99
Office of Equity and Access i-Ready Reading Report D1 10/21/2020Page 6
Notes: Domain percent on or above grade level includes scores of "Tested Out" and "Max Score" Report is based on student results for grades K-11. In 2019-20, grade K was not required to participate in Diagnostic 1. In 2019-20, the following schools did not participate in i-Ready: Fresno High, Phoenix Secondary, & Sunnyside.
* Cell Value Key: Current Year Diagnostic 1 % of Test Takers in Placement Level Category (% Change in Placement Category from Prior Year Diagnostic 1 Students)
Current Year Diagnostic 1 Count of Test Takers in Placement Category
Math i-Ready
D1
Test Taker Counts
On or Above Grade Level
Number & Operations
Measurement & Data Geometry
School
2 or More
Grade Levels Below
1 Grade Level Below
Overall PerformancePercentage of Students
Percentage of Students on or Above Grade Level in Math Domains
Fresno Unified 49,677 42.4%(-5.5%)21,048
36.8% (-2.6%)18,285
20.8% (8.1%)10,344
33.4% (9.2%)16,615
32.1% (6.9%)15,947
21.6% (6.9%)10,753
i-Ready Diagnostic 1 Standard View Performance Results* with Domains
Office of Equity and Access i-Ready Reading Report D1 10/21/2020Page 7
Notes: Domain percent on or above grade level includes scores of "Tested Out" and "Max Score" Report is based on student results for grades K-11. In 2019-20, grade K was not required to participate in Diagnostic 1. In 2019-20, the following schools did not participate in i-Ready: Fresno High, Phoenix Secondary, & Sunnyside.
* Cell Value Key: Current Year Diagnostic 1 % of Test Takers in Placement Level Category (% Change in Placement Category from Prior Year Diagnostic 1 Students)
Current Year Diagnostic 1 Count of Test Takers in Placement Category
Math i-Ready
D1
Test Taker Counts
On or Above Grade Level
Number & Operations
Measurement & Data Geometry
School
2 or More
Grade Levels Below
1 Grade Level Below
Overall PerformancePercentage of Students
Percentage of Students on or Above Grade Level in Math Domains
Fresno Unified 49,677 42.4%(-5.5%)21,048
36.8% (-2.6%)18,285
20.8% (8.1%)10,344
33.4% (9.2%)16,615
32.1% (6.9%)15,947
21.6% (6.9%)10,753
i-Ready Diagnostic 1 Standard View Performance Results* with Domains
2020-21 Summary
Algebra
26.0% (7.1%)12,905
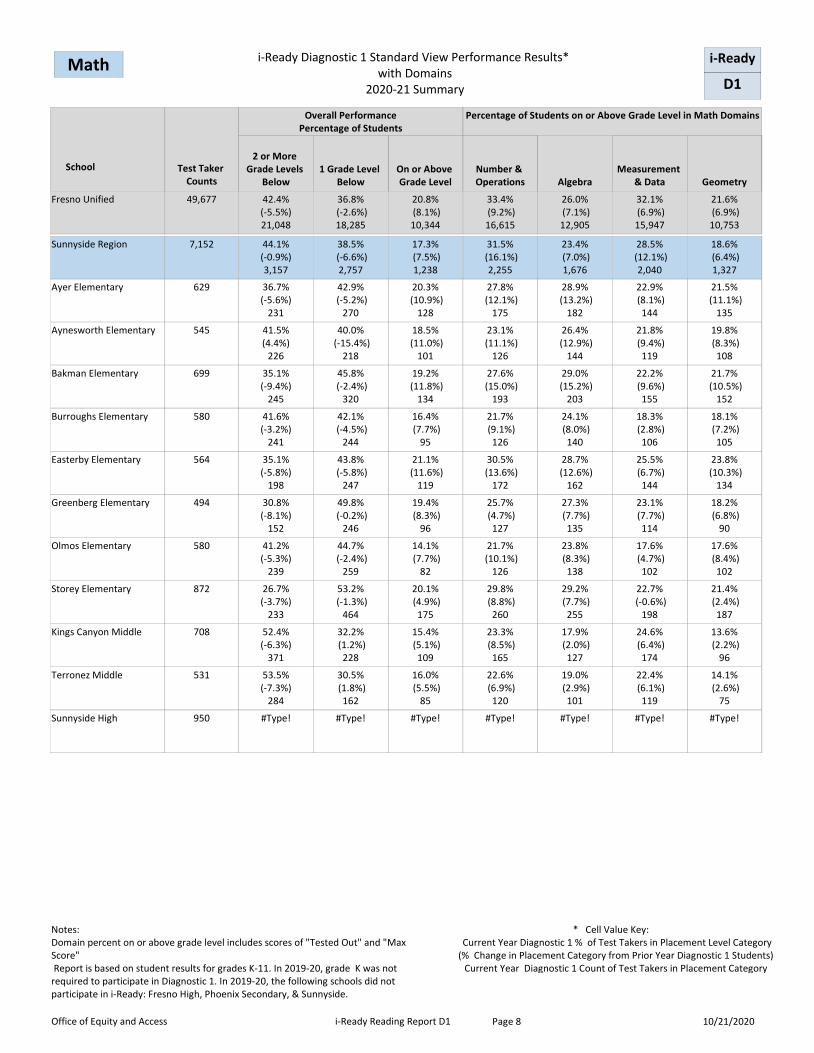
Sunnyside Region 7,152 44.1%(-0.9%)3,157
38.5% (-6.6%)2,757
17.3% (7.5%)1,238
31.5% (16.1%)
2,255
28.5% (12.1%)
2,040
18.6% (6.4%)1,327
23.4% (7.0%)1,676
Ayer Elementary 629 36.7%(-5.6%)
231
42.9% (-5.2%)
270
20.3% (10.9%)
128
27.8% (12.1%)
175
22.9% (8.1%)
144
21.5% (11.1%)
135
28.9% (13.2%)
182
Aynesworth Elementary 545 41.5%(4.4%)
226
40.0% (-15.4%)
218
18.5% (11.0%)
101
23.1% (11.1%)
126
21.8% (9.4%)
119
19.8% (8.3%)
108
26.4% (12.9%)
144
Bakman Elementary 699 35.1%(-9.4%)
245
45.8% (-2.4%)
320
19.2% (11.8%)
134
27.6% (15.0%)
193
22.2% (9.6%)
155
21.7% (10.5%)
152
29.0% (15.2%)
203
Burroughs Elementary 580 41.6%(-3.2%)
241
42.1% (-4.5%)
244
16.4% (7.7%)
95
21.7% (9.1%)
126
18.3% (2.8%)
106
18.1% (7.2%)
105
24.1% (8.0%)
140
Easterby Elementary 564 35.1%(-5.8%)
198
43.8% (-5.8%)
247
21.1% (11.6%)
119
30.5% (13.6%)
172
25.5% (6.7%)
144
23.8% (10.3%)
134
28.7% (12.6%)
162
Greenberg Elementary 494 30.8%(-8.1%)
152
49.8% (-0.2%)
246
19.4% (8.3%)
96
25.7% (4.7%)
127
23.1% (7.7%)
114
18.2% (6.8%)
90
27.3% (7.7%)
135
Olmos Elementary 580 41.2%(-5.3%)
239
44.7% (-2.4%)
259
14.1% (7.7%)
82
21.7% (10.1%)
126
17.6% (4.7%)
102
17.6% (8.4%)
102
23.8% (8.3%)
138
Storey Elementary 872 26.7%(-3.7%)
233
53.2% (-1.3%)
464
20.1% (4.9%)
175
29.8% (8.8%)
260
22.7% (-0.6%)
198
21.4% (2.4%)
187
29.2% (7.7%)
255
Kings Canyon Middle 708 52.4%(-6.3%)
371
32.2% (1.2%)
228
15.4% (5.1%)
109
23.3% (8.5%)
165
24.6% (6.4%)
174
13.6% (2.2%)
96
17.9% (2.0%)
127
Terronez Middle 531 53.5%(-7.3%)
284
30.5% (1.8%)
162
16.0% (5.5%)
85
22.6% (6.9%)
120
22.4% (6.1%)
119
14.1% (2.6%)
75
19.0% (2.9%)
101
Sunnyside High 950 #Type! #Type! #Type! #Type! #Type! #Type!#Type!
Office of Equity and Access i-Ready Reading Report D1 10/21/2020Page 8
Notes: Domain percent on or above grade level includes scores of "Tested Out" and "Max Score" Report is based on student results for grades K-11. In 2019-20, grade K was not required to participate in Diagnostic 1. In 2019-20, the following schools did not participate in i-Ready: Fresno High, Phoenix Secondary, & Sunnyside.
* Cell Value Key: Current Year Diagnostic 1 % of Test Takers in Placement Level Category (% Change in Placement Category from Prior Year Diagnostic 1 Students)
Current Year Diagnostic 1 Count of Test Takers in Placement Category
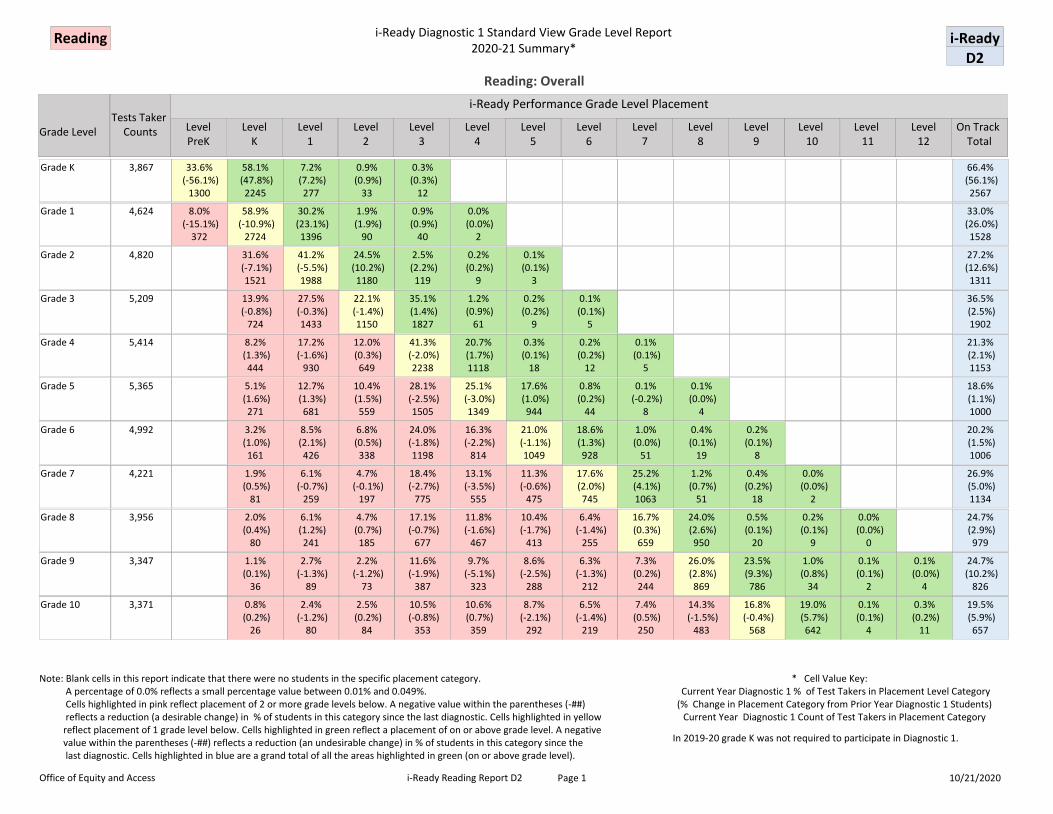
i-Ready Diagnostic 1 Standard View Grade Level Report2020-21 Summary*
i-ReadyReadingD2
On Track Total
Level12
Level 11
Level 10
Level9
Level7
Level8
Level5
i-Ready Performance Grade Level Placement
Grade LevelTests Taker
Counts LevelPreK
LevelK
Level1
Level2
Level3
Level4
Level6
Reading: Overall
Grade K 3,867 33.6% (-56.1%)
1300
58.1% (47.8%)
2245
7.2% (7.2%)
277
0.9% (0.9%)
33
0.3% (0.3%)
12
0.0% (0.0%)
0
0.0% (0.0%)
0
0.0% (0.0%)
0
0.0% (0.0%)
0
0.0% (0.0%)
0
0.0% (0.0%)
0
0.0% (0.0%)
0
0.0% (0.0%)
0
0.0% (0.0%)
0
66.4% (56.1%)
2567
Grade 1 4,624 8.0% (-15.1%)
372
58.9% (-10.9%)
2724
30.2% (23.1%)
1396
1.9% (1.9%)
90
0.9% (0.9%)
40
0.0% (0.0%)
2
0.0% (0.0%)
0
0.0% (0.0%)
0
0.0% (0.0%)
0
0.0% (0.0%)
0
0.0% (0.0%)
0
0.0% (0.0%)
0
0.0% (0.0%)
0
0.0% (0.0%)
0
33.0% (26.0%)
1528
Grade 2 4,820 0.0% (0.0%)
0
31.6% (-7.1%)
1521
41.2% (-5.5%)
1988
24.5% (10.2%)
1180
2.5% (2.2%)
119
0.2% (0.2%)
9
0.1% (0.1%)
3
0.0% (0.0%)
0
0.0% (0.0%)
0
0.0% (0.0%)
0
0.0% (0.0%)
0
0.0% (0.0%)
0
0.0% (0.0%)
0
0.0% (0.0%)
0
27.2% (12.6%)
1311
Grade 3 5,209 0.0% (0.0%)
0
13.9% (-0.8%)
724
27.5% (-0.3%)
1433
22.1% (-1.4%)
1150
35.1% (1.4%)1827
1.2% (0.9%)
61
0.2% (0.2%)
9
0.1% (0.1%)
5
0.0% (0.0%)
0
0.0% (0.0%)
0
0.0% (0.0%)
0
0.0% (0.0%)
0
0.0% (0.0%)
0
0.0% (0.0%)
0
36.5% (2.5%)1902
Grade 4 5,414 0.0% (0.0%)
0
8.2% (1.3%)
444
17.2% (-1.6%)
930
12.0% (0.3%)
649
41.3% (-2.0%)
2238
20.7% (1.7%)1118
0.3% (0.1%)
18
0.2% (0.2%)
12
0.1% (0.1%)
5
0.0% (0.0%)
0
0.0% (0.0%)
0
0.0% (0.0%)
0
0.0% (0.0%)
0
0.0% (0.0%)
0
21.3% (2.1%)1153
Grade 5 5,365 0.0% (0.0%)
0
5.1% (1.6%)
271
12.7% (1.3%)
681
10.4% (1.5%)
559
28.1% (-2.5%)
1505
25.1% (-3.0%)
1349
17.6% (1.0%)
944
0.8% (0.2%)
44
0.1% (-0.2%)
8
0.1% (0.0%)
4
0.0% (0.0%)
0
0.0% (0.0%)
0
0.0% (0.0%)
0
0.0% (0.0%)
0
18.6% (1.1%)1000
Grade 6 4,992 0.0% (0.0%)
0
3.2% (1.0%)
161
8.5% (2.1%)
426
6.8% (0.5%)
338
24.0% (-1.8%)
1198
16.3% (-2.2%)
814
21.0% (-1.1%)
1049
18.6% (1.3%)
928
1.0% (0.0%)
51
0.4% (0.1%)
19
0.2% (0.1%)
8
0.0% (0.0%)
0
0.0% (0.0%)
0
0.0% (0.0%)
0
20.2% (1.5%)1006
Grade 7 4,221 0.0% (0.0%)
0
1.9% (0.5%)
81
6.1% (-0.7%)
259
4.7% (-0.1%)
197
18.4% (-2.7%)
775
13.1% (-3.5%)
555
11.3% (-0.6%)
475
17.6% (2.0%)
745
25.2% (4.1%)1063
1.2% (0.7%)
51
0.4% (0.2%)
18
0.0% (0.0%)
2
0.0% (0.0%)
0
0.0% (0.0%)
0
26.9% (5.0%)1134
Grade 8 3,956 0.0% (0.0%)
0
2.0% (0.4%)
80
6.1% (1.2%)
241
4.7% (0.7%)
185
17.1% (-0.7%)
677
11.8% (-1.6%)
467
10.4% (-1.7%)
413
6.4% (-1.4%)
255
16.7% (0.3%)
659
24.0% (2.6%)
950
0.5% (0.1%)
20
0.2% (0.1%)
9
0.0% (0.0%)
0
0.0% (0.0%)
0
24.7% (2.9%)
979
Grade 9 3,347 0.0% (0.0%)
0
1.1% (0.1%)
36
2.7% (-1.3%)
89
2.2% (-1.2%)
73
11.6% (-1.9%)
387
9.7% (-5.1%)
323
8.6% (-2.5%)
288
6.3% (-1.3%)
212
7.3% (0.2%)
244
26.0% (2.8%)
869
23.5% (9.3%)
786
1.0% (0.8%)
34
0.1% (0.1%)
2
0.1% (0.0%)
4
24.7% (10.2%)
826
Grade 10 3,371 0.0% (0.0%)
0
0.8% (0.2%)
26
2.4% (-1.2%)
80
2.5% (0.2%)
84
10.5% (-0.8%)
353
10.6% (0.7%)
359
8.7% (-2.1%)
292
6.5% (-1.4%)
219
7.4% (0.5%)
250
14.3% (-1.5%)
483
16.8% (-0.4%)
568
19.0% (5.7%)
642
0.1% (0.1%)
4
0.3% (0.2%)
11
19.5% (5.9%)
657
Office of Equity and Access i-Ready Reading Report D2 10/21/2020Page 1
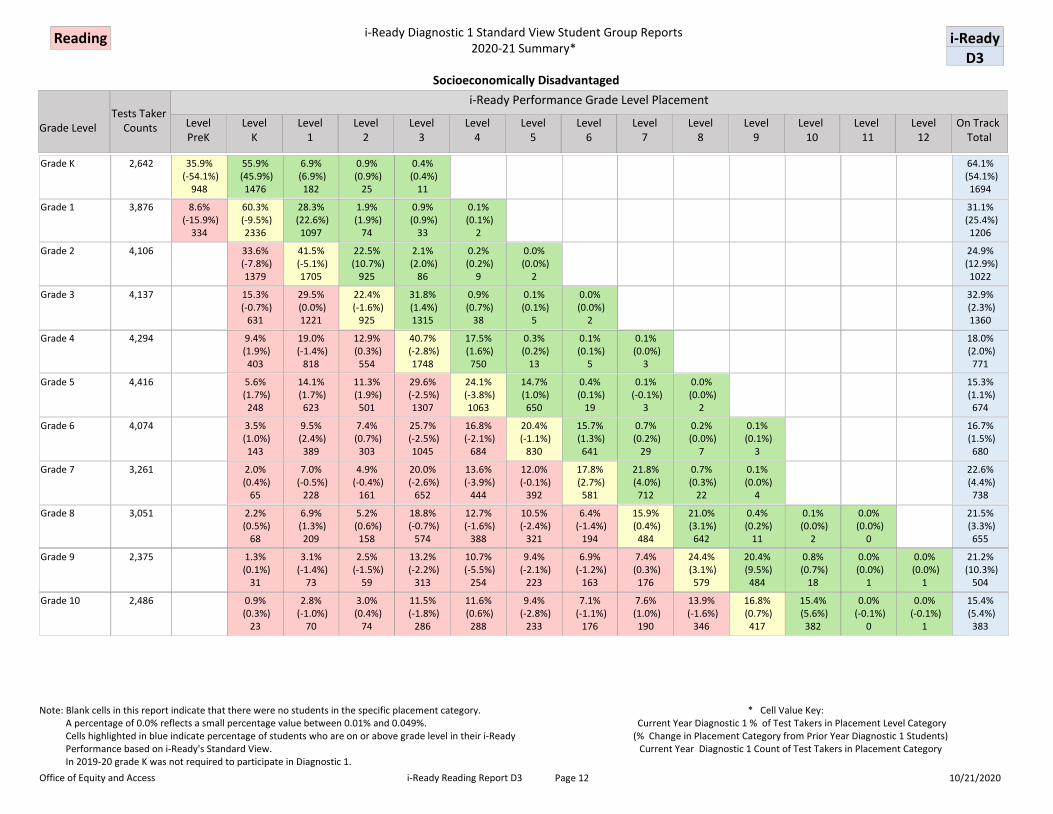
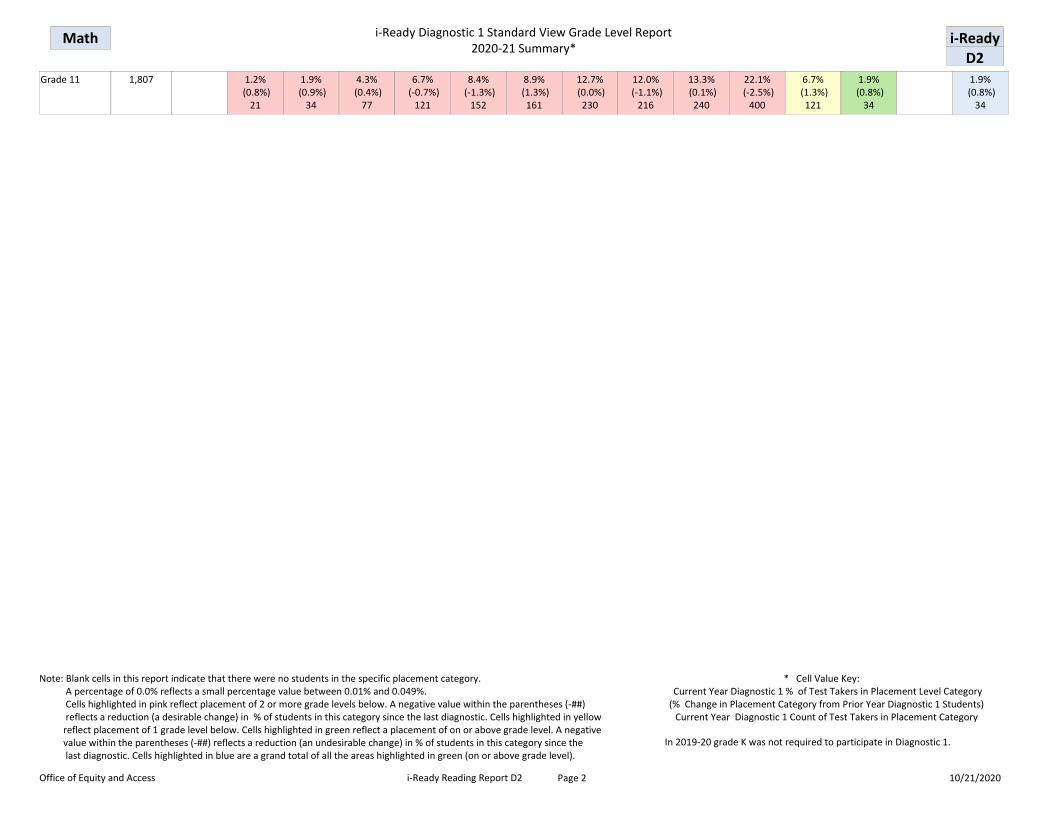
Note: Blank cells in this report indicate that there were no students in the specific placement category. A percentage of 0.0% reflects a small percentage value between 0.01% and 0.049%. Cells highlighted in pink reflect placement of 2 or more grade levels below. A negative value within the parentheses (-##) reflects a reduction (a desirable change) in % of students in this category since the last diagnostic. Cells highlighted in yellow reflect placement of 1 grade level below. Cells highlighted in green reflect a placement of on or above grade level. A negative value within the parentheses (-##) reflects a reduction (an undesirable change) in % of students in this category since the last diagnostic. Cells highlighted in blue are a grand total of all the areas highlighted in green (on or above grade level).
* Cell Value Key: Current Year Diagnostic 1 % of Test Takers in Placement Level Category (% Change in Placement Category from Prior Year Diagnostic 1 Students)
Current Year Diagnostic 1 Count of Test Takers in Placement Category
In 2019-20 grade K was not required to participate in Diagnostic 1.
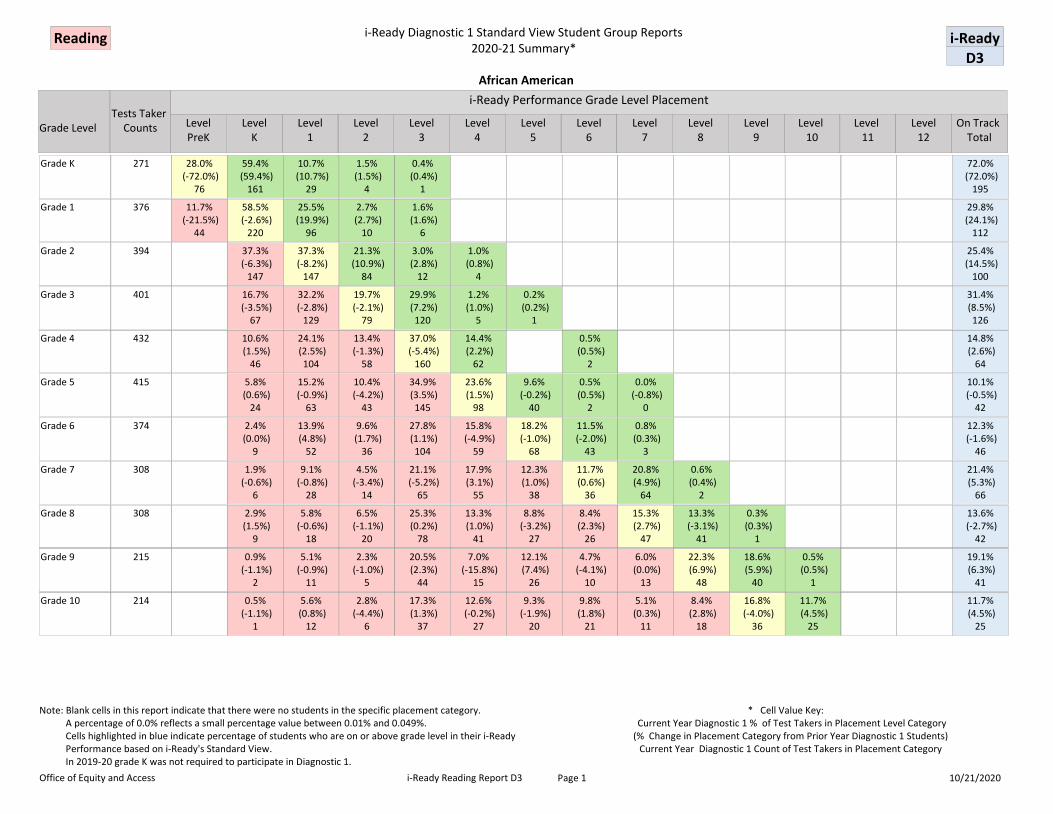
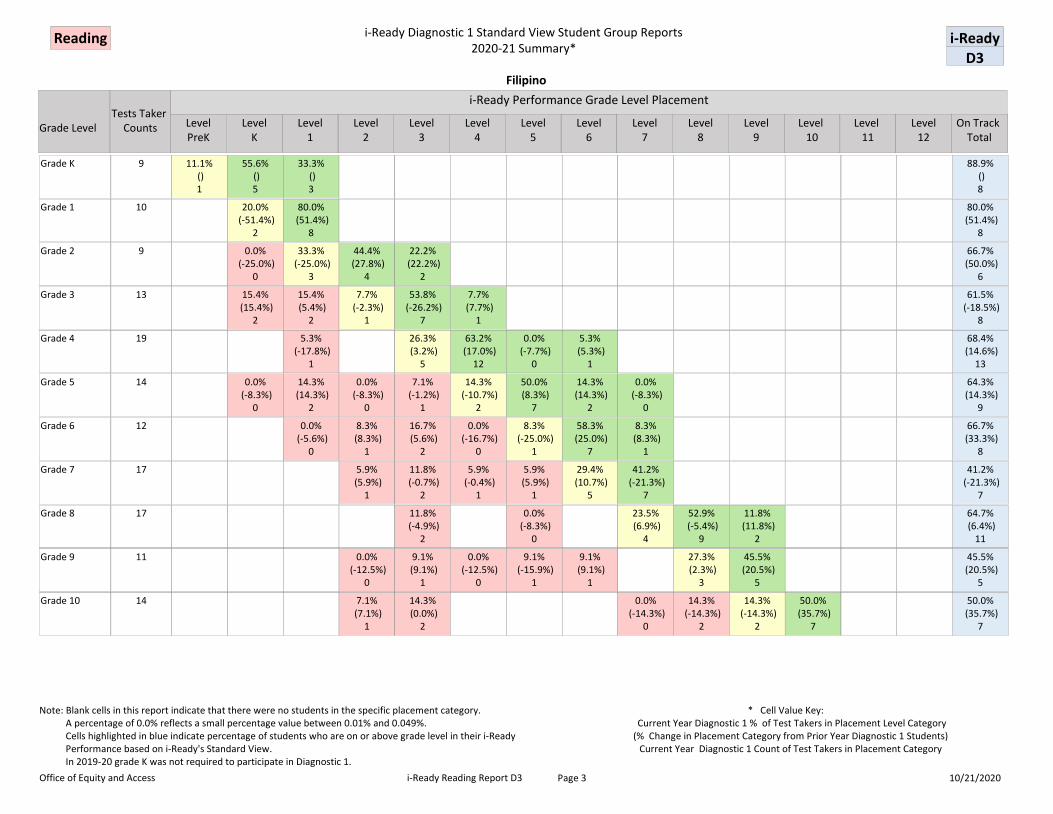
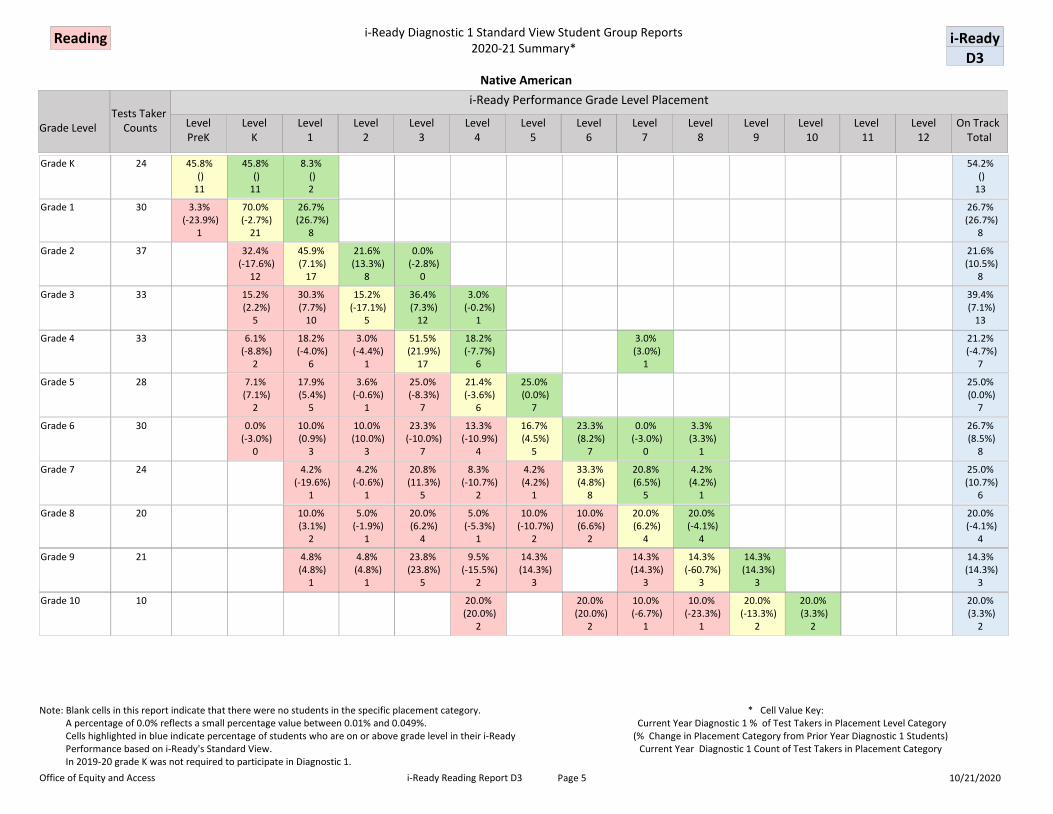
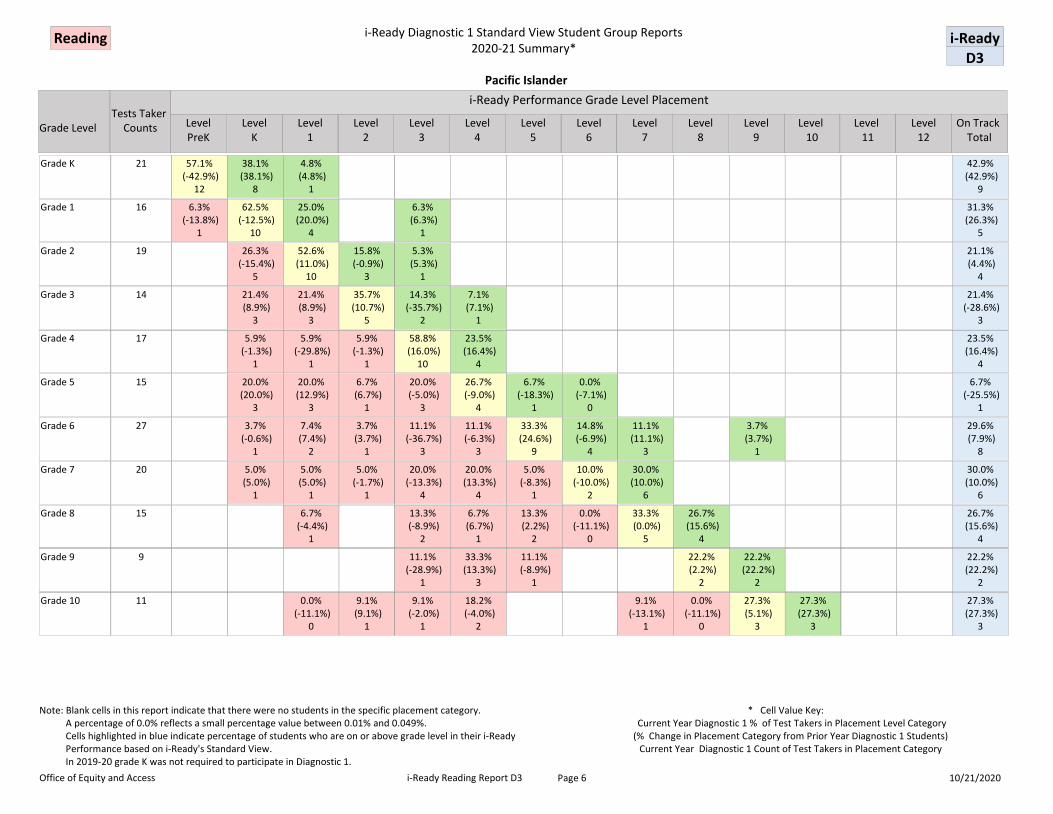
i-Ready Diagnostic 1 Standard View Student Group Reports2020-21 Summary*
i-ReadyReadingD3
African American
Level6
Level4
Level3
Level2
Level1
LevelK
LevelPreK
Tests Taker CountsGrade Level
i-Ready Performance Grade Level Placement
Level5
Level8
Level7
Level9
Level 10
Level 11
Level12
On Track Total
Grade K 271 28.0% (-72.0%)
76
59.4% (59.4%)
161
10.7% (10.7%)
29
1.5% (1.5%)
4
0.4% (0.4%)
1
0.0% (0.0%)
0
0.0% (0.0%)
0
0.0% (0.0%)
0
0.0% (0.0%)
0
0.0% (0.0%)
0
0.0% (0.0%)
0
0.0% (0.0%)
0
0.0% (0.0%)
0
0.0% (0.0%)
0
72.0% (72.0%)
195
Grade 1 376 11.7% (-21.5%)
44
58.5% (-2.6%)
220
25.5% (19.9%)
96
2.7% (2.7%)
10
1.6% (1.6%)
6
0.0% (0.0%)
0
0.0% (0.0%)
0
0.0% (0.0%)
0
0.0% (0.0%)
0
0.0% (0.0%)
0
0.0% (0.0%)
0
0.0% (0.0%)
0
0.0% (0.0%)
0
0.0% (0.0%)
0
29.8% (24.1%)
112
Grade 2 394 0.0% (0.0%)
0
37.3% (-6.3%)
147
37.3% (-8.2%)
147
21.3% (10.9%)
84
3.0% (2.8%)
12
1.0% (0.8%)
4
0.0% (0.0%)
0
0.0% (0.0%)
0
0.0% (0.0%)
0
0.0% (0.0%)
0
0.0% (0.0%)
0
0.0% (0.0%)
0
0.0% (0.0%)
0
0.0% (0.0%)
0
25.4% (14.5%)
100
Grade 3 401 0.0% (0.0%)
0
16.7% (-3.5%)
67
32.2% (-2.8%)
129
19.7% (-2.1%)
79
29.9% (7.2%)
120
1.2% (1.0%)
5
0.2% (0.2%)
1
0.0% (0.0%)
0
0.0% (0.0%)
0
0.0% (0.0%)
0
0.0% (0.0%)
0
0.0% (0.0%)
0
0.0% (0.0%)
0
0.0% (0.0%)
0
31.4% (8.5%)
126
Grade 4 432 0.0% (0.0%)
0
10.6% (1.5%)
46
24.1% (2.5%)
104
13.4% (-1.3%)
58
37.0% (-5.4%)
160
14.4% (2.2%)
62
0.0% (0.0%)
0
0.5% (0.5%)
2
0.0% (0.0%)
0
0.0% (0.0%)
0
0.0% (0.0%)
0
0.0% (0.0%)
0
0.0% (0.0%)
0
0.0% (0.0%)
0
14.8% (2.6%)
64
Grade 5 415 0.0% (0.0%)
0
5.8% (0.6%)
24
15.2% (-0.9%)
63
10.4% (-4.2%)
43
34.9% (3.5%)
145
23.6% (1.5%)
98
9.6% (-0.2%)
40
0.5% (0.5%)
2
0.0% (-0.8%)
0
0.0% (0.0%)
0
0.0% (0.0%)
0
0.0% (0.0%)
0
0.0% (0.0%)
0
0.0% (0.0%)
0
10.1% (-0.5%)
42
Grade 6 374 0.0% (0.0%)
0
2.4% (0.0%)
9
13.9% (4.8%)
52
9.6% (1.7%)
36
27.8% (1.1%)
104
15.8% (-4.9%)
59
18.2% (-1.0%)
68
11.5% (-2.0%)
43
0.8% (0.3%)
3
0.0% (0.0%)
0
0.0% (0.0%)
0
0.0% (0.0%)
0
0.0% (0.0%)
0
0.0% (0.0%)
0
12.3% (-1.6%)
46
Grade 7 308 0.0% (0.0%)
0
1.9% (-0.6%)
6
9.1% (-0.8%)
28
4.5% (-3.4%)
14
21.1% (-5.2%)
65
17.9% (3.1%)
55
12.3% (1.0%)
38
11.7% (0.6%)
36
20.8% (4.9%)
64
0.6% (0.4%)
2
0.0% (0.0%)
0
0.0% (0.0%)
0
0.0% (0.0%)
0
0.0% (0.0%)
0
21.4% (5.3%)
66
Grade 8 308 0.0% (0.0%)
0
2.9% (1.5%)
9
5.8% (-0.6%)
18
6.5% (-1.1%)
20
25.3% (0.2%)
78
13.3% (1.0%)
41
8.8% (-3.2%)
27
8.4% (2.3%)
26
15.3% (2.7%)
47
13.3% (-3.1%)
41
0.3% (0.3%)
1
0.0% (0.0%)
0
0.0% (0.0%)
0
0.0% (0.0%)
0
13.6% (-2.7%)
42
Grade 9 215 0.0% (0.0%)
0
0.9% (-1.1%)
2
5.1% (-0.9%)
11
2.3% (-1.0%)
5
20.5% (2.3%)
44
7.0% (-15.8%)
15
12.1% (7.4%)
26
4.7% (-4.1%)
10
6.0% (0.0%)
13
22.3% (6.9%)
48
18.6% (5.9%)
40
0.5% (0.5%)
1
0.0% (0.0%)
0
0.0% (0.0%)
0
19.1% (6.3%)
41
Grade 10 214 0.0% (0.0%)
0
0.5% (-1.1%)
1
5.6% (0.8%)
12
2.8% (-4.4%)
6
17.3% (1.3%)
37
12.6% (-0.2%)
27
9.3% (-1.9%)
20
9.8% (1.8%)
21
5.1% (0.3%)
11
8.4% (2.8%)
18
16.8% (-4.0%)
36
11.7% (4.5%)
25
0.0% (0.0%)
0
0.0% (0.0%)
0
11.7% (4.5%)
25
Office of Equity and Access i-Ready Reading Report D3 10/21/2020Page 1
Note: Blank cells in this report indicate that there were no students in the specific placement category. A percentage of 0.0% reflects a small percentage value between 0.01% and 0.049%. Cells highlighted in blue indicate percentage of students who are on or above grade level in their i-Ready Performance based on i-Ready's Standard View. In 2019-20 grade K was not required to participate in Diagnostic 1.
* Cell Value Key: Current Year Diagnostic 1 % of Test Takers in Placement Level Category (% Change in Placement Category from Prior Year Diagnostic 1 Students)
Current Year Diagnostic 1 Count of Test Takers in Placement Category
i-Ready Diagnostic 1 Standard View Student Group Reports2020-21 Summary*
i-ReadyReadingD3
Asian
Level6
Level4
Level3
Level2
Level1
LevelK
LevelPreK
Tests Taker CountsGrade Level
i-Ready Performance Grade Level Placement
Level5
Level8
Level7
Level9
Level 10
Level 11
Level12
On Track Total
Grade K 540 32.6% (-60.3%)
176
59.3% (52.1%)
320
7.2% (7.2%)
39
0.7% (0.7%)
4
0.2% (0.2%)
1
0.0% (0.0%)
0
0.0% (0.0%)
0
0.0% (0.0%)
0
0.0% (0.0%)
0
0.0% (0.0%)
0
0.0% (0.0%)
0
0.0% (0.0%)
0
0.0% (0.0%)
0
0.0% (0.0%)
0
67.4% (60.3%)
364
Grade 1 579 7.4% (-14.1%)
43
57.5% (-11.2%)
333
32.5% (22.7%)
188
1.7% (1.7%)
10
0.9% (0.9%)
5
0.0% (0.0%)
0
0.0% (0.0%)
0
0.0% (0.0%)
0
0.0% (0.0%)
0
0.0% (0.0%)
0
0.0% (0.0%)
0
0.0% (0.0%)
0
0.0% (0.0%)
0
0.0% (0.0%)
0
35.1% (25.3%)
203
Grade 2 591 0.0% (0.0%)
0
26.2% (-9.4%)
155
45.3% (-4.1%)
268
26.2% (11.3%)
155
1.9% (1.9%)
11
0.2% (0.2%)
1
0.2% (0.2%)
1
0.0% (0.0%)
0
0.0% (0.0%)
0
0.0% (0.0%)
0
0.0% (0.0%)
0
0.0% (0.0%)
0
0.0% (0.0%)
0
0.0% (0.0%)
0
28.4% (13.5%)
168
Grade 3 593 0.0% (0.0%)
0
12.1% (2.4%)
72
27.2% (0.3%)
161
22.3% (-6.8%)
132
37.6% (3.4%)
223
0.7% (0.5%)
4
0.2% (0.2%)
1
0.0% (0.0%)
0
0.0% (0.0%)
0
0.0% (0.0%)
0
0.0% (0.0%)
0
0.0% (0.0%)
0
0.0% (0.0%)
0
0.0% (0.0%)
0
38.4% (4.1%)
228
Grade 4 520 0.0% (0.0%)
0
6.9% (1.2%)
36
12.1% (-1.4%)
63
11.7% (1.3%)
61
45.2% (-6.7%)
235
23.7% (5.8%)
123
0.4% (-0.2%)
2
0.0% (0.0%)
0
0.0% (0.0%)
0
0.0% (0.0%)
0
0.0% (0.0%)
0
0.0% (0.0%)
0
0.0% (0.0%)
0
0.0% (0.0%)
0
24.0% (5.6%)
125
Grade 5 532 0.0% (0.0%)
0
3.9% (1.0%)
21
9.6% (1.0%)
51
6.6% (0.0%)
35
28.9% (-1.7%)
154
29.3% (-5.7%)
156
20.7% (5.5%)
110
0.9% (0.5%)
5
0.0% (-0.6%)
0
0.0% (0.0%)
0
0.0% (0.0%)
0
0.0% (0.0%)
0
0.0% (0.0%)
0
0.0% (0.0%)
0
21.6% (5.5%)
115
Grade 6 514 0.0% (0.0%)
0
2.3% (0.7%)
12
5.3% (2.3%)
27
4.3% (0.9%)
22
21.8% (-4.2%)
112
22.0% (2.3%)
113
21.8% (-4.8%)
112
21.0% (2.6%)
108
1.2% (0.5%)
6
0.2% (-0.4%)
1
0.2% (0.2%)
1
0.0% (0.0%)
0
0.0% (0.0%)
0
0.0% (0.0%)
0
22.6% (2.9%)
116
Grade 7 410 0.0% (0.0%)
0
1.7% (1.0%)
7
3.2% (-2.2%)
13
3.7% (0.2%)
15
14.4% (-2.0%)
59
10.0% (-5.5%)
41
13.9% (2.1%)
57
23.7% (4.7%)
97
27.6% (0.0%)
113
1.0% (0.7%)
4
1.0% (1.0%)
4
0.0% (0.0%)
0
0.0% (0.0%)
0
0.0% (0.0%)
0
29.5% (1.7%)
121
Grade 8 394 0.0% (0.0%)
0
1.5% (0.6%)
6
4.6% (1.9%)
18
1.3% (0.0%)
5
14.5% (0.2%)
57
10.9% (0.6%)
43
6.3% (-6.6%)
25
7.1% (-0.1%)
28
18.8% (-0.6%)
74
34.8% (4.0%)
137
0.0% (-0.2%)
0
0.3% (0.3%)
1
0.0% (0.0%)
0
0.0% (0.0%)
0
35.0% (4.0%)
138
Grade 9 355 0.0% (0.0%)
0
0.8% (-1.3%)
3
0.8% (0.1%)
3
1.7% (-0.4%)
6
7.9% (-1.9%)
28
8.7% (-8.1%)
31
7.6% (-3.6%)
27
5.4% (-3.0%)
19
7.0% (-2.0%)
25
27.0% (-0.2%)
96
31.5% (19.0%)
112
0.8% (0.8%)
3
0.3% (0.3%)
1
0.3% (0.3%)
1
33.0% (20.4%)
117
Grade 10 396 0.0% (0.0%)
0
0.8% (0.8%)
3
1.3% (-1.0%)
5
1.8% (1.0%)
7
5.8% (-5.3%)
23
12.1% (4.7%)
48
10.1% (-1.8%)
40
6.1% (-2.8%)
24
9.3% (4.9%)
37
13.1% (-3.9%)
52
18.7% (-1.3%)
74
20.7% (4.4%)
82
0.0% (0.0%)
0
0.3% (0.3%)
1
21.0% (4.7%)
83
Office of Equity and Access i-Ready Reading Report D3 10/21/2020Page 2
Note: Blank cells in this report indicate that there were no students in the specific placement category. A percentage of 0.0% reflects a small percentage value between 0.01% and 0.049%. Cells highlighted in blue indicate percentage of students who are on or above grade level in their i-Ready Performance based on i-Ready's Standard View. In 2019-20 grade K was not required to participate in Diagnostic 1.
* Cell Value Key: Current Year Diagnostic 1 % of Test Takers in Placement Level Category (% Change in Placement Category from Prior Year Diagnostic 1 Students)
Current Year Diagnostic 1 Count of Test Takers in Placement Category
i-Ready Diagnostic 1 Standard View Student Group Reports2020-21 Summary*
i-ReadyReadingD3
Filipino
Level6
Level4
Level3
Level2
Level1
LevelK
LevelPreK
Tests Taker CountsGrade Level
i-Ready Performance Grade Level Placement
Level5
Level8
Level7
Level9
Level 10
Level 11
Level12
On Track Total
Grade K 9 11.1% ()1
55.6% ()5
33.3% ()3
0.0% ()0
0.0% ()0
0.0% ()0
0.0% ()0
0.0% ()0
0.0% ()0
0.0% ()0
0.0% ()0
0.0% ()0
0.0% ()0
0.0% ()0
88.9% ()8
Grade 1 10 0.0% (0.0%)
0
20.0% (-51.4%)
2
80.0% (51.4%)
8
0.0% (0.0%)
0
0.0% (0.0%)
0
0.0% (0.0%)
0
0.0% (0.0%)
0
0.0% (0.0%)
0
0.0% (0.0%)
0
0.0% (0.0%)
0
0.0% (0.0%)
0
0.0% (0.0%)
0
0.0% (0.0%)
0
0.0% (0.0%)
0
80.0% (51.4%)
8
Grade 2 9 0.0% (0.0%)
0
0.0% (-25.0%)
0
33.3% (-25.0%)
3
44.4% (27.8%)
4
22.2% (22.2%)
2
0.0% (0.0%)
0
0.0% (0.0%)
0
0.0% (0.0%)
0
0.0% (0.0%)
0
0.0% (0.0%)
0
0.0% (0.0%)
0
0.0% (0.0%)
0
0.0% (0.0%)
0
0.0% (0.0%)
0
66.7% (50.0%)
6
Grade 3 13 0.0% (0.0%)
0
15.4% (15.4%)
2
15.4% (5.4%)
2
7.7% (-2.3%)
1
53.8% (-26.2%)
7
7.7% (7.7%)
1
0.0% (0.0%)
0
0.0% (0.0%)
0
0.0% (0.0%)
0
0.0% (0.0%)
0
0.0% (0.0%)
0
0.0% (0.0%)
0
0.0% (0.0%)
0
0.0% (0.0%)
0
61.5% (-18.5%)
8
Grade 4 19 0.0% (0.0%)
0
0.0% (0.0%)
0
5.3% (-17.8%)
1
0.0% (0.0%)
0
26.3% (3.2%)
5
63.2% (17.0%)
12
0.0% (-7.7%)
0
5.3% (5.3%)
1
0.0% (0.0%)
0
0.0% (0.0%)
0
0.0% (0.0%)
0
0.0% (0.0%)
0
0.0% (0.0%)
0
0.0% (0.0%)
0
68.4% (14.6%)
13
Grade 5 14 0.0% (0.0%)
0
0.0% (-8.3%)
0
14.3% (14.3%)
2
0.0% (-8.3%)
0
7.1% (-1.2%)
1
14.3% (-10.7%)
2
50.0% (8.3%)
7
14.3% (14.3%)
2
0.0% (-8.3%)
0
0.0% (0.0%)
0
0.0% (0.0%)
0
0.0% (0.0%)
0
0.0% (0.0%)
0
0.0% (0.0%)
0
64.3% (14.3%)
9
Grade 6 12 0.0% (0.0%)
0
0.0% (0.0%)
0
0.0% (-5.6%)
0
8.3% (8.3%)
1
16.7% (5.6%)
2
0.0% (-16.7%)
0
8.3% (-25.0%)
1
58.3% (25.0%)
7
8.3% (8.3%)
1
0.0% (0.0%)
0
0.0% (0.0%)
0
0.0% (0.0%)
0
0.0% (0.0%)
0
0.0% (0.0%)
0
66.7% (33.3%)
8
Grade 7 17 0.0% (0.0%)
0
0.0% (0.0%)
0
0.0% (0.0%)
0
5.9% (5.9%)
1
11.8% (-0.7%)
2
5.9% (-0.4%)
1
5.9% (5.9%)
1
29.4% (10.7%)
5
41.2% (-21.3%)
7
0.0% (0.0%)
0
0.0% (0.0%)
0
0.0% (0.0%)
0
0.0% (0.0%)
0
0.0% (0.0%)
0
41.2% (-21.3%)
7
Grade 8 17 0.0% (0.0%)
0
0.0% (0.0%)
0
0.0% (0.0%)
0
0.0% (0.0%)
0
11.8% (-4.9%)
2
0.0% (0.0%)
0
0.0% (-8.3%)
0
0.0% (0.0%)
0
23.5% (6.9%)
4
52.9% (-5.4%)
9
11.8% (11.8%)
2
0.0% (0.0%)
0
0.0% (0.0%)
0
0.0% (0.0%)
0
64.7% (6.4%)
11
Grade 9 11 0.0% (0.0%)
0
0.0% (0.0%)
0
0.0% (0.0%)
0
0.0% (-12.5%)
0
9.1% (9.1%)
1
0.0% (-12.5%)
0
9.1% (-15.9%)
1
9.1% (9.1%)
1
0.0% (0.0%)
0
27.3% (2.3%)
3
45.5% (20.5%)
5
0.0% (0.0%)
0
0.0% (0.0%)
0
0.0% (0.0%)
0
45.5% (20.5%)
5
Grade 10 14 0.0% (0.0%)
0
0.0% (0.0%)
0
0.0% (0.0%)
0
7.1% (7.1%)
1
14.3% (0.0%)
2
0.0% (0.0%)
0
0.0% (0.0%)
0
0.0% (0.0%)
0
0.0% (-14.3%)
0
14.3% (-14.3%)
2
14.3% (-14.3%)
2
50.0% (35.7%)
7
0.0% (0.0%)
0
0.0% (0.0%)
0
50.0% (35.7%)
7
Office of Equity and Access i-Ready Reading Report D3 10/21/2020Page 3
Note: Blank cells in this report indicate that there were no students in the specific placement category. A percentage of 0.0% reflects a small percentage value between 0.01% and 0.049%. Cells highlighted in blue indicate percentage of students who are on or above grade level in their i-Ready Performance based on i-Ready's Standard View. In 2019-20 grade K was not required to participate in Diagnostic 1.
* Cell Value Key: Current Year Diagnostic 1 % of Test Takers in Placement Level Category (% Change in Placement Category from Prior Year Diagnostic 1 Students)
Current Year Diagnostic 1 Count of Test Takers in Placement Category
i-Ready Diagnostic 1 Standard View Student Group Reports2020-21 Summary*
i-ReadyReadingD3
Hispanic
Level6
Level4
Level3
Level2
Level1
LevelK
LevelPreK
Tests Taker CountsGrade Level
i-Ready Performance Grade Level Placement
Level5
Level8
Level7
Level9
Level 10
Level 11
Level12
On Track Total
Grade K 2,505 35.8% (-53.3%)
898
56.6% (45.8%)
1419
6.4% (6.4%)
160
0.8% (0.8%)
21
0.3% (0.3%)
7
0.0% (0.0%)
0
0.0% (0.0%)
0
0.0% (0.0%)
0
0.0% (0.0%)
0
0.0% (0.0%)
0
0.0% (0.0%)
0
0.0% (0.0%)
0
0.0% (0.0%)
0
0.0% (0.0%)
0
64.2% (53.3%)
1607
Grade 1 3,009 8.4% (-15.3%)
252
60.5% (-10.6%)
1821
28.3% (23.1%)
853
1.9% (1.9%)
58
0.8% (0.8%)
23
0.1% (0.1%)
2
0.0% (0.0%)
0
0.0% (0.0%)
0
0.0% (0.0%)
0
0.0% (0.0%)
0
0.0% (0.0%)
0
0.0% (0.0%)
0
0.0% (0.0%)
0
0.0% (0.0%)
0
31.1% (25.9%)
936
Grade 2 3,200 0.0% (0.0%)
0
33.9% (-6.0%)
1086
41.5% (-5.6%)
1327
22.4% (9.5%)
717
2.1% (1.9%)
66
0.1% (0.1%)
2
0.1% (0.1%)
2
0.0% (0.0%)
0
0.0% (0.0%)
0
0.0% (0.0%)
0
0.0% (0.0%)
0
0.0% (0.0%)
0
0.0% (0.0%)
0
0.0% (0.0%)
0
24.6% (11.5%)
787
Grade 3 3,529 0.0% (0.0%)
0
14.7% (-0.9%)
518
28.4% (-0.2%)
1001
22.9% (-0.9%)
807
33.0% (1.1%)1163
0.9% (0.7%)
33
0.1% (0.1%)
4
0.1% (0.1%)
3
0.0% (0.0%)
0
0.0% (0.0%)
0
0.0% (0.0%)
0
0.0% (0.0%)
0
0.0% (0.0%)
0
0.0% (0.0%)
0
34.1% (2.0%)1203
Grade 4 3,778 0.0% (0.0%)
0
8.7% (1.7%)
327
18.2% (-1.9%)
688
12.6% (0.5%)
477
41.6% (-1.8%)
1571
18.4% (1.2%)
697
0.3% (0.2%)
10
0.2% (0.1%)
7
0.0% (0.0%)
1
0.0% (0.0%)
0
0.0% (0.0%)
0
0.0% (0.0%)
0
0.0% (0.0%)
0
0.0% (0.0%)
0
18.9% (1.5%)
715
Grade 5 3,771 0.0% (0.0%)
0
5.2% (1.6%)
195
13.4% (1.4%)
504
11.6% (2.3%)
439
28.8% (-2.8%)
1085
24.1% (-3.8%)
909
16.1% (1.0%)
608
0.6% (0.3%)
24
0.1% (0.0%)
5
0.1% (0.0%)
2
0.0% (0.0%)
0
0.0% (0.0%)
0
0.0% (0.0%)
0
0.0% (0.0%)
0
16.9% (1.3%)
639
Grade 6 3,473 0.0% (0.0%)
0
3.6% (1.2%)
126
9.1% (2.2%)
315
7.3% (0.4%)
255
25.4% (-1.7%)
881
15.9% (-2.6%)
552
20.9% (-0.7%)
725
16.7% (1.3%)
581
0.7% (-0.2%)
24
0.3% (0.1%)
11
0.1% (0.0%)
3
0.0% (0.0%)
0
0.0% (0.0%)
0
0.0% (0.0%)
0
17.8% (1.3%)
619
Grade 7 2,948 0.0% (0.0%)
0
2.0% (0.5%)
58
6.7% (-0.5%)
198
5.1% (0.2%)
151
19.7% (-2.6%)
581
13.4% (-4.0%)
395
11.7% (-0.7%)
344
17.1% (2.0%)
505
23.0% (4.3%)
678
1.1% (0.8%)
31
0.2% (0.1%)
6
0.0% (0.0%)
1
0.0% (0.0%)
0
0.0% (0.0%)
0
24.3% (5.2%)
716
Grade 8 2,741 0.0% (0.0%)
0
2.1% (0.3%)
58
6.7% (1.4%)
185
5.4% (1.0%)
148
17.9% (-0.8%)
490
12.3% (-2.3%)
336
11.4% (-1.5%)
313
6.1% (-2.1%)
166
16.1% (0.0%)
441
21.6% (3.9%)
593
0.3% (0.0%)
8
0.1% (0.0%)
3
0.0% (0.0%)
0
0.0% (0.0%)
0
22.0% (4.0%)
604
Grade 9 2,309 0.0% (0.0%)
0
1.3% (0.5%)
30
2.7% (-1.5%)
63
2.4% (-1.5%)
56
12.3% (-2.6%)
284
10.6% (-4.2%)
244
9.0% (-3.9%)
208
6.8% (-0.9%)
158
7.8% (0.6%)
181
26.0% (3.0%)
600
20.1% (9.4%)
464
0.9% (0.9%)
20
0.0% (0.0%)
1
0.0% (0.0%)
0
21.0% (10.4%)
485
Grade 10 2,246 0.0% (0.0%)
0
1.0% (0.2%)
22
2.2% (-1.6%)
50
2.8% (0.7%)
62
11.3% (-0.9%)
253
10.6% (-0.6%)
239
9.2% (-2.5%)
207
6.6% (-1.9%)
148
7.7% (-0.4%)
174
16.2% (-0.3%)
363
16.4% (0.9%)
368
16.0% (6.5%)
359
0.0% (0.0%)
0
0.0% (0.0%)
1
16.0% (6.5%)
360
Office of Equity and Access i-Ready Reading Report D3 10/21/2020Page 4
Note: Blank cells in this report indicate that there were no students in the specific placement category. A percentage of 0.0% reflects a small percentage value between 0.01% and 0.049%. Cells highlighted in blue indicate percentage of students who are on or above grade level in their i-Ready Performance based on i-Ready's Standard View. In 2019-20 grade K was not required to participate in Diagnostic 1.
* Cell Value Key: Current Year Diagnostic 1 % of Test Takers in Placement Level Category (% Change in Placement Category from Prior Year Diagnostic 1 Students)
Current Year Diagnostic 1 Count of Test Takers in Placement Category
i-Ready Diagnostic 1 Standard View Student Group Reports2020-21 Summary*
i-ReadyReadingD3
Native American
Level6
Level4
Level3
Level2
Level1
LevelK
LevelPreK
Tests Taker CountsGrade Level
i-Ready Performance Grade Level Placement
Level5
Level8
Level7
Level9
Level 10
Level 11
Level12
On Track Total
Grade K 24 45.8% ()11
45.8% ()11
8.3% ()2
0.0% ()0
0.0% ()0
0.0% ()0
0.0% ()0
0.0% ()0
0.0% ()0
0.0% ()0
0.0% ()0
0.0% ()0
0.0% ()0
0.0% ()0
54.2% ()13
Grade 1 30 3.3% (-23.9%)
1
70.0% (-2.7%)
21
26.7% (26.7%)
8
0.0% (0.0%)
0
0.0% (0.0%)
0
0.0% (0.0%)
0
0.0% (0.0%)
0
0.0% (0.0%)
0
0.0% (0.0%)
0
0.0% (0.0%)
0
0.0% (0.0%)
0
0.0% (0.0%)
0
0.0% (0.0%)
0
0.0% (0.0%)
0
26.7% (26.7%)
8
Grade 2 37 0.0% (0.0%)
0
32.4% (-17.6%)
12
45.9% (7.1%)
17
21.6% (13.3%)
8
0.0% (-2.8%)
0
0.0% (0.0%)
0
0.0% (0.0%)
0
0.0% (0.0%)
0
0.0% (0.0%)
0
0.0% (0.0%)
0
0.0% (0.0%)
0
0.0% (0.0%)
0
0.0% (0.0%)
0
0.0% (0.0%)
0
21.6% (10.5%)
8
Grade 3 33 0.0% (0.0%)
0
15.2% (2.2%)
5
30.3% (7.7%)
10
15.2% (-17.1%)
5
36.4% (7.3%)
12
3.0% (-0.2%)
1
0.0% (0.0%)
0
0.0% (0.0%)
0
0.0% (0.0%)
0
0.0% (0.0%)
0
0.0% (0.0%)
0
0.0% (0.0%)
0
0.0% (0.0%)
0
0.0% (0.0%)
0
39.4% (7.1%)
13
Grade 4 33 0.0% (0.0%)
0
6.1% (-8.8%)
2
18.2% (-4.0%)
6
3.0% (-4.4%)
1
51.5% (21.9%)
17
18.2% (-7.7%)
6
0.0% (0.0%)
0
0.0% (0.0%)
0
3.0% (3.0%)
1
0.0% (0.0%)
0
0.0% (0.0%)
0
0.0% (0.0%)
0
0.0% (0.0%)
0
0.0% (0.0%)
0
21.2% (-4.7%)
7
Grade 5 28 0.0% (0.0%)
0
7.1% (7.1%)
2
17.9% (5.4%)
5
3.6% (-0.6%)
1
25.0% (-8.3%)
7
21.4% (-3.6%)
6
25.0% (0.0%)
7
0.0% (0.0%)
0
0.0% (0.0%)
0
0.0% (0.0%)
0
0.0% (0.0%)
0
0.0% (0.0%)
0
0.0% (0.0%)
0
0.0% (0.0%)
0
25.0% (0.0%)
7
Grade 6 30 0.0% (0.0%)
0
0.0% (-3.0%)
0
10.0% (0.9%)
3
10.0% (10.0%)
3
23.3% (-10.0%)
7
13.3% (-10.9%)
4
16.7% (4.5%)
5
23.3% (8.2%)
7
0.0% (-3.0%)
0
3.3% (3.3%)
1
0.0% (0.0%)
0
0.0% (0.0%)
0
0.0% (0.0%)
0
0.0% (0.0%)
0
26.7% (8.5%)
8
Grade 7 24 0.0% (0.0%)
0
0.0% (0.0%)
0
4.2% (-19.6%)
1
4.2% (-0.6%)
1
20.8% (11.3%)
5
8.3% (-10.7%)
2
4.2% (4.2%)
1
33.3% (4.8%)
8
20.8% (6.5%)
5
4.2% (4.2%)
1
0.0% (0.0%)
0
0.0% (0.0%)
0
0.0% (0.0%)
0
0.0% (0.0%)
0
25.0% (10.7%)
6
Grade 8 20 0.0% (0.0%)
0
0.0% (0.0%)
0
10.0% (3.1%)
2
5.0% (-1.9%)
1
20.0% (6.2%)
4
5.0% (-5.3%)
1
10.0% (-10.7%)
2
10.0% (6.6%)
2
20.0% (6.2%)
4
20.0% (-4.1%)
4
0.0% (0.0%)
0
0.0% (0.0%)
0
0.0% (0.0%)
0
0.0% (0.0%)
0
20.0% (-4.1%)
4
Grade 9 21 0.0% (0.0%)
0
0.0% (0.0%)
0
4.8% (4.8%)
1
4.8% (4.8%)
1
23.8% (23.8%)
5
9.5% (-15.5%)
2
14.3% (14.3%)
3
0.0% (0.0%)
0
14.3% (14.3%)
3
14.3% (-60.7%)
3
14.3% (14.3%)
3
0.0% (0.0%)
0
0.0% (0.0%)
0
0.0% (0.0%)
0
14.3% (14.3%)
3
Grade 10 10 0.0% (0.0%)
0
0.0% (0.0%)
0
0.0% (0.0%)
0
0.0% (0.0%)
0
0.0% (0.0%)
0
20.0% (20.0%)
2
0.0% (0.0%)
0
20.0% (20.0%)
2
10.0% (-6.7%)
1
10.0% (-23.3%)
1
20.0% (-13.3%)
2
20.0% (3.3%)
2
0.0% (0.0%)
0
0.0% (0.0%)
0
20.0% (3.3%)
2
Office of Equity and Access i-Ready Reading Report D3 10/21/2020Page 5
Note: Blank cells in this report indicate that there were no students in the specific placement category. A percentage of 0.0% reflects a small percentage value between 0.01% and 0.049%. Cells highlighted in blue indicate percentage of students who are on or above grade level in their i-Ready Performance based on i-Ready's Standard View. In 2019-20 grade K was not required to participate in Diagnostic 1.
* Cell Value Key: Current Year Diagnostic 1 % of Test Takers in Placement Level Category (% Change in Placement Category from Prior Year Diagnostic 1 Students)
Current Year Diagnostic 1 Count of Test Takers in Placement Category
i-Ready Diagnostic 1 Standard View Student Group Reports2020-21 Summary*
i-ReadyReadingD3
Pacific Islander
Level6
Level4
Level3
Level2
Level1
LevelK
LevelPreK
Tests Taker CountsGrade Level
i-Ready Performance Grade Level Placement
Level5
Level8
Level7
Level9
Level 10
Level 11
Level12
On Track Total
Grade K 21 57.1% (-42.9%)
12
38.1% (38.1%)
8
4.8% (4.8%)
1
0.0% (0.0%)
0
0.0% (0.0%)
0
0.0% (0.0%)
0
0.0% (0.0%)
0
0.0% (0.0%)
0
0.0% (0.0%)
0
0.0% (0.0%)
0
0.0% (0.0%)
0
0.0% (0.0%)
0
0.0% (0.0%)
0
0.0% (0.0%)
0
42.9% (42.9%)
9
Grade 1 16 6.3% (-13.8%)
1
62.5% (-12.5%)
10
25.0% (20.0%)
4
0.0% (0.0%)
0
6.3% (6.3%)
1
0.0% (0.0%)
0
0.0% (0.0%)
0
0.0% (0.0%)
0
0.0% (0.0%)
0
0.0% (0.0%)
0
0.0% (0.0%)
0
0.0% (0.0%)
0
0.0% (0.0%)
0
0.0% (0.0%)
0
31.3% (26.3%)
5
Grade 2 19 0.0% (0.0%)
0
26.3% (-15.4%)
5
52.6% (11.0%)
10
15.8% (-0.9%)
3
5.3% (5.3%)
1
0.0% (0.0%)
0
0.0% (0.0%)
0
0.0% (0.0%)
0
0.0% (0.0%)
0
0.0% (0.0%)
0
0.0% (0.0%)
0
0.0% (0.0%)
0
0.0% (0.0%)
0
0.0% (0.0%)
0
21.1% (4.4%)
4
Grade 3 14 0.0% (0.0%)
0
21.4% (8.9%)
3
21.4% (8.9%)
3
35.7% (10.7%)
5
14.3% (-35.7%)
2
7.1% (7.1%)
1
0.0% (0.0%)
0
0.0% (0.0%)
0
0.0% (0.0%)
0
0.0% (0.0%)
0
0.0% (0.0%)
0
0.0% (0.0%)
0
0.0% (0.0%)
0
0.0% (0.0%)
0
21.4% (-28.6%)
3
Grade 4 17 0.0% (0.0%)
0
5.9% (-1.3%)
1
5.9% (-29.8%)
1
5.9% (-1.3%)
1
58.8% (16.0%)
10
23.5% (16.4%)
4
0.0% (0.0%)
0
0.0% (0.0%)
0
0.0% (0.0%)
0
0.0% (0.0%)
0
0.0% (0.0%)
0
0.0% (0.0%)
0
0.0% (0.0%)
0
0.0% (0.0%)
0
23.5% (16.4%)
4
Grade 5 15 0.0% (0.0%)
0
20.0% (20.0%)
3
20.0% (12.9%)
3
6.7% (6.7%)
1
20.0% (-5.0%)
3
26.7% (-9.0%)
4
6.7% (-18.3%)
1
0.0% (-7.1%)
0
0.0% (0.0%)
0
0.0% (0.0%)
0
0.0% (0.0%)
0
0.0% (0.0%)
0
0.0% (0.0%)
0
0.0% (0.0%)
0
6.7% (-25.5%)
1
Grade 6 27 0.0% (0.0%)
0
3.7% (-0.6%)
1
7.4% (7.4%)
2
3.7% (3.7%)
1
11.1% (-36.7%)
3
11.1% (-6.3%)
3
33.3% (24.6%)
9
14.8% (-6.9%)
4
11.1% (11.1%)
3
0.0% (0.0%)
0
3.7% (3.7%)
1
0.0% (0.0%)
0
0.0% (0.0%)
0
0.0% (0.0%)
0
29.6% (7.9%)
8
Grade 7 20 0.0% (0.0%)
0
5.0% (5.0%)
1
5.0% (5.0%)
1
5.0% (-1.7%)
1
20.0% (-13.3%)
4
20.0% (13.3%)
4
5.0% (-8.3%)
1
10.0% (-10.0%)
2
30.0% (10.0%)
6
0.0% (0.0%)
0
0.0% (0.0%)
0
0.0% (0.0%)
0
0.0% (0.0%)
0
0.0% (0.0%)
0
30.0% (10.0%)
6
Grade 8 15 0.0% (0.0%)
0
0.0% (0.0%)
0
6.7% (-4.4%)
1
0.0% (0.0%)
0
13.3% (-8.9%)
2
6.7% (6.7%)
1
13.3% (2.2%)
2
0.0% (-11.1%)
0
33.3% (0.0%)
5
26.7% (15.6%)
4
0.0% (0.0%)
0
0.0% (0.0%)
0
0.0% (0.0%)
0
0.0% (0.0%)
0
26.7% (15.6%)
4
Grade 9 9 0.0% (0.0%)
0
0.0% (0.0%)
0
0.0% (0.0%)
0
0.0% (0.0%)
0
11.1% (-28.9%)
1
33.3% (13.3%)
3
11.1% (-8.9%)
1
0.0% (0.0%)
0
0.0% (0.0%)
0
22.2% (2.2%)
2
22.2% (22.2%)
2
0.0% (0.0%)
0
0.0% (0.0%)
0
0.0% (0.0%)
0
22.2% (22.2%)
2
Grade 10 11 0.0% (0.0%)
0
0.0% (0.0%)
0
0.0% (-11.1%)
0
9.1% (9.1%)
1
9.1% (-2.0%)
1
18.2% (-4.0%)
2
0.0% (0.0%)
0
0.0% (0.0%)
0
9.1% (-13.1%)
1
0.0% (-11.1%)
0
27.3% (5.1%)
3
27.3% (27.3%)
3
0.0% (0.0%)
0
0.0% (0.0%)
0
27.3% (27.3%)
3
Office of Equity and Access i-Ready Reading Report D3 10/21/2020Page 6
Note: Blank cells in this report indicate that there were no students in the specific placement category. A percentage of 0.0% reflects a small percentage value between 0.01% and 0.049%. Cells highlighted in blue indicate percentage of students who are on or above grade level in their i-Ready Performance based on i-Ready's Standard View. In 2019-20 grade K was not required to participate in Diagnostic 1.
* Cell Value Key: Current Year Diagnostic 1 % of Test Takers in Placement Level Category (% Change in Placement Category from Prior Year Diagnostic 1 Students)
Current Year Diagnostic 1 Count of Test Takers in Placement Category
i-Ready Diagnostic 1 Standard View Student Group Reports2020-21 Summary*
i-ReadyReadingD3
Two or More Races
Level6
Level4
Level3
Level2
Level1
LevelK
LevelPreK
Tests Taker CountsGrade Level
i-Ready Performance Grade Level Placement
Level5
Level8
Level7
Level9
Level 10
Level 11
Level12
On Track Total
Grade K 210 29.0% (-71.0%)
61
61.9% (61.9%)
130
7.1% (7.1%)
15
0.5% (0.5%)
1
1.4% (1.4%)
3
0.0% (0.0%)
0
0.0% (0.0%)
0
0.0% (0.0%)
0
0.0% (0.0%)
0
0.0% (0.0%)
0
0.0% (0.0%)
0
0.0% (0.0%)
0
0.0% (0.0%)
0
0.0% (0.0%)
0
71.0% (71.0%)
149
Grade 1 206 4.9% (-14.9%)
10
52.9% (-13.6%)
109
38.8% (25.1%)
80
3.4% (3.4%)
7
0.0% (0.0%)
0
0.0% (0.0%)
0
0.0% (0.0%)
0
0.0% (0.0%)
0
0.0% (0.0%)
0
0.0% (0.0%)
0
0.0% (0.0%)
0
0.0% (0.0%)
0
0.0% (0.0%)
0
0.0% (0.0%)
0
42.2% (28.5%)
87
Grade 2 186 0.0% (0.0%)
0
22.6% (-12.7%)
42
39.2% (-4.2%)
73
32.8% (13.2%)
61
5.4% (3.7%)
10
0.0% (0.0%)
0
0.0% (0.0%)
0
0.0% (0.0%)
0
0.0% (0.0%)
0
0.0% (0.0%)
0
0.0% (0.0%)
0
0.0% (0.0%)
0
0.0% (0.0%)
0
0.0% (0.0%)
0
38.2% (17.0%)
71
Grade 3 188 0.0% (0.0%)
0
9.0% (-4.1%)
17
22.3% (-1.7%)
42
21.8% (3.8%)
41
45.2% (1.0%)
85
1.1% (0.5%)
2
0.0% (0.0%)
0
0.5% (0.5%)
1
0.0% (0.0%)
0
0.0% (0.0%)
0
0.0% (0.0%)
0
0.0% (0.0%)
0
0.0% (0.0%)
0
0.0% (0.0%)
0
46.8% (2.0%)
88
Grade 4 181 0.0% (0.0%)
0
8.8% (3.5%)
16
12.7% (-2.0%)
23
11.0% (-0.3%)
20
42.0% (0.0%)
76
25.4% (-1.3%)
46
0.0% (0.0%)
0
0.0% (0.0%)
0
0.0% (0.0%)
0
0.0% (0.0%)
0
0.0% (0.0%)
0
0.0% (0.0%)
0
0.0% (0.0%)
0
0.0% (0.0%)
0
25.4% (-1.3%)
46
Grade 5 153 0.0% (0.0%)
0
5.9% (5.9%)
9
8.5% (0.5%)
13
7.2% (0.6%)
11
24.8% (-0.7%)
38
30.7% (-0.7%)
47
21.6% (-6.2%)
33
1.3% (0.6%)
2
0.0% (0.0%)
0
0.0% (0.0%)
0
0.0% (0.0%)
0
0.0% (0.0%)
0
0.0% (0.0%)
0
0.0% (0.0%)
0
22.9% (-5.6%)
35
Grade 6 141 0.0% (0.0%)
0
1.4% (-0.6%)
2
4.3% (-0.5%)
6
4.3% (1.5%)
6
17.7% (-5.6%)
25
18.4% (3.4%)
26
22.0% (-1.3%)
31
28.4% (1.7%)
40
2.8% (0.8%)
4
0.7% (0.7%)
1
0.0% (0.0%)
0
0.0% (0.0%)
0
0.0% (0.0%)
0
0.0% (0.0%)
0
31.9% (3.1%)
45
Grade 7 125 0.0% (0.0%)
0
2.4% (0.8%)
3
2.4% (0.8%)
3
0.0% (-4.0%)
0
14.4% (-0.9%)
18
15.2% (-0.1%)
19
10.4% (-6.5%)
13
20.8% (-0.2%)
26
31.2% (7.8%)
39
0.8% (0.0%)
1
2.4% (2.4%)
3
0.0% (0.0%)
0
0.0% (0.0%)
0
0.0% (0.0%)
0
34.4% (10.2%)
43
Grade 8 127 0.0% (0.0%)
0
2.4% (2.4%)
3
3.1% (-2.1%)
4
1.6% (0.8%)
2
14.2% (2.1%)
18
12.6% (-0.2%)
16
9.4% (-4.1%)
12
8.7% (0.4%)
11
19.7% (-1.4%)
25
27.6% (1.2%)
35
0.8% (0.8%)
1
0.0% (0.0%)
0
0.0% (0.0%)
0
0.0% (0.0%)
0
28.3% (2.0%)
36
Grade 9 95 0.0% (0.0%)
0
0.0% (-1.9%)
0
0.0% (-7.4%)
0
2.1% (0.3%)
2
12.6% (7.1%)
12
5.3% (-2.1%)
5
3.2% (-9.8%)
3
7.4% (-1.9%)
7
8.4% (-0.8%)
8
33.7% (17.0%)
32
26.3% (0.4%)
25
1.1% (-0.8%)
1
0.0% (0.0%)
0
0.0% (0.0%)
0
27.4% (-0.4%)
26
Grade 10 116 0.0% (0.0%)
0
0.0% (0.0%)
0
2.6% (-0.4%)
3
3.4% (-2.4%)
4
8.6% (-6.1%)
10
12.1% (12.1%)
14
7.8% (-6.9%)
9
5.2% (2.2%)
6
4.3% (4.3%)
5
11.2% (-9.4%)
13
21.6% (-7.9%)
25
22.4% (13.6%)
26
0.9% (0.9%)
1
0.0% (0.0%)
0
23.3% (14.5%)
27
Office of Equity and Access i-Ready Reading Report D3 10/21/2020Page 7
Note: Blank cells in this report indicate that there were no students in the specific placement category. A percentage of 0.0% reflects a small percentage value between 0.01% and 0.049%. Cells highlighted in blue indicate percentage of students who are on or above grade level in their i-Ready Performance based on i-Ready's Standard View. In 2019-20 grade K was not required to participate in Diagnostic 1.
* Cell Value Key: Current Year Diagnostic 1 % of Test Takers in Placement Level Category (% Change in Placement Category from Prior Year Diagnostic 1 Students)
Current Year Diagnostic 1 Count of Test Takers in Placement Category
i-Ready Diagnostic 1 Standard View Student Group Reports2020-21 Summary*
i-ReadyReadingD3
White
Level6
Level4
Level3
Level2
Level1
LevelK
LevelPreK
Tests Taker CountsGrade Level
i-Ready Performance Grade Level Placement
Level5
Level8
Level7
Level9
Level 10
Level 11
Level12
On Track Total
Grade K 287 22.6% (-37.4%)
65
66.6% (26.6%)
191
9.8% (9.8%)
28
1.0% (1.0%)
3
0.0% (0.0%)
0
0.0% (0.0%)
0
0.0% (0.0%)
0
0.0% (0.0%)
0
0.0% (0.0%)
0
0.0% (0.0%)
0
0.0% (0.0%)
0
0.0% (0.0%)
0
0.0% (0.0%)
0
0.0% (0.0%)
0
77.4% (37.4%)
222
Grade 1 398 5.3% (-6.7%)
21
52.3% (-18.7%)
208
39.9% (23.1%)
159
1.3% (1.0%)
5
1.3% (1.3%)
5
0.0% (0.0%)
0
0.0% (0.0%)
0
0.0% (0.0%)
0
0.0% (0.0%)
0
0.0% (0.0%)
0
0.0% (0.0%)
0
0.0% (0.0%)
0
0.0% (0.0%)
0
0.0% (0.0%)
0
42.5% (25.4%)
169
Grade 2 384 0.0% (0.0%)
0
19.3% (-9.9%)
74
37.2% (-6.2%)
143
38.5% (12.0%)
148
4.4% (3.5%)
17
0.5% (0.5%)
2
0.0% (0.0%)
0
0.0% (0.0%)
0
0.0% (0.0%)
0
0.0% (0.0%)
0
0.0% (0.0%)
0
0.0% (0.0%)
0
0.0% (0.0%)
0
0.0% (0.0%)
0
43.5% (16.1%)
167
Grade 3 438 0.0% (0.0%)
0
9.1% (1.0%)
40
19.4% (0.4%)
85
18.3% (-0.5%)
80
49.1% (-4.2%)
215
3.2% (2.3%)
14
0.7% (0.7%)
3
0.2% (0.2%)
1
0.0% (0.0%)
0
0.0% (0.0%)
0
0.0% (0.0%)
0
0.0% (0.0%)
0
0.0% (0.0%)
0
0.0% (0.0%)
0
53.2% (-1.0%)
233
Grade 4 434 0.0% (0.0%)
0
3.7% (-1.9%)
16
10.1% (-0.9%)
44
7.1% (-0.7%)
31
37.8% (1.2%)
164
38.7% (1.4%)
168
1.4% (0.0%)
6
0.5% (0.5%)
2
0.7% (0.5%)
3
0.0% (0.0%)
0
0.0% (0.0%)
0
0.0% (0.0%)
0
0.0% (0.0%)
0
0.0% (0.0%)
0
41.2% (2.4%)
179
Grade 5 437 0.0% (0.0%)
0
3.9% (0.6%)
17
9.2% (2.5%)
40
6.6% (2.4%)
29
16.5% (-7.3%)
72
29.1% (2.6%)
127
31.6% (0.2%)
138
2.1% (-1.0%)
9
0.7% (-0.3%)
3
0.5% (0.2%)
2
0.0% (0.0%)
0
0.0% (0.0%)
0
0.0% (0.0%)
0
0.0% (0.0%)
0
34.8% (-0.8%)
152
Grade 6 421 0.0% (0.0%)
0
2.6% (1.2%)
11
5.0% (0.4%)
21
3.3% (-0.8%)
14
15.2% (1.3%)
64
13.5% (-1.8%)
57
23.3% (-1.2%)
98
32.8% (1.0%)
138
2.4% (-0.6%)
10
1.2% (-0.2%)
5
0.7% (0.5%)
3
0.0% (0.0%)
0
0.0% (0.0%)
0
0.0% (0.0%)
0
37.1% (0.8%)
156
Grade 7 369 0.0% (0.0%)
0
1.6% (0.8%)
6
4.1% (0.4%)
15
3.8% (2.1%)
14
11.1% (-1.1%)
41
10.3% (-3.4%)
38
5.4% (-1.8%)
20
17.9% (-0.2%)
66
40.9% (3.6%)
151
3.3% (-0.4%)
12
1.4% (-0.3%)
5
0.3% (0.3%)
1
0.0% (0.0%)
0
0.0% (0.0%)
0
45.8% (3.2%)
169
Grade 8 334 0.0% (0.0%)
0
1.2% (-0.5%)
4
3.9% (1.2%)
13
2.7% (1.0%)
9
7.8% (-2.4%)
26
8.7% (-1.3%)
29
9.6% (5.4%)
32
6.6% (-1.4%)
22
17.7% (0.9%)
59
38.0% (-4.3%)
127
2.4% (0.4%)
8
1.5% (1.3%)
5
0.0% (-0.2%)
0
0.0% (0.0%)
0
41.9% (-2.9%)
140
Grade 9 332 0.0% (0.0%)
0
0.3% (-0.4%)
1
3.3% (0.4%)
11
0.9% (-0.9%)
3
3.6% (-4.4%)
12
6.9% (-3.2%)
23
5.7% (0.7%)
19
5.1% (-1.4%)
17
4.2% (-1.6%)
14
25.6% (-1.2%)
85
40.7% (10.2%)
135
2.7% (1.6%)
9
0.0% (0.0%)
0
0.9% (0.2%)
3
44.3% (12.0%)
147
Grade 10 364 0.0% (0.0%)
0
0.0% (0.0%)
0
2.7% (0.3%)
10
0.8% (-0.4%)
3
7.4% (1.8%)
27
7.4% (1.0%)
27
4.4% (-2.8%)
16
4.9% (-1.5%)
18
5.8% (1.0%)
21
9.3% (-7.5%)
34
15.9% (-2.1%)
58
37.9% (7.9%)
138
0.8% (0.4%)
3
2.5% (1.7%)
9
41.2% (10.0%)
150
Office of Equity and Access i-Ready Reading Report D3 10/21/2020Page 8
Note: Blank cells in this report indicate that there were no students in the specific placement category. A percentage of 0.0% reflects a small percentage value between 0.01% and 0.049%. Cells highlighted in blue indicate percentage of students who are on or above grade level in their i-Ready Performance based on i-Ready's Standard View. In 2019-20 grade K was not required to participate in Diagnostic 1.
* Cell Value Key: Current Year Diagnostic 1 % of Test Takers in Placement Level Category (% Change in Placement Category from Prior Year Diagnostic 1 Students)
Current Year Diagnostic 1 Count of Test Takers in Placement Category
i-Ready Diagnostic 1 Standard View Student Group Reports2020-21 Summary*
i-ReadyReadingD3
English Learners
Level6
Level4
Level3
Level2
Level1
LevelK
LevelPreK
Tests Taker CountsGrade Level
i-Ready Performance Grade Level Placement
Level5
Level8
Level7
Level9
Level 10
Level 11
Level12
On Track Total
Grade K 583 36.9% (-54.0%)
215
55.1% (46.0%)
321
7.4% (7.4%)
43
0.7% (0.7%)
4
0.0% (0.0%)
0
0.0% (0.0%)
0
0.0% (0.0%)
0
0.0% (0.0%)
0
0.0% (0.0%)
0
0.0% (0.0%)
0
0.0% (0.0%)
0
0.0% (0.0%)
0
0.0% (0.0%)
0
0.0% (0.0%)
0
63.1% (54.0%)
368
Grade 1 1,016 11.3% (-16.2%)
115
63.4% (-4.4%)
644
24.1% (19.4%)
245
0.7% (0.7%)
7
0.5% (0.5%)
5
0.0% (0.0%)
0
0.0% (0.0%)
0
0.0% (0.0%)
0
0.0% (0.0%)
0
0.0% (0.0%)
0
0.0% (0.0%)
0
0.0% (0.0%)
0
0.0% (0.0%)
0
0.0% (0.0%)
0
25.3% (20.6%)
257
Grade 2 1,188 0.0% (0.0%)
0
43.7% (-12.0%)
519
42.3% (1.7%)
503
13.4% (9.8%)
159
0.6% (0.6%)
7
0.0% (0.0%)
0
0.0% (0.0%)
0
0.0% (0.0%)
0
0.0% (0.0%)
0
0.0% (0.0%)
0
0.0% (0.0%)
0
0.0% (0.0%)
0
0.0% (0.0%)
0
0.0% (0.0%)
0
14.0% (10.4%)
166
Grade 3 1,214 0.0% (0.0%)
0
22.8% (-3.3%)
277
38.0% (-4.4%)
461
23.0% (-0.7%)
279
15.8% (8.0%)
192
0.2% (0.2%)
3
0.2% (0.2%)
2
0.0% (0.0%)
0
0.0% (0.0%)
0
0.0% (0.0%)
0
0.0% (0.0%)
0
0.0% (0.0%)
0
0.0% (0.0%)
0
0.0% (0.0%)
0
16.2% (8.4%)
197
Grade 4 1,064 0.0% (0.0%)
0
18.3% (3.4%)
195
30.5% (-7.2%)
324
17.9% (-0.4%)
190
30.5% (2.1%)
324
2.9% (2.1%)
31
0.0% (0.0%)
0
0.0% (0.0%)
0
0.0% (0.0%)
0
0.0% (0.0%)
0
0.0% (0.0%)
0
0.0% (0.0%)
0
0.0% (0.0%)
0
0.0% (0.0%)
0
2.9% (2.1%)
31
Grade 5 978 0.0% (0.0%)
0
12.1% (5.9%)
118
26.2% (7.0%)
256
18.7% (3.1%)
183
32.0% (-8.3%)
313
9.1% (-7.8%)
89
1.9% (0.1%)
19
0.0% (-0.1%)
0
0.0% (0.0%)
0
0.0% (0.0%)
0
0.0% (0.0%)
0
0.0% (0.0%)
0
0.0% (0.0%)
0
0.0% (0.0%)
0
1.9% (0.1%)
19
Grade 6 1,059 0.0% (0.0%)
0
7.5% (2.6%)
79
16.6% (3.7%)
176
13.7% (0.6%)
145
36.8% (-6.0%)
390
14.4% (-2.8%)
152
8.7% (0.9%)
92
2.4% (1.1%)
25
0.0% (0.0%)
0
0.0% (0.0%)
0
0.0% (0.0%)
0
0.0% (0.0%)
0
0.0% (0.0%)
0
0.0% (0.0%)
0
2.4% (1.1%)
25
Grade 7 762 0.0% (0.0%)
0
5.0% (1.7%)
38
16.4% (-0.5%)
125
9.4% (-0.6%)
72
31.1% (-10.0%)
237
15.4% (-2.9%)
117
10.4% (4.1%)
79
7.7% (4.4%)
59
4.6% (3.7%)
35
0.0% (0.0%)
0
0.0% (0.0%)
0
0.0% (0.0%)
0
0.0% (0.0%)
0
0.0% (0.0%)
0
4.6% (3.7%)
35
Grade 8 655 0.0% (0.0%)
0
5.3% (-0.9%)
35
16.5% (2.1%)
108
10.1% (-0.5%)
66
30.5% (-6.0%)
200
16.3% (-0.5%)
107
8.5% (-0.2%)
56
3.7% (0.5%)
24
5.0% (2.2%)
33
4.0% (3.4%)
26
0.0% (0.0%)
0
0.0% (0.0%)
0
0.0% (0.0%)
0
0.0% (0.0%)
0
4.0% (3.4%)
26
Grade 9 379 0.0% (0.0%)
0
5.8% (2.6%)
22
7.9% (-8.7%)
30
7.7% (-6.2%)
29
30.3% (-4.7%)
115
19.0% (4.7%)
72
9.5% (0.3%)
36
5.3% (1.6%)
20
4.7% (3.4%)
18
8.4% (5.7%)
32
1.3% (1.3%)
5
0.0% (0.0%)
0
0.0% (0.0%)
0
0.0% (0.0%)
0
1.3% (1.3%)
5
Grade 10 413 0.0% (0.0%)
0
3.6% (1.3%)
15
8.7% (-9.1%)
36
9.0% (-1.1%)
37
28.3% (-0.4%)
117
17.9% (1.6%)
74
9.2% (-7.9%)
38
7.3% (4.2%)
30
3.6% (1.3%)
15
7.0% (7.0%)
29
4.1% (1.8%)
17
1.2% (1.2%)
5
0.0% (0.0%)
0
0.0% (0.0%)
0
1.2% (1.2%)
5
Office of Equity and Access i-Ready Reading Report D3 10/21/2020Page 9
Note: Blank cells in this report indicate that there were no students in the specific placement category. A percentage of 0.0% reflects a small percentage value between 0.01% and 0.049%. Cells highlighted in blue indicate percentage of students who are on or above grade level in their i-Ready Performance based on i-Ready's Standard View. In 2019-20 grade K was not required to participate in Diagnostic 1.
* Cell Value Key: Current Year Diagnostic 1 % of Test Takers in Placement Level Category (% Change in Placement Category from Prior Year Diagnostic 1 Students)
Current Year Diagnostic 1 Count of Test Takers in Placement Category
i-Ready Diagnostic 1 Standard View Student Group Reports2020-21 Summary*
i-ReadyReadingD3
Foster Youth
Level6
Level4
Level3
Level2
Level1
LevelK
LevelPreK
Tests Taker CountsGrade Level
i-Ready Performance Grade Level Placement
Level5
Level8
Level7
Level9
Level 10
Level 11
Level12
On Track Total
Grade K 21 33.3% (-66.7%)
7
57.1% (57.1%)
12
9.5% (9.5%)
2
0.0% (0.0%)
0
0.0% (0.0%)
0
0.0% (0.0%)
0
0.0% (0.0%)
0
0.0% (0.0%)
0
0.0% (0.0%)
0
0.0% (0.0%)
0
0.0% (0.0%)
0
0.0% (0.0%)
0
0.0% (0.0%)
0
0.0% (0.0%)
0
66.7% (66.7%)
14
Grade 1 24 12.5% (-15.6%)
3
70.8% (3.6%)
17
8.3% (3.6%)
2
4.2% (4.2%)
1
4.2% (4.2%)
1
0.0% (0.0%)
0
0.0% (0.0%)
0
0.0% (0.0%)
0
0.0% (0.0%)
0
0.0% (0.0%)
0
0.0% (0.0%)
0
0.0% (0.0%)
0
0.0% (0.0%)
0
0.0% (0.0%)
0
16.7% (12.0%)
4
Grade 2 31 0.0% (0.0%)
0
51.6% (-6.1%)
16
41.9% (5.3%)
13
6.5% (0.8%)
2
0.0% (0.0%)
0
0.0% (0.0%)
0
0.0% (0.0%)
0
0.0% (0.0%)
0
0.0% (0.0%)
0
0.0% (0.0%)
0
0.0% (0.0%)
0
0.0% (0.0%)
0
0.0% (0.0%)
0
0.0% (0.0%)
0
6.5% (0.8%)
2
Grade 3 29 0.0% (0.0%)
0
20.7% (-1.2%)
6
31.0% (-12.7%)
9
31.0% (18.5%)
9
13.8% (-8.1%)
4
0.0% (0.0%)
0
3.4% (3.4%)
1
0.0% (0.0%)
0
0.0% (0.0%)
0
0.0% (0.0%)
0
0.0% (0.0%)
0
0.0% (0.0%)
0
0.0% (0.0%)
0
0.0% (0.0%)
0
17.2% (-4.6%)
5
Grade 4 35 0.0% (0.0%)
0
25.7% (15.7%)
9
22.9% (-7.1%)
8
14.3% (0.0%)
5
31.4% (-2.9%)
11
5.7% (-5.7%)
2
0.0% (0.0%)
0
0.0% (0.0%)
0
0.0% (0.0%)
0
0.0% (0.0%)
0
0.0% (0.0%)
0
0.0% (0.0%)
0
0.0% (0.0%)
0
0.0% (0.0%)
0
5.7% (-5.7%)
2
Grade 5 35 0.0% (0.0%)
0
8.6% (7.1%)
3
28.6% (1.3%)
10
5.7% (-4.9%)
2
20.0% (-5.8%)
7
25.7% (7.5%)
9
11.4% (-5.2%)
4
0.0% (0.0%)
0
0.0% (0.0%)
0
0.0% (0.0%)
0
0.0% (0.0%)
0
0.0% (0.0%)
0
0.0% (0.0%)
0
0.0% (0.0%)
0
11.4% (-5.2%)
4
Grade 6 26 0.0% (0.0%)
0
15.4% (7.6%)
4
15.4% (-0.2%)
4
15.4% (7.6%)
4
38.5% (-0.6%)
10
0.0% (-9.4%)
0
3.8% (-7.1%)
1
11.5% (3.7%)
3
0.0% (-1.6%)
0
0.0% (0.0%)
0
0.0% (0.0%)
0
0.0% (0.0%)
0
0.0% (0.0%)
0
0.0% (0.0%)
0
11.5% (2.2%)
3
Grade 7 24 0.0% (0.0%)
0
0.0% (-8.2%)
0
20.8% (8.6%)
5
8.3% (2.2%)
2
33.3% (12.9%)
8
0.0% (-22.4%)
0
16.7% (8.5%)
4
16.7% (4.4%)
4
4.2% (-6.0%)
1
0.0% (0.0%)
0
0.0% (0.0%)
0
0.0% (0.0%)
0
0.0% (0.0%)
0
0.0% (0.0%)
0
4.2% (-6.0%)
1
Grade 8 37 0.0% (0.0%)
0
8.1% (8.1%)
3
13.5% (-1.5%)
5
5.4% (0.4%)
2
18.9% (-6.1%)
7
18.9% (11.4%)
7
5.4% (0.4%)
2
2.7% (-2.3%)
1
18.9% (-1.1%)
7
8.1% (-9.4%)
3
0.0% (0.0%)
0
0.0% (0.0%)
0
0.0% (0.0%)
0
0.0% (0.0%)
0
8.1% (-9.4%)
3
Grade 9 28 0.0% (0.0%)
0
0.0% (0.0%)
0
14.3% (14.3%)
4
3.6% (-2.7%)
1
17.9% (-7.1%)
5
7.1% (-17.9%)
2
7.1% (-5.4%)
2
7.1% (-5.4%)
2
10.7% (10.7%)
3
14.3% (8.0%)
4
17.9% (5.4%)
5
0.0% (0.0%)
0
0.0% (0.0%)
0
0.0% (0.0%)
0
17.9% (5.4%)
5
Grade 10 34 0.0% (0.0%)
0
8.8% (8.8%)
3
2.9% (-4.2%)
1
5.9% (5.9%)
2
14.7% (-21.0%)
5
5.9% (-1.3%)
2
20.6% (6.3%)
7
11.8% (11.8%)
4
8.8% (1.7%)
3
5.9% (-1.3%)
2
8.8% (-5.5%)
3
5.9% (-1.3%)
2
0.0% (0.0%)
0
0.0% (0.0%)
0
5.9% (-1.3%)
2
Office of Equity and Access i-Ready Reading Report D3 10/21/2020Page 10
Note: Blank cells in this report indicate that there were no students in the specific placement category. A percentage of 0.0% reflects a small percentage value between 0.01% and 0.049%. Cells highlighted in blue indicate percentage of students who are on or above grade level in their i-Ready Performance based on i-Ready's Standard View. In 2019-20 grade K was not required to participate in Diagnostic 1.
* Cell Value Key: Current Year Diagnostic 1 % of Test Takers in Placement Level Category (% Change in Placement Category from Prior Year Diagnostic 1 Students)
Current Year Diagnostic 1 Count of Test Takers in Placement Category
i-Ready Diagnostic 1 Standard View Student Group Reports2020-21 Summary*
i-ReadyReadingD3
Homeless
Level6
Level4
Level3
Level2
Level1
LevelK
LevelPreK
Tests Taker CountsGrade Level
i-Ready Performance Grade Level Placement
Level5
Level8
Level7
Level9
Level 10
Level 11
Level12
On Track Total
Grade K 10 40.0% (-60.0%)
4
60.0% (60.0%)
6
0.0% (0.0%)
0
0.0% (0.0%)
0
0.0% (0.0%)
0
0.0% (0.0%)
0
0.0% (0.0%)
0
0.0% (0.0%)
0
0.0% (0.0%)
0
0.0% (0.0%)
0
0.0% (0.0%)
0
0.0% (0.0%)
0
0.0% (0.0%)
0
0.0% (0.0%)
0
60.0% (60.0%)
6
Grade 1 8 25.0% (-17.9%)
2
50.0% (-7.1%)
4
25.0% (25.0%)
2
0.0% (0.0%)
0
0.0% (0.0%)
0
0.0% (0.0%)
0
0.0% (0.0%)
0
0.0% (0.0%)
0
0.0% (0.0%)
0
0.0% (0.0%)
0
0.0% (0.0%)
0
0.0% (0.0%)
0
0.0% (0.0%)
0
0.0% (0.0%)
0
25.0% (25.0%)
2
Grade 2 10 0.0% (0.0%)
0
20.0% (-58.9%)
2
60.0% (38.9%)
6
20.0% (20.0%)
2
0.0% (0.0%)
0
0.0% (0.0%)
0
0.0% (0.0%)
0
0.0% (0.0%)
0
0.0% (0.0%)
0
0.0% (0.0%)
0
0.0% (0.0%)
0
0.0% (0.0%)
0
0.0% (0.0%)
0
0.0% (0.0%)
0
20.0% (20.0%)
2
Grade 3 6 0.0% (0.0%)
0
0.0% (-15.4%)
0
66.7% (20.5%)
4
16.7% (-21.8%)
1
16.7% (16.7%)
1
0.0% (0.0%)
0
0.0% (0.0%)
0
0.0% (0.0%)
0
0.0% (0.0%)
0
0.0% (0.0%)
0
0.0% (0.0%)
0
0.0% (0.0%)
0
0.0% (0.0%)
0
0.0% (0.0%)
0
16.7% (16.7%)
1
Grade 4 8 0.0% (0.0%)
0
12.5% (-9.7%)
1
37.5% (15.3%)
3
12.5% (1.4%)
1
12.5% (-26.4%)
1
12.5% (6.9%)
1
12.5% (12.5%)
1
0.0% (0.0%)
0
0.0% (0.0%)
0
0.0% (0.0%)
0
0.0% (0.0%)
0
0.0% (0.0%)
0
0.0% (0.0%)
0
0.0% (0.0%)
0
25.0% (19.4%)
2
Grade 5 7 0.0% (0.0%)
0
14.3% (2.5%)
1
0.0% (-35.3%)
0
28.6% (16.8%)
2
28.6% (-0.8%)
2
14.3% (8.4%)
1
14.3% (8.4%)
1
0.0% (0.0%)
0
0.0% (0.0%)
0
0.0% (0.0%)
0
0.0% (0.0%)
0
0.0% (0.0%)
0
0.0% (0.0%)
0
0.0% (0.0%)
0
14.3% (8.4%)
1
Grade 6 12 0.0% (0.0%)
0
8.3% (2.8%)
1
0.0% (-11.1%)
0
8.3% (-8.3%)
1
16.7% (-11.1%)
2
25.0% (13.9%)
3
25.0% (8.3%)
3
16.7% (5.6%)
2
0.0% (0.0%)
0
0.0% (0.0%)
0
0.0% (0.0%)
0
0.0% (0.0%)
0
0.0% (0.0%)
0
0.0% (0.0%)
0
16.7% (5.6%)
2
Grade 7 4 0.0% (0.0%)
0
0.0% (-5.3%)
0
0.0% (-21.1%)
0
0.0% (0.0%)
0
0.0% (-21.1%)
0
25.0% (19.7%)
1
0.0% (-10.5%)
0
50.0% (28.9%)
2
25.0% (9.2%)
1
0.0% (0.0%)
0
0.0% (0.0%)
0
0.0% (0.0%)
0
0.0% (0.0%)
0
0.0% (0.0%)
0
25.0% (9.2%)
1
Grade 8 7 0.0% (0.0%)
0
0.0% (0.0%)
0
0.0% (-7.1%)
0
14.3% (7.1%)
1
0.0% (-50.0%)
0
14.3% (0.0%)
1
0.0% (-7.1%)
0
0.0% (0.0%)
0
28.6% (28.6%)
2
42.9% (28.6%)
3
0.0% (0.0%)
0
0.0% (0.0%)
0
0.0% (0.0%)
0
0.0% (0.0%)
0
42.9% (28.6%)
3
Grade 9 2 0.0% (0.0%)
0
0.0% (0.0%)
0
0.0% (0.0%)
0
0.0% (0.0%)
0
0.0% (-33.3%)
0
0.0% (0.0%)
0
0.0% (-33.3%)
0
0.0% (0.0%)
0
50.0% (50.0%)
1
0.0% (-33.3%)
0
50.0% (50.0%)
1
0.0% (0.0%)
0
0.0% (0.0%)
0
0.0% (0.0%)
0
50.0% (50.0%)
1
Grade 10 9 0.0% (0.0%)
0
0.0% (0.0%)
0
0.0% (0.0%)
0
0.0% (0.0%)
0
22.2% (-11.1%)
2
11.1% (-22.2%)
1
11.1% (11.1%)
1
33.3% (33.3%)
3
0.0% (0.0%)
0
11.1% (11.1%)
1
11.1% (-22.2%)
1
0.0% (0.0%)
0
0.0% (0.0%)
0
0.0% (0.0%)
0
0.0% (0.0%)
0
Office of Equity and Access i-Ready Reading Report D3 10/21/2020Page 11
Note: Blank cells in this report indicate that there were no students in the specific placement category. A percentage of 0.0% reflects a small percentage value between 0.01% and 0.049%. Cells highlighted in blue indicate percentage of students who are on or above grade level in their i-Ready Performance based on i-Ready's Standard View. In 2019-20 grade K was not required to participate in Diagnostic 1.
* Cell Value Key: Current Year Diagnostic 1 % of Test Takers in Placement Level Category (% Change in Placement Category from Prior Year Diagnostic 1 Students)
Current Year Diagnostic 1 Count of Test Takers in Placement Category
i-Ready Diagnostic 1 Standard View Student Group Reports2020-21 Summary*
i-ReadyReadingD3
Socioeconomically Disadvantaged
Level6
Level4
Level3
Level2
Level1
LevelK
LevelPreK
Tests Taker CountsGrade Level
i-Ready Performance Grade Level Placement
Level5
Level8
Level7
Level9
Level 10
Level 11
Level12
On Track Total
Grade K 2,642 35.9% (-54.1%)
948
55.9% (45.9%)
1476
6.9% (6.9%)
182
0.9% (0.9%)
25
0.4% (0.4%)
11
0.0% (0.0%)
0
0.0% (0.0%)
0
0.0% (0.0%)
0
0.0% (0.0%)
0
0.0% (0.0%)
0
0.0% (0.0%)
0
0.0% (0.0%)
0
0.0% (0.0%)
0
0.0% (0.0%)
0
64.1% (54.1%)
1694
Grade 1 3,876 8.6% (-15.9%)
334
60.3% (-9.5%)
2336
28.3% (22.6%)
1097
1.9% (1.9%)
74
0.9% (0.9%)
33
0.1% (0.1%)
2
0.0% (0.0%)
0
0.0% (0.0%)
0
0.0% (0.0%)
0
0.0% (0.0%)
0
0.0% (0.0%)
0
0.0% (0.0%)
0
0.0% (0.0%)
0
0.0% (0.0%)
0
31.1% (25.4%)
1206
Grade 2 4,106 0.0% (0.0%)
0
33.6% (-7.8%)
1379
41.5% (-5.1%)
1705
22.5% (10.7%)
925
2.1% (2.0%)
86
0.2% (0.2%)
9
0.0% (0.0%)
2
0.0% (0.0%)
0
0.0% (0.0%)
0
0.0% (0.0%)
0
0.0% (0.0%)
0
0.0% (0.0%)
0
0.0% (0.0%)
0
0.0% (0.0%)
0
24.9% (12.9%)
1022
Grade 3 4,137 0.0% (0.0%)
0
15.3% (-0.7%)
631
29.5% (0.0%)1221
22.4% (-1.6%)
925
31.8% (1.4%)1315
0.9% (0.7%)
38
0.1% (0.1%)
5
0.0% (0.0%)
2
0.0% (0.0%)
0
0.0% (0.0%)
0
0.0% (0.0%)
0
0.0% (0.0%)
0
0.0% (0.0%)
0
0.0% (0.0%)
0
32.9% (2.3%)1360
Grade 4 4,294 0.0% (0.0%)
0
9.4% (1.9%)
403
19.0% (-1.4%)
818
12.9% (0.3%)
554
40.7% (-2.8%)
1748
17.5% (1.6%)
750
0.3% (0.2%)
13
0.1% (0.1%)
5
0.1% (0.0%)
3
0.0% (0.0%)
0
0.0% (0.0%)
0
0.0% (0.0%)
0
0.0% (0.0%)
0
0.0% (0.0%)
0
18.0% (2.0%)
771
Grade 5 4,416 0.0% (0.0%)
0
5.6% (1.7%)
248
14.1% (1.7%)
623
11.3% (1.9%)
501
29.6% (-2.5%)
1307
24.1% (-3.8%)
1063
14.7% (1.0%)
650
0.4% (0.1%)
19
0.1% (-0.1%)
3
0.0% (0.0%)
2
0.0% (0.0%)
0
0.0% (0.0%)
0
0.0% (0.0%)
0
0.0% (0.0%)
0
15.3% (1.1%)
674
Grade 6 4,074 0.0% (0.0%)
0
3.5% (1.0%)
143
9.5% (2.4%)
389
7.4% (0.7%)
303
25.7% (-2.5%)
1045
16.8% (-2.1%)
684
20.4% (-1.1%)
830
15.7% (1.3%)
641
0.7% (0.2%)
29
0.2% (0.0%)
7
0.1% (0.1%)
3
0.0% (0.0%)
0
0.0% (0.0%)
0
0.0% (0.0%)
0
16.7% (1.5%)
680
Grade 7 3,261 0.0% (0.0%)
0
2.0% (0.4%)
65
7.0% (-0.5%)
228
4.9% (-0.4%)
161
20.0% (-2.6%)
652
13.6% (-3.9%)
444
12.0% (-0.1%)
392
17.8% (2.7%)
581
21.8% (4.0%)
712
0.7% (0.3%)
22
0.1% (0.0%)
4
0.0% (0.0%)
0
0.0% (0.0%)
0
0.0% (0.0%)
0
22.6% (4.4%)
738
Grade 8 3,051 0.0% (0.0%)
0
2.2% (0.5%)
68
6.9% (1.3%)
209
5.2% (0.6%)
158
18.8% (-0.7%)
574
12.7% (-1.6%)
388
10.5% (-2.4%)
321
6.4% (-1.4%)
194
15.9% (0.4%)
484
21.0% (3.1%)
642
0.4% (0.2%)
11
0.1% (0.0%)
2
0.0% (0.0%)
0
0.0% (0.0%)
0
21.5% (3.3%)
655
Grade 9 2,375 0.0% (0.0%)
0
1.3% (0.1%)
31
3.1% (-1.4%)
73
2.5% (-1.5%)
59
13.2% (-2.2%)
313
10.7% (-5.5%)
254
9.4% (-2.1%)
223
6.9% (-1.2%)
163
7.4% (0.3%)
176
24.4% (3.1%)
579
20.4% (9.5%)
484
0.8% (0.7%)
18
0.0% (0.0%)
1
0.0% (0.0%)
1
21.2% (10.3%)
504
Grade 10 2,486 0.0% (0.0%)
0
0.9% (0.3%)
23
2.8% (-1.0%)
70
3.0% (0.4%)
74
11.5% (-1.8%)
286
11.6% (0.6%)
288
9.4% (-2.8%)
233
7.1% (-1.1%)
176
7.6% (1.0%)
190
13.9% (-1.6%)
346
16.8% (0.7%)
417
15.4% (5.6%)
382
0.0% (-0.1%)
0
0.0% (-0.1%)
1
15.4% (5.4%)
383
Office of Equity and Access i-Ready Reading Report D3 10/21/2020Page 12
Note: Blank cells in this report indicate that there were no students in the specific placement category. A percentage of 0.0% reflects a small percentage value between 0.01% and 0.049%. Cells highlighted in blue indicate percentage of students who are on or above grade level in their i-Ready Performance based on i-Ready's Standard View. In 2019-20 grade K was not required to participate in Diagnostic 1.
* Cell Value Key: Current Year Diagnostic 1 % of Test Takers in Placement Level Category (% Change in Placement Category from Prior Year Diagnostic 1 Students)
Current Year Diagnostic 1 Count of Test Takers in Placement Category
i-Ready Diagnostic 1 Standard View Student Group Reports2020-21 Summary*
i-ReadyReadingD3
Students with Disabilities
Level6
Level4
Level3
Level2
Level1
LevelK
LevelPreK
Tests Taker CountsGrade Level
i-Ready Performance Grade Level Placement
Level5
Level8
Level7
Level9
Level 10
Level 11
Level12
On Track Total
Grade K 257 43.2% (-50.1%)
111
51.8% (45.1%)
133
3.9% (3.9%)
10
1.2% (1.2%)
3
0.0% (0.0%)
0
0.0% (0.0%)
0
0.0% (0.0%)
0
0.0% (0.0%)
0
0.0% (0.0%)
0
0.0% (0.0%)
0
0.0% (0.0%)
0
0.0% (0.0%)
0
0.0% (0.0%)
0
0.0% (0.0%)
0
56.8% (50.1%)
146
Grade 1 410 18.5% (-30.4%)
76
55.4% (6.2%)
227
25.1% (23.1%)
103
0.5% (0.5%)
2
0.5% (0.5%)
2
0.0% (0.0%)
0
0.0% (0.0%)
0
0.0% (0.0%)
0
0.0% (0.0%)
0
0.0% (0.0%)
0
0.0% (0.0%)
0
0.0% (0.0%)
0
0.0% (0.0%)
0
0.0% (0.0%)
0
26.1% (24.1%)
107
Grade 2 468 0.0% (0.0%)
0
51.5% (-20.8%)
241
32.9% (8.5%)
154
14.3% (11.1%)
67
1.1% (1.1%)
5
0.2% (0.2%)
1
0.0% (0.0%)
0
0.0% (0.0%)
0
0.0% (0.0%)
0
0.0% (0.0%)
0
0.0% (0.0%)
0
0.0% (0.0%)
0
0.0% (0.0%)
0
0.0% (0.0%)
0
15.6% (12.4%)
73
Grade 3 531 0.0% (0.0%)
0
37.7% (-14.0%)
200
26.9% (1.6%)
143
15.8% (4.1%)
84
18.3% (7.2%)
97
1.3% (1.2%)
7
0.0% (0.0%)
0
0.0% (0.0%)
0
0.0% (0.0%)
0
0.0% (0.0%)
0
0.0% (0.0%)
0
0.0% (0.0%)
0
0.0% (0.0%)
0
0.0% (0.0%)
0
19.6% (8.3%)
104
Grade 4 645 0.0% (0.0%)
0
30.2% (-4.4%)
195
27.3% (-10.2%)
176
9.5% (-0.5%)
61
22.8% (8.6%)
147
9.8% (6.0%)
63
0.2% (0.2%)
1
0.3% (0.3%)
2
0.0% (0.0%)
0
0.0% (0.0%)
0
0.0% (0.0%)
0
0.0% (0.0%)
0
0.0% (0.0%)
0
0.0% (0.0%)
0
10.2% (6.5%)
66
Grade 5 665 0.0% (0.0%)
0
24.8% (4.7%)
165
32.9% (-0.8%)
219
14.0% (0.3%)
93
16.5% (-2.5%)
110
7.7% (-0.9%)
51
3.9% (-0.5%)
26
0.2% (0.0%)
1
0.0% (-0.2%)
0
0.0% (-0.2%)
0
0.0% (0.0%)
0
0.0% (0.0%)
0
0.0% (0.0%)
0
0.0% (0.0%)
0
4.1% (-0.9%)
27
Grade 6 624 0.0% (0.0%)
0
14.4% (1.1%)
90
27.1% (0.6%)
169
11.2% (-2.9%)
70
23.6% (-5.6%)
147
9.8% (2.6%)
61
6.3% (0.5%)
39
7.1% (3.4%)
44
0.5% (0.0%)
3
0.0% (0.0%)
0
0.2% (0.2%)
1
0.0% (0.0%)
0
0.0% (0.0%)
0
0.0% (0.0%)
0
7.7% (3.6%)
48
Grade 7 490 0.0% (0.0%)
0
8.6% (2.0%)
42
25.3% (-2.2%)
124
13.7% (0.8%)
67
26.3% (-5.3%)
129
8.8% (-1.7%)
43
4.9% (1.2%)
24
5.5% (2.0%)
27
6.7% (3.2%)
33
0.2% (0.2%)
1
0.0% (0.0%)
0
0.0% (0.0%)
0
0.0% (0.0%)
0
0.0% (0.0%)
0
6.9% (3.4%)
34
Grade 8 468 0.0% (0.0%)
0
8.3% (0.1%)
39
24.1% (-1.1%)
113
11.5% (-2.6%)
54
28.8% (3.0%)
135
10.7% (-0.6%)
50
6.2% (0.8%)
29
2.6% (0.2%)
12
3.4% (-0.5%)
16
4.3% (0.8%)
20
0.0% (0.0%)
0
0.0% (0.0%)
0
0.0% (0.0%)
0
0.0% (0.0%)
0
4.3% (0.8%)
20
Grade 9 321 0.0% (0.0%)
0
5.6% (-1.0%)
18
17.8% (-2.6%)
57
10.0% (-2.4%)
32
26.2% (-0.4%)
84
10.3% (-3.0%)
33
6.9% (-2.2%)
22
3.4% (1.1%)
11
4.4% (0.6%)
14
12.1% (8.8%)
39
3.4% (1.1%)
11
0.0% (0.0%)
0
0.0% (0.0%)
0
0.0% (0.0%)
0
3.4% (1.1%)
11
Grade 10 312 0.0% (0.0%)
0
4.5% (1.7%)
14
15.7% (-5.5%)
49
9.9% (-1.7%)
31
33.0% (6.3%)
103
12.8% (1.2%)
40
6.7% (-3.5%)
21
3.2% (1.2%)
10
2.6% (-0.9%)
8
4.2% (-2.0%)
13
3.2% (0.5%)
10
4.2% (2.8%)
13
0.0% (0.0%)
0
0.0% (0.0%)
0
4.2% (2.8%)
13
Office of Equity and Access i-Ready Reading Report D3 10/21/2020Page 13
Note: Blank cells in this report indicate that there were no students in the specific placement category. A percentage of 0.0% reflects a small percentage value between 0.01% and 0.049%. Cells highlighted in blue indicate percentage of students who are on or above grade level in their i-Ready Performance based on i-Ready's Standard View. In 2019-20 grade K was not required to participate in Diagnostic 1.
* Cell Value Key: Current Year Diagnostic 1 % of Test Takers in Placement Level Category (% Change in Placement Category from Prior Year Diagnostic 1 Students)
Current Year Diagnostic 1 Count of Test Takers in Placement Category
i-Ready Diagnostic 1 Standard View Grade Level Report2020-21 Summary*
i-ReadyMathD2
On Track Total
Level12
Level 11
Level 10
Level9
Level7
Level8
Level5
i-Ready Performance Grade Level Placement
Grade LevelTests Taker
Counts LevelPreK
LevelK
Level1
Level2
Level3
Level4
Level6
Math: Overall
Grade K 3,769 46.0% (-47.8%)
1733
52.4% (46.2%)
1975
1.6% (1.6%)
61
0.0% (0.0%)
0
0.0% (0.0%)
0
0.0% (0.0%)
0
0.0% (0.0%)
0
0.0% (0.0%)
0
0.0% (0.0%)
0
0.0% (0.0%)
0
0.0% (0.0%)
0
0.0% (0.0%)
0
0.0% (0.0%)
0
0.0% (0.0%)
0
54.0% (47.8%)
2036
Grade 1 4,522 11.0% (-22.0%)
499
58.8% (-5.1%)
2661
30.0% (26.9%)
1357
0.0% (0.0%)
1
0.0% (0.0%)
2
0.0% (0.0%)
2
0.0% (0.0%)
0
0.0% (0.0%)
0
0.0% (0.0%)
0
0.0% (0.0%)
0
0.0% (0.0%)
0
0.0% (0.0%)
0
0.0% (0.0%)
0
0.0% (0.0%)
0
30.1% (27.0%)
1362
Grade 2 4,765 0.0% (0.0%)
0
34.0% (-8.9%)
1622
47.5% (-4.6%)
2261
18.4% (13.4%)
878
0.0% (0.0%)
1
0.0% (0.0%)
0
0.1% (0.1%)
3
0.0% (0.0%)
0
0.0% (0.0%)
0
0.0% (0.0%)
0
0.0% (0.0%)
0
0.0% (0.0%)
0
0.0% (0.0%)
0
0.0% (0.0%)
0
18.5% (13.5%)
882
Grade 3 5,193 0.0% (0.0%)
0
14.7% (0.4%)
765
28.9% (2.1%)1499
44.2% (-5.5%)
2294
12.1% (2.9%)
629
0.0% (0.0%)
2
0.1% (0.1%)
3
0.0% (0.0%)
1
0.0% (0.0%)
0
0.0% (0.0%)
0
0.0% (0.0%)
0
0.0% (0.0%)
0
0.0% (0.0%)
0
0.0% (0.0%)
0
12.2% (3.0%)
635
Grade 4 5,381 0.0% (0.0%)
0
7.8% (1.7%)
418
15.0% (2.4%)
807
23.2% (2.5%)1246
41.4% (-4.7%)
2230
12.6% (-2.1%)
677
0.1% (0.1%)
3
0.0% (0.0%)
0
0.0% (0.0%)
0
0.0% (0.0%)
0
0.0% (0.0%)
0
0.0% (0.0%)
0
0.0% (0.0%)
0
0.0% (0.0%)
0
12.6% (-2.0%)
680
Grade 5 5,366 0.0% (0.0%)
0
4.4% (1.4%)
238
9.2% (2.4%)
492
14.1% (1.8%)
754
17.1% (-0.4%)
917
39.5% (-2.9%)
2121
15.6% (-2.4%)
839
0.1% (0.1%)
5
0.0% (0.0%)
0
0.0% (0.0%)
0
0.0% (0.0%)
0
0.0% (0.0%)
0
0.0% (0.0%)
0
0.0% (0.0%)
0
15.7% (-2.3%)
844
Grade 6 5,012 0.0% (0.0%)
0
2.5% (0.6%)
127
5.5% (0.9%)
276
9.2% (0.6%)
459
14.0% (0.4%)
700
18.1% (0.4%)
909
33.8% (-0.3%)
1696
16.8% (-2.7%)
844
0.0% (0.0%)
1
0.0% (0.0%)
0
0.0% (0.0%)
0
0.0% (0.0%)
0
0.0% (0.0%)
0
0.0% (0.0%)
0
16.9% (-2.6%)
845
Grade 7 4,285 0.0% (0.0%)
0
1.3% (0.0%)
55
2.9% (-0.2%)
126
5.7% (-1.8%)
244
9.5% (-2.3%)
405
12.4% (-0.6%)
531
14.0% (1.6%)
600
33.4% (-1.0%)
1432
20.6% (4.1%)
883
0.1% (0.1%)
6
0.0% (0.0%)
2
0.0% (0.0%)
1
0.0% (0.0%)
0
0.0% (0.0%)
0
20.8% (4.3%)
892
Grade 8 4,017 0.0% (0.0%)
0
1.5% (0.2%)
62
3.1% (-0.5%)
126
6.3% (0.0%)
253
9.6% (-0.5%)
384
10.7% (-1.9%)
429
11.8% (-0.2%)
476
12.2% (-1.9%)
492
26.0% (1.0%)1044
18.5% (3.7%)
742
0.1% (0.1%)
5
0.0% (0.0%)
2
0.0% (0.0%)
2
0.0% (0.0%)
0
18.7% (3.8%)
751
Grade 9 3,153 0.0% (0.0%)
0
0.9% (-0.1%)
28
2.8% (0.0%)
87
3.6% (-1.6%)
114
6.7% (-2.5%)
210
8.9% (-1.9%)
281
9.7% (-0.9%)
306
11.6% (-4.5%)
367
13.6% (0.9%)
428
12.2% (2.1%)
385
29.9% (8.4%)
944
0.0% (0.0%)
0
0.0% (0.0%)
0
0.1% (0.1%)
3
30.0% (8.5%)
947
Grade 10 2,405 0.0% (0.0%)
0
1.1% (0.5%)
26
1.8% (-0.5%)
43
4.7% (0.6%)
112
8.8% (1.5%)
212
8.7% (-3.0%)
209
9.1% (-0.3%)
218
11.6% (-2.6%)
279
12.2% (-0.8%)
293
11.4% (0.2%)
275
12.9% (0.9%)
310
17.7% (3.3%)
426
0.1% (0.1%)
2
0.0% (0.0%)
0
17.8% (3.4%)
428
Office of Equity and Access i-Ready Reading Report D2 10/21/2020Page 1
Note: Blank cells in this report indicate that there were no students in the specific placement category. A percentage of 0.0% reflects a small percentage value between 0.01% and 0.049%. Cells highlighted in pink reflect placement of 2 or more grade levels below. A negative value within the parentheses (-##) reflects a reduction (a desirable change) in % of students in this category since the last diagnostic. Cells highlighted in yellow reflect placement of 1 grade level below. Cells highlighted in green reflect a placement of on or above grade level. A negative value within the parentheses (-##) reflects a reduction (an undesirable change) in % of students in this category since the last diagnostic. Cells highlighted in blue are a grand total of all the areas highlighted in green (on or above grade level).
* Cell Value Key: Current Year Diagnostic 1 % of Test Takers in Placement Level Category (% Change in Placement Category from Prior Year Diagnostic 1 Students)
Current Year Diagnostic 1 Count of Test Takers in Placement Category
In 2019-20 grade K was not required to participate in Diagnostic 1.
i-Ready Diagnostic 1 Standard View Grade Level Report2020-21 Summary*
i-ReadyMathD2
Grade 11 1,807 0.0% (0.0%)
0
1.2% (0.8%)
21
1.9% (0.9%)
34
4.3% (0.4%)
77
6.7% (-0.7%)
121
8.4% (-1.3%)
152
8.9% (1.3%)
161
12.7% (0.0%)
230
12.0% (-1.1%)
216
13.3% (0.1%)
240
22.1% (-2.5%)
400
6.7% (1.3%)
121
1.9% (0.8%)
34
0.0% (0.0%)
0
1.9% (0.8%)
34
Office of Equity and Access i-Ready Reading Report D2 10/21/2020Page 2
Note: Blank cells in this report indicate that there were no students in the specific placement category. A percentage of 0.0% reflects a small percentage value between 0.01% and 0.049%. Cells highlighted in pink reflect placement of 2 or more grade levels below. A negative value within the parentheses (-##) reflects a reduction (a desirable change) in % of students in this category since the last diagnostic. Cells highlighted in yellow reflect placement of 1 grade level below. Cells highlighted in green reflect a placement of on or above grade level. A negative value within the parentheses (-##) reflects a reduction (an undesirable change) in % of students in this category since the last diagnostic. Cells highlighted in blue are a grand total of all the areas highlighted in green (on or above grade level).
* Cell Value Key: Current Year Diagnostic 1 % of Test Takers in Placement Level Category (% Change in Placement Category from Prior Year Diagnostic 1 Students)
Current Year Diagnostic 1 Count of Test Takers in Placement Category
In 2019-20 grade K was not required to participate in Diagnostic 1.
i-Ready Diagnostic 1 Standard View Student Group Reports2020-21 Summary*
i-ReadyMathD3
African American
Level6
Level4
Level3
Level2
Level1
LevelK
LevelPreK
Tests Taker CountsGrade Level
i-Ready Performance Grade Level Placement
Level5
Level8
Level7
Level9
Level 10
Level 11
Level12
On Track Total
Grade K 263 45.2% (-54.8%)
119
52.5% (52.5%)
138
2.3% (2.3%)
6
0.0% (0.0%)
0
0.0% (0.0%)
0
0.0% (0.0%)
0
0.0% (0.0%)
0
0.0% (0.0%)
0
0.0% (0.0%)
0
0.0% (0.0%)
0
0.0% (0.0%)
0
0.0% (0.0%)
0
0.0% (0.0%)
0
0.0% (0.0%)
0
54.8% (54.8%)
144
Grade 1 363 16.8% (-24.4%)
61
58.7% (2.8%)
213
24.5% (21.7%)
89
0.0% (0.0%)
0
0.0% (0.0%)
0
0.0% (0.0%)
0
0.0% (0.0%)
0
0.0% (0.0%)
0
0.0% (0.0%)
0
0.0% (0.0%)
0
0.0% (0.0%)
0
0.0% (0.0%)
0
0.0% (0.0%)
0
0.0% (0.0%)
0
24.5% (21.7%)
89
Grade 2 396 0.0% (0.0%)
0
40.9% (-14.2%)
162
42.7% (-0.3%)
169
16.4% (14.4%)
65
0.0% (0.0%)
0
0.0% (0.0%)
0
0.0% (0.0%)
0
0.0% (0.0%)
0
0.0% (0.0%)
0
0.0% (0.0%)
0
0.0% (0.0%)
0
0.0% (0.0%)
0
0.0% (0.0%)
0
0.0% (0.0%)
0
16.4% (14.4%)
65
Grade 3 402 0.0% (0.0%)
0
22.1% (-4.0%)
89
33.3% (1.3%)
134
35.1% (-3.5%)
141
9.5% (6.2%)
38
0.0% (0.0%)
0
0.0% (0.0%)
0
0.0% (0.0%)
0
0.0% (0.0%)
0
0.0% (0.0%)
0
0.0% (0.0%)
0
0.0% (0.0%)
0
0.0% (0.0%)
0
0.0% (0.0%)
0
9.5% (6.2%)
38
Grade 4 430 0.0% (0.0%)
0
13.0% (4.0%)
56
19.1% (-0.3%)
82
27.4% (2.4%)
118
34.4% (-6.8%)
148
5.8% (0.4%)
25
0.2% (0.2%)
1
0.0% (0.0%)
0
0.0% (0.0%)
0
0.0% (0.0%)
0
0.0% (0.0%)
0
0.0% (0.0%)
0
0.0% (0.0%)
0
0.0% (0.0%)
0
6.0% (0.7%)
26
Grade 5 422 0.0% (0.0%)
0
5.7% (-0.4%)
24
12.3% (0.0%)
52
20.9% (4.4%)
88
19.2% (-3.1%)
81
32.7% (-2.5%)
138
9.0% (1.3%)
38
0.2% (0.2%)
1
0.0% (0.0%)
0
0.0% (0.0%)
0
0.0% (0.0%)
0
0.0% (0.0%)
0
0.0% (0.0%)
0
0.0% (0.0%)
0
9.2% (1.5%)
39
Grade 6 377 0.0% (0.0%)
0
3.4% (1.3%)
13
10.6% (4.5%)
40
12.7% (1.5%)
48
17.5% (-1.2%)
66
22.5% (2.1%)
85
26.0% (-3.4%)
98
7.2% (-4.8%)
27
0.0% (0.0%)
0
0.0% (0.0%)
0
0.0% (0.0%)
0
0.0% (0.0%)
0
0.0% (0.0%)
0
0.0% (0.0%)
0
7.2% (-4.8%)
27
Grade 7 321 0.0% (0.0%)
0
2.2% (-0.3%)
7
3.1% (-1.3%)
10
8.4% (-1.3%)
27
14.6% (-2.6%)
47
12.5% (-4.3%)
40
19.3% (4.3%)
62
29.3% (3.7%)
94
10.6% (2.0%)
34
0.0% (0.0%)
0
0.0% (0.0%)
0
0.0% (0.0%)
0
0.0% (0.0%)
0
0.0% (0.0%)
0
10.6% (2.0%)
34
Grade 8 324 0.0% (0.0%)
0
2.2% (-0.2%)
7
5.2% (1.1%)
17
9.0% (-0.8%)
29
13.6% (-0.2%)
44
13.3% (-3.8%)
43
16.7% (5.2%)
54
11.4% (-1.5%)
37
19.4% (-1.4%)
63
9.3% (1.6%)
30
0.0% (0.0%)
0
0.0% (0.0%)
0
0.0% (0.0%)
0
0.0% (0.0%)
0
9.3% (1.6%)
30
Grade 9 222 0.0% (0.0%)
0
1.8% (-0.7%)
4
4.1% (0.1%)
9
11.7% (3.3%)
26
9.9% (-2.0%)
22
9.9% (-1.0%)
22
10.4% (-2.1%)
23
12.6% (-6.8%)
28
11.7% (-3.2%)
26
11.7% (7.7%)
26
16.2% (4.8%)
36
0.0% (0.0%)
0
0.0% (0.0%)
0
0.0% (0.0%)
0
16.2% (4.8%)
36
Grade 10 186 0.0% (0.0%)
0
3.2% (1.5%)
6
3.2% (-1.5%)
6
7.0% (-0.6%)
13
12.9% (-2.9%)
24
13.4% (2.3%)
25
7.5% (-3.6%)
14
14.0% (-0.6%)
26
14.5% (5.7%)
27
5.9% (0.1%)
11
9.1% (-2.0%)
17
9.1% (1.5%)
17
0.0% (0.0%)
0
0.0% (0.0%)
0
9.1% (1.5%)
17
Grade 11 148 0.0% (0.0%)
0
1.4% (0.5%)
2
5.4% (3.7%)
8
5.4% (-0.7%)
8
16.2% (6.6%)
24
16.2% (3.9%)
24
11.5% (1.0%)
17
13.5% (-0.5%)
20
6.1% (-4.4%)
9
8.1% (-4.2%)
12
10.1% (-10.9%)
15
4.7% (3.9%)
7
1.4% (1.4%)
2
0.0% (0.0%)
0
1.4% (1.4%)
2
Office of Equity and Access i-Ready Math Report D3 10/21/2020Page 1
Note: Blank cells in this report indicate that there were no students in the specific placement category. A percentage of 0.0% reflects a small percentage value between 0.01% and 0.049%. Cells highlighted in blue indicate percentage of students who are on or above grade level in their i-Ready Performance based on i-Ready's Standard View. In 2019-20 grade K was was not reqquired to participate in Diagnostic 1.
* Cell Value Key: Current Year Diagnostic 1 % of Test Takers in Placement Level Category (% Change in Placement Category from Prior Year Diagnostic 1 Students)
Current Year Diagnostic 1 Count of Test Takers in Placement Category
i-Ready Diagnostic 1 Standard View Student Group Reports2020-21 Summary*
i-ReadyMathD3
Asian
Level6
Level4
Level3
Level2
Level1
LevelK
LevelPreK
Tests Taker CountsGrade Level
i-Ready Performance Grade Level Placement
Level5
Level8
Level7
Level9
Level 10
Level 11
Level12
On Track Total
Grade K 532 47.7% (-44.6%)
254
49.4% (41.7%)
263
2.8% (2.8%)
15
0.0% (0.0%)
0
0.0% (0.0%)
0
0.0% (0.0%)
0
0.0% (0.0%)
0
0.0% (0.0%)
0
0.0% (0.0%)
0
0.0% (0.0%)
0
0.0% (0.0%)
0
0.0% (0.0%)
0
0.0% (0.0%)
0
0.0% (0.0%)
0
52.3% (44.6%)
278
Grade 1 578 8.8% (-21.9%)
51
59.9% (-6.8%)
346
31.0% (28.4%)
179
0.0% (0.0%)
0
0.2% (0.2%)
1
0.2% (0.2%)
1
0.0% (0.0%)
0
0.0% (0.0%)
0
0.0% (0.0%)
0
0.0% (0.0%)
0
0.0% (0.0%)
0
0.0% (0.0%)
0
0.0% (0.0%)
0
0.0% (0.0%)
0
31.3% (28.7%)
181
Grade 2 588 0.0% (0.0%)
0
34.7% (-4.2%)
204
49.3% (-7.3%)
290
15.8% (11.3%)
93
0.0% (0.0%)
0
0.0% (0.0%)
0
0.2% (0.2%)
1
0.0% (0.0%)
0
0.0% (0.0%)
0
0.0% (0.0%)
0
0.0% (0.0%)
0
0.0% (0.0%)
0
0.0% (0.0%)
0
0.0% (0.0%)
0
16.0% (11.5%)
94
Grade 3 586 0.0% (0.0%)
0
12.3% (2.9%)
72
27.0% (2.8%)
158
47.6% (-6.6%)
279
13.0% (0.8%)
76
0.0% (0.0%)
0
0.0% (0.0%)
0
0.2% (0.2%)
1
0.0% (0.0%)
0
0.0% (0.0%)
0
0.0% (0.0%)
0
0.0% (0.0%)
0
0.0% (0.0%)
0
0.0% (0.0%)
0
13.1% (0.9%)
77
Grade 4 517 0.0% (0.0%)
0
4.8% (0.7%)
25
10.8% (0.6%)
56
20.3% (3.1%)
105
47.8% (-1.4%)
247
16.2% (-3.0%)
84
0.0% (0.0%)
0
0.0% (0.0%)
0
0.0% (0.0%)
0
0.0% (0.0%)
0
0.0% (0.0%)
0
0.0% (0.0%)
0
0.0% (0.0%)
0
0.0% (0.0%)
0
16.2% (-3.0%)
84
Grade 5 535 0.0% (0.0%)
0
4.1% (2.2%)
22
5.6% (0.6%)
30
9.5% (0.6%)
51
14.6% (-2.2%)
78
45.4% (1.5%)
243
20.6% (-3.0%)
110
0.2% (0.2%)
1
0.0% (0.0%)
0
0.0% (0.0%)
0
0.0% (0.0%)
0
0.0% (0.0%)
0
0.0% (0.0%)
0
0.0% (0.0%)
0
20.7% (-2.9%)
111
Grade 6 508 0.0% (0.0%)
0
1.2% (-0.5%)
6
3.9% (2.9%)
20
5.7% (0.3%)
29
11.0% (3.2%)
56
15.7% (-1.0%)
80
38.2% (-2.9%)
194
24.2% (-2.0%)
123
0.0% (0.0%)
0
0.0% (0.0%)
0
0.0% (0.0%)
0
0.0% (0.0%)
0
0.0% (0.0%)
0
0.0% (0.0%)
0
24.2% (-2.0%)
123
Grade 7 420 0.0% (0.0%)
0
0.2% (-0.9%)
1
1.0% (-0.7%)
4
1.9% (-0.6%)
8
6.0% (-0.3%)
25
11.7% (1.2%)
49
13.1% (3.6%)
55
37.1% (-6.5%)
156
28.8% (4.0%)
121
0.2% (0.2%)
1
0.0% (0.0%)
0
0.0% (0.0%)
0
0.0% (0.0%)
0
0.0% (0.0%)
0
29.0% (4.2%)
122
Grade 8 391 0.0% (0.0%)
0
0.5% (0.5%)
2
2.0% (0.0%)
8
3.3% (-0.7%)
13
3.8% (-2.8%)
15
6.6% (-2.0%)
26
8.7% (-0.6%)
34
11.5% (-2.3%)
45
35.0% (1.7%)
137
27.9% (5.9%)
109
0.3% (0.0%)
1
0.0% (0.0%)
0
0.3% (0.3%)
1
0.0% (0.0%)
0
28.4% (6.2%)
111
Grade 9 335 0.0% (0.0%)
0
0.3% (-0.3%)
1
2.1% (2.1%)
7
1.5% (-4.1%)
5
3.3% (-2.3%)
11
6.6% (1.0%)
22
6.9% (3.0%)
23
11.3% (-7.0%)
38
12.8% (-1.1%)
43
15.5% (4.4%)
52
39.7% (4.1%)
133
0.0% (0.0%)
0
0.0% (0.0%)
0
0.0% (0.0%)
0
39.7% (4.1%)
133
Grade 10 245 0.0% (0.0%)
0
0.0% (0.0%)
0
1.6% (0.4%)
4
2.4% (1.3%)
6
7.8% (5.4%)
19
4.1% (-5.4%)
10
8.2% (1.7%)
20
11.4% (-2.8%)
28
9.4% (-9.5%)
23
15.5% (7.2%)
38
15.9% (2.9%)
39
23.7% (-1.2%)
58
0.0% (0.0%)
0
0.0% (0.0%)
0
23.7% (-1.2%)
58
Grade 11 200 0.0% (0.0%)
0
0.5% (-0.3%)
1
0.5% (0.5%)
1
1.0% (-1.5%)
2
3.5% (0.2%)
7
4.5% (-3.7%)
9
8.5% (2.8%)
17
11.5% (1.7%)
23
14.5% (1.4%)
29
18.0% (0.8%)
36
27.0% (-4.1%)
54
7.0% (1.3%)
14
3.5% (1.0%)
7
0.0% (0.0%)
0
3.5% (1.0%)
7
Office of Equity and Access i-Ready Math Report D3 10/21/2020Page 2
Note: Blank cells in this report indicate that there were no students in the specific placement category. A percentage of 0.0% reflects a small percentage value between 0.01% and 0.049%. Cells highlighted in blue indicate percentage of students who are on or above grade level in their i-Ready Performance based on i-Ready's Standard View. In 2019-20 grade K was was not reqquired to participate in Diagnostic 1.
* Cell Value Key: Current Year Diagnostic 1 % of Test Takers in Placement Level Category (% Change in Placement Category from Prior Year Diagnostic 1 Students)
Current Year Diagnostic 1 Count of Test Takers in Placement Category
i-Ready Diagnostic 1 Standard View Student Group Reports2020-21 Summary*
i-ReadyMathD3
Filipino
Level6
Level4
Level3
Level2
Level1
LevelK
LevelPreK
Tests Taker CountsGrade Level
i-Ready Performance Grade Level Placement
Level5
Level8
Level7
Level9
Level 10
Level 11
Level12
On Track Total
Grade K 9 44.4% ()4
44.4% ()4
11.1% ()1
0.0% ()0
0.0% ()0
0.0% ()0
0.0% ()0
0.0% ()0
0.0% ()0
0.0% ()0
0.0% ()0
0.0% ()0
0.0% ()0
0.0% ()0
55.6% ()5
Grade 1 9 11.1% (-22.2%)
1
55.6% (-11.1%)
5
33.3% (33.3%)
3
0.0% (0.0%)
0
0.0% (0.0%)
0
0.0% (0.0%)
0
0.0% (0.0%)
0
0.0% (0.0%)
0
0.0% (0.0%)
0
0.0% (0.0%)
0
0.0% (0.0%)
0
0.0% (0.0%)
0
0.0% (0.0%)
0
0.0% (0.0%)
0
33.3% (33.3%)
3
Grade 2 8 0.0% (0.0%)
0
0.0% (-40.0%)
0
50.0% (-10.0%)
4
50.0% (50.0%)
4
0.0% (0.0%)
0
0.0% (0.0%)
0
0.0% (0.0%)
0
0.0% (0.0%)
0
0.0% (0.0%)
0
0.0% (0.0%)
0
0.0% (0.0%)
0
0.0% (0.0%)
0
0.0% (0.0%)
0
0.0% (0.0%)
0
50.0% (50.0%)
4
Grade 3 13 0.0% (0.0%)
0
0.0% (0.0%)
0
38.5% (33.5%)
5
61.5% (-13.5%)
8
0.0% (-20.0%)
0
0.0% (0.0%)
0
0.0% (0.0%)
0
0.0% (0.0%)
0
0.0% (0.0%)
0
0.0% (0.0%)
0
0.0% (0.0%)
0
0.0% (0.0%)
0
0.0% (0.0%)
0
0.0% (0.0%)
0
0.0% (-20.0%)
0
Grade 4 19 0.0% (0.0%)
0
0.0% (0.0%)
0
5.3% (5.3%)
1
0.0% (-18.2%)
0
47.4% (-7.2%)
9
42.1% (14.8%)
8
5.3% (5.3%)
1
0.0% (0.0%)
0
0.0% (0.0%)
0
0.0% (0.0%)
0
0.0% (0.0%)
0
0.0% (0.0%)
0
0.0% (0.0%)
0
0.0% (0.0%)
0
47.4% (20.1%)
9
Grade 5 14 0.0% (0.0%)
0
0.0% (0.0%)
0
0.0% (0.0%)
0
0.0% (-8.3%)
0
7.1% (-9.5%)
1
35.7% (2.4%)
5
57.1% (15.5%)
8
0.0% (0.0%)
0
0.0% (0.0%)
0
0.0% (0.0%)
0
0.0% (0.0%)
0
0.0% (0.0%)
0
0.0% (0.0%)
0
0.0% (0.0%)
0
57.1% (15.5%)
8
Grade 6 12 0.0% (0.0%)
0
0.0% (0.0%)
0
0.0% (-5.9%)
0
0.0% (0.0%)
0
0.0% (-5.9%)
0
8.3% (2.5%)
1
33.3% (-19.6%)
4
58.3% (28.9%)
7
0.0% (0.0%)
0
0.0% (0.0%)
0
0.0% (0.0%)
0
0.0% (0.0%)
0
0.0% (0.0%)
0
0.0% (0.0%)
0
58.3% (28.9%)
7
Grade 7 18 0.0% (0.0%)
0
0.0% (0.0%)
0
5.6% (5.6%)
1
0.0% (0.0%)
0
5.6% (-0.7%)
1
0.0% (-18.8%)
0
5.6% (5.6%)
1
44.4% (19.4%)
8
38.9% (-11.1%)
7
0.0% (0.0%)
0
0.0% (0.0%)
0
0.0% (0.0%)
0
0.0% (0.0%)
0
0.0% (0.0%)
0
38.9% (-11.1%)
7
Grade 8 17 0.0% (0.0%)
0
0.0% (0.0%)
0
0.0% (0.0%)
0
0.0% (0.0%)
0
5.9% (-2.5%)
1
0.0% (0.0%)
0
17.6% (9.3%)
3
0.0% (-8.3%)
0
23.5% (-9.8%)
4
52.9% (19.6%)
9
0.0% (-8.3%)
0
0.0% (0.0%)
0
0.0% (0.0%)
0
0.0% (0.0%)
0
52.9% (11.3%)
9
Grade 9 13 0.0% (0.0%)
0
0.0% (0.0%)
0
0.0% (0.0%)
0
0.0% (-11.1%)
0
0.0% (0.0%)
0
7.7% (-3.4%)
1
0.0% (0.0%)
0
7.7% (7.7%)
1
7.7% (-3.4%)
1
7.7% (-14.5%)
1
61.5% (17.1%)
8
0.0% (0.0%)
0
0.0% (0.0%)
0
7.7% (7.7%)
1
69.2% (24.8%)
9
Grade 10 9 0.0% (0.0%)
0
0.0% (0.0%)
0
0.0% (0.0%)
0
0.0% (0.0%)
0
0.0% (0.0%)
0
11.1% (-1.4%)
1
11.1% (11.1%)
1
0.0% (-12.5%)
0
11.1% (-1.4%)
1
22.2% (9.7%)
2
22.2% (9.7%)
2
22.2% (-15.3%)
2
0.0% (0.0%)
0
0.0% (0.0%)
0
22.2% (-15.3%)
2
Grade 11 3 0.0% (0.0%)
0
0.0% (0.0%)
0
0.0% (0.0%)
0
0.0% (0.0%)
0
0.0% (0.0%)
0
0.0% (0.0%)
0
33.3% (33.3%)
1
0.0% (-14.3%)
0
0.0% (-14.3%)
0
0.0% (-14.3%)
0
66.7% (23.8%)
2
0.0% (-14.3%)
0
0.0% (0.0%)
0
0.0% (0.0%)
0
0.0% (0.0%)
0
Office of Equity and Access i-Ready Math Report D3 10/21/2020Page 3
Note: Blank cells in this report indicate that there were no students in the specific placement category. A percentage of 0.0% reflects a small percentage value between 0.01% and 0.049%. Cells highlighted in blue indicate percentage of students who are on or above grade level in their i-Ready Performance based on i-Ready's Standard View. In 2019-20 grade K was was not reqquired to participate in Diagnostic 1.
* Cell Value Key: Current Year Diagnostic 1 % of Test Takers in Placement Level Category (% Change in Placement Category from Prior Year Diagnostic 1 Students)
Current Year Diagnostic 1 Count of Test Takers in Placement Category
i-Ready Diagnostic 1 Standard View Student Group Reports2020-21 Summary*
i-ReadyMathD3
Hispanic
Level6
Level4
Level3
Level2
Level1
LevelK
LevelPreK
Tests Taker CountsGrade Level
i-Ready Performance Grade Level Placement
Level5
Level8
Level7
Level9
Level 10
Level 11
Level12
On Track Total
Grade K 2,437 48.1% (-45.8%)
1172
50.5% (44.5%)
1231
1.4% (1.4%)
34
0.0% (0.0%)
0
0.0% (0.0%)
0
0.0% (0.0%)
0
0.0% (0.0%)
0
0.0% (0.0%)
0
0.0% (0.0%)
0
0.0% (0.0%)
0
0.0% (0.0%)
0
0.0% (0.0%)
0
0.0% (0.0%)
0
0.0% (0.0%)
0
51.9% (45.8%)
1265
Grade 1 2,928 11.2% (-22.8%)
327
59.5% (-4.2%)
1743
29.2% (26.9%)
855
0.0% (0.0%)
1
0.0% (0.0%)
1
0.0% (0.0%)
1
0.0% (0.0%)
0
0.0% (0.0%)
0
0.0% (0.0%)
0
0.0% (0.0%)
0
0.0% (0.0%)
0
0.0% (0.0%)
0
0.0% (0.0%)
0
0.0% (0.0%)
0
29.3% (27.0%)
858
Grade 2 3,152 0.0% (0.0%)
0
34.9% (-8.9%)
1100
47.6% (-4.6%)
1500
17.5% (13.4%)
551
0.0% (0.0%)
0
0.0% (0.0%)
0
0.0% (0.0%)
1
0.0% (0.0%)
0
0.0% (0.0%)
0
0.0% (0.0%)
0
0.0% (0.0%)
0
0.0% (0.0%)
0
0.0% (0.0%)
0
0.0% (0.0%)
0
17.5% (13.5%)
552
Grade 3 3,519 0.0% (0.0%)
0
15.1% (0.5%)
531
30.3% (2.5%)1066
44.0% (-5.3%)
1550
10.5% (2.2%)
369
0.0% (0.0%)
1
0.1% (0.1%)
2
0.0% (0.0%)
0
0.0% (0.0%)
0
0.0% (0.0%)
0
0.0% (0.0%)
0
0.0% (0.0%)
0
0.0% (0.0%)
0
0.0% (0.0%)
0
10.6% (2.3%)
372
Grade 4 3,754 0.0% (0.0%)
0
8.1% (2.2%)
305
16.0% (3.2%)
599
23.5% (2.4%)
884
41.3% (-5.1%)
1550
11.1% (-2.6%)
415
0.0% (0.0%)
1
0.0% (0.0%)
0
0.0% (0.0%)
0
0.0% (0.0%)
0
0.0% (0.0%)
0
0.0% (0.0%)
0
0.0% (0.0%)
0
0.0% (0.0%)
0
11.1% (-2.6%)
416
Grade 5 3,755 0.0% (0.0%)
0
4.5% (1.6%)
168
9.8% (2.8%)
369
14.5% (1.6%)
543
17.5% (-0.1%)
659
39.5% (-3.6%)
1485
14.1% (-2.4%)
528
0.1% (0.1%)
3
0.0% (0.0%)
0
0.0% (0.0%)
0
0.0% (0.0%)
0
0.0% (0.0%)
0
0.0% (0.0%)
0
0.0% (0.0%)
0
14.1% (-2.3%)
531
Grade 6 3,482 0.0% (0.0%)
0
2.8% (0.9%)
98
5.7% (0.5%)
197
9.8% (0.5%)
340
14.6% (0.2%)
507
18.7% (0.4%)
651
33.9% (0.3%)1181
14.6% (-2.8%)
508
0.0% (0.0%)
0
0.0% (0.0%)
0
0.0% (0.0%)
0
0.0% (0.0%)
0
0.0% (0.0%)
0
0.0% (0.0%)
0
14.6% (-2.8%)
508
Grade 7 2,978 0.0% (0.0%)
0
1.4% (0.1%)
41
3.3% (-0.1%)
99
6.2% (-2.1%)
185
10.1% (-2.5%)
302
13.0% (-0.5%)
387
13.9% (1.2%)
415
33.1% (-1.1%)
985
18.7% (4.8%)
558
0.1% (0.1%)
4
0.0% (0.0%)
1
0.0% (0.0%)
1
0.0% (0.0%)
0
0.0% (0.0%)
0
18.9% (5.0%)
564
Grade 8 2,770 0.0% (0.0%)
0
1.7% (0.3%)
48
3.3% (-0.7%)
91
6.8% (0.2%)
188
10.2% (-0.7%)
282
11.7% (-1.7%)
324
11.7% (-1.1%)
325
12.9% (-1.8%)
356
25.0% (0.9%)
692
16.7% (4.5%)
463
0.0% (0.0%)
1
0.0% (0.0%)
0
0.0% (0.0%)
0
0.0% (0.0%)
0
16.8% (4.5%)
464
Grade 9 2,143 0.0% (0.0%)
0
0.9% (-0.1%)
19
2.9% (-0.1%)
63
3.3% (-2.0%)
71
7.6% (-3.1%)
162
9.3% (-3.0%)
200
10.7% (-1.1%)
230
12.3% (-3.9%)
264
13.5% (1.0%)
290
12.2% (2.0%)
262
27.2% (10.4%)
582
0.0% (0.0%)
0
0.0% (0.0%)
0
0.0% (0.0%)
0
27.2% (10.4%)
582
Grade 10 1,621 0.0% (0.0%)
0
1.0% (0.5%)
16
1.5% (-0.6%)
24
4.9% (0.7%)
79
8.9% (1.1%)
144
9.3% (-3.1%)
151
9.9% (-0.5%)
160
11.5% (-3.5%)
187
12.6% (-0.3%)
205
11.9% (-0.1%)
193
12.3% (1.1%)
200
16.1% (4.6%)
261
0.1% (0.1%)
1
0.0% (0.0%)
0
16.2% (4.7%)
262
Grade 11 1,252 0.0% (0.0%)
0
1.2% (0.9%)
15
1.6% (0.7%)
20
4.6% (0.8%)
57
6.2% (-2.1%)
77
8.3% (-2.4%)
104
8.9% (1.0%)
111
13.3% (-0.3%)
167
12.7% (-1.5%)
159
12.8% (0.8%)
160
22.7% (-0.3%)
284
6.3% (1.5%)
79
1.5% (0.9%)
19
0.0% (0.0%)
0
1.5% (0.9%)
19
Office of Equity and Access i-Ready Math Report D3 10/21/2020Page 4
Note: Blank cells in this report indicate that there were no students in the specific placement category. A percentage of 0.0% reflects a small percentage value between 0.01% and 0.049%. Cells highlighted in blue indicate percentage of students who are on or above grade level in their i-Ready Performance based on i-Ready's Standard View. In 2019-20 grade K was was not reqquired to participate in Diagnostic 1.
* Cell Value Key: Current Year Diagnostic 1 % of Test Takers in Placement Level Category (% Change in Placement Category from Prior Year Diagnostic 1 Students)
Current Year Diagnostic 1 Count of Test Takers in Placement Category
i-Ready Diagnostic 1 Standard View Student Group Reports2020-21 Summary*
i-ReadyMathD3
Native American
Level6
Level4
Level3
Level2
Level1
LevelK
LevelPreK
Tests Taker CountsGrade Level
i-Ready Performance Grade Level Placement
Level5
Level8
Level7
Level9
Level 10
Level 11
Level12
On Track Total
Grade K 24 45.8% ()11
54.2% ()13
0.0% ()0
0.0% ()0
0.0% ()0
0.0% ()0
0.0% ()0
0.0% ()0
0.0% ()0
0.0% ()0
0.0% ()0
0.0% ()0
0.0% ()0
0.0% ()0
54.2% ()13
Grade 1 27 14.8% (-23.4%)
4
59.3% (-2.5%)
16
25.9% (25.9%)
7
0.0% (0.0%)
0
0.0% (0.0%)
0
0.0% (0.0%)
0
0.0% (0.0%)
0
0.0% (0.0%)
0
0.0% (0.0%)
0
0.0% (0.0%)
0
0.0% (0.0%)
0
0.0% (0.0%)
0
0.0% (0.0%)
0
0.0% (0.0%)
0
25.9% (25.9%)
7
Grade 2 37 0.0% (0.0%)
0
54.1% (2.6%)
20
40.5% (-5.2%)
15
5.4% (2.5%)
2
0.0% (0.0%)
0
0.0% (0.0%)
0
0.0% (0.0%)
0
0.0% (0.0%)
0
0.0% (0.0%)
0
0.0% (0.0%)
0
0.0% (0.0%)
0
0.0% (0.0%)
0
0.0% (0.0%)
0
0.0% (0.0%)
0
5.4% (2.5%)
2
Grade 3 34 0.0% (0.0%)
0
23.5% (10.2%)
8
14.7% (-12.0%)
5
44.1% (-9.2%)
15
17.6% (11.0%)
6
0.0% (0.0%)
0
0.0% (0.0%)
0
0.0% (0.0%)
0
0.0% (0.0%)
0
0.0% (0.0%)
0
0.0% (0.0%)
0
0.0% (0.0%)
0
0.0% (0.0%)
0
0.0% (0.0%)
0
17.6% (11.0%)
6
Grade 4 32 0.0% (0.0%)
0
9.4% (-8.5%)
3
15.6% (1.3%)
5
25.0% (21.4%)
8
34.4% (-12.1%)
11
15.6% (-2.2%)
5
0.0% (0.0%)
0
0.0% (0.0%)
0
0.0% (0.0%)
0
0.0% (0.0%)
0
0.0% (0.0%)
0
0.0% (0.0%)
0
0.0% (0.0%)
0
0.0% (0.0%)
0
15.6% (-2.2%)
5
Grade 5 29 0.0% (0.0%)
0
6.9% (2.4%)
2
6.9% (6.9%)
2
20.7% (7.1%)
6
0.0% (-18.2%)
0
58.6% (13.2%)
17
6.9% (-11.3%)
2
0.0% (0.0%)
0
0.0% (0.0%)
0
0.0% (0.0%)
0
0.0% (0.0%)
0
0.0% (0.0%)
0
0.0% (0.0%)
0
0.0% (0.0%)
0
6.9% (-11.3%)
2
Grade 6 30 0.0% (0.0%)
0
3.3% (-2.7%)
1
3.3% (-2.7%)
1
10.0% (10.0%)
3
20.0% (-4.2%)
6
16.7% (-1.5%)
5
26.7% (-0.6%)
8
20.0% (1.8%)
6
0.0% (0.0%)
0
0.0% (0.0%)
0
0.0% (0.0%)
0
0.0% (0.0%)
0
0.0% (0.0%)
0
0.0% (0.0%)
0
20.0% (1.8%)
6
Grade 7 23 0.0% (0.0%)
0
0.0% (0.0%)
0
0.0% (-4.8%)
0
4.3% (-14.7%)
1
13.0% (-10.8%)
3
26.1% (21.3%)
6
17.4% (12.6%)
4
21.7% (-11.6%)
5
17.4% (7.9%)
4
0.0% (0.0%)
0
0.0% (0.0%)
0
0.0% (0.0%)
0
0.0% (0.0%)
0
0.0% (0.0%)
0
17.4% (7.9%)
4
Grade 8 18 0.0% (0.0%)
0
5.6% (5.6%)
1
0.0% (0.0%)
0
0.0% (-7.1%)
0
16.7% (2.4%)
3
16.7% (-4.8%)
3
16.7% (2.4%)
3
16.7% (-1.2%)
3
22.2% (4.4%)
4
5.6% (-1.6%)
1
0.0% (0.0%)
0
0.0% (0.0%)
0
0.0% (0.0%)
0
0.0% (0.0%)
0
5.6% (-1.6%)
1
Grade 9 19 0.0% (0.0%)
0
0.0% (0.0%)
0
0.0% (0.0%)
0
0.0% (0.0%)
0
21.1% (-3.9%)
4
21.1% (21.1%)
4
0.0% (-25.0%)
0
15.8% (15.8%)
3
15.8% (15.8%)
3
10.5% (-14.5%)
2
15.8% (-9.2%)
3
0.0% (0.0%)
0
0.0% (0.0%)
0
0.0% (0.0%)
0
15.8% (-9.2%)
3
Grade 10 7 0.0% (0.0%)
0
0.0% (0.0%)
0
0.0% (-8.3%)
0
0.0% (-8.3%)
0
14.3% (14.3%)
1
0.0% (-16.7%)
0
14.3% (14.3%)
1
28.6% (28.6%)
2
0.0% (-16.7%)
0
14.3% (-2.4%)
1
28.6% (3.6%)
2
0.0% (-8.3%)
0
0.0% (0.0%)
0
0.0% (0.0%)
0
0.0% (-8.3%)
0
Grade 11 9 0.0% (0.0%)
0
11.1% (11.1%)
1
22.2% (22.2%)
2
0.0% (0.0%)
0
0.0% (0.0%)
0
0.0% (0.0%)
0
0.0% (0.0%)
0
11.1% (-5.6%)
1
11.1% (11.1%)
1
33.3% (16.7%)
3
11.1% (-38.9%)
1
0.0% (-16.7%)
0
0.0% (0.0%)
0
0.0% (0.0%)
0
0.0% (0.0%)
0
Office of Equity and Access i-Ready Math Report D3 10/21/2020Page 5
Note: Blank cells in this report indicate that there were no students in the specific placement category. A percentage of 0.0% reflects a small percentage value between 0.01% and 0.049%. Cells highlighted in blue indicate percentage of students who are on or above grade level in their i-Ready Performance based on i-Ready's Standard View. In 2019-20 grade K was was not reqquired to participate in Diagnostic 1.
* Cell Value Key: Current Year Diagnostic 1 % of Test Takers in Placement Level Category (% Change in Placement Category from Prior Year Diagnostic 1 Students)
Current Year Diagnostic 1 Count of Test Takers in Placement Category
i-Ready Diagnostic 1 Standard View Student Group Reports2020-21 Summary*
i-ReadyMathD3
Pacific Islander
Level6
Level4
Level3
Level2
Level1
LevelK
LevelPreK
Tests Taker CountsGrade Level
i-Ready Performance Grade Level Placement
Level5
Level8
Level7
Level9
Level 10
Level 11
Level12
On Track Total
Grade K 20 65.0% (-35.0%)
13
35.0% (35.0%)
7
0.0% (0.0%)
0
0.0% (0.0%)
0
0.0% (0.0%)
0
0.0% (0.0%)
0
0.0% (0.0%)
0
0.0% (0.0%)
0
0.0% (0.0%)
0
0.0% (0.0%)
0
0.0% (0.0%)
0
0.0% (0.0%)
0
0.0% (0.0%)
0
0.0% (0.0%)
0
35.0% (35.0%)
7
Grade 1 15 13.3% (-4.3%)
2
60.0% (-16.5%)
9
26.7% (20.8%)
4
0.0% (0.0%)
0
0.0% (0.0%)
0
0.0% (0.0%)
0
0.0% (0.0%)
0
0.0% (0.0%)
0
0.0% (0.0%)
0
0.0% (0.0%)
0
0.0% (0.0%)
0
0.0% (0.0%)
0
0.0% (0.0%)
0
0.0% (0.0%)
0
26.7% (20.8%)
4
Grade 2 19 0.0% (0.0%)
0
36.8% (0.5%)
7
52.6% (-11.0%)
10
10.5% (10.5%)
2
0.0% (0.0%)
0
0.0% (0.0%)
0
0.0% (0.0%)
0
0.0% (0.0%)
0
0.0% (0.0%)
0
0.0% (0.0%)
0
0.0% (0.0%)
0
0.0% (0.0%)
0
0.0% (0.0%)
0
0.0% (0.0%)
0
10.5% (10.5%)
2
Grade 3 13 0.0% (0.0%)
0
0.0% (-6.3%)
0
23.1% (-1.9%)
3
61.5% (17.8%)
8
15.4% (-9.6%)
2
0.0% (0.0%)
0
0.0% (0.0%)
0
0.0% (0.0%)
0
0.0% (0.0%)
0
0.0% (0.0%)
0
0.0% (0.0%)
0
0.0% (0.0%)
0
0.0% (0.0%)
0
0.0% (0.0%)
0
15.4% (-9.6%)
2
Grade 4 17 0.0% (0.0%)
0
0.0% (-7.1%)
0
5.9% (-8.4%)
1
23.5% (9.2%)
4
52.9% (-4.2%)
9
17.6% (10.5%)
3
0.0% (0.0%)
0
0.0% (0.0%)
0
0.0% (0.0%)
0
0.0% (0.0%)
0
0.0% (0.0%)
0
0.0% (0.0%)
0
0.0% (0.0%)
0
0.0% (0.0%)
0
17.6% (10.5%)
3
Grade 5 15 0.0% (0.0%)
0
6.7% (6.7%)
1
13.3% (9.8%)
2
26.7% (19.5%)
4
13.3% (9.8%)
2
40.0% (-13.6%)
6
0.0% (-32.1%)
0
0.0% (0.0%)
0
0.0% (0.0%)
0
0.0% (0.0%)
0
0.0% (0.0%)
0
0.0% (0.0%)
0
0.0% (0.0%)
0
0.0% (0.0%)
0
0.0% (-32.1%)
0
Grade 6 27 0.0% (0.0%)
0
0.0% (0.0%)
0
3.7% (-0.6%)
1
7.4% (-1.3%)
2
0.0% (-4.3%)
0
7.4% (-23.0%)
2
48.1% (9.0%)
13
33.3% (20.3%)
9
0.0% (0.0%)
0
0.0% (0.0%)
0
0.0% (0.0%)
0
0.0% (0.0%)
0
0.0% (0.0%)
0
0.0% (0.0%)
0
33.3% (20.3%)
9
Grade 7 22 0.0% (0.0%)
0
0.0% (-6.3%)
0
0.0% (0.0%)
0
9.1% (2.8%)
2
4.5% (-1.7%)
1
22.7% (10.2%)
5
9.1% (2.8%)
2
31.8% (0.6%)
7
22.7% (-8.5%)
5
0.0% (0.0%)
0
0.0% (0.0%)
0
0.0% (0.0%)
0
0.0% (0.0%)
0
0.0% (0.0%)
0
22.7% (-8.5%)
5
Grade 8 18 0.0% (0.0%)
0
0.0% (0.0%)
0
0.0% (0.0%)
0
5.6% (-5.6%)
1
0.0% (0.0%)
0
16.7% (-5.6%)
3
11.1% (11.1%)
2
22.2% (0.0%)
4
11.1% (11.1%)
2
27.8% (-16.7%)
5
5.6% (5.6%)
1
0.0% (0.0%)
0
0.0% (0.0%)
0
0.0% (0.0%)
0
33.3% (-11.1%)
6
Grade 9 8 0.0% (0.0%)
0
0.0% (0.0%)
0
12.5% (12.5%)
1
0.0% (-11.1%)
0
0.0% (0.0%)
0
0.0% (-11.1%)
0
25.0% (-8.3%)
2
12.5% (-9.7%)
1
12.5% (12.5%)
1
25.0% (25.0%)
2
12.5% (-9.7%)
1
0.0% (0.0%)
0
0.0% (0.0%)
0
0.0% (0.0%)
0
12.5% (-9.7%)
1
Grade 10 6 0.0% (0.0%)
0
0.0% (0.0%)
0
0.0% (0.0%)
0
0.0% (-22.2%)
0
16.7% (5.6%)
1
0.0% (-11.1%)
0
16.7% (5.6%)
1
16.7% (16.7%)
1
0.0% (-11.1%)
0
0.0% (-22.2%)
0
33.3% (22.2%)
2
16.7% (16.7%)
1
0.0% (0.0%)
0
0.0% (0.0%)
0
16.7% (16.7%)
1
Grade 11 7 0.0% (0.0%)
0
0.0% (0.0%)
0
0.0% (0.0%)
0
0.0% (-14.3%)
0
28.6% (28.6%)
2
0.0% (0.0%)
0
14.3% (0.0%)
1
28.6% (0.0%)
2
14.3% (0.0%)
1
0.0% (0.0%)
0
0.0% (-14.3%)
0
14.3% (0.0%)
1
0.0% (0.0%)
0
0.0% (0.0%)
0
0.0% (0.0%)
0
Office of Equity and Access i-Ready Math Report D3 10/21/2020Page 6
Note: Blank cells in this report indicate that there were no students in the specific placement category. A percentage of 0.0% reflects a small percentage value between 0.01% and 0.049%. Cells highlighted in blue indicate percentage of students who are on or above grade level in their i-Ready Performance based on i-Ready's Standard View. In 2019-20 grade K was was not reqquired to participate in Diagnostic 1.
* Cell Value Key: Current Year Diagnostic 1 % of Test Takers in Placement Level Category (% Change in Placement Category from Prior Year Diagnostic 1 Students)
Current Year Diagnostic 1 Count of Test Takers in Placement Category
i-Ready Diagnostic 1 Standard View Student Group Reports2020-21 Summary*
i-ReadyMathD3
Two or More Races
Level6
Level4
Level3
Level2
Level1
LevelK
LevelPreK
Tests Taker CountsGrade Level
i-Ready Performance Grade Level Placement
Level5
Level8
Level7
Level9
Level 10
Level 11
Level12
On Track Total
Grade K 202 37.1% (-62.9%)
75
61.9% (61.9%)
125
1.0% (1.0%)
2
0.0% (0.0%)
0
0.0% (0.0%)
0
0.0% (0.0%)
0
0.0% (0.0%)
0
0.0% (0.0%)
0
0.0% (0.0%)
0
0.0% (0.0%)
0
0.0% (0.0%)
0
0.0% (0.0%)
0
0.0% (0.0%)
0
0.0% (0.0%)
0
62.9% (62.9%)
127
Grade 1 208 10.6% (-12.5%)
22
57.7% (-15.7%)
120
31.7% (28.3%)
66
0.0% (0.0%)
0
0.0% (0.0%)
0
0.0% (0.0%)
0
0.0% (0.0%)
0
0.0% (0.0%)
0
0.0% (0.0%)
0
0.0% (0.0%)
0
0.0% (0.0%)
0
0.0% (0.0%)
0
0.0% (0.0%)
0
0.0% (0.0%)
0
31.7% (28.3%)
66
Grade 2 182 0.0% (0.0%)
0
26.9% (-11.6%)
49
47.3% (-1.6%)
86
25.8% (13.2%)
47
0.0% (0.0%)
0
0.0% (0.0%)
0
0.0% (0.0%)
0
0.0% (0.0%)
0
0.0% (0.0%)
0
0.0% (0.0%)
0
0.0% (0.0%)
0
0.0% (0.0%)
0
0.0% (0.0%)
0
0.0% (0.0%)
0
25.8% (13.2%)
47
Grade 3 186 0.0% (0.0%)
0
11.8% (-3.6%)
22
24.7% (-1.1%)
46
41.4% (-8.1%)
77
22.0% (12.7%)
41
0.0% (0.0%)
0
0.0% (0.0%)
0
0.0% (0.0%)
0
0.0% (0.0%)
0
0.0% (0.0%)
0
0.0% (0.0%)
0
0.0% (0.0%)
0
0.0% (0.0%)
0
0.0% (0.0%)
0
22.0% (12.7%)
41
Grade 4 179 0.0% (0.0%)
0
7.3% (0.8%)
13
17.3% (9.4%)
31
22.3% (0.0%)
40
36.9% (-7.7%)
66
16.2% (-2.5%)
29
0.0% (0.0%)
0
0.0% (0.0%)
0
0.0% (0.0%)
0
0.0% (0.0%)
0
0.0% (0.0%)
0
0.0% (0.0%)
0
0.0% (0.0%)
0
0.0% (0.0%)
0
16.2% (-2.5%)
29
Grade 5 154 0.0% (0.0%)
0
3.9% (3.1%)
6
9.7% (6.8%)
15
11.7% (2.0%)
18
15.6% (-0.1%)
24
37.0% (-10.0%)
57
22.1% (-1.8%)
34
0.0% (0.0%)
0
0.0% (0.0%)
0
0.0% (0.0%)
0
0.0% (0.0%)
0
0.0% (0.0%)
0
0.0% (0.0%)
0
0.0% (0.0%)
0
22.1% (-1.8%)
34
Grade 6 146 0.0% (0.0%)
0
0.7% (-1.5%)
1
2.1% (-2.2%)
3
8.2% (1.1%)
12
14.4% (3.7%)
21
16.4% (5.0%)
24
34.2% (2.8%)
50
23.3% (-9.6%)
34
0.7% (0.7%)
1
0.0% (0.0%)
0
0.0% (0.0%)
0
0.0% (0.0%)
0
0.0% (0.0%)
0
0.0% (0.0%)
0
24.0% (-8.9%)
35
Grade 7 130 0.0% (0.0%)
0
1.5% (1.5%)
2
2.3% (1.5%)
3
2.3% (-2.6%)
3
4.6% (-1.9%)
6
12.3% (1.7%)
16
10.8% (-7.1%)
14
40.0% (9.1%)
52
26.2% (-2.3%)
34
0.0% (0.0%)
0
0.0% (0.0%)
0
0.0% (0.0%)
0
0.0% (0.0%)
0
0.0% (0.0%)
0
26.2% (-2.3%)
34
Grade 8 133 0.0% (0.0%)
0
0.0% (0.0%)
0
3.0% (-1.5%)
4
5.3% (1.5%)
7
10.5% (3.1%)
14
8.3% (-7.4%)
11
13.5% (2.3%)
18
10.5% (-5.1%)
14
27.8% (2.4%)
37
21.1% (4.6%)
28
0.0% (0.0%)
0
0.0% (0.0%)
0
0.0% (0.0%)
0
0.0% (0.0%)
0
21.1% (4.6%)
28
Grade 9 87 0.0% (0.0%)
0
0.0% (-1.6%)
0
1.1% (-2.1%)
1
1.1% (-2.1%)
1
4.6% (3.0%)
4
13.8% (0.9%)
12
9.2% (4.4%)
8
6.9% (-1.2%)
6
18.4% (2.3%)
16
11.5% (-6.2%)
10
33.3% (2.7%)
29
0.0% (0.0%)
0
0.0% (0.0%)
0
0.0% (0.0%)
0
33.3% (2.7%)
29
Grade 10 73 0.0% (0.0%)
0
2.7% (2.7%)
2
4.1% (1.6%)
3
0.0% (-2.5%)
0
6.8% (4.3%)
5
9.6% (-7.9%)
7
4.1% (-8.4%)
3
9.6% (-10.4%)
7
6.8% (1.8%)
5
11.0% (1.0%)
8
21.9% (16.9%)
16
23.3% (0.8%)
17
0.0% (0.0%)
0
0.0% (0.0%)
0
23.3% (0.8%)
17
Grade 11 39 0.0% (0.0%)
0
0.0% (0.0%)
0
0.0% (0.0%)
0
5.1% (1.6%)
2
5.1% (5.1%)
2
10.3% (3.1%)
4
2.6% (-4.6%)
1
15.4% (4.7%)
6
5.1% (-12.7%)
2
10.3% (-7.6%)
4
30.8% (2.2%)
12
10.3% (6.7%)
4
5.1% (1.6%)
2
0.0% (0.0%)
0
5.1% (1.6%)
2
Office of Equity and Access i-Ready Math Report D3 10/21/2020Page 7
Note: Blank cells in this report indicate that there were no students in the specific placement category. A percentage of 0.0% reflects a small percentage value between 0.01% and 0.049%. Cells highlighted in blue indicate percentage of students who are on or above grade level in their i-Ready Performance based on i-Ready's Standard View. In 2019-20 grade K was was not reqquired to participate in Diagnostic 1.
* Cell Value Key: Current Year Diagnostic 1 % of Test Takers in Placement Level Category (% Change in Placement Category from Prior Year Diagnostic 1 Students)
Current Year Diagnostic 1 Count of Test Takers in Placement Category
i-Ready Diagnostic 1 Standard View Student Group Reports2020-21 Summary*
i-ReadyMathD3
White
Level6
Level4
Level3
Level2
Level1
LevelK
LevelPreK
Tests Taker CountsGrade Level
i-Ready Performance Grade Level Placement
Level5
Level8
Level7
Level9
Level 10
Level 11
Level12
On Track Total
Grade K 282 30.1% (-53.2%)
85
68.8% (52.1%)
194
1.1% (1.1%)
3
0.0% (0.0%)
0
0.0% (0.0%)
0
0.0% (0.0%)
0
0.0% (0.0%)
0
0.0% (0.0%)
0
0.0% (0.0%)
0
0.0% (0.0%)
0
0.0% (0.0%)
0
0.0% (0.0%)
0
0.0% (0.0%)
0
0.0% (0.0%)
0
69.9% (53.2%)
197
Grade 1 394 7.9% (-15.4%)
31
53.0% (-12.3%)
209
39.1% (27.7%)
154
0.0% (0.0%)
0
0.0% (0.0%)
0
0.0% (0.0%)
0
0.0% (0.0%)
0
0.0% (0.0%)
0
0.0% (0.0%)
0
0.0% (0.0%)
0
0.0% (0.0%)
0
0.0% (0.0%)
0
0.0% (0.0%)
0
0.0% (0.0%)
0
39.1% (27.7%)
154
Grade 2 383 0.0% (0.0%)
0
20.9% (-10.5%)
80
48.8% (-6.2%)
187
29.8% (16.2%)
114
0.3% (0.3%)
1
0.0% (0.0%)
0
0.3% (0.3%)
1
0.0% (0.0%)
0
0.0% (0.0%)
0
0.0% (0.0%)
0
0.0% (0.0%)
0
0.0% (0.0%)
0
0.0% (0.0%)
0
0.0% (0.0%)
0
30.3% (16.7%)
116
Grade 3 440 0.0% (0.0%)
0
9.8% (2.7%)
43
18.6% (0.8%)
82
49.1% (-8.1%)
216
22.0% (4.0%)
97
0.2% (0.2%)
1
0.2% (0.2%)
1
0.0% (0.0%)
0
0.0% (0.0%)
0
0.0% (0.0%)
0
0.0% (0.0%)
0
0.0% (0.0%)
0
0.0% (0.0%)
0
0.0% (0.0%)
0
22.5% (4.5%)
99
Grade 4 433 0.0% (0.0%)
0
3.7% (-1.6%)
16
7.4% (-0.9%)
32
20.1% (3.8%)
87
43.9% (-0.9%)
190
24.9% (-0.6%)
108
0.0% (0.0%)
0
0.0% (0.0%)
0
0.0% (0.0%)
0
0.0% (0.0%)
0
0.0% (0.0%)
0
0.0% (0.0%)
0
0.0% (0.0%)
0
0.0% (0.0%)
0
24.9% (-0.6%)
108
Grade 5 442 0.0% (0.0%)
0
3.4% (0.0%)
15
5.0% (0.6%)
22
10.0% (0.9%)
44
16.3% (2.6%)
72
38.5% (-0.7%)
170
26.9% (-3.4%)
119
0.0% (0.0%)
0
0.0% (0.0%)
0
0.0% (0.0%)
0
0.0% (0.0%)
0
0.0% (0.0%)
0
0.0% (0.0%)
0
0.0% (0.0%)
0
26.9% (-3.4%)
119
Grade 6 430 0.0% (0.0%)
0
1.9% (0.2%)
8
3.3% (0.3%)
14
5.8% (1.2%)
25
10.2% (1.2%)
44
14.2% (0.1%)
61
34.4% (-0.4%)
148
30.2% (-2.6%)
130
0.0% (0.0%)
0
0.0% (0.0%)
0
0.0% (0.0%)
0
0.0% (0.0%)
0
0.0% (0.0%)
0
0.0% (0.0%)
0
30.2% (-2.6%)
130
Grade 7 373 0.0% (0.0%)
0
1.1% (0.8%)
4
2.4% (0.4%)
9
4.8% (0.1%)
18
5.4% (-1.4%)
20
7.5% (-1.2%)
28
12.6% (2.8%)
47
33.5% (-2.2%)
125
32.2% (0.1%)
120
0.3% (0.3%)
1
0.3% (0.3%)
1
0.0% (0.0%)
0
0.0% (0.0%)
0
0.0% (0.0%)
0
32.7% (0.7%)
122
Grade 8 346 0.0% (0.0%)
0
1.2% (-0.3%)
4
1.7% (-0.7%)
6
4.3% (0.4%)
15
7.2% (1.4%)
25
5.5% (-0.4%)
19
10.7% (0.9%)
37
9.5% (-2.0%)
33
30.3% (3.7%)
105
28.0% (-4.0%)
97
0.6% (0.6%)
2
0.6% (0.1%)
2
0.3% (0.3%)
1
0.0% (0.0%)
0
29.5% (-3.0%)
102
Grade 9 326 0.0% (0.0%)
0
1.2% (0.5%)
4
1.8% (-0.2%)
6
3.4% (0.7%)
11
2.1% (-0.9%)
7
6.1% (0.4%)
20
6.1% (-1.7%)
20
8.0% (-6.3%)
26
14.7% (4.2%)
48
9.2% (-1.6%)
30
46.6% (4.3%)
152
0.0% (0.0%)
0
0.0% (0.0%)
0
0.6% (0.6%)
2
47.2% (4.9%)
154
Grade 10 258 0.0% (0.0%)
0
0.8% (0.3%)
2
2.3% (0.5%)
6
5.4% (2.6%)
14
7.0% (4.2%)
18
5.8% (-3.0%)
15
7.0% (2.8%)
18
10.9% (1.6%)
28
12.4% (-0.6%)
32
8.5% (-4.5%)
22
12.4% (-4.3%)
32
27.1% (0.2%)
70
0.4% (0.4%)
1
0.0% (0.0%)
0
27.5% (0.5%)
71
Grade 11 149 0.0% (0.0%)
0
1.3% (1.3%)
2
2.0% (-0.3%)
3
5.4% (1.5%)
8
6.0% (0.7%)
9
7.4% (4.3%)
11
8.7% (3.3%)
13
7.4% (1.2%)
11
10.1% (4.7%)
15
16.8% (-2.5%)
25
21.5% (-10.8%)
32
10.7% (-2.3%)
16
2.7% (-1.2%)
4
0.0% (0.0%)
0
2.7% (-1.2%)
4
Office of Equity and Access i-Ready Math Report D3 10/21/2020Page 8
Note: Blank cells in this report indicate that there were no students in the specific placement category. A percentage of 0.0% reflects a small percentage value between 0.01% and 0.049%. Cells highlighted in blue indicate percentage of students who are on or above grade level in their i-Ready Performance based on i-Ready's Standard View. In 2019-20 grade K was was not reqquired to participate in Diagnostic 1.
* Cell Value Key: Current Year Diagnostic 1 % of Test Takers in Placement Level Category (% Change in Placement Category from Prior Year Diagnostic 1 Students)
Current Year Diagnostic 1 Count of Test Takers in Placement Category
i-Ready Diagnostic 1 Standard View Student Group Reports2020-21 Summary*
i-ReadyMathD3
English Learners
Level6
Level4
Level3
Level2
Level1
LevelK
LevelPreK
Tests Taker CountsGrade Level
i-Ready Performance Grade Level Placement
Level5
Level8
Level7
Level9
Level 10
Level 11
Level12
On Track Total
Grade K 564 48.8% (-44.3%)
275
49.3% (42.4%)
278
2.0% (2.0%)
11
0.0% (0.0%)
0
0.0% (0.0%)
0
0.0% (0.0%)
0
0.0% (0.0%)
0
0.0% (0.0%)
0
0.0% (0.0%)
0
0.0% (0.0%)
0
0.0% (0.0%)
0
0.0% (0.0%)
0
0.0% (0.0%)
0
0.0% (0.0%)
0
51.2% (44.3%)
289
Grade 1 953 11.8% (-25.0%)
112
58.6% (-2.3%)
558
29.6% (27.2%)
282
0.1% (0.1%)
1
0.0% (0.0%)
0
0.0% (0.0%)
0
0.0% (0.0%)
0
0.0% (0.0%)
0
0.0% (0.0%)
0
0.0% (0.0%)
0
0.0% (0.0%)
0
0.0% (0.0%)
0
0.0% (0.0%)
0
0.0% (0.0%)
0
29.7% (27.3%)
283
Grade 2 1,123 0.0% (0.0%)
0
41.1% (-14.4%)
461
45.0% (1.4%)
505
14.0% (13.0%)
157
0.0% (0.0%)
0
0.0% (0.0%)
0
0.0% (0.0%)
0
0.0% (0.0%)
0
0.0% (0.0%)
0
0.0% (0.0%)
0
0.0% (0.0%)
0
0.0% (0.0%)
0
0.0% (0.0%)
0
0.0% (0.0%)
0
14.0% (13.0%)
157
Grade 3 1,191 0.0% (0.0%)
0
20.8% (-3.2%)
248
34.8% (-5.7%)
415
36.9% (2.9%)
439
7.4% (5.9%)
88
0.0% (0.0%)
0
0.1% (0.1%)
1
0.0% (0.0%)
0
0.0% (0.0%)
0
0.0% (0.0%)
0
0.0% (0.0%)
0
0.0% (0.0%)
0
0.0% (0.0%)
0
0.0% (0.0%)
0
7.5% (6.0%)
89
Grade 4 1,044 0.0% (0.0%)
0
13.9% (1.8%)
145
25.7% (3.7%)
268
29.3% (0.0%)
306
27.7% (-6.7%)
289
3.4% (1.2%)
36
0.0% (0.0%)
0
0.0% (0.0%)
0
0.0% (0.0%)
0
0.0% (0.0%)
0
0.0% (0.0%)
0
0.0% (0.0%)
0
0.0% (0.0%)
0
0.0% (0.0%)
0
3.4% (1.2%)
36
Grade 5 951 0.0% (0.0%)
0
9.7% (5.1%)
92
16.1% (5.6%)
153
23.4% (5.7%)
223
20.1% (-6.5%)
191
26.3% (-9.3%)
250
4.4% (-0.6%)
42
0.0% (0.0%)
0
0.0% (0.0%)
0
0.0% (0.0%)
0
0.0% (0.0%)
0
0.0% (0.0%)
0
0.0% (0.0%)
0
0.0% (0.0%)
0
4.4% (-0.6%)
42
Grade 6 1,040 0.0% (0.0%)
0
5.5% (2.0%)
57
10.0% (3.3%)
104
14.6% (-1.3%)
152
21.2% (-1.2%)
220
22.8% (-1.2%)
237
22.4% (-2.4%)
233
3.6% (0.7%)
37
0.0% (0.0%)
0
0.0% (0.0%)
0
0.0% (0.0%)
0
0.0% (0.0%)
0
0.0% (0.0%)
0
0.0% (0.0%)
0
3.6% (0.7%)
37
Grade 7 675 0.0% (0.0%)
0
2.8% (-0.1%)
19
6.5% (-0.7%)
44
10.8% (-5.5%)
73
16.6% (-4.2%)
112
22.4% (2.8%)
151
15.3% (3.2%)
103
22.1% (3.0%)
149
3.6% (1.4%)
24
0.0% (0.0%)
0
0.0% (0.0%)
0
0.0% (0.0%)
0
0.0% (0.0%)
0
0.0% (0.0%)
0
3.6% (1.4%)
24
Grade 8 575 0.0% (0.0%)
0
3.8% (0.5%)
22
7.1% (-3.0%)
41
15.0% (0.2%)
86
17.7% (-3.0%)
102
16.3% (-4.7%)
94
12.2% (-0.6%)
70
11.1% (1.3%)
64
12.9% (6.6%)
74
3.7% (2.5%)
21
0.2% (0.2%)
1
0.0% (0.0%)
0
0.0% (0.0%)
0
0.0% (0.0%)
0
3.8% (2.7%)
22
Grade 9 305 0.0% (0.0%)
0
2.0% (0.8%)
6
8.2% (-1.1%)
25
8.2% (-6.1%)
25
14.8% (-8.0%)
45
19.0% (5.1%)
58
16.4% (3.7%)
50
10.8% (-3.1%)
33
11.5% (3.4%)
35
7.2% (4.5%)
22
2.0% (0.8%)
6
0.0% (0.0%)
0
0.0% (0.0%)
0
0.0% (0.0%)
0
2.0% (0.8%)
6
Grade 10 264 0.0% (0.0%)
0
1.5% (-1.0%)
4
5.3% (-2.7%)
14
9.1% (0.5%)
24
20.1% (3.0%)
53
18.2% (-6.4%)
48
10.2% (-2.8%)
27
9.8% (-0.2%)
26
11.0% (2.9%)
29
4.9% (1.4%)
13
6.1% (3.0%)
16
3.8% (2.3%)
10
0.0% (0.0%)
0
0.0% (0.0%)
0
3.8% (2.3%)
10
Grade 11 189 0.0% (0.0%)
0
3.2% (2.5%)
6
3.7% (0.3%)
7
9.0% (2.9%)
17
13.2% (-7.2%)
25
12.2% (-7.6%)
23
11.1% (-1.1%)
21
19.6% (2.6%)
37
9.5% (1.4%)
18
9.5% (3.4%)
18
7.9% (2.5%)
15
0.0% (-0.7%)
0
1.1% (1.1%)
2
0.0% (0.0%)
0
1.1% (1.1%)
2
Office of Equity and Access i-Ready Math Report D3 10/21/2020Page 9
Note: Blank cells in this report indicate that there were no students in the specific placement category. A percentage of 0.0% reflects a small percentage value between 0.01% and 0.049%. Cells highlighted in blue indicate percentage of students who are on or above grade level in their i-Ready Performance based on i-Ready's Standard View. In 2019-20 grade K was was not reqquired to participate in Diagnostic 1.
* Cell Value Key: Current Year Diagnostic 1 % of Test Takers in Placement Level Category (% Change in Placement Category from Prior Year Diagnostic 1 Students)
Current Year Diagnostic 1 Count of Test Takers in Placement Category
i-Ready Diagnostic 1 Standard View Student Group Reports2020-21 Summary*
i-ReadyMathD3
Foster Youth
Level6
Level4
Level3
Level2
Level1
LevelK
LevelPreK
Tests Taker CountsGrade Level
i-Ready Performance Grade Level Placement
Level5
Level8
Level7
Level9
Level 10
Level 11
Level12
On Track Total
Grade K 21 38.1% (-61.9%)
8
61.9% (61.9%)
13
0.0% (0.0%)
0
0.0% (0.0%)
0
0.0% (0.0%)
0
0.0% (0.0%)
0
0.0% (0.0%)
0
0.0% (0.0%)
0
0.0% (0.0%)
0
0.0% (0.0%)
0
0.0% (0.0%)
0
0.0% (0.0%)
0
0.0% (0.0%)
0
0.0% (0.0%)
0
61.9% (61.9%)
13
Grade 1 22 36.4% (-6.0%)
8
36.4% (-21.3%)
8
27.3% (27.3%)
6
0.0% (0.0%)
0
0.0% (0.0%)
0
0.0% (0.0%)
0
0.0% (0.0%)
0
0.0% (0.0%)
0
0.0% (0.0%)
0
0.0% (0.0%)
0
0.0% (0.0%)
0
0.0% (0.0%)
0
0.0% (0.0%)
0
0.0% (0.0%)
0
27.3% (27.3%)
6
Grade 2 31 0.0% (0.0%)
0
54.8% (4.1%)
17
41.9% (-4.3%)
13
3.2% (0.2%)
1
0.0% (0.0%)
0
0.0% (0.0%)
0
0.0% (0.0%)
0
0.0% (0.0%)
0
0.0% (0.0%)
0
0.0% (0.0%)
0
0.0% (0.0%)
0
0.0% (0.0%)
0
0.0% (0.0%)
0
0.0% (0.0%)
0
3.2% (0.2%)
1
Grade 3 28 0.0% (0.0%)
0
32.1% (-0.1%)
9
28.6% (3.1%)
8
32.1% (-10.2%)
9
7.1% (7.1%)
2
0.0% (0.0%)
0
0.0% (0.0%)
0
0.0% (0.0%)
0
0.0% (0.0%)
0
0.0% (0.0%)
0
0.0% (0.0%)
0
0.0% (0.0%)
0
0.0% (0.0%)
0
0.0% (0.0%)
0
7.1% (7.1%)
2
Grade 4 33 0.0% (0.0%)
0
24.2% (18.4%)
8
15.2% (-6.9%)
5
27.3% (-5.1%)
9
27.3% (-2.1%)
9
6.1% (-4.2%)
2
0.0% (0.0%)
0
0.0% (0.0%)
0
0.0% (0.0%)
0
0.0% (0.0%)
0
0.0% (0.0%)
0
0.0% (0.0%)
0
0.0% (0.0%)
0
0.0% (0.0%)
0
6.1% (-4.2%)
2
Grade 5 34 0.0% (0.0%)
0
5.9% (-3.1%)
2
11.8% (4.3%)
4
17.6% (2.7%)
6
17.6% (-4.7%)
6
32.4% (1.0%)
11
14.7% (-0.2%)
5
0.0% (0.0%)
0
0.0% (0.0%)
0
0.0% (0.0%)
0
0.0% (0.0%)
0
0.0% (0.0%)
0
0.0% (0.0%)
0
0.0% (0.0%)
0
14.7% (-0.2%)
5
Grade 6 26 0.0% (0.0%)
0
15.4% (9.1%)
4
15.4% (1.3%)
4
15.4% (6.0%)
4
7.7% (-22.0%)
2
26.9% (20.7%)
7
11.5% (-13.5%)
3
7.7% (-1.7%)
2
0.0% (0.0%)
0
0.0% (0.0%)
0
0.0% (0.0%)
0
0.0% (0.0%)
0
0.0% (0.0%)
0
0.0% (0.0%)
0
7.7% (-1.7%)
2
Grade 7 24 0.0% (0.0%)
0
0.0% (-4.3%)
0
12.5% (1.6%)
3
20.8% (3.4%)
5
12.5% (3.8%)
3
29.2% (18.3%)
7
0.0% (-15.2%)
0
16.7% (-2.9%)
4
8.3% (-4.7%)
2
0.0% (0.0%)
0
0.0% (0.0%)
0
0.0% (0.0%)
0
0.0% (0.0%)
0
0.0% (0.0%)
0
8.3% (-4.7%)
2
Grade 8 34 0.0% (0.0%)
0
8.8% (6.3%)
3
11.8% (9.2%)
4
2.9% (-7.3%)
1
17.6% (-2.9%)
6
11.8% (-3.6%)
4
14.7% (4.4%)
5
14.7% (7.0%)
5
14.7% (-10.9%)
5
2.9% (-2.2%)
1
0.0% (0.0%)
0
0.0% (0.0%)
0
0.0% (0.0%)
0
0.0% (0.0%)
0
2.9% (-2.2%)
1
Grade 9 19 0.0% (0.0%)
0
0.0% (-6.3%)
0
15.8% (9.5%)
3
5.3% (-1.0%)
1
21.1% (2.3%)
4
26.3% (7.6%)
5
0.0% (-6.3%)
0
10.5% (4.3%)
2
5.3% (-1.0%)
1
5.3% (-13.5%)
1
10.5% (4.3%)
2
0.0% (0.0%)
0
0.0% (0.0%)
0
0.0% (0.0%)
0
10.5% (4.3%)
2
Grade 10 25 0.0% (0.0%)
0
8.0% (1.3%)
2
4.0% (4.0%)
1
4.0% (-2.7%)
1
16.0% (-4.0%)
4
12.0% (-14.7%)
3
20.0% (13.3%)
5
8.0% (1.3%)
2
4.0% (-2.7%)
1
4.0% (-2.7%)
1
16.0% (9.3%)
4
4.0% (-2.7%)
1
0.0% (0.0%)
0
0.0% (0.0%)
0
4.0% (-2.7%)
1
Grade 11 12 0.0% (0.0%)
0
8.3% (8.3%)
1
0.0% (0.0%)
0
8.3% (8.3%)
1
8.3% (-25.0%)
1
16.7% (-5.6%)
2
16.7% (16.7%)
2
8.3% (-2.8%)
1
0.0% (-11.1%)
0
8.3% (-2.8%)
1
16.7% (5.6%)
2
8.3% (8.3%)
1
0.0% (0.0%)
0
0.0% (0.0%)
0
0.0% (0.0%)
0
Office of Equity and Access i-Ready Math Report D3 10/21/2020Page 10
Note: Blank cells in this report indicate that there were no students in the specific placement category. A percentage of 0.0% reflects a small percentage value between 0.01% and 0.049%. Cells highlighted in blue indicate percentage of students who are on or above grade level in their i-Ready Performance based on i-Ready's Standard View. In 2019-20 grade K was was not reqquired to participate in Diagnostic 1.
* Cell Value Key: Current Year Diagnostic 1 % of Test Takers in Placement Level Category (% Change in Placement Category from Prior Year Diagnostic 1 Students)
Current Year Diagnostic 1 Count of Test Takers in Placement Category
i-Ready Diagnostic 1 Standard View Student Group Reports2020-21 Summary*
i-ReadyMathD3
Homeless
Level6
Level4
Level3
Level2
Level1
LevelK
LevelPreK
Tests Taker CountsGrade Level
i-Ready Performance Grade Level Placement
Level5
Level8
Level7
Level9
Level 10
Level 11
Level12
On Track Total
Grade K 10 60.0% (-40.0%)
6
40.0% (40.0%)
4
0.0% (0.0%)
0
0.0% (0.0%)
0
0.0% (0.0%)
0
0.0% (0.0%)
0
0.0% (0.0%)
0
0.0% (0.0%)
0
0.0% (0.0%)
0
0.0% (0.0%)
0
0.0% (0.0%)
0
0.0% (0.0%)
0
0.0% (0.0%)
0
0.0% (0.0%)
0
40.0% (40.0%)
4
Grade 1 7 14.3% (-24.2%)
1
42.9% (-18.7%)
3
42.9% (42.9%)
3
0.0% (0.0%)
0
0.0% (0.0%)
0
0.0% (0.0%)
0
0.0% (0.0%)
0
0.0% (0.0%)
0
0.0% (0.0%)
0
0.0% (0.0%)
0
0.0% (0.0%)
0
0.0% (0.0%)
0
0.0% (0.0%)
0
0.0% (0.0%)
0
42.9% (42.9%)
3
Grade 2 9 0.0% (0.0%)
0
33.3% (-26.7%)
3
55.6% (20.6%)
5
11.1% (6.1%)
1
0.0% (0.0%)
0
0.0% (0.0%)
0
0.0% (0.0%)
0
0.0% (0.0%)
0
0.0% (0.0%)
0
0.0% (0.0%)
0
0.0% (0.0%)
0
0.0% (0.0%)
0
0.0% (0.0%)
0
0.0% (0.0%)
0
11.1% (6.1%)
1
Grade 3 6 0.0% (0.0%)
0
16.7% (16.7%)
1
33.3% (2.6%)
2
33.3% (-35.9%)
2
16.7% (16.7%)
1
0.0% (0.0%)
0
0.0% (0.0%)
0
0.0% (0.0%)
0
0.0% (0.0%)
0
0.0% (0.0%)
0
0.0% (0.0%)
0
0.0% (0.0%)
0
0.0% (0.0%)
0
0.0% (0.0%)
0
16.7% (16.7%)
1
Grade 4 8 0.0% (0.0%)
0
12.5% (-4.2%)
1
25.0% (13.9%)
2
37.5% (-1.4%)
3
12.5% (-15.3%)
1
12.5% (6.9%)
1
0.0% (0.0%)
0
0.0% (0.0%)
0
0.0% (0.0%)
0
0.0% (0.0%)
0
0.0% (0.0%)
0
0.0% (0.0%)
0
0.0% (0.0%)
0
0.0% (0.0%)
0
12.5% (6.9%)
1
Grade 5 6 0.0% (0.0%)
0
16.7% (4.2%)
1
33.3% (27.1%)
2
33.3% (2.1%)
2
0.0% (-25.0%)
0
16.7% (-8.3%)
1
0.0% (0.0%)
0
0.0% (0.0%)
0
0.0% (0.0%)
0
0.0% (0.0%)
0
0.0% (0.0%)
0
0.0% (0.0%)
0
0.0% (0.0%)
0
0.0% (0.0%)
0
0.0% (0.0%)
0
Grade 6 12 0.0% (0.0%)
0
8.3% (8.3%)
1
8.3% (-2.2%)
1
8.3% (-7.5%)
1
8.3% (-7.5%)
1
8.3% (-12.7%)
1
50.0% (23.7%)
6
8.3% (-2.2%)
1
0.0% (0.0%)
0
0.0% (0.0%)
0
0.0% (0.0%)
0
0.0% (0.0%)
0
0.0% (0.0%)
0
0.0% (0.0%)
0
8.3% (-2.2%)
1
Grade 7 4 0.0% (0.0%)
0
0.0% (0.0%)
0
0.0% (-5.3%)
0
0.0% (-5.3%)
0
0.0% (-36.8%)
0
0.0% (-10.5%)
0
0.0% (-10.5%)
0
75.0% (59.2%)
3
25.0% (9.2%)
1
0.0% (0.0%)
0
0.0% (0.0%)
0
0.0% (0.0%)
0
0.0% (0.0%)
0
0.0% (0.0%)
0
25.0% (9.2%)
1
Grade 8 7 0.0% (0.0%)
0
0.0% (0.0%)
0
0.0% (-21.4%)
0
0.0% (-7.1%)
0
14.3% (0.0%)
1
0.0% (-14.3%)
0
14.3% (-14.3%)
1
14.3% (7.1%)
1
42.9% (42.9%)
3
14.3% (7.1%)
1
0.0% (0.0%)
0
0.0% (0.0%)
0
0.0% (0.0%)
0
0.0% (0.0%)
0
14.3% (7.1%)
1
Grade 9 1 0.0% (0.0%)
0
0.0% (0.0%)
0
0.0% (0.0%)
0
0.0% (0.0%)
0
0.0% (0.0%)
0
0.0% (-25.0%)
0
0.0% (0.0%)
0
0.0% (-25.0%)
0
100.0% (50.0%)
1
0.0% (0.0%)
0
0.0% (0.0%)
0
0.0% (0.0%)
0
0.0% (0.0%)
0
0.0% (0.0%)
0
0.0% (0.0%)
0
Grade 10 6 0.0% (0.0%)
0
0.0% (0.0%)
0
16.7% (16.7%)
1
0.0% (0.0%)
0
0.0% (0.0%)
0
16.7% (16.7%)
1
0.0% (0.0%)
0
16.7% (-16.7%)
1
16.7% (-16.7%)
1
0.0% (0.0%)
0
16.7% (-16.7%)
1
16.7% (16.7%)
1
0.0% (0.0%)
0
0.0% (0.0%)
0
16.7% (16.7%)
1
Office of Equity and Access i-Ready Math Report D3 10/21/2020Page 11
Note: Blank cells in this report indicate that there were no students in the specific placement category. A percentage of 0.0% reflects a small percentage value between 0.01% and 0.049%. Cells highlighted in blue indicate percentage of students who are on or above grade level in their i-Ready Performance based on i-Ready's Standard View. In 2019-20 grade K was was not reqquired to participate in Diagnostic 1.
* Cell Value Key: Current Year Diagnostic 1 % of Test Takers in Placement Level Category (% Change in Placement Category from Prior Year Diagnostic 1 Students)
Current Year Diagnostic 1 Count of Test Takers in Placement Category
i-Ready Diagnostic 1 Standard View Student Group Reports2020-21 Summary*
i-ReadyMathD3
Socioeconomically Disadvantaged
Level6
Level4
Level3
Level2
Level1
LevelK
LevelPreK
Tests Taker CountsGrade Level
i-Ready Performance Grade Level Placement
Level5
Level8
Level7
Level9
Level 10
Level 11
Level12
On Track Total
Grade K 2,571 48.0% (-47.5%)
1234
50.7% (46.2%)
1303
1.3% (1.3%)
34
0.0% (0.0%)
0
0.0% (0.0%)
0
0.0% (0.0%)
0
0.0% (0.0%)
0
0.0% (0.0%)
0
0.0% (0.0%)
0
0.0% (0.0%)
0
0.0% (0.0%)
0
0.0% (0.0%)
0
0.0% (0.0%)
0
0.0% (0.0%)
0
52.0% (47.5%)
1337
Grade 1 3,780 11.7% (-22.6%)
442
59.2% (-4.3%)
2236
29.0% (26.8%)
1098
0.0% (0.0%)
1
0.1% (0.1%)
2
0.0% (0.0%)
1
0.0% (0.0%)
0
0.0% (0.0%)
0
0.0% (0.0%)
0
0.0% (0.0%)
0
0.0% (0.0%)
0
0.0% (0.0%)
0
0.0% (0.0%)
0
0.0% (0.0%)
0
29.2% (26.9%)
1102
Grade 2 4,145 0.0% (0.0%)
0
35.6% (-9.1%)
1476
47.0% (-4.4%)
1948
17.3% (13.5%)
718
0.0% (0.0%)
1
0.0% (0.0%)
0
0.0% (0.0%)
2
0.0% (0.0%)
0
0.0% (0.0%)
0
0.0% (0.0%)
0
0.0% (0.0%)
0
0.0% (0.0%)
0
0.0% (0.0%)
0
0.0% (0.0%)
0
17.4% (13.5%)
721
Grade 3 4,479 0.0% (0.0%)
0
15.8% (0.2%)
708
30.4% (2.0%)1361
43.2% (-5.1%)
1934
10.5% (2.9%)
472
0.0% (0.0%)
2
0.0% (0.0%)
1
0.0% (0.0%)
1
0.0% (0.0%)
0
0.0% (0.0%)
0
0.0% (0.0%)
0
0.0% (0.0%)
0
0.0% (0.0%)
0
0.0% (0.0%)
0
10.6% (3.0%)
476
Grade 4 4,436 0.0% (0.0%)
0
8.7% (2.3%)
386
16.4% (2.8%)
728
24.3% (2.6%)1076
40.1% (-5.7%)
1781
10.5% (-2.0%)
465
0.0% (0.0%)
0
0.0% (0.0%)
0
0.0% (0.0%)
0
0.0% (0.0%)
0
0.0% (0.0%)
0
0.0% (0.0%)
0
0.0% (0.0%)
0
0.0% (0.0%)
0
10.5% (-2.0%)
465
Grade 5 4,548 0.0% (0.0%)
0
4.9% (1.6%)
225
10.1% (2.7%)
459
15.1% (2.1%)
686
17.8% (-0.4%)
811
38.9% (-3.7%)
1769
13.0% (-2.4%)
593
0.1% (0.1%)
5
0.0% (0.0%)
0
0.0% (0.0%)
0
0.0% (0.0%)
0
0.0% (0.0%)
0
0.0% (0.0%)
0
0.0% (0.0%)
0
13.1% (-2.3%)
598
Grade 6 4,215 0.0% (0.0%)
0
2.8% (0.8%)
119
6.0% (1.0%)
253
10.0% (0.7%)
423
15.1% (0.7%)
636
18.7% (0.1%)
788
33.2% (-0.7%)
1401
14.1% (-2.7%)
594
0.0% (0.0%)
1
0.0% (0.0%)
0
0.0% (0.0%)
0
0.0% (0.0%)
0
0.0% (0.0%)
0
0.0% (0.0%)
0
14.1% (-2.7%)
595
Grade 7 3,461 0.0% (0.0%)
0
1.5% (0.1%)
52
3.0% (-0.3%)
105
6.1% (-2.4%)
210
10.1% (-2.5%)
351
13.2% (-0.8%)
458
14.7% (2.0%)
508
33.8% (0.1%)1170
17.5% (3.7%)
604
0.0% (0.0%)
1
0.0% (0.0%)
1
0.0% (0.0%)
1
0.0% (0.0%)
0
0.0% (0.0%)
0
17.5% (3.8%)
607
Grade 8 3,246 0.0% (0.0%)
0
1.7% (0.2%)
55
3.5% (-0.4%)
115
6.6% (-0.5%)
215
10.5% (-0.6%)
342
11.5% (-2.0%)
373
12.2% (-0.7%)
395
12.8% (-1.7%)
415
24.6% (1.0%)
799
16.5% (4.6%)
534
0.1% (0.1%)
2
0.0% (0.0%)
0
0.0% (0.0%)
1
0.0% (0.0%)
0
16.5% (4.7%)
537
Grade 9 2,378 0.0% (0.0%)
0
1.1% (-0.1%)
25
2.9% (0.0%)
70
4.3% (-1.7%)
103
6.9% (-3.5%)
164
10.0% (-2.1%)
238
10.5% (-0.7%)
250
12.2% (-4.4%)
289
14.0% (0.9%)
334
12.2% (2.7%)
290
25.9% (9.0%)
615
0.0% (0.0%)
0
0.0% (0.0%)
0
0.0% (0.0%)
0
25.9% (9.0%)
615
Grade 10 1,870 0.0% (0.0%)
0
1.1% (0.4%)
20
2.0% (-0.3%)
38
4.9% (0.2%)
92
9.5% (1.4%)
178
9.1% (-4.0%)
171
9.4% (-0.2%)
175
12.2% (-3.0%)
228
12.3% (-0.7%)
230
11.3% (1.4%)
212
12.6% (1.9%)
236
15.4% (2.8%)
288
0.1% (0.1%)
2
0.0% (0.0%)
0
15.5% (2.9%)
290
Grade 11 1,437 0.0% (0.0%)
0
1.3% (1.1%)
18
1.9% (1.2%)
27
4.0% (-0.3%)
57
7.2% (-1.0%)
103
9.0% (-1.9%)
130
8.8% (0.5%)
126
13.3% (0.1%)
191
11.9% (-1.9%)
171
12.7% (0.6%)
182
22.5% (-0.8%)
324
6.0% (1.6%)
86
1.5% (0.7%)
22
0.0% (0.0%)
0
1.5% (0.7%)
22
Office of Equity and Access i-Ready Math Report D3 10/21/2020Page 12
Note: Blank cells in this report indicate that there were no students in the specific placement category. A percentage of 0.0% reflects a small percentage value between 0.01% and 0.049%. Cells highlighted in blue indicate percentage of students who are on or above grade level in their i-Ready Performance based on i-Ready's Standard View. In 2019-20 grade K was was not reqquired to participate in Diagnostic 1.
* Cell Value Key: Current Year Diagnostic 1 % of Test Takers in Placement Level Category (% Change in Placement Category from Prior Year Diagnostic 1 Students)
Current Year Diagnostic 1 Count of Test Takers in Placement Category
i-Ready Diagnostic 1 Standard View Student Group Reports2020-21 Summary*
i-ReadyMathD3
Students with Disabilities
Level6
Level4
Level3
Level2
Level1
LevelK
LevelPreK
Tests Taker CountsGrade Level
i-Ready Performance Grade Level Placement
Level5
Level8
Level7
Level9
Level 10
Level 11
Level12
On Track Total
Grade K 241 58.1% (-25.2%)
140
41.1% (24.4%)
99
0.8% (0.8%)
2
0.0% (0.0%)
0
0.0% (0.0%)
0
0.0% (0.0%)
0
0.0% (0.0%)
0
0.0% (0.0%)
0
0.0% (0.0%)
0
0.0% (0.0%)
0
0.0% (0.0%)
0
0.0% (0.0%)
0
0.0% (0.0%)
0
0.0% (0.0%)
0
41.9% (25.2%)
101
Grade 1 395 23.8% (-35.7%)
94
57.5% (17.7%)
227
18.7% (18.0%)
74
0.0% (0.0%)
0
0.0% (0.0%)
0
0.0% (0.0%)
0
0.0% (0.0%)
0
0.0% (0.0%)
0
0.0% (0.0%)
0
0.0% (0.0%)
0
0.0% (0.0%)
0
0.0% (0.0%)
0
0.0% (0.0%)
0
0.0% (0.0%)
0
18.7% (18.0%)
74
Grade 2 450 0.0% (0.0%)
0
55.6% (-16.8%)
250
29.1% (3.0%)
131
15.3% (13.8%)
69
0.0% (0.0%)
0
0.0% (0.0%)
0
0.0% (0.0%)
0
0.0% (0.0%)
0
0.0% (0.0%)
0
0.0% (0.0%)
0
0.0% (0.0%)
0
0.0% (0.0%)
0
0.0% (0.0%)
0
0.0% (0.0%)
0
15.3% (13.8%)
69
Grade 3 518 0.0% (0.0%)
0
34.9% (-13.1%)
181
29.5% (4.8%)
153
28.2% (3.3%)
146
7.3% (4.9%)
38
0.0% (0.0%)
0
0.0% (0.0%)
0
0.0% (0.0%)
0
0.0% (0.0%)
0
0.0% (0.0%)
0
0.0% (0.0%)
0
0.0% (0.0%)
0
0.0% (0.0%)
0
0.0% (0.0%)
0
7.3% (4.9%)
38
Grade 4 635 0.0% (0.0%)
0
28.8% (-2.3%)
183
21.7% (-4.3%)
138
21.7% (0.4%)
138
21.6% (3.6%)
137
6.1% (2.5%)
39
0.0% (0.0%)
0
0.0% (0.0%)
0
0.0% (0.0%)
0
0.0% (0.0%)
0
0.0% (0.0%)
0
0.0% (0.0%)
0
0.0% (0.0%)
0
0.0% (0.0%)
0
6.1% (2.5%)
39
Grade 5 648 0.0% (0.0%)
0
21.1% (4.6%)
137
24.4% (-1.3%)
158
21.8% (-2.3%)
141
14.4% (1.3%)
93
13.4% (-2.6%)
87
4.6% (0.1%)
30
0.3% (0.3%)
2
0.0% (0.0%)
0
0.0% (0.0%)
0
0.0% (0.0%)
0
0.0% (0.0%)
0
0.0% (0.0%)
0
0.0% (0.0%)
0
4.9% (0.4%)
32
Grade 6 612 0.0% (0.0%)
0
12.9% (0.7%)
79
19.1% (0.7%)
117
20.3% (-2.1%)
124
17.3% (0.4%)
106
14.4% (1.1%)
88
12.4% (0.3%)
76
3.6% (-1.2%)
22
0.0% (0.0%)
0
0.0% (0.0%)
0
0.0% (0.0%)
0
0.0% (0.0%)
0
0.0% (0.0%)
0
0.0% (0.0%)
0
3.6% (-1.2%)
22
Grade 7 454 0.0% (0.0%)
0
7.7% (-0.2%)
35
15.9% (2.4%)
72
17.6% (-6.8%)
80
19.2% (-2.2%)
87
13.4% (0.8%)
61
8.8% (1.4%)
40
12.1% (1.7%)
55
5.1% (2.6%)
23
0.2% (0.2%)
1
0.0% (0.0%)
0
0.0% (0.0%)
0
0.0% (0.0%)
0
0.0% (0.0%)
0
5.3% (2.8%)
24
Grade 8 419 0.0% (0.0%)
0
6.0% (-0.9%)
25
14.6% (-1.3%)
61
20.3% (-0.3%)
85
21.7% (0.3%)
91
12.4% (-3.7%)
52
9.1% (3.5%)
38
5.5% (0.6%)
23
6.9% (0.1%)
29
3.6% (1.9%)
15
0.0% (0.0%)
0
0.0% (0.0%)
0
0.0% (0.0%)
0
0.0% (0.0%)
0
3.6% (1.9%)
15
Grade 9 272 0.0% (0.0%)
0
5.9% (-0.3%)
16
15.4% (0.1%)
42
14.3% (-5.6%)
39
16.2% (-0.8%)
44
17.3% (2.8%)
47
12.5% (5.0%)
34
5.5% (-4.0%)
15
4.4% (0.7%)
12
2.9% (0.9%)
8
5.5% (1.4%)
15
0.0% (0.0%)
0
0.0% (0.0%)
0
0.0% (0.0%)
0
5.5% (1.4%)
15
Grade 10 220 0.0% (0.0%)
0
5.0% (2.3%)
11
8.2% (-6.1%)
18
17.3% (2.4%)
38
23.2% (6.1%)
51
13.2% (-6.6%)
29
8.2% (-2.8%)
18
10.0% (-0.4%)
22
3.6% (-0.8%)
8
4.5% (4.0%)
10
1.8% (-0.4%)
4
5.0% (2.3%)
11
0.0% (0.0%)
0
0.0% (0.0%)
0
5.0% (2.3%)
11
Grade 11 123 0.0% (0.0%)
0
4.9% (4.1%)
6
7.3% (0.1%)
9
18.7% (1.8%)
23
14.6% (-11.2%)
18
17.1% (0.1%)
21
10.6% (-0.7%)
13
6.5% (0.1%)
8
9.8% (6.5%)
12
6.5% (-0.8%)
8
1.6% (-2.4%)
2
1.6% (1.6%)
2
0.8% (0.8%)
1
0.0% (0.0%)
0
0.8% (0.8%)
1
Office of Equity and Access i-Ready Math Report D3 10/21/2020Page 13
Note: Blank cells in this report indicate that there were no students in the specific placement category. A percentage of 0.0% reflects a small percentage value between 0.01% and 0.049%. Cells highlighted in blue indicate percentage of students who are on or above grade level in their i-Ready Performance based on i-Ready's Standard View. In 2019-20 grade K was was not reqquired to participate in Diagnostic 1.
* Cell Value Key: Current Year Diagnostic 1 % of Test Takers in Placement Level Category (% Change in Placement Category from Prior Year Diagnostic 1 Students)
Current Year Diagnostic 1 Count of Test Takers in Placement Category
i-Ready Diagnostic 1 Standard View Secondary Math Course by Grade Level Report2020-21 Summary*
i-ReadyMathD2b
Math: Overall
On Track Total
Level12
Level 11
Level 10
Level9
Level7
Level8
Level5
i-Ready Performance Grade Level Placement
Grade LevelTests Taker
Counts LevelPreK
LevelK
Level1
Level2
Level3
Level4
Level6
Grade 7 Math 7 2,789 0.0% (0.0%)
0
1.0% (0.2%)
28
2.4% (-0.8%)
66
6.9% (-2.5%)
193
12.9% (-3.3%)
360
17.2% (-1.3%)
481
19.1% (1.8%)
532
33.9% (2.0%)
945
6.6% (4.0%)
184
0.0% (0.0%)
0
0.0% (0.0%)
0
0.0% (0.0%)
0
0.0% (0.0%)
0
0.0% (0.0%)
0
6.6% (4.0%)
184
Grade 7 Math 7 Accelerated
1,314 0.0% (0.0%)
0
0.0% (0.0%)
0
0.2% (0.1%)
2
0.8% (0.1%)
10
1.6% (0.3%)
21
2.7% (0.4%)
36
4.4% (1.0%)
58
36.7% (-7.0%)
482
53.0% (4.4%)
696
0.5% (0.5%)
6
0.2% (0.2%)
2
0.1% (0.1%)
1
0.0% (0.0%)
0
0.0% (0.0%)
0
53.7% (5.1%)
705
Grade 7 Mathematics 7 (SDC)
155 0.0% (0.0%)
0
16.1% (-3.9%)
25
35.5% (8.2%)
55
24.5% (-5.8%)
38
13.5% (-5.8%)
21
6.5% (4.0%)
10
3.2% (2.6%)
5
0.6% (0.6%)
1
0.0% (0.0%)
0
0.0% (0.0%)
0
0.0% (0.0%)
0
0.0% (0.0%)
0
0.0% (0.0%)
0
0.0% (0.0%)
0
0.0% (0.0%)
0
Grade 8 Math 8 2,801 0.0% (0.0%)
0
1.4% (0.3%)
38
2.9% (-0.7%)
82
7.3% (0.2%)
204
12.5% (-0.3%)
349
14.2% (-2.4%)
397
15.9% (0.2%)
445
15.6% (-2.0%)
437
24.3% (1.9%)
680
6.0% (2.7%)
168
0.0% (0.0%)
1
0.0% (0.0%)
0
0.0% (0.0%)
0
0.0% (0.0%)
0
6.0% (2.7%)
169
Grade 8 Mathematics 8 (SDC)
158 0.0% (0.0%)
0
13.3% (-1.2%)
21
26.6% (1.0%)
42
27.8% (-0.1%)
44
17.1% (-2.7%)
27
11.4% (2.7%)
18
2.5% (-0.4%)
4
0.6% (0.1%)
1
0.6% (0.6%)
1
0.0% (0.0%)
0
0.0% (0.0%)
0
0.0% (0.0%)
0
0.0% (0.0%)
0
0.0% (0.0%)
0
0.0% (0.0%)
0
Grade 8 Algebra I
1,029 0.0% (0.0%)
0
0.0% (0.0%)
0
0.1% (0.1%)
1
0.3% (0.3%)
3
0.4% (0.3%)
4
1.2% (0.8%)
12
2.4% (1.3%)
25
4.7% (-0.6%)
48
34.8% (-2.8%)
358
55.4% (0.4%)
570
0.4% (0.2%)
4
0.2% (-0.1%)
2
0.2% (0.2%)
2
0.0% (0.0%)
0
56.2% (0.7%)
578
Grade 9 Algebra I
2,366 0.0% (0.0%)
0
0.5% (-0.1%)
11
2.4% (0.1%)
56
3.6% (-1.6%)
85
8.1% (-2.8%)
191
11.1% (-1.9%)
262
12.2% (-0.8%)
288
14.8% (-5.4%)
349
16.3% (1.8%)
386
13.1% (3.4%)
310
18.1% (7.3%)
428
0.0% (0.0%)
0
0.0% (0.0%)
0
0.0% (0.0%)
0
18.1% (7.3%)
428
Grade 9 Geometry
649 0.0% (0.0%)
0
0.0% (0.0%)
0
0.0% (0.0%)
0
0.0% (-0.2%)
0
0.2% (0.2%)
1
0.8% (0.8%)
5
1.5% (-0.2%)
10
2.3% (0.3%)
15
6.0% (-0.9%)
39
11.1% (-3.3%)
72
77.7% (2.9%)
504
0.0% (0.0%)
0
0.0% (0.0%)
0
0.5% (0.5%)
3
78.1% (3.4%)
507
Grade 9 Transitional Math (SDC)
102 0.0% (0.0%)
0
13.7% (-1.4%)
14
26.5% (4.4%)
27
25.5% (-3.6%)
26
14.7% (-0.4%)
15
12.7% (0.0%)
13
3.9% (-0.7%)
4
2.9% (2.9%)
3
0.0% (-1.2%)
0
0.0% (0.0%)
0
0.0% (0.0%)
0
0.0% (0.0%)
0
0.0% (0.0%)
0
0.0% (0.0%)
0
0.0% (0.0%)
0
Grade 10 Algebra I
304 0.0% (0.0%)
0
2.3% (1.7%)
7
4.3% (-0.8%)
13
9.5% (0.0%)
29
18.1% (2.9%)
55
16.4% (-3.2%)
50
15.8% (1.2%)
48
13.5% (-3.7%)
41
8.2% (-2.9%)
25
5.3% (1.5%)
16
4.3% (1.7%)
13
2.3% (1.7%)
7
0.0% (0.0%)
0
0.0% (0.0%)
0
2.3% (1.7%)
7
Grade 10 Geometry
1,616 0.0% (0.0%)
0
0.5% (0.2%)
8
0.8% (0.3%)
13
3.3% (1.0%)
53
7.4% (2.0%)
120
8.3% (-3.4%)
134
9.3% (-0.4%)
151
13.7% (-2.7%)
222
15.2% (-0.9%)
246
13.5% (-1.5%)
218
13.5% (1.5%)
218
14.4% (3.8%)
232
0.1% (0.1%)
1
0.0% (0.0%)
0
14.4% (3.9%)
233
Grade 10 Algebra II
294 0.0% (0.0%)
0
0.3% (0.3%)
1
0.0% (0.0%)
0
0.0% (0.0%)
0
0.0% (0.0%)
0
1.0% (0.5%)
3
1.7% (1.2%)
5
2.7% (-2.1%)
8
6.5% (1.1%)
19
12.2% (2.6%)
36
23.1% (-9.5%)
68
52.0% (5.5%)
153
0.3% (0.3%)
1
0.0% (0.0%)
0
52.4% (5.9%)
154
Grade 10 Algebra II/ PreCalculus H
39 0.0% (0.0%)
0
0.0% (0.0%)
0
0.0% (0.0%)
0
0.0% (0.0%)
0
0.0% (0.0%)
0
0.0% (0.0%)
0
0.0% (0.0%)
0
0.0% (0.0%)
0
0.0% (-1.6%)
0
2.6% (1.0%)
1
20.5% (6.5%)
8
76.9% (-5.9%)
30
0.0% (0.0%)
0
0.0% (0.0%)
0
76.9% (-5.9%)
30
Office of Equity and Access i-Ready Math Report D2b 10/21/2020Page 1*See notes on last page
i-Ready Diagnostic 1 Standard View Secondary Math Course by Grade Level Report2020-21 Summary*
i-ReadyMathD2b
Grade 10 Intro to Alg/ Geom (SDC)
96 0.0% (0.0%)
0
9.4% (4.0%)
9
13.5% (-5.4%)
13
28.1% (10.6%)
27
30.2% (3.2%)
29
10.4% (-4.4%)
10
6.3% (-3.2%)
6
2.1% (-2.0%)
2
0.0% (-2.7%)
0
0.0% (0.0%)
0
0.0% (0.0%)
0
0.0% (0.0%)
0
0.0% (0.0%)
0
0.0% (0.0%)
0
0.0% (0.0%)
0
Grade 11 Algebra I (SDC)
109 0.0% (0.0%)
0
7.3% (6.2%)
8
9.2% (2.1%)
10
22.9% (5.3%)
25
19.3% (-13.7%)
21
16.5% (0.0%)
18
11.0% (-4.3%)
12
4.6% (1.1%)
5
4.6% (2.2%)
5
3.7% (1.3%)
4
0.9% (-0.3%)
1
0.0% (0.0%)
0
0.0% (0.0%)
0
0.0% (0.0%)
0
0.0% (0.0%)
0
Grade 11 Geometry
229 0.0% (0.0%)
0
0.9% (0.3%)
2
2.6% (1.1%)
6
7.4% (-1.1%)
17
14.4% (1.6%)
33
9.2% (-4.2%)
21
11.4% (3.1%)
26
19.2% (-1.5%)
44
11.4% (-2.7%)
26
6.6% (-3.2%)
15
13.5% (4.7%)
31
2.6% (1.1%)
6
0.9% (0.9%)
2
0.0% (0.0%)
0
0.9% (0.9%)
2
Grade 11 Geometry (SDC)
23 0.0% (0.0%)
0
0.0% (-0.6%)
0
17.4% (15.9%)
4
17.4% (8.9%)
4
17.4% (4.6%)
4
4.3% (-9.1%)
1
17.4% (9.2%)
4
0.0% (-20.7%)
0
13.0% (-1.0%)
3
4.3% (-5.4%)
1
4.3% (-4.5%)
1
4.3% (2.8%)
1
0.0% (0.0%)
0
0.0% (0.0%)
0
0.0% (0.0%)
0
Grade 11 Algebra II
1,000 0.0% (0.0%)
0
0.6% (0.6%)
6
0.3% (0.3%)
3
1.4% (1.4%)
14
2.6% (1.6%)
26
5.9% (1.3%)
59
7.2% (2.0%)
72
11.9% (0.7%)
119
13.6% (-1.5%)
136
17.3% (-1.0%)
173
29.5% (-7.7%)
295
8.1% (1.0%)
81
1.6% (1.3%)
16
0.0% (0.0%)
0
1.6% (1.3%)
16
Grade 11 Algebra / Geometry III
227 0.0% (0.0%)
0
0.4% (-0.7%)
1
2.6% (2.0%)
6
2.2% (-1.4%)
5
8.8% (-0.7%)
20
14.5% (-2.7%)
33
11.9% (-1.2%)
27
15.0% (-0.5%)
34
14.1% (-2.0%)
32
13.2% (2.5%)
30
13.7% (1.2%)
31
2.6% (2.6%)
6
0.9% (0.9%)
2
0.0% (0.0%)
0
0.9% (0.9%)
2
Grade 11 Algebra II/ PreCalculus H
26 0.0% (0.0%)
0
0.0% (0.0%)
0
0.0% (0.0%)
0
0.0% (0.0%)
0
0.0% (0.0%)
0
0.0% (0.0%)
0
0.0% (0.0%)
0
7.7% (6.2%)
2
0.0% (-4.4%)
0
3.8% (-9.4%)
1
23.1% (-29.9%)
6
53.8% (31.8%)
14
11.5% (5.7%)
3
0.0% (0.0%)
0
11.5% (5.7%)
3
Grade 11 Trigonometry/ Elem Func
27 0.0% (0.0%)
0
0.0% (0.0%)
0
0.0% (0.0%)
0
0.0% (0.0%)
0
0.0% (0.0%)
0
0.0% (0.0%)
0
0.0% (0.0%)
0
3.7% (3.7%)
1
11.1% (5.8%)
3
0.0% (-10.5%)
0
37.0% (-5.1%)
10
40.7% (19.7%)
11
7.4% (-13.6%)
2
0.0% (0.0%)
0
7.4% (-13.6%)
2
* Cell Value Key: Current Year Diagnostic 1 % of Test Takers in Placement Level Category
(% Change in Placement Category from Prior Year Diagnostic 1) Current Year Diagnostic 1 Count of Test Takers in Placement Category
Note: Blank cells in this report indicate that there were no students in the specific placement category. A percentage of 0.0% reflects a small percentage value between 0.01% and 0.049%. Cells highlighted in pink reflect placement of 2 or more grade levels below. A negative value within the parentheses (-##) reflects a reduction (a desirable change) in % of students in this category since the last diagnostic. Cells highlighted in yellow reflect placement of 1 grade level below. Cells highlighted in green reflect a placement of on or above grade level. A negative value within the parentheses (-##) reflects a reduction (an undesirable change) in % of students in this category since the last diagnostic. Cells highlighted in blue are a grand total of all the areas highlighted in green (on or above grade level).
Report includes results for grades 7-11; grade 12 was not required to participate in the i-Ready Math Diagnostic.
Office of Equity and Access i-Ready Math Report D2b 10/21/2020Page 2*See notes on last page