Friday 02 July 2021 MORNING Time of Issue: 0745 hours IST ALL INDIA WEATHER SUMMARY AND FORECAST BULLETIN Significant Weather Features ♦ The northern Limit of southwest monsoon (NLM) continues to pass through Lat. 26°N / Long. 70°E, Barmer, Bhilwara, Dholpur, Aligarh, Meerut, Ambala and Amritsar. ♦ Prevailing meteorological conditions, large scale atmospheric features and the forecast wind pattern by dynamical models suggest that no favourable conditions are likely to develop for further advance of southwest monsoon into remaining parts of Rajasthan, West Uttar Pradesh, Haryana, Chandigarh & Delhi and Punjab during next 5-6 days. Hence, subdued rainfall activity is very likely to continue to prevail over Northwest, Central and Western parts of Peninsular India during next 5-6 days. Isolated/scattered thunderstorm activity accompanied with lightning & rainfall is also likely over these regions during this period. ♦ Under the influence of strong moist southwesterly winds at lower tropospheric levels from Bay of Bengal to northeast & adjoining east India; fairly widespread to widespread rainfall with isolated heavy rainfall very likely over Bihar, Sub-Himalayan West Bengal & Sikkim and Northeastern states during next 5 days. Isolated heavy to very heavy rainfall very likely over Bihar on 02nd; Arunachal Pradesh on 02nd & 03rd and Sub-Himalayan West Bengal & Sikkim and Assam & Meghalaya during 02nd - 04th, July, 2021. Isolated extremely falls also likely over Assam & Meghalaya and over Sub-Himalayan West Bengal & Sikkim on 02nd & 03th July, 2021. ♦ Due to likely dry westerly/southwesterly winds from Pakistan to northwest India at lower levels, Heat wave conditions in isolated/some pockets over Punjab, Haryana, Chandigarh & Delhi, north Rajasthan, Uttar Pradesh and north West Madhya Pradesh during next 24 hours. ♦ Moderate to severe thunderstorm accompanied by frequent cloud to ground lightning very likely over Bihar, Jharkhand, East Uttar Pradesh and Chhattisgarh during next 24 hours. This may cause injuries leading to casualties to people and animals staying outdoors. Main Weather Observations ♦ Rain/Thundershowers observed (from 0830 hours IST to 1730 hours IST of yesterday): at most places over Arunachal Pradesh, Sub-Himalayan West Bengal & Sikkim, Konkan & Goa and Coastal Karnataka; at many places over Andaman & Nicobar Islands, Nagaland, Manipur, Mizoram & Tripura, Gangetic West Bengal and Madhya Maharashtra; at a few places over Assam & Meghalaya, Vidarbha, Kerala & Mahe and Tamil Nadu, Puducherry & Karaikal and at isolated places over Jharkhand, Bihar, Odisha, Jammu, Kashmir, Ladakh, Gilgit-Baltistan & Muzaffarabad, East Uttar Pradesh, Chhattisgarh, East Madhya Pradesh, Coastal Andhra Pradesh & Yanam and North Interior Karnataka. ♦ Rainfall recorded (from 0830 hours IST to 1730 hours IST of yesterday) (2 cm or more): Tiruppattur-4; Wardha and Malda-3 each; Thrissur, Chandrapur, Jagdalpur, Mandla, Bankura, Kolkata, Canning, Panagarh and Dibrugarh-2 each. ♦ Yesterday, Heat Wave to Severe Heat Wave Conditions observed in isolated pockets over Punjab and Heat Wave Conditions at most places over Haryana, Chandigarh & Delhi and in isolated pockets over West Rajasthan and Uttar Pradesh. ♦ Thunderstorm observed (from 0830 hrs IST of yesterday to 0530 hrs IST today): at a few places over Jammu, Kashmir, Ladakh, Gilgit-Baltistan & Muzaffarabad and Gangetic West Bengal and at isolated places over Himachal Pradesh, Bihar, Jharkhand, Chhattisgarh, East Madhya Pradesh, Odisha, Coastal Andhra Pradesh & Yanam and Kerala & Mahe. ♦ Maximum Temperature Departures as on 01-07-2021: Maximum temperatures were markedly above normal (5.1°C or more) at isolated places over Himachal Pradesh, Punjab, Haryana, Chandigarh & Delhi and East Uttar Pradesh; appreciably above normal (3.1°C to 5.0°C) at most places over Uttarakhand and West Uttar Pradesh; at a few places over Jammu, Kashmir, Ladakh, Gilgit-Baltistan & Muzaffarabad and Odisha; at isolated places over Rajasthan, West Madhya Pradesh, Kerala & Mahe and Tamil Nadu, Puducherry & Karaikal; above normal (1.6°C to 3.0°C) at many places over East Madhya Pradesh, Vidarbha, Saurashtra & Kutch and Coastal Karnataka; at a few places over Konkan & Goa and Madhya Maharashtra. They were markedly below normal (-5.1°C or less) at a few places over Sub-Himalayan West Bengal & Sikkim; appreciably below normal (-3.1°C to -5.0°C) at isolated places over Nagaland, Manipur, Mizoram & Tripura and Bihar; below normal (-1.6°C to -3.0°C) at a few places over Arunachal Pradesh; at isolated places over Assam & Meghalaya, Andaman & Nicobar Islands, Telangana and Coastal Andhra Pradesh & Yanam and near normal over rest parts of the country. Yesterday, the highest maximum temperature of 44.5°C was reported at Ganganagar (West Rajasthan). ♦ Minimum Temperature Departures as on 01-07-2021: Minimum temperatures were appreciably above normal (3.1°C to 5.0°C) at most places over Punjab and Haryana, Chandigarh & Delhi; at many places over Himachal Pradesh; at a few places over Uttar Pradesh and at isolated places over Jammu, Kashmir, Ladakh, Gilgit-Baltistan & Muzaffarabad, Uttarakhand, Rayalaseema and Sub-Himalayan West Bengal & Sikkim; above normal (1.6°C to 3.0°C) at many places over Jharkhand, West Madhya Pradesh, North Interior Karnataka; at a few places over East madhya Pradesh, Vidarbha, South Interior Karnataka and Kerala & Mahe and at isolated places over Bihar and Coastal Karnataka. They were appreciably below normal (-3.1°C to -5.0°C) at isolated places over Coastal Andhra Pradesh & Yanam and below normal (-1.6°C to -3.0°C) at a few places over Gangetic west Bengal and at a isolated places over Assam & Meghalaya and Telangana and near normal over rest parts of the country. * Red color warning does not mean "Red Alert" Red color warning means "Take Action". Forecast and Warning for any day is valid from 0830 hours IST of day till 0830 hours IST of next day For more details kindly visit www.imd.gov.in or contact : +91 11 24631913, 24643965, 24629798 (Service to the Nation since 1875)
Transcript
Friday 02 July 2021MORNING
Time of Issue: 0745 hours ISTALL INDIA WEATHER SUMMARY AND FORECAST BULLETIN
Significant Weather Features
♦ The northern Limit of southwest monsoon (NLM) continues to pass through Lat. 26°N / Long. 70°E, Barmer, Bhilwara, Dholpur, Aligarh, Meerut, Ambala and Amritsar.
♦ Prevailing meteorological conditions, large scale atmospheric features and the forecast wind pattern by dynamical models suggest that no favourable conditions are likely to develop for further advance of southwest monsoon into remaining parts of Rajasthan, West Uttar Pradesh, Haryana, Chandigarh & Delhi and Punjab during next 5-6 days. Hence, subdued rainfall activity is very likely to continue to prevail over Northwest, Central and Western parts of Peninsular India during next 5-6 days. Isolated/scattered thunderstorm activity accompanied with lightning & rainfall is also likely over these regions during this period.
♦ Under the influence of strong moist southwesterly winds at lower tropospheric levels from Bay of Bengal to northeast & adjoining east India; fairly widespread to widespread rainfall with isolated heavy rainfall very likely over Bihar, Sub-Himalayan West Bengal & Sikkim and Northeastern states during next 5 days. Isolated heavy to very heavy rainfall very likely over Bihar on 02nd; Arunachal Pradesh on 02nd & 03rd and Sub-Himalayan West Bengal & Sikkim and Assam & Meghalaya during 02nd - 04th, July, 2021. Isolated extremely falls also likely over Assam & Meghalaya and over Sub-Himalayan West Bengal & Sikkim on 02nd & 03th July, 2021.
♦ Due to likely dry westerly/southwesterly winds from Pakistan to northwest India at lower levels, Heat wave conditions in isolated/some pockets over Punjab, Haryana, Chandigarh & Delhi, north Rajasthan, Uttar Pradesh and north West Madhya Pradesh during next 24 hours.
♦ Moderate to severe thunderstorm accompanied by frequent cloud to ground lightning very likely over Bihar, Jharkhand, East Uttar Pradesh and Chhattisgarh during next 24 hours. This may cause injuries leading to casualties to people and animals staying outdoors.
Main Weather Observations
♦ Rain/Thundershowers observed (from 0830 hours IST to 1730 hours IST of yesterday): at most places over Arunachal Pradesh, Sub-Himalayan West Bengal & Sikkim, Konkan & Goa and Coastal Karnataka; at many places over Andaman & Nicobar Islands, Nagaland, Manipur, Mizoram & Tripura, Gangetic West Bengal and Madhya Maharashtra; at a few places over Assam & Meghalaya, Vidarbha, Kerala & Mahe and Tamil Nadu, Puducherry & Karaikal and at isolated places over Jharkhand, Bihar, Odisha, Jammu, Kashmir, Ladakh, Gilgit-Baltistan & Muzaffarabad, East Uttar Pradesh, Chhattisgarh, East Madhya Pradesh, Coastal Andhra Pradesh & Yanam and North Interior Karnataka.
♦ Rainfall recorded (from 0830 hours IST to 1730 hours IST of yesterday) (2 cm or more): Tiruppattur-4; Wardha and Malda-3 each; Thrissur, Chandrapur, Jagdalpur, Mandla, Bankura, Kolkata, Canning, Panagarh and Dibrugarh-2 each.
♦ Yesterday, Heat Wave to Severe Heat Wave Conditions observed in isolated pockets over Punjab and Heat Wave Conditions at most places over Haryana, Chandigarh & Delhi and in isolated pockets over West Rajasthan and Uttar Pradesh.
♦ Thunderstorm observed (from 0830 hrs IST of yesterday to 0530 hrs IST today): at a few places over Jammu, Kashmir, Ladakh, Gilgit-Baltistan & Muzaffarabad and Gangetic West Bengal and at isolated places over Himachal Pradesh, Bihar, Jharkhand, Chhattisgarh, East Madhya Pradesh, Odisha, Coastal Andhra Pradesh & Yanam and Kerala & Mahe.
♦ Maximum Temperature Departures as on 01-07-2021: Maximum temperatures were markedly above normal (5.1°C or more) at isolated places over Himachal Pradesh, Punjab, Haryana, Chandigarh & Delhi and East Uttar Pradesh; appreciably above normal (3.1°C to 5.0°C) at most places over Uttarakhand and West Uttar Pradesh; at a few places over Jammu, Kashmir, Ladakh, Gilgit-Baltistan & Muzaffarabad and Odisha; at isolated places over Rajasthan, West Madhya Pradesh, Kerala & Mahe and Tamil Nadu, Puducherry & Karaikal; above normal (1.6°C to 3.0°C) at many places over East Madhya Pradesh, Vidarbha, Saurashtra & Kutch and Coastal Karnataka; at a few places over Konkan & Goa and Madhya Maharashtra. They were markedly below normal (-5.1°C or less) at a few places over Sub-Himalayan West Bengal & Sikkim; appreciably below normal (-3.1°C to -5.0°C) at isolated places over Nagaland, Manipur, Mizoram & Tripura and Bihar; below normal (-1.6°C to -3.0°C) at a few places over Arunachal Pradesh; at isolated places over Assam & Meghalaya, Andaman & Nicobar Islands, Telangana and Coastal Andhra Pradesh & Yanam and near normal over rest parts of the country. Yesterday, the highest maximum temperature of 44.5°C was reported at Ganganagar (West Rajasthan).
♦ Minimum Temperature Departures as on 01-07-2021: Minimum temperatures were appreciably above normal (3.1°C to 5.0°C) at most places over Punjab and Haryana, Chandigarh & Delhi; at many places over Himachal Pradesh; at a few places over Uttar Pradesh and at isolated places over Jammu, Kashmir, Ladakh, Gilgit-Baltistan & Muzaffarabad, Uttarakhand, Rayalaseema and Sub-Himalayan West Bengal & Sikkim; above normal (1.6°C to 3.0°C) at many places over Jharkhand, West Madhya Pradesh, North Interior Karnataka; at a few places over East madhya Pradesh, Vidarbha, South Interior Karnataka and Kerala & Mahe and at isolated places over Bihar and Coastal Karnataka. They were appreciably below normal (-3.1°C to -5.0°C) at isolated places over Coastal Andhra Pradesh & Yanam and below normal (-1.6°C to -3.0°C) at a few places over Gangetic west Bengal and at a isolated places over Assam & Meghalaya and Telangana and near normal over rest parts of the country.
* Red color warning does not mean "Red Alert" Red color warning means "Take Action". Forecast and Warning for any day is valid from 0830 hours IST of day till 0830 hours IST of next day
For more details kindly visit www.imd.gov.in or contact : +91 11 24631913, 24643965, 24629798 (Service to the Nation since 1875)
Meteorological Analysis (Based on 0530 hours IST)
♦ The northern Limit of southwest monsoon (NLM) continues to pass through Lat. 26°N / Long. 70°E, Barmer, Bhilwara, Dholpur, Aligarh, Meerut, Ambala and Amritsar.
♦ Prevailing meteorological conditions, large scale atmospheric features and the forecast wind pattern by dynamical models suggest that no favourable conditions are likely to develop for further advance of southwest monsoon into remaining parts of Rajasthan, west Uttar Pradesh, Haryana, Chandigarh & Delhi and Punjab during next 5-6 days.
♦ The trough at mean sea level from west Uttar Pradesh to Assam across East Uttar Pradesh, Bihar, Sub- Himalayan West Bengal extending upto 0.9 km above mean sea level persists.
♦ The Western Disturbance as a trough in mid & upper westerlies with its axis at 5.8 km above mean sea level now runs roughly along Long.68°E to the north of Lat.30°N.
♦ The cyclonic circulation over central parts of North Rajasthan at 3.1 km above mean sea level persists.
♦ The cyclonic circulation over North Pakistan and neighbourhood extending upto 2.1 km above mean sea level persists.
♦ The trough from Interior Karnataka to Comorin Sea across Tamilnadu at 0.9 km above mean sea level persists.
♦ The cyclonic circulation over West Central Arabian Sea & adjoining south Oman coast at 3.1 km above mean sea level persists.
Weather Forecast for next 5 days * upto 0830 hours IST of 07th July, 2021
♦ Meteorological sub-division wise detailed 5 days precipitation forecast is given in Table-1.
♦ No significant change in maximum temperatures over most parts of the country during next 5 days.
♦ No significant change in maximum temperatures over most parts of northwest India during next 24 hours and gradual fall by 2-3°C thereafter.
Weather Outlook for subsequent 2 days from 07th July 2021 to 09th July 2021
♦ Fairly widespread to widespread rainfall with isolated heavy falls likely to continue over most parts of Northeast and East India; scattered to fairly widespread rainfall over the peninsular India and Islands and isolated rainfall likely over parts of Central and Northwest India.
♦ Subdued rainfall/weak monsoon spell over Central, West, northwest and Peninsular India.
* Red color warning does not mean "Red Alert" Red color warning means "Take Action". Forecast and Warning for any day is valid from 0830 hours IST of day till 0830 hours IST of next day
For more details kindly visit www.imd.gov.in or contact : +91 11 24631913, 24643965, 24629798 (Service to the Nation since 1875)
Weather Warning during next 5 days *
02 July (Day 1): ♦ Heavy to Very Heavy Rainfall with extremely heavy falls at isolated places very likely over Assam & Meghalaya and Sub-Himalayan West Bengal & Sikkim; Heavy to Very Heavy Rainfall at isolated places over Uttarakhand, Bihar and Arunachal Pradesh and Heavy Rainfall at isolated places over East Uttar Pradesh, Chhattisgarh, Gangetic West Bengal, Mizoram & Tripura, Telangana and Tamilnadu, Puducherry & Karaikal.
♦ Thunderstorm with lightning & gusty winds (speed reaching 40-50 kmph) very likely at isolated places over West Uttar Pradesh; (speed reaching 30-40 kmph) Kerala & Mahe and Lakshadweep and with lightning at isolated places over Jammu, Kashmir, Ladakh, Gilgit-Baltistan & Muzaffarabad, Himachal Pradesh, Uttarakhand, East Uttar Pradesh, East Madhya Pradesh, Vidarbha, Chhattisgarh, Bihar, Jharkhand, Odisha, Gangetic West Bengal, Andaman & Nicobar Islands, Coastal Andhra Pradesh & Yanam, Telangana, South Interior Interior Karnataka and Tamilnadu, Puducherry & Karaikal.
♦ Thunderstorm/Duststorm (speed reaching 40-50 kmph) very likely at isolated places over Punjab and Haryana.
♦ Heat Wave conditions in isolated pockets very likely over Punjab, Haryana, Chandigarh & Delhi, West Uttar Pradesh and north Rajasthan.
♦ Strong Winds (speed 40-50 kmph gusting to 60 kmph) very likely over Southwest, Westcentral and Northwest Arabian Sea and North Arabian sea and along & off Gujarat coast. Fishermen are advised not to venture into these areas.
03 July (Day 2): ♦ Heavy to Very Heavy Rainfall with extremely heavy falls very likely at isolated places over Sub-Himalayan West Bengal & Sikkim and Assam & Meghalaya; Heavy to Very Heavy Rainfall at isolated places over Arunachal Pradesh and Heavy Rainfall at isolated places over Uttarakhand, Chhattisgarh, Bihar, Nagaland and Tamilnadu, Puducherry & Karaikal.
♦ Thunderstorm with lightning & gusty winds (speed reaching 30-40 kmph) very likely at isolated places over West Uttar Pradesh, Kerala & Mahe and Lakshadweep and with lightning at isolated places over Jammu, Kashmir, Ladakh, Gilgit-Baltistan & Muzaffarabad, Himachal Pradesh, Uttarakhand, East Uttar Pradesh, East Madhya Pradesh, Vidarbha, Chhattisgarh, Bihar, Jharkhand, Odisha, Gangetic West Bengal, Coastal Andhra Pradesh & Yanam, Telangana, South Interior Interior Karnataka and Tamilnadu, Puducherry & Karaikal.
♦ Thunderstorm/Duststorm (speed reaching 30-40 kmph) very likely at isolated places over Punjab and Haryana.
♦ Strong Winds (speed 40-50 kmph gusting to 60 kmph) very likely over Southwest, Westcentral and Northwest Arabian Sea. Fishermen are advised not to venture into these areas.
04 July (Day 3): ♦ Heavy to Very Heavy Rainfall likely at isolated places over Sub-Himalayan West Bengal & Sikkim and Assam & Meghalaya and Heavy Rainfall at isolated places over Uttarakhand, Arunachal Pradesh, Bihar and Tamilnadu, Puducherry & Karaikal.
♦ Thunderstorm with lightning & gusty winds (speed reaching 30-40 kmph) likely at isolated places over West Uttar Pradesh, Kerala & Mahe and Lakshadweep and with lightning at isolated places over Jammu, Kashmir, Ladakh, Gilgit-Baltistan & Muzaffarabad, Himachal Pradesh, Uttarakhand, East Uttar Pradesh, Chhattisgarh, Bihar, Jharkhand, Odisha, Gangetic West Bengal, Coastal Andhra Pradesh & Yanam, South Interior Interior Karnataka and Tamilnadu, Puducherry & Karaikal.
♦ Thunderstorm/Duststorm (speed reaching 30-40 kmph) likely at isolated places over Punjab and Haryana.
♦ Strong Winds (speed 40-50 kmph gusting to 60 kmph) likely over Southwest, Westcentral and Northwest Arabian Sea. Fishermen are advised not to venture into these areas.
05 July (Day 4): ♦ Heavy Rainfall likely at isolated places over Sub-Himalayan West Bengal & Sikkim, Arunachal Pradesh, Assam & Meghalaya and Tamilnadu, Puducherry & Karaikal.
♦ Thunderstorm with lightning & gusty winds (speed reaching 30-40 kmph) likely at isolated places over West Uttar Pradesh, Kerala & Mahe and Lakshadweep and with lightning at isolated places over Jammu, Kashmir, Ladakh, Gilgit-Baltistan & Muzaffarabad, Himachal Pradesh, Uttarakhand, East Uttar Pradesh, Chhattisgarh, Bihar, Jharkhand, Odisha, Gangetic West Bengal and Tamilnadu, Puducherry & Karaikal.
♦ Thunderstorm/Duststorm (speed reaching 30-40 kmph) likely at isolated places over Punjab and Haryana.
♦ Strong Winds (speed 40-50 kmph gusting to 60 kmph) likely over Southwest, Westcentral and Northwest Arabian Sea. Fishermen are advised not to venture into these areas.
06 July (Day 5): ♦ Heavy Rainfall likely at isolated places over Sub-Himalayan West Bengal & Sikkim, Arunachal Pradesh, Assam & Meghalaya and Tamilnadu, Puducherry & Karaikal.
♦ Thunderstorm with lightning & gusty winds (speed reaching 30-40 kmph) likely at isolated places over West Uttar Pradesh, Kerala & Mahe and Lakshadweep and with lightning at isolated places over Jammu, Kashmir, Ladakh, Gilgit-Baltistan & Muzaffarabad, Himachal Pradesh, Uttarakhand, East Uttar Pradesh, Chhattisgarh, Bihar, Jharkhand, Odisha, Gangetic West Bengal and Tamilnadu, Puducherry & Karaikal.
♦ Strong Winds (speed 40-50 kmph gusting to 60 kmph) likely over Southwest, Westcentral and Northwest Arabian Sea. Fishermen are advised not to venture into these areas.
Kindly download MAUSAM APP for location specific forecast & warning, MEGHDOOT APP for Agromet advisory and DAMINI APP for Lightning Warning & visit state MC/RMC websites for district wise warning.
* Red color warning does not mean "Red Alert" Red color warning means "Take Action". Forecast and Warning for any day is valid from 0830 hours IST of day till 0830 hours IST of next day
For more details kindly visit www.imd.gov.in or contact : +91 11 24631913, 24643965, 24629798 (Service to the Nation since 1875)
Table-1
* Red color warning does not mean "Red Alert" Red color warning means "Take Action". Forecast and Warning for any day is valid from 0830 hours IST of day till 0830 hours IST of next day
For more details kindly visit www.imd.gov.in or contact : +91 11 24631913, 24643965, 24629798 (Service to the Nation since 1875)
ALL INDIA WEEKLY WEATHER REPORT
24 JUNE – 30 JUNE, 2021
Go to: Table-1(A) Table-1(B) Table-1(C) Table-2 Table-3 Fig-1 Fig-2 Fig-3 Annexure-1
SIGNIFICANT WEATHER FEATURES
❖ Advance of Southwest Monsoon
♦ Southwest Monsoon has covered entire North Arabian Sea, Gujarat State and Madhya Pradesh, some more parts of Rajasthan and most parts of West Uttar Pradesh on 19th June 2021; due to lack of favourable conditions, further advance of Southwest Monsoon has not taken place afterwards till 30th June 2021. ♦ The Northern Limit of southwest monsoon (NLM) passed through Lat. 26°N / Long. 70°E, Barmer, Bhilwara, Dholpur, Aligarh, Meerut, Ambala and Amritsar on 19th June 2021; since there had been no further advance of
southwest monsoon afterwards, the NLM remained the same till 30th June 2021. (Fig.1) ♦ Convergence of strong southerlies/ southwesterlies from Bay of Bengal causing moisture incursion into the region has caused fairly widespread to widespread rainfall over Northeast and adjoining areas of East India with heavy to very heavy rainfall activity reported over Assam & Meghalaya on all the days along with extremely heavy rainfall on two to three days during the week; Arunachal Pradesh also had reported heavy/ very heavy rainfall on three to four days whereas Sub Himalayan West Bengal & Sikkim has reported heavy to very heavy rainfall on many days with extremely heavy rainfall on one day during the week. ♦ A cyclonic circulation lay over Jharkhand & neighbourhood with its vertical extension upto midtropospheric levels and tilting southwestwards with height in the beginning of the week; eventhough its vertical extension had reduced during the course of the week, it persisted around the same areas on many days of the week; under its influence, scattered to fairly widespread rainfall/thunderstorm activity had been reported over parts of East India and over eastern parts of Central India and East Uttar Pradesh during the week along with isolated heavy/very heavy rainfall reported over parts of East India and East Uttar Pradesh on many days and over eastern parts of Central India on three to four days. ♦ Convergence of strong westerlies had caused widespread rainfall/thunderstorm activity over coastal areas and isolated to scattered rainfall activity over interior areas of Maharashtra during the week; isolated heavy /very heavy rainfall had been reported over coastal areas on many days whereas isolated heavy rainfall had been reported over interior areas on three to four days along with. ♦ Under the influence of cyclonic circulations in the lower tropospheric levels supported by moisture incursion from Arabian Sea, scattred to fairly widespread rainfall/thunderstorm activity had occurred over Gujarat State, East Rajasthan and adjoining areas of West Madhya Pradesh with isolated heavy/very heavy rainfall reported over these areas on two to three days. Heavy Rain: ♦ Heavy to Very heavy rainfall with extremely heavy falls at isolated places had occurred over Assam & Meghalaya on five days; over Sub Himalayan West Bengal & Sikkim, Bihar and Uttarakhand on one day each during the week. ♦ Heavy to Very heavy rainfall at isolated places had occurred over Sub Himalayan West Bengal & Sikkim on four days; over Bihar, East Uttar Pradesh, Konkan & Goa and Chhattisgarh on three days each; over Arunachal Pradesh, Assam & Meghalaya, West Madhya Pradesh and Gujarat Region on two days each; over Gangetic West Bengal, Odisha, East Madhya Pradesh, Telengana, Rayalseema and North Interior Karnataka on one day each during the week. ♦ Heavy rainfall at isolated places had occurred over Coastal Andhra Pradesh & Yanam, Madhya Maharashtra and East Madhya Pradesh on four days each; over East Rajasthan, Konkan & Goa, Tamil nadu, Puducherry & Karaikkal and Telangana on three days each; over Arunachal Pradesh, Nagaland, Manipur, Mizoram & Tripura, Odisha, Jharkhand, Bihar, East & West Uttar Pradesh, Gujarat Region and Marathwada on two days each; over Andaman & Nicobar Islands, Gangetic West Bengal, Uttarakhand, West Rajasthan, Saurashtra & Kutch, Vidarbha, Chhattisgarh,Rayalseema and Kerala & Mahe on one day each during the week. Hailstorm: ♦ Hailstorm at isolated places had occurred over northern parts of West Rajasthan on one day during the week. Temperature Scenario: ♦ Heatwave ♦ Heatwave conditions at most places with Severe Heatwave conditions at isolated places had occurred over Punjab and over Haryana, Chandigarh & Delhi on one day each during the week. ♦ Severe Heatwave conditions at isolated places had occurred over East Rajasthan on one day during the week. ♦ Heatwave conditions at isolated places had occurred over Jammu division of Jammu Kashmir & Ladakh, West Rajasthan, West Uttar Pradesh and northern parts of West Madhya Pradesh on one day each during the week. ♦ The highest maximum temperature of 45.8oC had been recorded at Ganganagar(West Rajasthan) on 29th June 2021 and the lowest minimum temperature of 18.6 o C had been recorded at Khargone( East Madhya Pradesh) on 24th June 2021 and at Bangalore (South Interior Karnataka) on 25th June 2021 over the plains of the country during the week.
LEGEND: A few days- 3 days, Many days- 4 to 5 days and Most days- 6 to 7 days during the week.
Government of India Ministry of Earth Sciences
India Meteorological Department National Weather Forecasting Centre
METEOROLOGICAL ANALYSIS
♦ Last week’s trough at mean sea level from north Punjab to Northeast Bay of Bengal across Haryana, West Uttar Pradesh, north Jharkhand and Gangetic West Bengal persisted on 24th June 2021; it ran from East Uttar Pradesh to Northeast Bay of Bengal across the cyclonic circulation over Jharkhand & neighbourhood and Gangetic West Bengal on 25th; it ran from East Uttar Pradesh to Northwest Bay of Bengal across Jharkhand and Gangetic West Bengal on 26th; it ran from northwest Uttar Pradesh to Northwest Bay of Bengal across East Uttar Pradesh, south Jharkhand and north Odisha on 27th;it has become less marked on 28th June 2021. ♦ Last week’s cyclonic circulation over southwest Bihar & adjoining southeast Uttar Pradesh lay over Jharkhand & neighbourhood and extended upto 5.8 km above mean sea level tilting southwestwards with height on 24th and 25th June 2021; it persisted over the same areas and extended upto 3.1 km above mean sea level on 26th; it lay over north Chhattisgarh & neighbourhood and extended upto 3.1 km above mean sea level on 27 th; it lay over northeast Madhya Pradesh & neighbourhood at 1.5 km above mean sea level on 28th;it has become less Marked on 29th June 2021. ♦ Last week’s trough from the cyclonic circulation over southwest Bihar & adjoining southeast Uttar Pradesh to south Chhattisgarh ran from the cyclonic circulation over Jharkhand and neighbourhood to south Coastal Andhra Pradesh across interior Odisha and extended upto 1.5 km above mean sea level on 24th June 2021; it ran from the cyclonic circulation over Jharkhand and neighbourhood to south Odisha at 0.9 km above mean sea level on 25 th; it has become less marked on 26th June 2021. ♦ Last week’s Western Disturbance as a trough in mid & upper tropospheric westerlies with its axis at 5.8 km above mean sea level ran roughly along Long. 71°E to the north of Lat. 25°N on 24th June 2021;it lay with its axis at 5.8 km above mean sea level roughly along Long. 71°E to the north of Lat. 30°N on 25th; it ran with its axis at 5.8 km above mean sea level roughly along Long. 71°E to the north of Lat. 28°N on 26th; it has moved away northeastwards on 27th June 2021. ♦ Last week’s cyclonic circulation over Northeast & adjoining Northwest Arabian Sea at 5.8 km above mean sea level has become less marked on 24th June 2021. ♦ An east-west trough ran from the cyclonic circulation over Jharkhand and neighbourhood to north Gujarat across north Chhattisgarh and south Madhya Pradesh at 3.1 km above mean sea level on 24th June 2021;it has become less marked on 25th June 2021. ♦ A cyclonic circulation lay over northeast Rajasthan & neighbourhood and extended upto 1.5 km above mean sea level on 24th June 2021;it lay over Haryana & neighbourhood at 0.9 km above mean sea level on 25th;it lay over northeast Rajasthan & neighbourhood at 0.9 km above mean sea level on 26th;it has become less marked on 27th June 2021. ♦ A Western Disturbance as a cyclonic circulation lay over West Afghanistan & neighbourhood at 3.1 km above mean sea level on 25th June 2021; it has become less marked on 26th June 2021. ♦ A cyclonic circulation lay over southwest Rajasthan & neighbourhood between 3.1 & 5.8 km above mean sea level on 25th June 2021; it persisted over the same areas and was seen at 5.8 km above mean sea level on 26th; it has become less marked on 27th June 2021. ♦ A cyclonic circulation lay over Pakistan & adjoining Punjab at 1.5 km above mean sea level on 25th June 2021; it lay over northwest Rajasthan & neighbourhood and extended upto 2.1 km above mean sea level on 26th;it lay over northwest Rajasthan & adjoining Pakistan and extended upto 2.1 km above mean sea level on 27th;it has become less marked on 28th June 2021. ♦ A cyclonic circulation lay over south Odisha & neighbourhood between 0.9 km & 2.1 km above mean sea level on 26th June 2021;it lay over Coastal Andhra Pradesh & neighbourhood and extended upto 4.5 km above mean sea level tilting southwards with height on 27th; it lay over Telangana & neighbourhood between 1.5 & 5.8 km above mean sea level tilting westwards with height on 28 th; it has become less marked on 29th June 2021. ♦ A cyclonic circulation lay over south Gujarat region & neighbourhood between 2.1 km & 3.1 km above mean sea level on 26th June 2021; it persisted over the same areas and was seen between 2.1 km & 5.8 km above mean sea level on 27th; it has become less marked on 28th June 2021. ♦ A cyclonic circulation lay over Westcentral Arabian Sea off south Oman coast between 3.1 km & 5.8 km above mean sea level on 26th and it persisted over the same areas between the same levels on 27th and 28th June 2021; it lay over Westcentral Arabian Sea & adjoining south Oman coast at 3.1 km above mean sea level on 29th; it persisted over the same areas at 3.1 km above mean sea level on 30th June 2021. ♦ A Western Disturbance as a cyclonic circulation lay over south Afghanistan & neighbourhood at 5.8 km above mean sea level on 27th June 2021; it lay over north Pakistan &neighbourhood at 5.8 km above mean sea level on 28th; it has become less marked on 29th June 2021. ♦ A cyclonic circulation lay over northwest Madhya Pradesh & neighbourhood at 0.9 km above mean sea level on 27th June 2021; it lay over East Rajasthan & neighbourhood at 0.9 km above mean sea level on 28th; it persisted over the same areas and extended upto 0.9 km above mean sea level on 29th; it has become less marked on 30th June 2021. ♦ A trough at 0.9 km above mean sea level ran from the cyclonic circulation over East Rajasthan & neighbourhood to West Assam on 28th June 2021; it has become less marked on 29th June 2021. ♦ A trough ran from North Interior Karnataka to Saurashtra between 3.1 km & 5.8 km above mean sea level on 28th June 2021; it has become less marked on 30th June 2021. ♦ A cyclonic circulation lay over Comorin area and adjoining Equatorial India Ocean between 5.8 km & 7.6 km above mean sea level on 28th June 2021; it has become less marked on 29th June 2021.
♦ A Western Disturbance as a trough in mid & upper westerlies with its axis at 5.8 km above mean sea level ran roughly along Long. 60°E to the north of Lat. 28°N in the afternoon of 28th June 2021; it continued as a trough in mid & upper tropospheric westerlies with its axis at 5.8 km above mean sea level which ran roughly along Long.60°E to the north of Lat.30°N on 29th and roughly along Long.63°E to the north of Lat.30°N on 30th June 2021. ♦ A trough at mean sea level ran from East Uttar Pradesh to northeast Assam across Bihar and Sub-Himalayan West Bengal on 29th June 2021;it ran from northeast Uttar Pradesh to northeast Assam across Bihar and Sub-Himalayan West Bengal and extended upto 0.9 km above mean sea level on 30th June 2021. ♦ A trough ran from Eastcentral Arabian Sea off north Maharashtra coast to south Kerala across Coastal Karnataka between 3.1 & 4.5 km above mean sea level on 29th June 2021; it has become less marked on 30th June 2021. ♦ A cyclonic circulation lay over north Pakistan and neighbourhood and extended upto 2.1 km above mean sea level on 30th June 2021. ♦ A cyclonic circulation lay over North East Arabian Sea and adjoining Saurashtra & Kutch between 3.1 km and 5.8 km above mean sea level on 30th June 2021. ♦ A trough ran from Vidharbha to South Tamil Nadu across Telangana and Interior Tamil Nadu at 0.9 km above mean sea level on 30th June 2021.
RAINFALL SUMMARY
Category of the rainfall
WEEK SEASON
24.06.2021 TO 30.06.2021 01.06.2021 TO 30.06.2021
Number of Sub-divisions Number of Sub-divisions
LARGE EXCESS (+60% or more) 1 3 EXCESS (+20% to +59%) 5 13 NORMAL (+19% to -19%) 6 12 DEFICIENT (-20% to -59%) 11 8 LARGE DEFICIENT (-60% to -99%) 13 0 NO RAIN (-100%) 0 0
Cumulative rainfall (mm) Actual Normal % Departure Actual Normal % Departure
EAST & NORTH-EAST INDIA 84.2 94.5 -11% 357.3 347.1 +3% NORTH-WEST INDIA 12.4 28.8 -57% 85.7 75.3 +14% CENTRAL INDIA 42.1 61.7 -32% 198.8 169.2 +17% SOUTH PENINSULA 27.6 40.8 -32% 166.2 160.2 +4%
country as a whole 36.8 52.7 -30% 182.9 166.9 +10%
• Sub-division wise weekly and seasonal rainfall distribution is presented in Fig-2 and Fig-3.
• Sub-divisionwise daily distribution of realised Rainfall is shown in Table-1(A).
• Sub-divisionwise departure of realised Maximum temperature from Normal is shown in Table-1(C)
• Statewise distribution of number of districts with Large-Excesse, Excess, Normal, Deficient, Large-deficient and no
rainfall is shown in Table-2.
• Cumulative seasonal rainfall data during the corresponding weekly period for the last five years are given in Table-3.
• Sub-divisionwise realised weekly rainfall (in cm) is shown in Annexure-1.
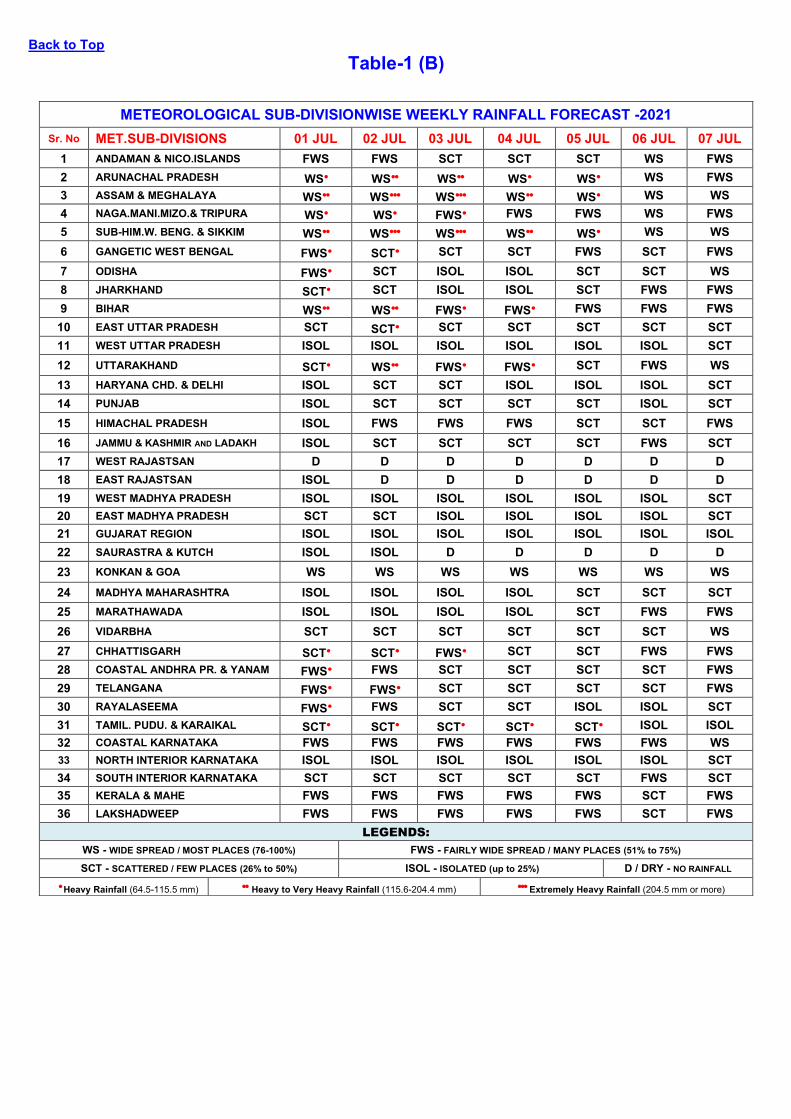
FORECAST & WARNING FOR THE NEXT WEEK 01 July TO 07 July, 2021
➢ Detailed seven days Sub-division wise rainfall-forecast is given in Table-1(B).
Back to Top
Fig-1
Back to Top
Table-1 (A)
METEOROLOGICAL SUB-DIVISIONWISE DISTRIBUTION OF REALISED RAINFALL-2021
S.No. MET.SUB-DIVISIONS 24 JUN 25 JUN 26 JUN 27 JUN 28 JUN 29 JUN 30 JUN
Station/(s) lies in Met-Subdivision/(s) E MP SIK NIK TLG NIK Guj. Reg. E MP
LEGENDS:
BN - BELOW NORMAL (N-2)OC AN - ABOVE NORMAL (N+2)OC
N - NORMAL (N+1,N-1)OC ABN - APPRECIABLY BELOW NORMAL (N-3.1 to -4.9)OC AAN - APPRECIABLY ABOVE NORMAL (N+3.1 to +4.9)OC
MBN - MARKEDLY BELOW NORMAL (N-5 AND BELOW )OC MAN - MARKEDLY ABOVE NORMAL (N+5 AND ABOVE)OC
+ Heat Wave (Maximum temperature departure from Normal +4.5 OC to +6.4OC) - Cold Wave (Minimum temperature departure from Normal -4.5 OC to -6.4OC)
++ Severe Heat Wave (Maximum temperature departure from Normal ≥ +6.5OC) - - Severe Cold Wave (Minimum temperature departure from Norma ≤ -6.5OC)
3
Back to Top
Table-2 STATEWISE DISTRIBUTION OF NO. OF DISTRICTS
WITH EXCESS, NORMAL,DEFICIENT,SCANTY AND NO RAINFALL
S.
STATES PERIOD FROM : 01-06-2021 TO 30-06-2021
NO. LE E N D LD NR ND TOTAL
1 A & N ISLAND (UT) 0 0 2 1 0 0 0 3
2. ARUNACHAL PRADESH 0 2 5 8 1 0 0 16
3. ASSAM 2 4 11 9 1 0 0 27
4. MEGHALAYA 0 1 3 3 0 0 0 7
5. NAGALAND 1 0 2 3 5 0 0 11
6. MANIPUR 0 1 3 5 0 0 0 9
7. MIZORAM 0 0 1 6 1 0 0 8
8. TRIPURA 0 0 3 1 0 0 0 4
9. SIKKIM 0 2 1 1 0 0 0 4
10. WEST BENGAL 2 10 6 1 0 0 0 19
11. ODISHA 1 5 12 12 0 0 0 30
12. JHARKHAND 8 7 8 1 0 0 0 24
13. BIHAR 32 4 1 1 0 0 0 38
14. UTTAR PRADESH 32 10 13 16 4 0 0 75
15. UTTARAKHAND 0 7 4 2 0 0 0 13
16. HARYANA 1 2 7 8 4 0 0 22
17. CHANDIGARH (UT) 1 0 0 0 0 0 0 1
18. DELHI 1 0 2 4 2 0 0 9
19. PUNJAB 2 5 9 5 1 0 0 22
20. HIMACHAL PRADESH 0 0 7 4 1 0 0 12
21. JAMMU & KASHMIR(UT) 0 2 3 9 6 0 0 20
22. LADAKH(UT) 1 1 0 0 0 0 0 2
23. RAJASTHAN 1 6 14 11 1 0 0 33
24. MADHYA PRADESH 15 14 13 9 0 0 0 51
25. GUJARAT 1 4 13 11 4 0 0 33
26. DADRA & NAGAR HAVELI (UT) 0 1 0 0 0 0 0 1
27. DAMAN & DIU (UT) 0 2 0 0 0 0 0 2
28. GOA 0 2 0 0 0 0 0 2
29. MAHARASHTRA 5 16 12 3 0 0 0 36
30. CHHATISGARH 5 10 10 2 0 0 0 27
31. ANDHRA PRADESH 1 2 3 7 0 0 0 13
32. TELANGANA 15 11 5 2 0 0 0 33
33. TAMILNADU 7 8 12 10 1 0 0 38
34. PUDUCHERRY (UT) 0 1 2 1 0 0 0 4
35. KARNATAKA 10 8 10 2 0 0 0 30
36. KERALA 0 0 1 13 0 0 0 14
37. LAKSHADWEEP (UT) 0 0 0 1 0 0 0 1
TOTAL 144 148 198 172 32 0 0 694
CATEGORYWISE DISTRIBUTION
OF DISTRICTS OUT OF THE 21% 21% 28% 25% 5% 0%
694 WHOSE DATA RECEIVED
PERCENT DISTRIBUTION OF DISTRICTS IN EARLIER YEARS SINCE 1st OCTOBER
DATE LE E N D LD NR
30-6-2021 21% 21% 28% 25% 5% 0%
1-7-2020 21% 22% 29% 23% 5% 0%
3-7-2019 3% 6% 24% 42% 25% 0%
27-6-2018 6% 15% 30% 30% 18% 1%
29-6-2016 17% 15% 28% 29% 11% 0%
4
Back to Top
Table-3
RAINFALL DURING MONSOON SEASON
S. No.
Meteorological Sub-Divisions
For the period from 1st June to
29 JUN
2016 28 JUN
2017 27 JUN
2018 03 JUL 2019
01 JUL 2020
30 JUN 2021
1. Andaman & Nicobar Islands
A N D
409 426 -4
330 415 -20
491 402 +22
664 449 +48
514 427 +21
316 414 -24
2. Arunachal Pradesh
A N D
385 484 -20
342 471 -28
266 451 -41
338 548 -38
531 513 +4
377 491 -23
3 Assam & Meghalaya
A N D
305 485 -37
392 470 -17
328 455 -28
403 557 -28
651 517 +26
454 497 -9
4. Nagaland, Manipur, Mizo. & Tripura
A N D
232 398 -42
486 387 +25
351 374 -6
267 434 -39
265 410 -36
246 398 -38
5. Sub-Himalayan West Bengal & Sikkim
A N D
542 464 +17
350 446 -21
349 427 -18
385 550 -30
729 505 +44
462 483 -4
6. Gangetic West Bengal
A N D
166 231 -28
185 219 -16
183 209 -12
146 289 -49
285 265 +7
369 256 +44
7. Odisha A N D
156 205 -24
191 197 -3
130 187 -30
209 246 -15
257 225 +14
181 218 -17
8. Jharkhand A N D
124 187 -34
110 176 -37
113 165 -31
132 228 -42
205 209 -2
269 200 +34
9. Bihar A N D
129 156 -17
83 145 -43
92 136 -33
110 201 -45
312 179 +74
354 168
+111
10. East Uttar Pradesh
A N D
77 99 -22
42 91 -54
35 82 -58
54 125 -57
205 114 +79
205 108 +89
11. West Uttar Pradesh
A N D
60 65 -7
49 58 -16
24 52 -54
29 89 -67
52 81 -36
73 76 -3
12. Uttarakhand A N D
161 159 +2
133 150 -11
118 140 -15
96 204 -53
148 186 -20
263 178 +48
13. Haryana, Chandigarh & Delhi
A N D
32 41 -21
75 39
+94
28 36 -23
19 57 -66
48 51 -7
49 48 +2
14. Punjab A N D
52 40
+30
72 37
+93
53 35
+53
27 62 -56
50 54 -7
50 50 -1
5
S. No.
Meteorological Sub-Divisions
For the period from 1st June to
29 JUN
2016 28 JUN
2017 27 JUN
2018 03 JUL 2019
01 JUL 2020
30 JUN 2021
15. Himachal Pradesh
A N D
99 89
+12
95 83
+14
67 76 -12
57 115 -50
69 105 -35
85 101 -16
16. Jammu & Kashmir and Ladakh
A N D
63 60 +4
104 58
+78
52 55 -6
82 86 -4
48 78 -38
38 74 -48
17. West Rajasthan A N D
31 28
+11
66 27
+149
24 25 -5
30 44 -32
37 39 -5
50 37
+36
18. East Rajasthan
A N D
57 57 +1
66 51
+29
51 47 +9
86 83 +4
77 71 +8
57 67 -15
19. West Madhya Pradesh
A N D
102 99 +3
103 92
+12
92 85 +8
125 129 -3
201 113 +77
137 106 +30
20. East Madhya Pradesh
A N D
99 125 -21
87 117 -25
78 107 -27
124 170 -27
225 152 +48
201 140 +43
21. Gujarat Region
A N D
24 122 -80
106 114 -7
71 107 -34
143 171 -17
110 149 -26
137 139 -1
22. Saurashtra & Kutch
A N D
26 81 -68
45 77 -41
5 72 -93
67 116 -42
135 99
+36
69 94 -27
23. Konkan & Goa
A N D
743 662 +12
676 623 +8
891 586 +52
861 809 +7
729 729 +0
974 690 +41
24. Madhya Maharashtra
A N D
98 139 -30
169 131 +29
147 124 +19
160 181 -12
238 164 +45
203 157 +29
25. Marathawada A N D
139 138 +1
181 133 +37
181 127 +43
108 155 -30
229 143 +60
180 138 +30
26. Vidarbha
A N D
139 160 -13
135 152 -11
147 142 +4
148 196 -25
180 181 +0
204 171 +19
27. Chhattisgarh A N D
160 172 -7
157 166 -5
125 154 -19
194 226 -14
287 205 +40
244 193 +26
28. Coastal Andhra Pradesh & Yanam
A N D
170 99
+72
144 95
+51
87 91 -5
77 119 -35
125 109 +14
83 105 -22
29. Telangana
A N D
167 130 +29
197 125 +58
144 118 +22
103 149 -31
178 137 +30
196 130 +50
6
S. No.
Meteorological Sub-Divisions
For the period from 1st June to
29 JUN
2016 28 JUN
2017 27 JUN
2018 03 JUL 2019
01 JUL 2020
30 JUN 2021
30. Rayalaseema
A N D
127 66
+92
89 65
+38
61 63 -3
57 76 -25
132 73
+82
114 71
+60
31. Tamil Nadu, Puducherry & Karaikal
A N D
64 45
+43
47 44 +8
47 43 +9
34 59 -42
63 56
+13
62 52
+21
32. Coastal Karnataka
A N D
896 822 +9
763 780 -2
875 748 +17
670 984 -32
805 907 -11
772 867 -11
33. North Interior Karnataka
A N D
133 100 +33
129 96
+34
105 92
+14
121 117 +3
139 110 +26
161 107 +50
34. South Interior Karnataka
A N D
160 134 +20
102 127 -19
165 121 +36
119 164 -28
148 151 -2
166 144 +15
35. Kerala & Mahe
A N D
567 619 -8
555 593 -7
676 568 +19
378 725 -48
541 672 -20
408 643 -36
36. Lakshadweep A N D
320 320 +0
518 311 +67
165 300 -45
247 360 -31
290 339 -15
160 330 -52
Country as a whole
A N D
137.6 155.5 -12
147.8 148.0
0
125.9 140.1 -10
138.3 191.6 -28
201.6 175.0 +15
182.9 166.9 +10
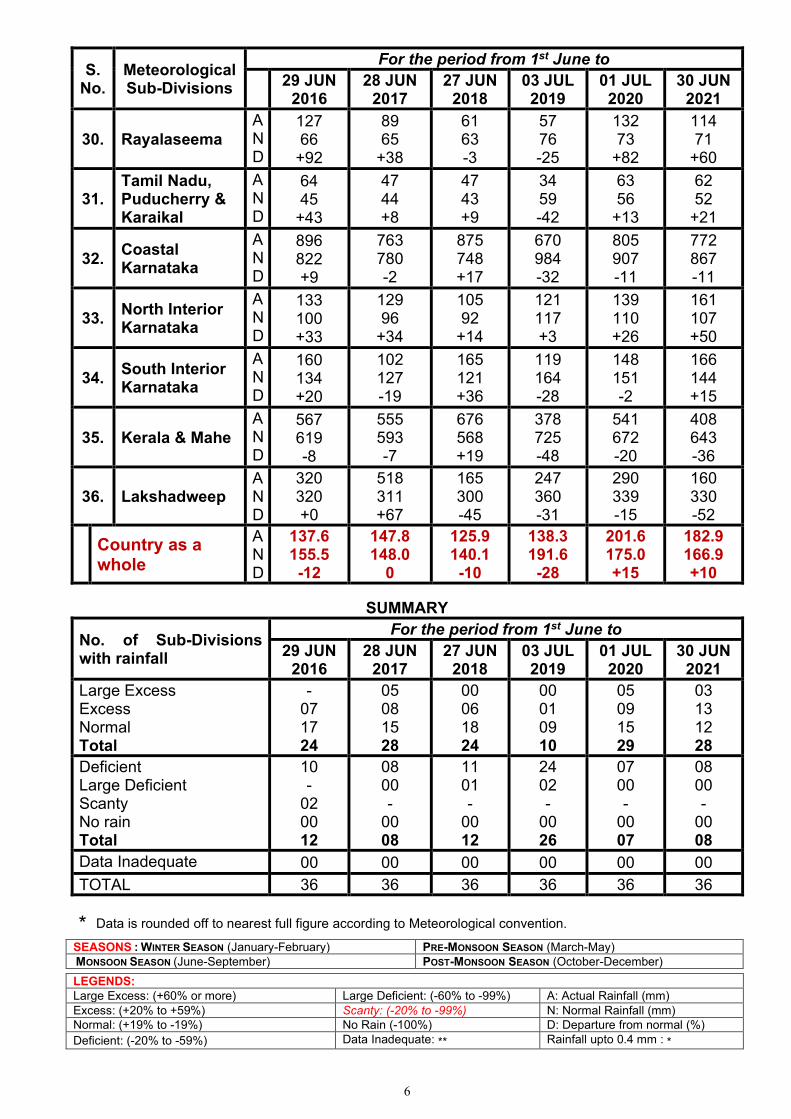
SUMMARY
No. of Sub-Divisions with rainfall
For the period from 1st June to
29 JUN 2016
28 JUN 2017
27 JUN 2018
03 JUL 2019
01 JUL 2020
30 JUN 2021
Large Excess Excess Normal Total
- 07 17 24
05 08 15 28
00 06 18 24
00 01 09 10
05 09 15 29
03 13 12 28
Deficient Large Deficient Scanty No rain Total
10 -
02 00 12
08 00 -
00 08
11 01 -
00 12
24 02 -
00 26
07 00 -
00 07
08 00 -
00 08
Data Inadequate 00 00 00 00 00 00
TOTAL 36 36 36 36 36 36
* Data is rounded off to nearest full figure according to Meteorological convention.
SEASONS : WINTER SEASON (January-February) PRE-MONSOON SEASON (March-May)
MONSOON SEASON (June-September) POST-MONSOON SEASON (October-December)
LEGENDS:
Large Excess: (+60% or more) Large Deficient: (-60% to -99%) A: Actual Rainfall (mm)
Excess: (+20% to +59%) Scanty: (-20% to -99%) N: Normal Rainfall (mm)
Normal: (+19% to -19%) No Rain (-100%) D: Departure from normal (%)
Deficient: (-20% to -59%) Data Inadequate: ** Rainfall upto 0.4 mm : *
Back to Top
Fig-2
3
Back to Top
Fig-3
30.06.2021
(1) Area Weighted Rainfall (mm) for the country as a whole :
Rainfall
Actual
Normal
% Dep.
(2) Categorywise No. of Subdivisions & % Area of the Country :
L. Excess
Excess
Normal
Deficient
L. DeficientNo Rain
(3) Categorywise comparative distribution of Sub-divisions ( cumulative rainfall ) and All India % Rainfall Departure for last five years since June 1st
Category
L. Excess
Excess
Normal
Deficient
L. Deficient
No Rain
All India
% Dep.
(4) Categorywise comparative % distribution of districts ( cumulative rainfall )
STATEWISE DISTRIBUTION OF NO. OF DISTRICTS WITH EXCESS, NORMAL,DEFICIENT,SCANTY AND NO RAINFALL
PERIOD FROM : 01-06-2021 30-06-2021
Note: The rainfall figures are rounded off upto one decimal place.
(v)
PERCENT DISTRIBUTION OF DISTRICTS IN EARLIER YEARS SINCE 1st OCTOBER
OF DISTRICTS OUT OF THE
CATEGORYWISE DISTRIBUTION
DATE
30-6-2021
29-6-2016
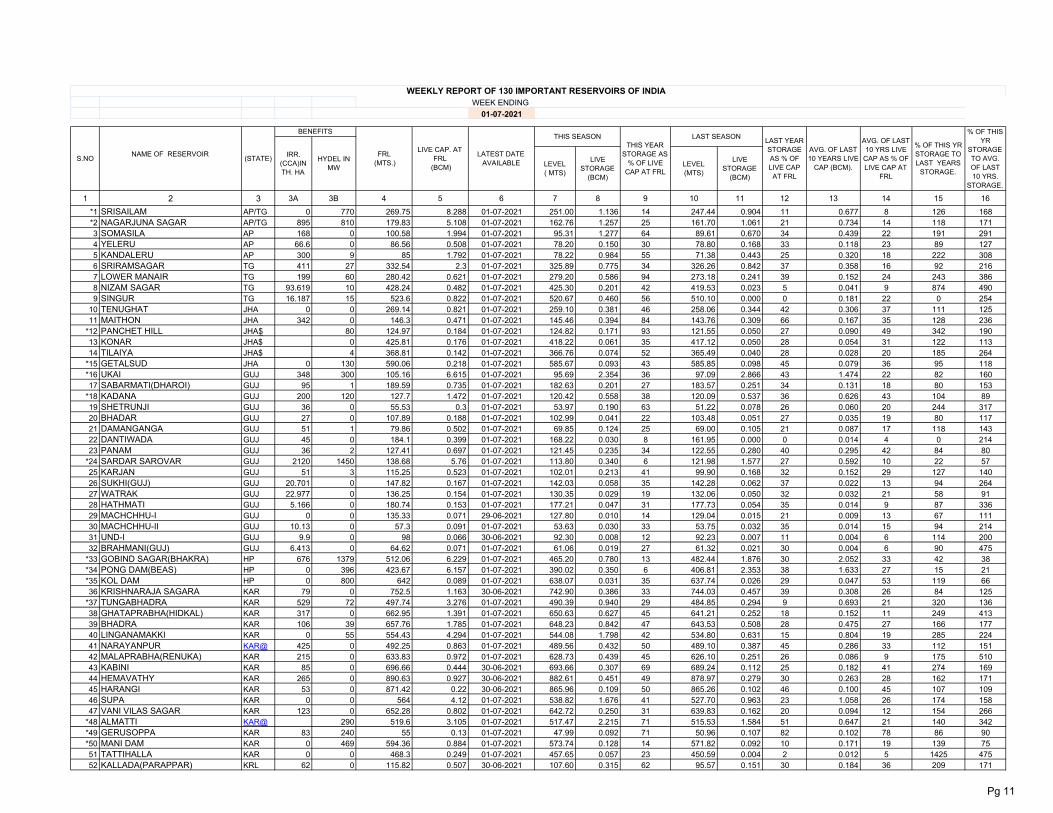
The total live storage in 130 important reservoirs in different parts of the country, monitored by CWC on weekending 01-07-2021 was 55.606 Billion Cubic Meter (BCM) ( 32 percent of the storagecapacity at Full Reservoirs Level (FRL) against 56.185 (BCM) ( 32 percent of the storage capacityat FRL) during corresponding date of pervious year and 40.166 (BCM)( 23 percent of the storage capacity at FRL) which is the average storage of the last 10 years. The storage was more than the lastyear's position by -0.579 BCM and more than the average of last ten years storage position by
15.440 BCM.
The current year's storage is nearly 99 percent of the last year's storage and 138percent of the average of last ten years. There are 111 reservoirs having storage more than 80percent, 11 reservoirs having storage 51% to 80%, 3 reservoirs having storage 31% to 50%. The reservoirs reporting storage upto 30% of normal storage is 5
Out of 130 reservoirs 2 nos. having no live storage as on 01-07-2021 and there were 4reservoirs reporting no live storage on the corresponding period of last year.
Government of India Central Water Commission
Water Management Directorate
RESERVOIRS STORAGE STATUS
CROP WEATHER WATCH GROUP 01-07-2021
Pg 3
The total live storage in 130 important reservoirs in different parts of the country, monitored byCWC on week ending 01-07-2021 is 55.606 Billion Cubic Meter (BCM). It is more than the average of last 10 yeras storage by 15.44 BCM and more than the last year's storage by-0.579 BCM.
SL. No. Description As on 01-07-2021 As on 24-06-2021Current Last Average Current Last
Year Year of last 10 Year YearYears
Total Live1 Storage 55.606 56.185 40.166 54.370 57.494
(BCM)
A comparison of details of storage position on 01-07-2021 is given below Status of 130 reservoirs 01-07-2021
Sl. No. Description of 10501-07-2021 24-06-2021 01-07-2020 Reservoirs
with Irrigation1 Storage as % of live capacity 32 31 32 36
at FRL (%) (%) (%) (%)2 Storage as % of last year's 99 95 195 99
storage (%) (%) (%) (%)3 Storage as % of 138 143 152 143
Normal storage (%) (%) (%) (%)4 Reservoirs having storage more than 80% of 111 116 105 91
Normal storage (Nos.) (Nos.) (Nos.) (Nos.)5 Reservoirs having storage more than 50% & 11 6 13 7
upto 80% of Normal storage (Nos.) (Nos.) (Nos.) (Nos.)6 Reservoirs having storage more than 30% & 3 4 7 3
upto 50% of Normal storage (Nos.) (Nos.) Nos (Nos.)7 Reservoirs having storage upto 30% 5 4 1 4
of Normal* storage (Nos.) (Nos.) (Nos.) (Nos)Nos. of reservoirs having no live storage (i.e. water level 2 2 4 2< MDDL) out of 128 reservoirs (Nos.) (Nos.) (Nos) (Nos.)
STATUS AS ON 01-07-2017 01-07-2018 01-07-2019 01-07-2020 01-07-2021
12 CAUVERY & NEIGHBOURING E.F.R.(Pennin. India) Somasila K. R Sagra Kabini Hemavathy Harangi L. Bhawani Mettur Vaigai Kandaleru
13 WEST FLOWING RIVERS OF SOUTH(Pennin. India) Damanganga Linganamakki Supa Kallada Idamalayar Idukki U. Vaiterna Parambikulam Aliyar Sholayar Kakki Periyar Gerusoppa
Malampuzha Bhatsa Tattihalla Mani Dam Surya Tillari
(BCM) (BCM) (BCM)
North India 15.334 29% 21.791 42% 15.966 31%
Penninsular India 40.272 33% 34.394 28% 24.200 20%
GODAVARI (Pennin. India)
Departure w.r.t. Storage of last week in
THIS WEEK
As % of FRL capacity
2021-07-01As % of
FRL capacity
44013Average of
Last 10 Years
TOTAL
RESERVOIRS
1 GANGA (North India)
9
CENTRAL WATER COMMISSION
WATER MANAGEMENT DIRECTORATE
WEEKLY STORAGE STATUS : "BASINWISE "WEEK ENDING
S. NO.
BASIN (REGION)
44006
LAST WEEK TOTAL LIVE CAPACITY AT FRL IN
BCM.Average of
Last 10 Years
LIVE STORAGE IN BCM
Current Year's
position
Last Year's storage position
Average of Last 10 Years position44371
As % of FRL
Capacity
Average
Region
121.949
Live StorageAs % of
FRL Capacity
Live Storage
Total Live Capacity at FRL
(BCM)
This year Last Year
KRISHNA (Pennin. India)10
52.284
As % of FRL
Capacity
Live Storage
Pg 6
01-07-2021
HARIHARJHOR ORI HARIHARJHOR ORI BHIMA(UJJANI) MAH BHIMA(UJJANI) MAH RANGAWAN UP PONG DAM(BEAS) HP TANDULA CHH GOBIND SAGAR(BHAKRHP MATATILA UP MAUDAHA UP SARDAR SAROVAR GUJ THEIN DAM PUN UPPER VAITARNA MAH KOL DAM HP INDIRA SAGAR MP UPPER KOLAB ORI SURYA MAH
MANI DAM KAR DOYANG HEP NAG BALIMELA ORI PANAM GUJ DUDHAWA CHH BISALPUR RAJ MACHKUND(JALAPUT) ORI MALAMPUZHA KRL KADANA GUJ GERUSOPPA KAR WATRAK GUJ THOKARWADI MAH BANSAGAR MP MANDIRA DAM ORI JHAKAM RAJ SHOLAYAR TN# MAHI BAJAJ SAGAR RAJ BHATSA MAH UPPER TAPI MAH
KANHER MAH RAMGANGA UKH GUMTI TRP BHATGHAR MAH TENUGHAT JHA
KHADAKVASLA MAH KRISHNARAJA SAGARA KAR URMODI MAH TEHRI UKH YELERU AP DUDHGANGA MAH UPPER WARDHA MAH TUNGABHADRA KAR JIRGO UP KARJAN GUJ DAMANGANGA GUJ GANDHI SAGAR MP MULSHI MAH
PARAMBIKULAM TN# SAPUA ORI
NARAYANPUR KAR@ IDAMALAYAR KRL SABARMATI(DHAROI) GUJ RIHAND UP
SIRSI UP KOYANA MAH SUPA KAR
Week ending
Projects having more than 80% of Normal storage
Projects having more than 50% & upto 80% of Normal storage.
Projects having more than 30% & upto 50% of Normal storage.
Projects having storage upto 30% of Normal storage.
Storage status of 130 reservoirs as compare to normal storage
Reservoir having no live storage out of 130 reservoirs
Pg 7
UKAI GUJ MAYURAKSHI WB MAHANADI CHH SHARDA SAGAR UP TILLARI MAH
SRISAILAM AP/TG KANGSABATI WB
KABINI KAR METTUR(STANLEY) TN KALLADA(PARAPPAR) KRL NAGARJUNA SAGAR AP/TG HIRAKUD ORI HEMAVATHY KAR IDUKKI KRL BHADRA KAR DHOM MAH BARGI MP MANIKDOH MAH PANCHET HILL JHA$ SANJAY SAROVAR MP KAKKI KRL UND-I GUJ KOLAR DAM MP PERIYAR KRL DANTIWADA GUJ MACHCHHU-II GUJ SRIRAMSAGAR TG
ISAPUR MAH LINGANAMAKKI KAR
MEJA UP MAITHON JHA RENGALI ORI BARNA DAM MP NIRA DEOGHAR MAH
PENCH(TOTLADOH) MAH SINGUR TG
BHANDARDARA MAH SUKHI(GUJ) GUJ
TILAIYA JHA$
VANI VILAS SAGAR KAR LOWER BHAWANI TN SOMASILA AP GIRNA MAH KANDALERU AP SHETRUNJI GUJ JAYAKWADI(PAITHAN) MAH HATHMATI GUJ ALMATTI KAR@ MULA MAH LOWER MANAIR TG YELDARI MAH GHATAPRABHA(HIDKAL) KAR BRAHMANI(GUJ) GUJ TATTIHALLA KAR VAIGAI TN NIZAM SAGAR TG MALAPRABHA(RENUKA) KAR OMKARESHWAR MP
TOTAL FOR 130 RESERVOIRS 21974.5 18743.04 174.233 55.606 56.185 40.166
PERCENTAGE 32 32 23 99 138
* HYDEL POWER CAPACITY HAVING CAPACITY MORE THAN 60MW$ TOTAL CCA 342 TH. HA OF DVC SYSTEM# TOTAL CCA 101 TH. HA OF PARAMBIKULAM, ALIYAR & SHOLAYAR@' TOTAL CCA 425 TH. HA. OF NARAYANPUR AND ALMATTI† SABARMATI RESERVOIR IS SUPPLEMENTED WITH NARMADA WATER THROUGH PIPELINE.
BRIEF NOTE ON LIVE STORAGE STATUS OF 130 RESERVOIRS IN THE COUNTRY (WITH REFERENCE TO RESERVOIR STORAGE BULLETIN OF 01.07.2021)
1. ALL INDIA STATUS Central Water Commission is monitoring live storage status of 130 reservoirs of the country on weekly basis and is issuing weekly bulletin on every Thursday. Out of these reservoirs, 44 reservoirs have hydropower benefit with installed capacity of more than 60 MW. The total live storage capacity of these 130 reservoirs is 174.233 BCM which is about 67.58% of the live storage capacity of 257.812 BCM which is estimated to have been created in the country. As per reservoir storage bulletin dated 01.07.2021, live storage available in these reservoirs is 55.606 BCM, which is 32% of total live storage capacity of these reservoirs. However, last year the live storage available in these reservoirs for the corresponding period was 56.185 BCM and the average of last 10 years live storage was 40.166 BCM. Thus, the live storage available in 130 reservoirs as per 01.07.2021 Bulletin is 99% of the live storage of corresponding period of last year and 138% of storage of average of last ten years.
As per Table-01, the overall storage position is less than the corresponding period of last year in the country as a whole but is better than the average storage of last ten years during the corresponding period.
2. REGION WISE STORAGE STATUS: a) NORTHERN REGION
The northern region includes States of Himachal Pradesh, Punjab and Rajasthan. There are 8 reservoirs under CWC monitoring having total live storage capacity of 19.17 BCM. As per Reservoir Storage Bulletin dated 01.07.2021, the total live storage available in these reservoirs is 3.35 BCM which is 17% of total live storage capacity of these reservoirs. The storage during corresponding period of last year was 39% and average storage of last ten years during corresponding period was 33% of live storage capacity of these reservoirs. Thus, storage during current year is less than the corresponding period of last year and is also less than the average storage of last ten years during the corresponding period.
b) EASTERN REGION The Eastern region includes States of Jharkhand, Odisha, West Bengal, Tripura and Nagaland. There are 20 reservoirs under CWC monitoring having total live storage capacity of 19.96 BCM. As per Reservoir Storage Bulletin dated 01.07.2021, the total live storage available in these reservoirs is 6.30 BCM which is 32% of total live storage capacity of these reservoirs. The storage during corresponding period of last year was 29% and average storage of last ten years during corresponding period was 23% of live storage capacity of these reservoirs. Thus, storage during current year is better than the corresponding period of last year and also it is better than the average storage of last ten years during the corresponding period.
c) WESTERN REGION The Western region includes States of Gujarat and Maharashtra. There are 42 reservoirs under CWC monitoring having total live storage capacity of 35.24 BCM. As per Reservoir Storage Bulletin dated 01.07.2021, the total live storage available in these reservoirs is 10.38 BCM which is 29% of total live storage capacity of these reservoirs. The storage during corresponding period of last year was 33% and average storage of last ten years during corresponding period was 20% of live storage capacity of these reservoirs. Thus, storage during current year is less than the storage of last year but is better than the average storage of last ten years during the corresponding period. Pg 1
d) CENTRAL REGION The Central region includes States of Uttar Pradesh, Uttarakhand, Madhya Pradesh and Chhattisgarh. There are 23 reservoirs under CWC monitoring having total live storage capacity of 45.27BCM. As per Reservoir Storage Bulletin dated 01.07.2021, the total live storage available in these reservoirs is 13.80 BCM which is 30% of total live storage capacity of these reservoirs. The storage during corresponding period of last year was 39% and average storage of last ten years during corresponding period was 25% of live storage capacity of these reservoirs. Thus, storage during current year is less than the storage of last year but is better than the average storage of last ten years during the corresponding period.
e) SOUTHERN REGION The Southern region includes States of Andhra Pradesh, Telangana, AP&TG (2combined projects in both states), Karnataka, Kerala and Tamil Nadu.There are 37 reservoirs under CWC monitoring having total live storage capacity of 54.60 BCM. As per Reservoir Storage Bulletin dated 01.07.2021, the total live storage available in these reservoirs is 21.77 BCM which is 40% of total live storage capacity of these reservoirs. The storage during corresponding period of last year was 25% and average storage of last ten years during corresponding period was 20% of live storage capacity of these reservoirs. Thus, storage during current year is better than the storage of corresponding period of last year and also is better than the average storage of last ten years during the corresponding period.
******************************
Disclaimer: The Data contained in this Bulletin is as received from the State Government/Project Authorities.