44
Frigga Kruse and Benjamin Koster Interdisciplinary archaeological fieldwork on Blomstrand, Kongsfjorden, Spitsbergen Final report July 12 – 20, 2014

Frigga Kruse and Benjamin Koster
Interdisciplinary archaeological fieldwork on Blomstrand, Kongsfjorden, Spitsbergen
Final report
July 12 – 20, 2014
2
Non-technical summary
In July 2014, researchers carried out interdisciplinary fieldwork at the former British mining
settlement and quarries on Blomstrand in Kongsfjorden, Spitsbergen. They formulated two main
questions: 1) why did past attempts to quarry marble on this Arctic island fail and 2) what was the
lasting impact of this industry on the local environment? In order to generate answers, the
archaeologist enlisted the help of a geologist, a biologist, and a team of divers. The geologist carried
out a ground-penetrating-radar (GPR) survey to investigate the quality of the marble below the
surface. The biologist conducted a vegetation survey to identify any foreign plants that the miners
might have introduced and to look for signs that livestock known from old photographs might have
fertilised the ground. The divers inspected the small natural harbour of Peirsonhamna to see if the
industrial past had left any submerged traces. In addition to the fieldwork, the archaeologist
undertook archival research in Great Britain in autumn 2014 to search for other real or potential
reasons that could have caused the abandonment of the quarries.
The geologist was able to show that the marble was frequently fractured, but between fracture
zones, there were also areas of rock that could have been worked successfully. The biologist
identified newly appeared plants, especially grasses, which grew around some but not all of the
former buildings in the settlement. Further analysis will have to show whether the animal (or human)
dung had enriched the soil. The diving team found only a few large metal objects under water, which
provided common algae with fixed hard surfaces on which to grow, but on the whole, the mining
operations did not seem to have had any visible effect on Peirsonhamna.
While the GPR survey was inconclusive about the reasons for the site’s abandonment, the historical
documents consulted in British archives suggest some serious foul play by the company before and
probably after the First World War. They also show that there was a growing demand for marble
before the conflict. Afterwards, the market crashed because the British Government subsidised
affordable housing for returning British soldiers instead of wasting limited resources on luxury
building, i.e. the construction of villas, cinemas, theatres, and such like. It appears that the
discontinuation of the marble quarries had little to do with the actual stone but was a logical decision
in view of what was happening in Europe at the time.
Keywords
Archaeology, Blomstrand, development, diving, environmental impact, geology, GPR, historical
ecology, history, industry, marble, metal detecting, mining, newly appearing plants, quarrying,
Spitsbergen, Svalbard, vegetation

3
Content
Introduction 5
Aims and objectives 6
Geological, tectonic, and historical-archaeological setting 7
Geological and tectonic setting 7
Historical-archaeological setting 10
Methodology 12
Practical limitations to the fieldwork 12
Ground-penetrating radar (GPR) survey at the quarries 12
Vegetation survey in the settlement 15
Reconnaissance dive in Peirsonhamna 16
Newly recorded archaeology on Blomstrand 17
Archival research in Great Britain 18
Results 20
Ground-penetrating radar (GPR) survey 20
Survey grids 1 and 2 21
Survey grid 3 23
Survey grids 4 and 5 25
Survey grid 6 27
Survey grid 7 30
Vegetation survey 32
Reconnaissance dive 34
Newly recorded archaeology 34
Archival research 35
Discussion, conclusion, and future work 36
Outreach in Svalbard 40
Svalbardposten 40
Workshop in the Svalbard Museum 40
SEPF reporting requirements 40
Archive location 41
References and bibliography 42
Appendices
Appendix 1 – GPR Survey at the quarries
A1.1 GPR equipment in use
4
A1.2 Historical quarry and borehole locations, 1920
A1.3 Summary of historical borehole data, 1912/13
A1.4 Summary of historical quarries and boreholes, 1920
A1.5 Raw GPR data (contact sheet)
A1.6 Processed GPR data (contact sheet)
Appendix 2 – Full photographic record
Appendix 3 – Vegetation survey in the former settlement
A3.1 Map of vegetation survey
A3.2 Measurements of grass tillers (production)
Appendix 4 – Reconnaissance dive in Peirsonhamna
A4.1 Zusammenfassung der Ergebnisse (summary of results)
Appendix 5 – Newly recorded archaeology
A5.1 Map of newly recorded archaeological features, July 2014
A5.2 List of newly recorded archaeological features, July 2014
A5.3 Calendar 1968
A5.4 Walkover
Appendix 6 – Results of archival research
A6.1 Repeat photography
A6.2 Archival sources related to marble and marble working
A6.3 Home Office statistics, 1902-1912
A6.4 Iona Marble Co. Ltd: summary of the company file
A6.5 Skye Marble Ltd: summary of the company file
A6.6 Summary of environmental impact and disease, 1912/13
Appendix 7 – Outreach
A7.1 Article ‘Frigga får oppfly marmordrømmen’, 29/11/2013
A7.2 Workshop poster
A7.3 Article ‘Marmor kan ha skylden’, 8/8/2014
A7.4 Audience-friendly report
A7.5 Audience friendly presentation

5
Introduction
Interdisciplinary archaeological fieldwork took place on the Arctic island of Blomstrand in
Kongsfjorden, Svalbard, Norway, approximately 78°57’41”N and 12°2’38”E (Fig. 1) between July 12
and 20, 2014.
Fig. 1 Location of the Arctic island
of Blomstrand in Kongsfjorden,
Svalbard, Norway. (Map:
Norwegian Polar Institute)
It comprised a non-intrusive
ground-penetrating radar (GPR)
survey, a vegetation survey, and a
reconnaissance dive in Peirson-
hamna. These investigations were
undertaken as part of two different
research projects. The first was
“Marble at Fault” (RiS ID 6912),
which was funded by the Svalbard
Environmental Protection Fund
(Svalbards Miljøvernfond) and supported by the University of Groningen (RUG). The second was
“Environmental consequences of four hundred years of natural-resource exploitation on
Spitsbergen” (“Consequences of exploitation” in short, RiS ID 6917), which was funded by the
Netherlands Organisation of Scientific Research (NWO) and also supported by the RUG.
Throughout the fieldwork and on both projects, the archaeologist and author of this report Dr Frigga
Kruse of the Arctic Centre of the RUG was the principal investigator. She is indebted to the geologist
Dr Benjamin Koster of RWTH Aachen University, the biologist Dr Maarten Loonen of the Arctic Centre
of the RUG as well as station leader of the Netherlands Arctic Station in Ny Ålesund, and the diving
supervisor Mr Max Schwanitz and his team of divers of the Alfred-Wegener-Institut (AWI) for their
invaluable scientific expertise and practical support in the field. The fieldwork also benefitted from
the extensive logistical services offered by Kings Bay AS in Ny Ålesund. Furthermore, Kruse extends
her thanks to the Georadar-Forum for critical methodological recommendations as well as the
Svalbard Museum and Svalbardposten for providing an important platform for education and
outreach.

6
Aims and objectives
The fieldwork being part of two different research projects, it combined the aims and objectives of
both in equal measures.
The overall aim of “Marble at Fault” was of an industrial archaeological nature. The project aimed to
disclose why historical attempts of large-scale quarrying of High Arctic marble failed on Marble Island
(historically speaking). During the fieldwork, Kruse intended to test the hypothesis that structural
geological changes had negatively affected the marble (Siggerud 1960) by engaging geological
expertise to conduct a non-intrusive geophysical survey at carefully chosen locations on the island.
More specifically, ground-penetrating radar (GPR) would be used to discern if there were structural
weaknesses in the vicinity of known historical quarries and boreholes, which may be to blame for
their abandonment. The title of the project “Marble at Fault” is a play on words as a certain type of
structural weakness is known in geology as a fault. To prevent foregone conclusions, Kruse also
carried out additional archival research in Great Britain after the fieldwork with the objective of
identifying other reasons, real or potential, for the discontinuation of the quarries.
The overall aim of “Consequences of exploitation” was of rooted in historical ecology. The project
aimed to qualify and quantify the anthropogenic impact of historical exploration and quarrying on
the local terrestrial and coastal ecosystems of Marble Island. Hence, Loonen undertook a vegetation
survey in order to identify non-indigenous plant species, specifically grasses, that may have been
introduced as a result of the industrial operations. Secondly, Schwanitz and a team of divers carried
out a series of dives in the natural harbour of Peirsonhamna in order to detect if the operations had
any lasting effects under water.
Broadly speaking, the fieldwork would generate new knowledge about Svalbard’s industrial past and
cultural heritage, thereby improving academic and public awareness of this historical mining site.
Uncovering crucial information about the hither-to poorly understood and probably unique material
remains of Arctic marble quarrying could potentially benefit the archipelago by enhancing their value
as a source of historical and polar knowledge, as an intense visitor experience of a bygone industrial
age, and as a source of revenue through improved tourism.

7
Geological, tectonic, and historical-archaeological setting
The focus of the interdisciplinary fieldwork lay on the south-western quarter of Blomstrand between
Peirsonhamna on the south coast and Grottevika on the west coast (Fig. 2). As the historical British
name of Marble Island suggests, an Englishman found it to consist of marble in 1906, and a range of
material remains attesting to subsequent exploration and quarrying are well-preserved here. It is
important, therefore, to gain an understanding of the underlying geology of those areas that merited
further investigation as well as the historical-archaeological work done to date, in particular any
questions left unanswered.
Fig. 2 The island of Blomstrand. The fieldwork focussed on the south-western quarter between
Peirsonhamna to the south and Grottevika to the west. (Map: W. Dallmann.)

8
Geological and tectonic setting
Svalbard represents the emergent northwestern part of the Barents Shelf, which uplifted during the
Late Mesozoic and Cenozoic (e.g. Johnson et al. 2001, Dallmann 2007). The uplift of the archipelago
was most extensive in the northern and western parts, leaving gradually older rocks in those
directions (Johnson et al. 2001). The geological record of Svalbard ranges from possible Archaean age
to the recent past and shows a multi-orogenic development with prominent tectonic events at
several ages (e.g. Dallmann 2007, Elvevold et al. 2007). The main geological record of Svalbard can be
separated into three broad divisions: the basement of igneous and metamorphic rocks formed during
Precambrian to Silurian times, which has suffered several episodes of folding and alteration;
unaltered Late Palaeozoic to Cenozoic sedimentary rocks, which form a trough-shaped structure
(Central Tertiary Spitsbergen Basin) from the Isfjorden area (central Spitsbergen) to the south; and
unconsolidated Quaternary surficial deposits formed during and after the last ice age (e.g. Dallmann
2007, Elvevold et al. 2007).
A dominant NNW-SSE trending structural grain on Spitsbergen comprises several similarly aligned
episodes of tectonic deformation (e.g. Johnson et al. 2001, Pirli et al. 2013). Svalbard’s tectonic and
geologic regions may be divided into: Precambrian to early Silurian rocks (Pre-Old Red basement) in
the north-eastern part of Spitsbergen and on Nordaustlandet; Devonian cover rocks and grabens on
northern Spitsbergen; the Central Tertiary Spitsbergen Basin; Triassic and partly Cretaceous platform
areas on the eastern parts of Spitsbergen and on Barentsøya and Edgeøya; and the Tertiary fold-and-
thrust belt along the west coast of Spitsbergen, which has possibly reactivated older structures (e.g.
Johnson et al. 2001, Dallmann 2007, Elvevold et al. 2007).
The area under investigation in this study is located in the Kongsfjorden area (northwestern
Spitsbergen), which is characterised by Mesoproterozoic rocks in the northern part, respectively
Carboniferous and Permian as well as Palaeogene and Neogene rocks in the southern parts of the
fjord. The NNW-SSE trending faults by the Tertiary fold-and-thrust belt dominate the younger
tectonic regime in this area. Furthermore, deglaciation of the Kongfjord is reported since the Late
Weichselian (e.g. Lehman & Forman 1992, Lauritzen 2006, Ingólfsson and Landvik 2013) and is linked
to sea level changes and following tectonic uplift that still affects the study area.
Blomstrandøya (Marble Island) consists mainly of medium to high-grade metamorphic Caledonian
marbles as well as pelitic schists and gneisses (e.g. Thiedig and Manby 1992, Lauritzen 2006). Thiedig
and Manby (1992) as well as Lauritzen (2006) describe the Caledonian rocks striking N-S and having
been affected by two synmetamorphic, co-linear phases of isoclinal folding as well as refolding by
post-metamorphic crenulation to kink-folds, which are often associated with west-directed thrust
faulting and imbrication.

9
Additionally, some small patches of unmetamorphosed, possibly Devonian, sediments are widely
scattered on Marble Island (Lauritzen 2006). These sediments are either preserved in wedges
associated with faulting and brecciation of the underlying marbles, or they occur in fan-shaped
bodies filling channels and tubes in the marbles. Furthermore, these sediments are often injected
into a mesh of calcitic veins which penetrate parts of the marbles (Thiedig and Manby 1992,
Lauritzen 2006). The uplifted coastline of Marble Island is also characterised by some karstic caves
which formed during the last thousands of years (Lauritzen 2006, Fig. 2).
In present geological or tectonic maps (e.g. Buggisch et al. 1992, Thiedig and Manby 1992), thrust
faults or folds are not indicated within the areas of the GPR survey grids. However, we have observed
several secondary features (e.g. cracks, fracture zones, or a natural slip surface) which are most likely
related to fault or isostatic uplift activity (Fig. 3).
Fig. 3 A recent crack probably
caused by tectonic uplift that still
affects Blomstrand, looking south
towards Ny Ålesund. (Photo: F.
Kruse.)
A question which geologists often
do not stop to ask, probably
because of the chasm between
geological and archaeological/
historical scales, but which is
crucial to this study is how much geological knowledge was available to the historical actors arriving
on Blomstrand a century ago. In fact, the chemistry of marble and its geological formation did not
need to be a mystery (unless one did not care to inform himself properly). In 1909, William George
Renwick published ‘Marble and marble working’ which treated the dimension stone on a global scale.
Unfortunately, the author of this report only became aware of the readily available e-book at the
time of writing, so that much of its valuable information could not be included in the text. Suffice to
say that a general knowledge of marble existed but that local knowledge of the resource on
Blomstrand and how to work it needed to be generated on site.

10
Historical-archaeological setting
The English prospector Ernest Mansfield, having had some prior experience of marble quarrying,
discovered Marble Island in summer 1906. Development did not start until spring 1911 and, after a
voluntary absence during the First World War, only lasted until 1920.
Fig. 4 The mining settlement and
quarries at Peirsonhamna, ana-
chronically known as Ny London.
The map indicates the overlap
between features listed in the
Askeladden database (numbered)
and additional features mapped
during the LASHIPA Project in 2008.
(Map: F. Kruse.)
The material remains of
Blomstrand are now protected,
and many but not all are recognised and listed in the Askeladden database (askeladden.ra.no). In
2008, the LASHIPA Project (“Large-scale historical exploitation of polar areas”, RiS ID 3106) carried
out an industrial archaeological survey of the mining settlement and quarries at Peirsonhamna
(commonly but anachronically known as Ny London). The survey results have been reported in
Aalders et al. (2009). The overlap of Askeladden and LASHIPA is indicated in Fig. 4.
Fig. 5 In 2011, Dutch researchers
reported a small quarry to the
south of Grottevika. (Map: F.
Kruse.)
Moreover, researchers of the
Netherlands Arctic Station
surveyed a small historical marble
quarry to the south of Grottevika
in 2011. Besides an extensive
mention on the Station’s weblog
11
(poolstation.nl), this quarry remained unreported. It currently does not have a corresponding
Askeladden entry, while two claim signs of the Northern Exploration Company (commonly
abbreviated to NEC) to the north of Grottevika do (Fig. 5).
Within the LASHIPA framework, Kruse (2013) investigated the activities of the Northern Exploration
Co. She has been able to conclude that the history of the High Arctic marble quarries remains poorly
understood and is probably unique in the polar world. Yet, the documents she has consulted to date
are vague about the workability and the profitability of the natural resource. Unknown sources have
been quick to pinpoint the effect of permafrost, which supposedly thawed upon transportation to
warmer climates, to be the main reason behind the company’s failure to exploit the dimension stone.
This has been repeated uncritically in several current guide books (e.g. Hermansen 2007, 162;
Umbreit 2009, 137; Johannsen 2011, 155) and has unfortunately found its way onto the internet and
into many tourists’ blogs. Thankfully, Stange simply refers to the quality of the marble being low due
to ‘many cracks’ (2011, 301). Since in geology, cracks can have different origins, this statement allows
room for analysis and reinterpretation. In fact, the notion of permafrost being to blame has already
been investigated and discarded by Siggerud (1960). He instead proposes potentially unfavourable
structural geology such as subsurface fault patterns, which would cause the marble to fail on a
medium to large scale. His hypothesis had not yet been tested.
On the note of environmental consequences, it is assumed that the historical actors did not care too
much about these unless their direct causes also hindered the operations and affected profitability. It
is highly doubtful that any of the actors were aware of creating what is today an archaeological site,
let alone having lasting and measurable effects on local ecosystems.
12
Methodology
Practical limitations to the fieldwork
Owing to Blomstrand’s relative isolation, there were limitations to the fieldwork that could be carried
out within the financial and time constraints. Most conveniently, researchers fly from the Norwegian
mainland via Svalbard’s capital of Longyearbyen to the scientific village of Ny Ålesund (78°55′30″N
11°55′20″E). They commonly ship any heavy or bulky equipment well in advance of the field season.
The GPR equipment could not be shipped because it could not be spared by the Georadar-Forum
until close to Kruse’s and Koster’s actual date of departure. Hence, Koster was forced to reduce the
weight and size of the equipment, including his personal belongings, to approximately 40kg. This still
exceeded the very strict allowance of 20kg per person on flights between Longyearbyen and Ny
Alesund, but timely registration with Kings Bay AS and paying for the excess luggage took care of this.
The informal suggestion of taking a chance with more equipment since occasionally flights are not
fully booked was immediately disregarded. Having a very narrow fieldwork window of only seven
days, we could not risk any of our equipment not reaching Ny Ålesund and in turn Blomstrand. As a
result, Koster worked with only one antenna instead of the usual range of three antennae.
Kruse had prepared to take a Differential Global Positioning System (dGPS) to Blomstrand. She was
aware that Ny Ålesund is a ‘radio silent area’, a fact that is drummed into any visitor in the
possession of a mobile phone. However, in the absence of easily accessible details about this radio
silence or a map of its extent, she did not realise that the area extended across Kongsfjorden to
Blomstrand. She was hence not permitted to use the dGPS and needed to borrow an unfamiliar
instrument. Unfortunately, this instrument, while clearly indicating altitude on the screen, failed to
record the important data, which undermined the results and success of the fieldwork.
Ground-penetrating radar(GPR) survey at the quarries, conducted by B. Koster
In 2008, members of the LASHIPA Project observed a substantial fracture zone in the historical
Winter Quarry (1919/20) on Blomstrand (Fig. 6). They were also able to trace several cracks on
nearby outcrop surfaces. Although this fault may have been an obvious reason behind this particular
quarry’s abandonment, it was outside the scope of their fieldwork to examine this assumption
further.
Between July 12 and 16, 2014, a ground penetrating radar (GPR) survey was therefore carried out to
investigate these and other possible zones of weakness such as cracks, faults, and holes in the
subsurface. A medium-frequency antenna promised to be the best compromise between the spatial
resolution of any cracks or faults, and the achievable penetration depth. As can be seen in Appendix
1, A1.1, we used a GSSI 400MHz antenna with a survey wheel, a SIR-3000 data acquisition system,

13
and a handheld GPS. Trace increment was set to 0.02m in order to achieve a high data density; the
range was set to 90ns TWT with a sample rate of 1024. Using the 400MHz GPR antenna, a GPR target
depth of approximately 4m could be aimed for.
Fig. 6 A fault and a natural slip
surface observed in a historical
quarry on Blomstrand in 2008.
(Photo: D. Avango.)
The number of GPR survey grids
was dependent on the time spent
on site, which in turn dependent
on weather and ice conditions as
well as transport arrangements
between Ny Ålesund and Blomstrand. The positioning of the grids was guided by previously known
historical quarry and borehole locations (Appendix A1.2). Ultimately, seven GPR survey grids were
laid out in such a way as to allow for the best comparison of historical information and subsequent
GPR data (Figs. 7 and 8). The most relevant historical data that was known prior to the fieldwork has
been summarized in Appendices A1.3 and A1.4.
Fig. 7 GPR survey grids 1 to 5. Grid
1 was positioned immediately west
of the Winter Quarry (1919/20).
Grid 2 was positioned south of both
the Winter Quarry and Grid 1. The
two x’s between mark the
boreholes B1-68 (left) and B2-68
(right), which were drilled in 1968.
Grid 3 was positioned on a marble
outcrop near No. 2 Quarry, the x
here marking a borehole sunk in
winter 1912/13. Grid 4 was
positioned immediately west of No.
3 Quarry opened in summer 1912.
Grid 5 was positioned immediately

14
east of the same. The x’s mark a borehole probably drilled in winter 1912/13 (south) and borehole B5-
68 sunk in 1968 (north). (Map: F. Kruse.)
Fig. 8 GPR survey grids 6 and 7.
Grid 6 was positioned immediately
north of Quarry A13 opened in
spring 1920. Grid 7 was positioned
on a marble outcrop that
comprised two boreholes sunk in
summer 1920. (Map: F. Kruse.)
Additional details of the GPR
survey grids 1 to 7 are provided in
Fig. 9 below. A spacing of 1m was
chosen, with which 125 GPR
profiles were completed. Using Surfer 11 (Golden Software), it was subsequently possible to
reconstruct pseudo-3D subsurface models visualizing weakness zones in the marble (e.g. Grandjean
& Gourry 1996; Godio et al. 2003).
Fig. 9 Details of the seven GPR survey grids. A spacing of 1m was used, and 125 profiles were
completed. (Figure: B. Koster.)

15
To give an indication of the raw data collected, a contact sheet of all 125 profiles has been included
in Appendix 1.5. General GPR data processing was then carried out with ReflexW V7.5 (Sandmeier
Scientific Software) and included static correction, back-ground removal, gain adjustments, and
velocity adaption for time-depth conversions. The latter was based on a hyperbola analysis where
such features were present. Additionally, we used characteristic velocities based on the subsurface
material, which in this study is marble (Grandjean & Gourry 1996; Neal & Roberts 2000; Neal 2004;
Sambuelli & Calzoni 2010). A contact sheet of the processed images is included in Appendix A1.6.
Cracks and faults were detected due to hyperbolic features and abruptly shifted continuous
reflectors in the data (e.g. Grandjean & Gourry 1996; Godio et al. 2003; Sambuelli & Calzoni 2010).
For some grids, the GPR data can partly be correlated with quarries opened by the Northern
Exploration Co. in the early 20th century in order to verify and trace the detected cracks and faults.
Photo documentation, study area description, and levelling of the study areas were also carried out
in the field. Appendix 2 comprises a full photographic record of the fieldwork. Additionally, historical
boreholes were calibrated by handheld GPS to compare historical borehole logs with GPR data at
these locations.
Vegetation survey in the former mining settlement, conducted by M. Loonen
It was known from historical sources that the Northern Exploration Co. had imported livestock for
the provision of fresh meat. Pigs were present on site in summer 1912, the last of that lot being
slaughtered in December, and cattle was landed in June 1913 (Booth 1913). The photograph below
(Fig. 10) was taken at the back of the settlement, looking southeast, probably prior to the
construction of the storehouse. Dogs were kept for company, too. Humans, pigs, cows, hay, and to a
lesser extent dogs may have had a measurable impact on the local vegetation.
Fig. 10 Cattle attempting to
graze at the back of the
mining settlement on
Blomstrand. They are also
being feed hay. (Source: Barr
et al 2011, 103.)
Independently of Kruse and
Koster, Maarten Loonen
visited the former mining

16
settlement on Blomstrand on a number of occasions between June and August 2014. On these
occasions, he studied the local vegetation as a component of the terrestrial ecosystem. ‘Local’ not
being strictly defined, it loosely refers to the vicinity of the upstanding houses as well as the barrack
and storehouse foundations at a radius of +/- 10m.
At the beginning of the season in June, Loonen erected several pairs of chicken-wire vegetation
exclosures (50cm x 50cm x 50cm) around the former settlement. Their locations are marked on the
map in Appendix A3.1. The vegetation exclosures have the function of preventing any grazing and
trampling of the vegetation by ‘exclosing’, for example, geese and reindeer (Fig. 11). The exclosures
were placed next to (but not on) selected barrack entrances, and their controls were positioned
approximately 6m away. In these exclosures, labelled A11, A12, A13, A14, A15, and A17, production
was measured on grass tillers at the end of the season on August 4, 2014. Thereafter, the
installations were removed without leaving a trace in the field.
Fig. 11 Reindeer passing by an
inconspicuous chicken-wire
vegetation exclosure, emphasising
the effectiveness of the temporary
installation. (Photo: B. Koster.)
On July 12, 16, and 20, 2014,
Loonen additionally carried out
visual surveys of the unexclosed
vegetation in the mining settle-
ment in order to describe the local plant assemblages and to map any newly appearing species. He
took small samples of these plants for identification and DNA-barcoding.
As this was a pilot study and time was limited, the quarries, the railway embankments, and other
zones of industrial activity were not studied this year.
Reconnaissance dive in Peirsonhamna, conducted by M. Schwanitz
A reconnaissance dive was conducted in the small bay of Peirsonhamna by Mr Max Schwanitz and a
team of divers of the Alfred-Wegener-Institut (AWI) based at Ny Ålesund between June 24 and July
10, 2014. The approximate position of the natural harbour is 78°57’41.06”N and 12°2’38.83”E (Fig.
4). It is roughly circular, measuring between 250m and 300m both in east-west direction and in
north-south direction. Depending on the state of the tide, the maximum water depth is between 6m
and 7m. It opens into Kongsfjorden to the south.

17
The team investigated Peirsonhamna on four occasions, completing a total of eight dives in
accordance to the GUV regulations “Einsatz von Forschungstauchern” (BGR / GUV-R 2112, issue
2011). The divers made use of an anchoring vessel and a lifeline. The dive times were between 27
and 53 minutes. The maximum depth was 6.2m.
Finds were marked by small buoys and ground weights. Subsequently – when possible – they were
photographed, measured, and occasionally drawn.
Mr Schwanitz provided a detailed report in German, which has been added in Appendix 4.
Newly recorded archaeology on Blomstrand, conducted by F. Kruse
While the planned interdisciplinary site work was progressing, Kruse took the opportunity to build on
the archaeological knowledge of the former mining settlement and quarries as indicated in Figs 4 and
5 above. By means of a walkover, she was able to confirm the majority of the observations and
interpretations of the LASHIPA Project in 2008 and newly recorded additional archaeological
features, thereby creating a more comprehensive image of the site and its site formation processes.
Furthermore, Kruse and Koster took time away from the GPR survey to ascend Ingensfjellet,
Blomstrand’s highest peak at 383m AOD and rounded the island on its west side. The hike served the
purpose of mapping any material remains not listed in the Askeladden database, thereby populating
the archaeological landscape. Any documentation pertaining to newly recorded archaeological
features has been included in Appendix 5.
Kruse also experimented with a metal detector. She had not asked sysselmannen for permission to
do this and hence none had been given. While metal objects could thus be located non-intrusively
beneath the surface, it was strictly forbidden to dig them up and identify them. So the point of metal
detecting was primarily one of testing the method under Arctic circumstances as a useful tool to
identify specific areas of metal-related activities. This befits a landscape approach to Svalbard
archaeology.
Kruse first attempted a metal detector survey on the beach in Peirsonhamna. This is best done at the
lowest tide and by working parallel to the shore, not at an angle. If the tide is going out, one can start
at the top of the beach and follow the water out. If the tide is coming in, one can start at the water’s
edge and work landwards. Coloured survey flags are suitable for marking locations that give off
signals. They are handy for marking ‘spot finds’, and they are equally handy for probing the
concealed edges of large structural metal. In addition, they are very visible in photographs, the only
recording of the detected locations that was done on this occasion in light of the disallowed dGPS.
Where structural metal needed to be ‘followed’, wooden toothpicks were used: they do not give off
a signal themselves and are short enough to survey over the top of. A subsequent ‘joining of dots’
reveals the extent of the item (Fig. 12).

18
Fig. 12 Toothpicks were used
during non-intrusive metal
detecting in Peirsonhamna in order
to trace the extent of concealed
structural metal. (Photo: F. Kruse.)
Limited time and an unexpected
overload of signals in Peirson-
hamna led to the abandonment of
the first attempt. A second effort
was made and completed on a ‘less
busy’ beach in the first small bay to the east of Peirsonhamna. No metal detecting was carried out in
the former mining settlement and industrial areas. These were assumed to be ‘too busy’ to give
useful results.
Archival research in Great Britain, conducted by F. Kruse
Strictly speaking, the fieldwork and the archival research in the UK occurred separately, but it makes
sense to combine and include the findings and preliminary interpretations of the latter in this report,
even if it does swell the pages. By means of introduction, the author has made an effort to repeat
some of the many known historical photographs in Appendix A6.1.
“Marble at Fault” being a multi-phased project, Kruse actually intended continued archival research
in both the UK as well as North America. Firstly, her documentary leads suggested that another
reason for the company’s failure may have been a depression in the British marble market caused by
significant changes as a result of the First World War, particularly a governmental subsidy of
affordable housing development rather than luxury building. Secondly, machinery remaining on
Marble Island today was manufactured and supplied by the US firms Sullivan and Ingersoll-Rand,
which proves the company’s efforts in the direction of America. This finds verification in historical
documents that also tell of a directorial visit to New York in 1912 in order to size up the American
marble market, enlist the help of marble specialists here, and enrol further investors. Archival
research in this direction could potentially reveal the reasons why subsidiary companies, which were
envisaged to carry out actual mining, never come forward.
Most importantly, the original hand-written manuscript, notebook, and diary of Herbert Leech,
marble manager for the first time in summer 1919 (and then again in summer 1920), survive in
Toronto, Canada, awaiting auction for the phenomenal sum approaching $9.900. This sum is

19
probably related to a mention of Shackleton, who is of great interest to collectors, although he never
actually arrived on Spitsbergen. Kruse hoped to obtain the cooperation of the current owner and
gain access to these papers in order to tap into their academic potential. Unfortunately, the owner
felt that he had nothing to gain from such a cooperation. Kruse never saw the papers, and their value
for this research remains unknown.
After the fieldwork in autumn 2014, Kruse conducted additional archival research in Great Britain.
Following up leads arising from her previous study, she visited the following repositories:
• The National Archives of Scotland, Edinburgh
• The National Mining Museum of Scotland, Newtongrange
• The North of England Institute of Mining and Metallurgy Library, Newcastle-upon-Tyne
In addition to consulting a broad but limited range of primary documentary sources, she met with Mr
David Newman, a local historian in Goldhanger, Essex, who provided valuable information about
Ernest Mansfield and others who had once resided in the village while at the same time being
instrumental to the Northern Exploration Co. and to the marble quarries on Blomstrand. Moreover,
she accessed The Times, The Gazettes, and Hansard (the UK parliamentary record) online.
The material relating to historical marble quarrying thereby discovered was sparse, but it opened
new lines of enquiry and occasionally led to unexpected results.
At the time of writing, Kruse became aware that an important contemporary text had become
available online. In 1909, Renwick published an extensive account of marble and marble working
around the globe. Unfortunately, Kruse did not have time to work through the text and include any
relevant aspects in this report. A quick glance, however, revealed that Renwick apparently did not
know about the marble quarries at Fauske in Norway. This and other historical details of marble and
marble workings are included in Appendix 6.
20
Results
Ground-penetrating radar (GPR) survey
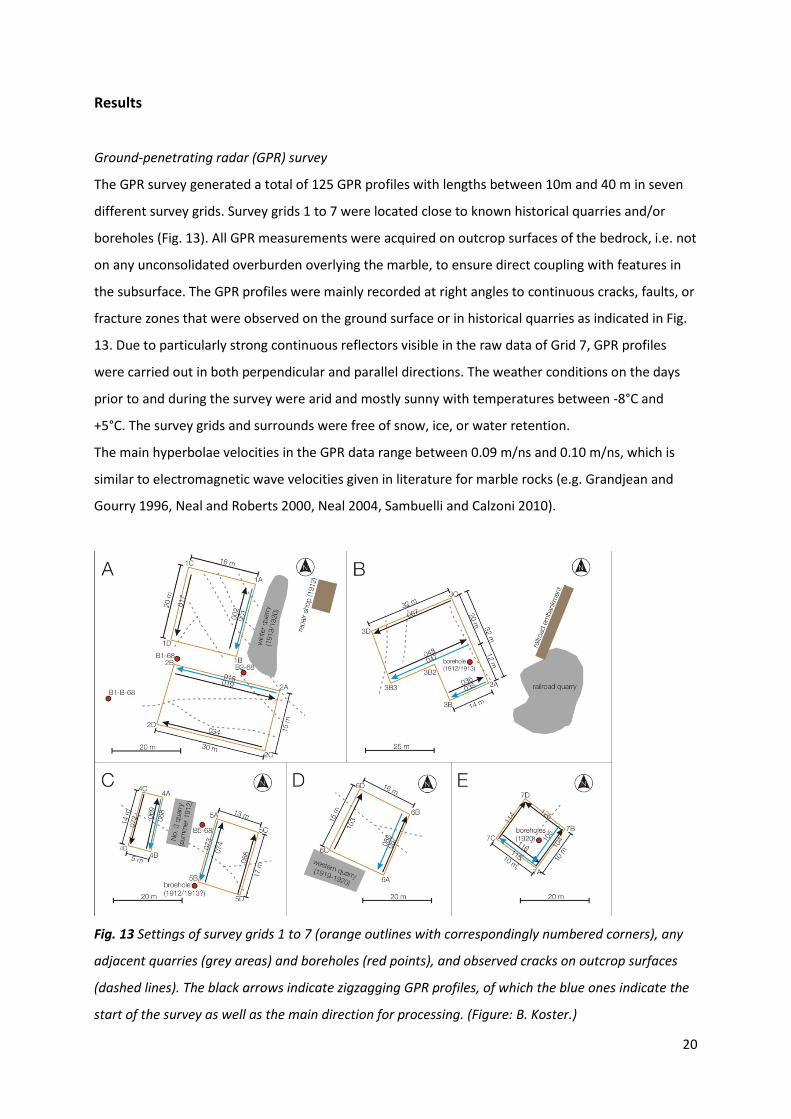
The GPR survey generated a total of 125 GPR profiles with lengths between 10m and 40 m in seven
different survey grids. Survey grids 1 to 7 were located close to known historical quarries and/or
boreholes (Fig. 13). All GPR measurements were acquired on outcrop surfaces of the bedrock, i.e. not
on any unconsolidated overburden overlying the marble, to ensure direct coupling with features in
the subsurface. The GPR profiles were mainly recorded at right angles to continuous cracks, faults, or
fracture zones that were observed on the ground surface or in historical quarries as indicated in Fig.
13. Due to particularly strong continuous reflectors visible in the raw data of Grid 7, GPR profiles
were carried out in both perpendicular and parallel directions. The weather conditions on the days
prior to and during the survey were arid and mostly sunny with temperatures between -8°C and
+5°C. The survey grids and surrounds were free of snow, ice, or water retention.
The main hyperbolae velocities in the GPR data range between 0.09 m/ns and 0.10 m/ns, which is
similar to electromagnetic wave velocities given in literature for marble rocks (e.g. Grandjean and
Gourry 1996, Neal and Roberts 2000, Neal 2004, Sambuelli and Calzoni 2010).
Fig. 13 Settings of survey grids 1 to 7 (orange outlines with correspondingly numbered corners), any
adjacent quarries (grey areas) and boreholes (red points), and observed cracks on outcrop surfaces
(dashed lines). The black arrows indicate zigzagging GPR profiles, of which the blue ones indicate the
start of the survey as well as the main direction for processing. (Figure: B. Koster.)

21
Survey grids 1 and 2:
The area under investigation in survey grids 1 and 2 is located to the west and southwest of the
Winter Quarry opened in winter 1919/20 (Fig. 7). In this quarry, a fault and a natural slip surface
were observed (Fig. 6; Fig. 13A; Appendix A1.4).
Fig. 14 Locations of observed crack or fault features within the subsurface of survey grids 1 and 2 as
well as two boreholes of 1968 (red rhombi). (A) Cracks and fractured zones visible at the surface (left,
green circles) and cracks and fractured zones only detected within the subsurface (right, grey circles)
using GPR (generally, the size of the circles increases with depth to ~4m below the surface); (B) Grids
1 and 2 visualised in a pseudo-3D model (colours as before, while point size is constant). (Figure: B.
Koster.)

22
The grids were surveyed in different directions due to the NW-SE trending of the fault and with the
objective to visualise additional structures as effectively as possible (Fig. 14A). The fault zone can be
traced throughout the whole of the GPR data for Grid 1 as well as Grid 2 from NNW to SSE and
approaching the maximum survey depths of ~4m (Fig. 14B).
Abruptly shifted reflectors in the GPR data as well as small vertically aligned hyperbolae reflections
with velocities around 0.09m/ns indicate fracturing of the marble. In some parts, the cracks are
branched in various directions, which is not visible from the ground surface but detectable by GPR. In
this survey area, a lot of vertical cracks that are not visible from ground surface (starting at a
minimum depth of 0.4m below the ground surface) were observed in the GPR data. These cracks are
aligned and branched in several directions emerging chaotic fracture structures. Within both survey
grids, only small parts are free from cracks and faults fracturing the marble.

23
Survey grid 3:
The area under investigation in Grid 3 is located ~300m to the SSW of Grids 1 and 2 at the end of the
former railway embankment and incorporates a historical borehole drilled and cemented in winter
1912/13 (Fig. 7; Fig. 13B; Appendix A1.3). Interestingly, the borehole had been sunk into one of two
linear cracks visible on ground surface along the eastern and western edges of the survey grid.
Between these cracks, homogenous conditions of the marble could potentially exist. The GPR survey
direction was thus chosen to be perpendicular to the linear cracks on the surface. The two main
cracks at the east and west edge of the survey grid clearly show in the GPR data up to ~4m depth
below ground surface (Fig. 15A). In the northern part of the survey grid, the GPR also detected
several small vertical cracks in the subsurface.
Fig. 15 Locations of observed crack or fault features within the subsurface of Grid 3 as well as a
borehole sunk in 1912/13 (red rhomb). (A) Faults and cracks traced from ground surface (greenish
points) and detected fractured zones and folds only within the subsurface (greyish points) using GPR
(in general: small points = near ground surface; bigger points = up to 4m depth below surface); (B)
Similar survey grid visualised in a pseudo-3D model with illustration of observed multiple folds in the
marble bedrock from slightly different viewing directions (colours of points indicate same
characteristics as previously mentioned while point size is constant). (Figure: B. Koster.)

24
Unexpectedly, the GPR data indicate two blended folds with several branched cracks (Fig. 15B). The
top of the upper fold is located only ~0.3m below ground surface. The folds are characterised by
relatively clear and continuous reflectors with sporadic linear adjacent hyperbolae reflections
(velocities ~0.09m/ns). Hence, the marble within Grid 3 is seriously fractured due to the folds and
adjacent fracture zones as well as several scattered vertical cracks.

25
Survey grids 4 and 5:
The areas under investigation in survey grids 4 and 5 are located only ~30m NE of grids 1 and 2 on
either side of the historical No. 3 Quarry opened in 1912 (Fig. 7; Fig. 13C; Appendix A1.4). There is
also a historical borehole sunk in winter 1912/13 (Appendix 1.3) and another one from 1968
(currently no known record). The GPR survey was carried out parallel to the direction of channeling
(quarrying by machine) and perpendicular to a long crack visible on the marble’s surface. The GPR
data in both areas are slightly overdriven, and cracks as well as fault features are challenging to
observe. The cracks visible on the surface (marked) can be followed by several small hyperbolae as
well as displaced continuous reflectors, which most likely indicate a fault (Figs. 16 & 17). The depth of
this feature can be observed up to the lower end (~4m depth below ground surface) of the GPR data.
Furthermore, a smooth continuous reflector at ~2m depth below ground surface is observed in
northern part of Grid 4. This feature possibly indicates an internal boundary or a dislocated surface
within the marble. In some GPR profiles, smooth reflection patterns with several small hyperbolae
are observed. These structures maybe indicate chaotic fracturing areas in the subsurface. It is not
clear whether these belong to crack features near the ground surface or possibly internal
alteration/weathering of the marble. Beside the main fault within survey grids 4 and 5, there are
several small (vertical) fracturing features visible. It remains challenging to interpret cracks at both
investigation areas due to the slightly overdriven data quality.
Fig. 16 GPR profile 69 recorded within survey grid 4: (A) processed GPR profile, (B) processed and
analysed GPR profile and (C) interpretation of the GPR profile. (Figure: B. Koster.)

26
Fig. 17 GPR profile 78 recorded within survey grid 5: (A) processed GPR profile, (B) processed and
analysed GPR profile and (C) interpretation of the GPR profile. (Figure: B. Koster.)

27
Survey grid 6:
The area under investigation in Grid 6 is located ~1.5km NW of the other survey grids and next to a
historical quarry known from a single historical source only as Quarry A13 opened either in winter
1919/20 or in spring 1920 (Fig. 8; Appendix A1.4). In the field, we called it the Western or Lighthouse
Quarry due to the modern beacon nearby. The survey grid was positioned at right angles to the
direction of mining but also perpendicular to a linear crack on the marble’s surface (Fig. 13D). The
GPR data comprise several discontinued reflectors as well as several single hyperbolae reflections.
Linear surface cracks marked in the GPR data can be traced by slightly shifted reflectors in the GPR
data as well as aligned hyperbolae reflections up to ~3.5m depth below ground surface (Fig. 18).
Further vertical cracks can be linked to linear hyperbolae reflections or shifted discontinued
reflectors in the marble. Altogether the marble in this investigation area seems not as affected by
damaging of the marble due to fractures and cracks, although some fracturing of the marble in the
adjacent surface works can be observed.
Fig. 18 GPR profile 102 recorded within survey grid 6: (A) processed GPR profile, (B) processed and
analysed GPR profile and (C) interpretation of the GPR profile. (Figure: B. Koster.)
28
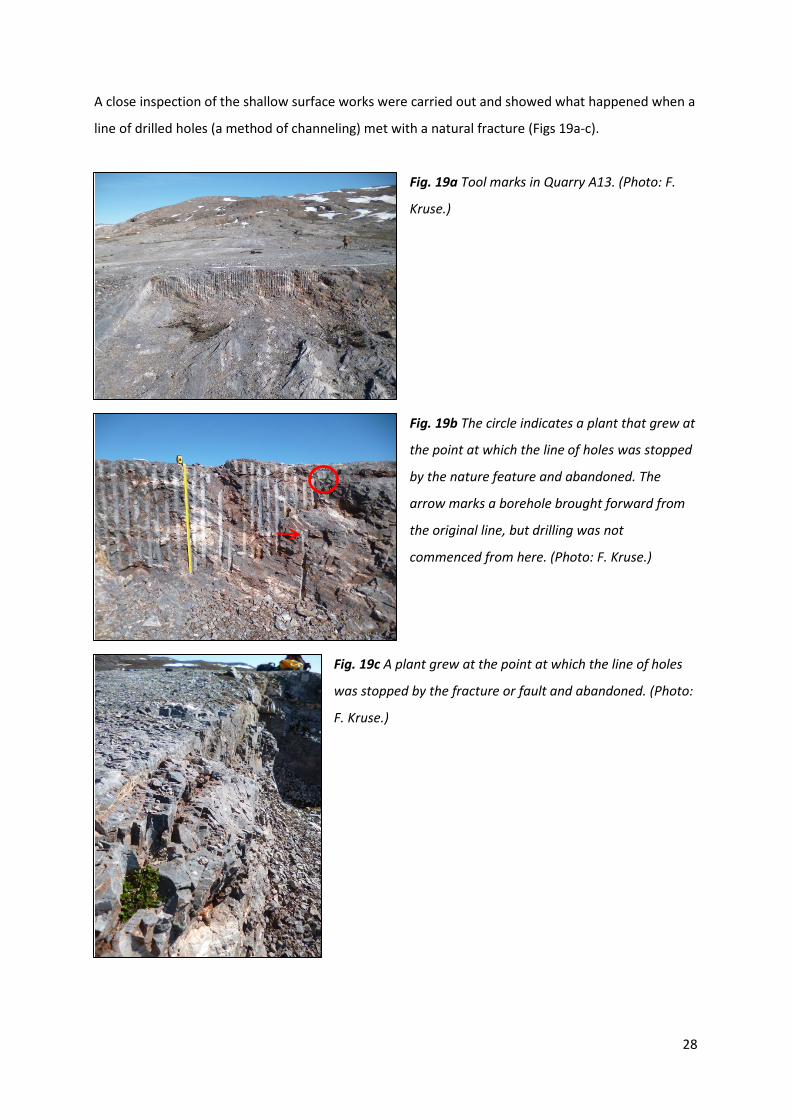
A close inspection of the shallow surface works were carried out and showed what happened when a
line of drilled holes (a method of channeling) met with a natural fracture (Figs 19a-c).
Fig. 19a Tool marks in Quarry A13. (Photo: F.
Kruse.)
Fig. 19b The circle indicates a plant that grew at
the point at which the line of holes was stopped
by the nature feature and abandoned. The
arrow marks a borehole brought forward from
the original line, but drilling was not
commenced from here. (Photo: F. Kruse.)
Fig. 19c A plant grew at the point at which the line of holes
was stopped by the fracture or fault and abandoned. (Photo:
F. Kruse.)
29
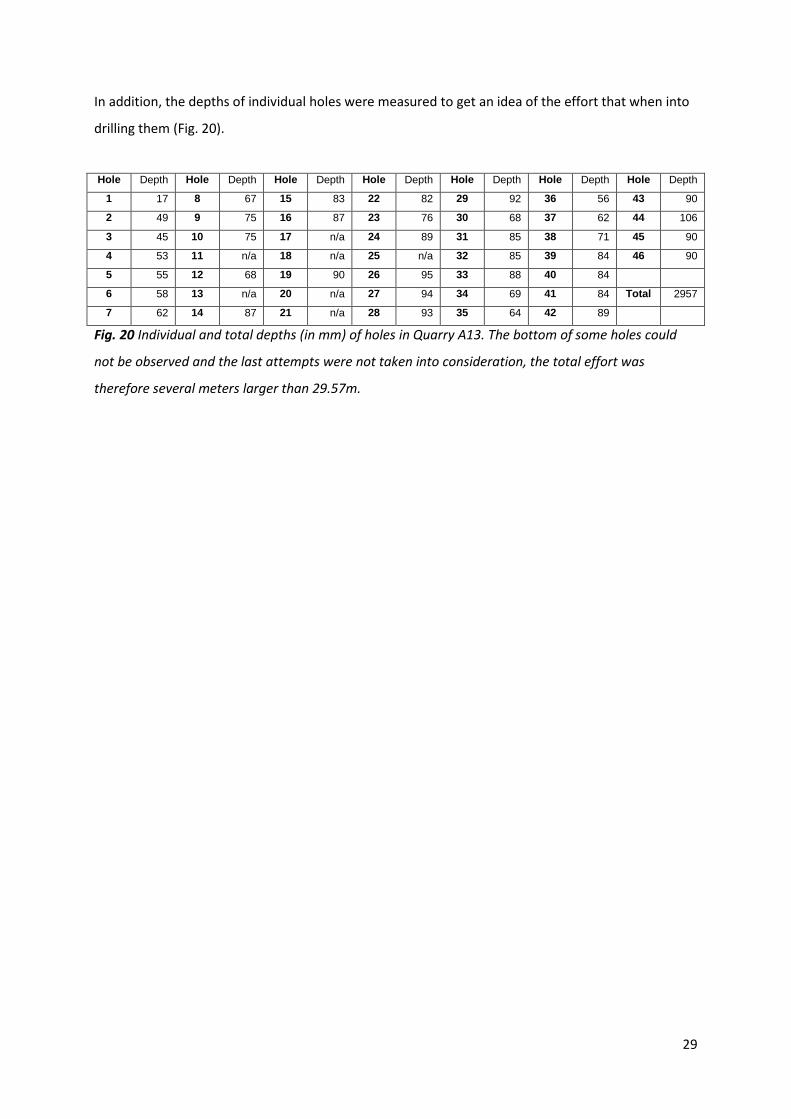
In addition, the depths of individual holes were measured to get an idea of the effort that when into
drilling them (Fig. 20).
Hole Depth Hole Depth Hole Depth Hole Depth Hole Depth Hole Depth Hole Depth
1 17 8 67 15 83 22 82 29 92 36 56 43 90
2 49 9 75 16 87 23 76 30 68 37 62 44 106
3 45 10 75 17 n/a 24 89 31 85 38 71 45 90
4 53 11 n/a 18 n/a 25 n/a 32 85 39 84 46 90
5 55 12 68 19 90 26 95 33 88 40 84
6 58 13 n/a 20 n/a 27 94 34 69 41 84 Total 2957
7 62 14 87 21 n/a 28 93 35 64 42 89
Fig. 20 Individual and total depths (in mm) of holes in Quarry A13. The bottom of some holes could
not be observed and the last attempts were not taken into consideration, the total effort was
therefore several meters larger than 29.57m.

30
Survey grid 7:
The area investigated in Grid 7 is located ~40m to the N of Grid 6 and Quarry A13. It comprises two
historical boreholes sunk in summer 1920 (Fig. 8; Appendix A1.4). Leech (1920) described one as a 3-
inch hole (7.6cm) and the other 4-inch (10.2cm) and that both had been drilled to 7 feet (2.13m),
where the marble crumbled due to a suspected subsurface fault. It was surprising, however, that the
holes were found to be separated by a few centimeters only (Fig. 21). The smaller one was found to
be 2m deep, the larger 1.9m, which is close enough to the depths stated. The level of liquid water
was recorded at 1.47m bgl.
Fig. 21 Leech (1920) described two
boreholes being drilled in summer
1920. These were found to be
separated by a few cm only.
(Photo: F. Kruse.)
A linear crack running SW-NE could be seen at the surface (Fig. 13E). GPR data reveals a strong
continuous reflector in both the perpendicular and the parallel profile. These reflectors are
accompanied by further hyperbolae (v = 0.09m/ns) that are chaotically distributed alongside the
continuous reflector. Pseudo-3D visualization of picked GPR data (Fig. 22) indicate a fold structure
with its fold axis near the surface (~ 0.2m depth below ground surface) and is most likely the reason
for the linear crack observed at the surface. It is obvious that the marble in this survey grid is
fractured due to the present fold structure with a surrounding fracture zone with a diameter of
~0.5m.

31
Fig. 22 Location and orientation of observed fold within the subsurface of survey grid 7 as well as
location of two boreholes (red rhomb): (A) Contour map of the observed fold with data points
(greenish points; constant point size in different depths) as well as location of boreholes (red rhombi)
within the survey grid; (B) Similar survey grid visualised in a pseudo-3D model: (top) 3D data points
(constant point size) and (bottom) 3D contour model. (Figure: B. Koster.)

32
Vegetation survey
At the time of writing, it is possible to include a map of the mining settlement indicating the locations
of newly appearing plant species (Fig. 23).
Fig. 23 The results of the visual vegetation survey in the former mining settlement show newly
appearing plants (dots, circles = individual plants, shading = high density of plants). (Data: M. Loonen.
Map: F. Kruse.)
It is clear from the map that newly appearing plants can mainly be found in the immediate vicinity of
former and current buildings, in particular around former and especially current doorways, as
opposed to more open areas or the vicinity to water. The assumption is that newly appearing species
found their way here as seeds on the shoes or in the clothing of visitors or in animal feed such as hay.
The highest densities occur around the upstanding buildings that used to be managerial
accommodation (A). These high densities are thought to be the compound result of historical
activities, cruise tourism, and overnight stays, which are still possible in the huts. Due to ongoing site
formation processes, these areas do not lend themselves to temporal analysis.
D
D
B
A
A
C

33
The question arises if anywhere on site lends itself to historically-relevant analysis, since visitors have
been and are free to go anywhere they please, and the potential of continued seed introduction
exists across the whole site if not island. However, some places are more attractive to visitors than
others and the simple wooden platforms are thought to rate extremely low in this list of attractive
places. Therefore, the pattern of newly appearing species around the doorways of the former
barracks is thought to be a historical pattern. The plants are likely to have been brought by the
builders and miners.
A conspicuous concentration and spread can be seen around the particular former barrack behind
which the historical photograph of the cows was taken (B). Again, there is no specific reason why
cruise tourists and overnight visitors should linger here. So the observations support the notion that
cows, other livestock, and hay were kept in this area. And that their manure may have enriched the
soil and enhanced production. That has yet to be confirmed.
The former storehouse in which the historical channelers and other machinery have now been
gathered (C) is, on the other hand, a very poignant location and immediately appeals to many
visitors. Being a hotspot of ongoing tourism, it is impossible to say much about the newly appearing
plants here.
Fig. 24 A stone-lined drain down to
the stream. (Photo: D. Avango.)
It is noticeable that former toilets
are not immediately obvious on
the site. From historical
photographs, the workers’
lavatories are known to have been
incorporated into the barrack
doorways, and a similar
construction probably existed in the managerial houses. Lavatories are again interesting from an
‘enriching the soil’ perspective. Even if they were indoor toilets, the buckets must have been emptied
somewhere, and it was thought that the features marked D could have been stone-lined drains for
this purpose. However, they were remarkably devoid of grasses or any other newly appearing plants.
To supplement the visual survey, the measurements of grass tillers in the vegetation exclosures and
in nearby unexclosed areas have been provided in Appendix A3.2. The analysis of the vegetation
survey had not yet been completed.

34
Reconnaissance dive
The team of divers discovered an overseeable number of metal objects at two of four dive locations
in Peirsonhamna. Below the crane, they found a small metal wheel (probably a machine part), a
length of rail, a metal rod to tie rails together, a tool (probably a crowbar), and two metal plates.
Below the Norwegian fishery station, they recorded a small hoist, a metal bracket to pin wooden
sleepers together, and a non-descript metal object. In the stream delta and in mid-harbour, they saw
nothing. Besides metal objects, there were no other forms of clearly visible impacts under water. A
full report is provided in Appendix 4.
Newly recorded archaeology
Any newly recorded archaeology has been included in Appendix 5. It comprises a map of features, a
list of observations and preliminary interpretations, and a photograph of the calendar from 1968.
The map below summaries the results of the walk over and around half of Blomstrand. All
archaeological features encountered were mapped (Fig. 25). Besides former industrial features
already mentioned in the text, these comprised exclusively fox traps.
Fig. 25 Map showing the walk over and around one half of Blomstrand, indicating all archaeological
remains not previously mentioned in the text. These were exclusively fox traps. (Map: B. Koster.)
The experimental metal detector survey was inconclusive. While the method lends itself to Arctic
conditions, permission must be sought to use it properly. The beach in Peirsonhamna could not be

35
surveyed completely in the time available. The next beach along was small and surveyed completely.
There were signs of the recent human presence in Svalbard in the form of washed-up broken plastic
as well as two pieces of orange peel and a whole apple. Metal was detected in the form of two nails
in a small piece of driftwood and a bullet cartridge. Significantly, they corresponded to the two main
activities expected from this: construction and hunting. There is hope for better results in other areas
in the future.
Archival research
New information discovered in the archives as well as on the internet has been included in Appendix
6. This includes repeat photography, the contents of archival sources and their preliminary
interpretation placed in a crude timeline, Home Office marble statistics between the years 1902 and
1912, summaries of two company files, and a summary of the environmental impact and diseases of
a wintering party in 1912/13.

36
Discussion, conclusion, and future work
The interdisciplinary archaeological fieldwork that was carried out at the former British mining
settlement and quarries on Blomstrand in Kongsfjorden, Spitsbergen, in July 2014 addressed two
main questions, which shall be dealt with in turn.
1) Why did past attempts to quarry marble on this Arctic island fail?
The assumption that permafrost had a negative effect on the marble is simply wrong. A focus on
purely geological factors is inexcusably short-sighted. In industrial archaeology and mining history,
one must make a habit of considering a combination of geological factors, managerial and/or
directorial flaws, and market forces at work. One or more of these may weigh more heavily than the
others.
Regarding potential geological factors, a GPR survey was carried out in order to assess the quality of
the marble that had been explored and worked historically. The survey established seven grids (125
profiles). Grids 1 and 2 substantiated the considerable fault zone clearly visible in the Winter Quarry
of 1919/20, which had for that obvious reason been abandoned in 1920 – the data showed that
further work in the immediate vicinity would have been uneconomical. Grid 3 was close to No. 2
Quarry opened in 1912 and incorporated a borehole sunk in 1912/13, from which only rubble was
then retrieved. The borehole lay on a visible crack. The crack was caused by an underlying fold, along
the limbs of which extensive fracturing had occurred – working would probably have been
uneconomical. Grids 4 and 5 lay on either side of No. 3 Quarry opened in 1912, about which the
marble manager continued to be enthusiastic in 1920. The smooth continuous reflector at a depth of
~2m, practically surface rock, might or might not have been disruptive during working – the results
remain inconclusive. Grid 6 to one side of Quarry A13 opened in 1920 displayed some surface cracks
that seemed to discontinue at depth – the marble was seemingly sound, but Grid 7 lay
uncomfortably close by. Grid 7 comprised two boreholes sunk in 1920, which were known to have hit
a fault that was, however, not thought to be worrying. In fact, the grid revealed a substantial fold
with a 50-cm fracture zone around the limbs – this may have been potentially workable if any
quarrying were orientated appropriately. To make the most of the GPR results, they will in the near
future be discussed with marble quarry specialists.
In light of the above, we can currently say that we were able to detect several cracks, faults,
fractured zones, and even (multiple) folds on the archaeological scale, as opposed to a geological
one, to a depth of up to ~4m below ground level using GPR with only the 400 MHz antenna instead
of a range of three antennae. The orientation of cracks, faults, and folds varies strongly within all
survey grids. Therefore, not all features may be related to major thrust faults and folding on

37
Blomstrand. However, the majority of cracks and faults in the marble were not recognisable from the
ground surface, which addresses one of the main issues at the heart of the GPR investigations.
Approximately a century ago, the different actors involved in the exploration and quarrying of the
marble, irrespective of the nature of their ‘loyalty’ to the Northern Exploration Co., were most likely
not able to detect the amount of “damage” within the marble by means of boreholes and shallow
surveys. Structural information (like fractured marble) might have been noted in historical borehole
logs but in a different way from modern technical capabilities and due to missing information about
detailed subsurface architecture.
Present geological or tectonic maps still do not show faults in the areas were the mining company
tried excavating the marble, which is possibly due to the large scale of geological mapping of
Blomstrand. A lot of faults are assumed to be related to isostatic uplift as we were able to observe
several fresh surface cracks in different orientations. Isostatic uplift has been active since the Late
Weichselian (e.g. Lehman & Forman 1992, Lauritzen 2006, Ingólfsson and Landvik 2013) in
Kongsfjorden. Detailed geological mapping, especially structural/tectonic information, in the vicinity
of former mining areas on Blomstrand could be an additional tool for a better understanding of the
subsurface conditions.
In general, the GPR technique seems to be capable of detecting faults and similar features of the
bedrock in an Arctic environment. Former studies have already illustrated GPR investigations on
marble quarries but under Mediterranean weather conditions (e.g. Grandjean and Gourry 1996,
Godio et al. 2003). However, subsurface investigations of the marble of Blomstrand is possible
providing excellent Arctic summer conditions (temperatures around 0°C, arid, no snow cover or
water detention on the bedrock, no permafrost soil coverage) as well as using the appropriate GPR
setup and an investigation-matching antenna frequency (in this study 400 MHz). A lower frequency
antenna (e.g. 270 MHz or 200 MHz) could possibly detect cracks and faults even in lower depths, but
resolution would be worse (e.g. Neal 2004) and, therefore, smaller cracks and faults might not be
visible in the GPR data.
Besides the quality of the marble, managerial incompetence on site may have been another factor.
Archaeologically, this may out itself in overspending on superficial structures prior to World War I. As
Kruse (2013) has already pointed out, the mining settlement seemed rather impressive in relation to
the limited quarrying done, but this may have been part of an advertising strategy to present far-
away investors with exciting Arctic photographs and entice them into investing further into this
grand scheme. No buildings were erected after the war and little remains of the large radio antenna
that was put up, so it may not be immediately obvious whether overspending continued. Away from
Blomstrand, however, elsewhere on Spitsbergen, the NEC definitely spent more money that it made

38
in return. Overspending was a serious flaw, but if the company had actually delivered raw materials
in large, profitable amounts, it could yet have been worth it. So overspending was a relative.
More importantly, the archival sources point to several crucial things. Firstly, there appears to have
been a growing demand for marble prior to the First World War. This would have been a sensible
time to invest in the resource. Secondly, however, the diamond coring in 1912/13 had not been
successful (sabotage was mentioned, but Booth’s own technical abilities were not questioned), yet
beautiful solid cores mysteriously appeared in the London office. It is also suspicious that the crucial
report by the American marble specialist Minard, who worked on site in summer 1913, can no longer
be found. Was it willfully destroyed? This hints at fraud, but it cannot be proven who was
responsible. Was it Mansfield? Was it Salisbury-Jones? It certainly appears to have been someone in
the field as it seems that the directors truly believed in the soundness and value of their marble. Even
when the market crashed after the war and when the Danish Commissioner raised a fee for every
acre claimed, the company hung on to Blomstrand. It remained in the possession of the company,
until it sold all its assets to the Norwegian Government.
All things considered, crash in the marble market was the main reason for all work being suspended
in 1920 – at a point when it had not been proven beyond all doubt whether the marble was or was
not workable, let alone profitable. Trying to prove this beyond the GPR survey carried out during the
project ‘Marble at Fault’ is not necessary: since the historical actors had no knowledge of the
resource beyond that which is included in these pages; new geological knowledge beyond the reach
of the historical works is probably very interesting but loses its historical relevance. However,
Minard’s report of 1913 or the borehole logs of 1968 could fill the current knowledge gap.
2) What was the lasting impact of this industry on the local environment?
The construction, exploring, and quarrying activities on Blomstrand between 1911 and 1920 created
the cultural heritage that is protected by law toady. This in itself is an obvious long-lasting
environmental impact. Although some people find polar industrial heritage unsightly, it is a reminder
of past human endeavour in this location. If a dGPS had been available, Kruse and Koster would have
attempted to quantify the volume of earth and rock that had been moved around on site. This would
have been the direct impact of construction and quarrying.
The metal detector survey which Kruse tried was meant to delineate subtle zones of metal-related
activities, but this failed due to an unexpected overload of signals, i.e. a large number of metal
objects in the ground. The question remains how much scrap metal the site actually comprises. It is
bound to be a lot. So what is its environmental impact?

39
In the framework of “Consequences of exploitation”, the vegetation in the mining settlement was
investigated by means of a walkover survey and in the form of production on grass tillers. The
resultant map clearly indicates the distribution of newly appearing species, mainly grasses, which can
be shown to have historical relevance. This pilot study can and should be built on: a comprehensive
systematic study should be undertaken across the settlement as well as the industrial areas to map,
identify, and qualify all newly appearing species. This has to a certain extent been done in places like
Longyearbyen and Ny Ålesund. Unlike these places, Marble Island had a limited ‘life span’ that
practically ended not necessarily in 1920 but at the time when the barracks were removed to Ny
Ålesund. Having a definite beginning and fairly definite end makes a historical site a better case study
for lasting environmental impact of certain activities than an open-ended place, where changes are
ongoing. An analysis of the production on grass tillers has yet to show if livestock has caused an
enrich of the soil in certain location on Blomstrand.
Besides some large metal objects being found under water, the quarrying does not seem to have had
any lasting effects on the coastal ecosystem. It was hoped that rubbish heaps could perhaps be
located at the bottom of the cliffs, but this was not so.
The Day Book written by the mechanic David Booth in winter 1912/13 and a mention by Herbert
Leech in 1920 that 11 men wintered that time offered an unusual glimpse into the environmental
impact of such a group on the marine and terrestrial ecosystems. In itself, the removal of 100+ birds
and a handful of seals may not seem significant, but if more historical accounts of this type were
known and analysed, a comprehensive picture of the impact of the human presence could over time
emerge. It would take a lot of work, but it would be invaluable. It is interesting that Booth does not
make a mention of reindeer and polar bears. They had probably been hunted to the extent of being
absent from the Kongsfjorden area.
Booth does, however, mention the presence of trappers in the camp. The nature of hunting on the
island was briefly addressed by Kruse and Koster during the walk over and around the island. Even
the simple plotting of fox traps encountered gives form to an emerging archaeological landscape of
hunting and trapping. This should also be pursued further and in better resolution.
While Kruse and Koster were on site, they were regularly visited by a handful of reindeer, three long-
tailed skuas, and an Arctic fox. They also observed several common eider ducks with chicks and two
barnacle geese on the beach in Peirsonhamna. They discovered a single old eider duck nest. Animals
further away than could be identified without binoculars have been disregarded in this tally.
This account of the site’s lasting environmental impact is piecemeal, but it reflects the nature of the
sources very well and indicates what kind of questions can and need to be asked of this form of
qualitative data. It takes much effort to transform archaeological and anecdotal evidence into an
ecologically meaningful account.

40
Outreach
Good science does good outreach
Svalbardposten
“Marble at Fault” benefitted from the early attention of Svalbardposten, probably based on the
simple curiosity that the author shared her first name with Frigg Jørgensen of AECO, who had also
been granted financial support of the Svalbard Environmental Protection Fund in the 2013. Following
a telephone interview with Christian Nicolai Bjørke, the article ‘Frigga får oppfly marmordrømmen’
introduced the project to readers in issue number 47 of November 29, 2013. (Appendix A7.1)
Svalbardposten was also instrumental in advertising the workshop in Longyearbyen in January 2014
(see below). A copy of the advertisement, which additionally functioned as a poster to be displayed
in strategic locations and online, can be found in the Appendix A7.2.
Upon arrival in Longyearbyen in July 2014, Kruse and Koster again made contact with Svalbard-
posten. Both before and after their fieldwork, they were interviewed by Christopher Engås, resulting
in the article ‘Marmoren kan ha skylden’ in Nr. 31 of August 8, 2014 (Appendix A7.3).
The author hopes to uphold the invaluable connection with Svalbardposten in order to inform the
citizens of and visitors to the archipelago of the important and interesting interdisciplinary
archaeological research that is going on in their backyard.
Workshop at the Svalbard Museum
“Marble at Fault” was a multi-phased project. The first phase was a workshop, which took place at
the Svalbard Museum in Longyearbyen on Saturday, January 25, 2014. Kruse presented the results of
her thesis with a particular focus on Marble Island to interested parties and potential interdiscipli-
nary partners with the goal to raise public awareness of the issues at stake and enthusiasm for the
project.
SEPF reporting requirements
“Marble at Fault” being primarily funded by the Svalbard Environmental Protection Fund, the project
was subject to some additional reporting requirements. Further to this final fieldwork report, an
audience-friendly report (Appendix 7.4) was written, the figures of which were also made into a short
PowerPoint presentation (Appendix A7.5). That that project found repeated mention in Svalbard-
posten has been related above.

41
Archive location
All data relating to the research projects “Marble at Fault” and “Consequences of exploitation” are
currently being held by Dr Frigga Kruse at the Arctic Centre of the University of Groningen. As far as
possible, she will make use of the Research in Svalbard (RiS) database to share the data and
disseminate the results of both projects. It is currently unknown if Askeladden, Norway’s database
for cultural heritage, will be able to facilitate further archiving.

42
References and bibliography
Aalders, Y., Avango, D., Gustafsson, U., De Haas, H., Hacquebord, L., Hartnell, C., Kruse, F. (2009)
LASHIPA 5. Archaeological expedition on Spitsbergen 27 July – 17 August 2008, Groningen:
Arctic Centre.
Buggisch, W., Piepjohn, K., Thiedig, F., Gosen, W. von, 1992. A MiddIe Carboniferous Conodont Fauna
from Blomstrandhalvoya (NW-Spitsbergen): Implications on the Age of Post-Devonian
Karstification and the Svalbardian Deformation. Polarforschung 62 (2/3), 83–90.
Dallmann, W.K., 2007. Geology of Svalbard. In: Sigmond, E.M.O., Roberts, D. (Eds.), Geology of the
Land and Sea areas of Northern Europe 10. Norges geologiske undersøkelse, Trondheim, pp.
87–89.
Elvevold, S., Blomeier, D., Dallmann, W., 2007. Geology of Svalbard. Norsk Polarinstitutt, Tromso,
35 pp.
Godio, A., Sambuelli, L., Ferrero, A.M., 2003. Geophysical investigation to optimize excavation of an
underground marble quarry in Stazzema, Italy. The Leading Edge 22 (6), 574–578.
Grandjean, G., Gourry, J., 1996. GPR data processing for 3D fracture mapping in a marble quarry
(Thassos, Greece). Journal of Applied Geophysics 36 (1), 19–30.
Hermansen, P. (2007) Svalbard Spistbergen guide, Oslo: Gaidaros.
Ingólfsson, Ó., Landvik, J.Y., 2013. The Svalbard–Barents Sea ice-sheet – Historical, current and future
perspectives. Quaternary Science Reviews 64, 33–60.
Johansen, B. F. (ed. (2011) Cruise handbook for Svalbard, Tromsø: Norwegian Polar Institute.
Johnsen, S., Mørk, A., Dypvik, H., Nagy, J., 2001. Outline of the geology of Svalbard - Short geological
review and guidebook. 7th ESF IMPACT Workshop, 11 pp.
Kruse, F. (2013) Frozen assets. British mining, exploration, and geopolitics on Spitsbergen, 1904-53,
Eelde: Barkhuis.
Lauritzen, S.-E., 2006. Caves and speleogenesis at Blomstrandsøya, Kongsfjord, W. Spitsbergen.
International Journal of Speleology 35 (1), 37–58.
Lehman, S.J., Forman, S.L., 1992. Late Weichselian glacier retreat in Kongsfjorden, west Spitsbergen,
Svalbard. Quaternary Research 37 (2), 139–154.
Neal, A., Roberts, C.L., 2000. Applications of ground-penetrating radar (GPR) to sedimentological,
geomorphological and geoarchaeological studies in coastal environments. In: Pye, K., Allen,
J.R.L. (Eds.), Coastal and Estuarine Environments. Sedimentology, Geomorphology and
Geoarchaeology, vol. 175. Geological Society special publication 175. Geological Society,
London, pp. 139–171.
Neal, A., 2004. Ground-penetrating radar and its use in sedimentology: principles, problems and
progress. Earth-Science Reviews 66 (3-4), 261–330.
43
Pirli, M., Schweitzer, J., Paulsen, B., 2013. The Storfjorden, Svalbard, 2008–2012 aftershock
sequence: Seismotectonics in a polar environment. Tectonophysics 601, 192–205.
Renwick, W. G., 1909. Marble and marble working. London: Crosby Lockwood and Son.
Sambuelli, L., Calzoni, C., 2010. Estimation of thin fracture aperture in a marble block by GPR
sounding. Bollettino di Geofisica Teorica ed Applicata 51 (2-3), 239–252.
Siggerud, T. (1960) ‘The iron occurrence at Farmhamna, Vestspitsbergen’, Årbok 1960.
Stange, R. (2012) Spitsbergen Svalbard. A complete guide around the arctic archipelago, Huckstorf:
Stange.
Thiedig, F., Manby, G.M., 1992. Origins and deformation of post-Caledonian sediments on
Blomstrandhalvøya and Lovenøyane, northwest Spitsbergen. Norsk Geologisk Tidsskrift 72,
27–33.
Umbreit, A. (2009) Spitsbergen, Chalfont St Peter: Bradt.

44
On behalf of the interdisciplinary research team on Blomstrand,
Dr. Frigga Kruse
Polar historical archaeologist
Arctic Centre, University of Groningen
March 16, 2015


