60
FROM AGRICULTURE TO SOFTWARE IN THREE DECADES: Ireland’s catch-up within the European Union
| Date post: | 31-Dec-2015 |
| Category: |
Documents |
| Upload: | elvin-short |
| View: | 213 times |
| Download: | 0 times |

FROM AGRICULTURE TO SOFTWARE IN THREE DECADES:
Ireland’s catch-up within the European Union

Figure : GDP and GNP per head,PPS, EU 15 = 100
55
60
65
70
75
80
85
90
95
100
105
110
115
120
125
1960 1970 1980 1985 1986 1987 1988 1989 1990 1991 1992 1993 1994 1995 1996 1997 1998 1999 2000 2001 2002
GDP GNP

Major themes• [1] The early years of independence• [2] Ireland opens to the world: post 1960• [3] The long hard march! 1960-1989• [4] Rescued by Structural Funds? 1989-2004• [5] The Celtic Tiger roars! 1994-2002• [6] The foreign high-technology sector• [7] Implications of EU enlargement

[1]
The early years:
1922-1960

Free at last! 1922
• Major industrial base on the island was in Northern Ireland, which remained in the UK
• The new Irish state had almost no manufacturing base
• An agricultural economy, supplying the British market at depressed prices
• High birth rate, high emigration, declining population

The first Irish economic strategy:import substitution
• Imposition of high tariff protection in 1930s • Attempt to build a locally owned
manufacturing sector behind tariff barriers• Strict controls on foreign ownership of firms• Tariffs remained in force until early 1960s
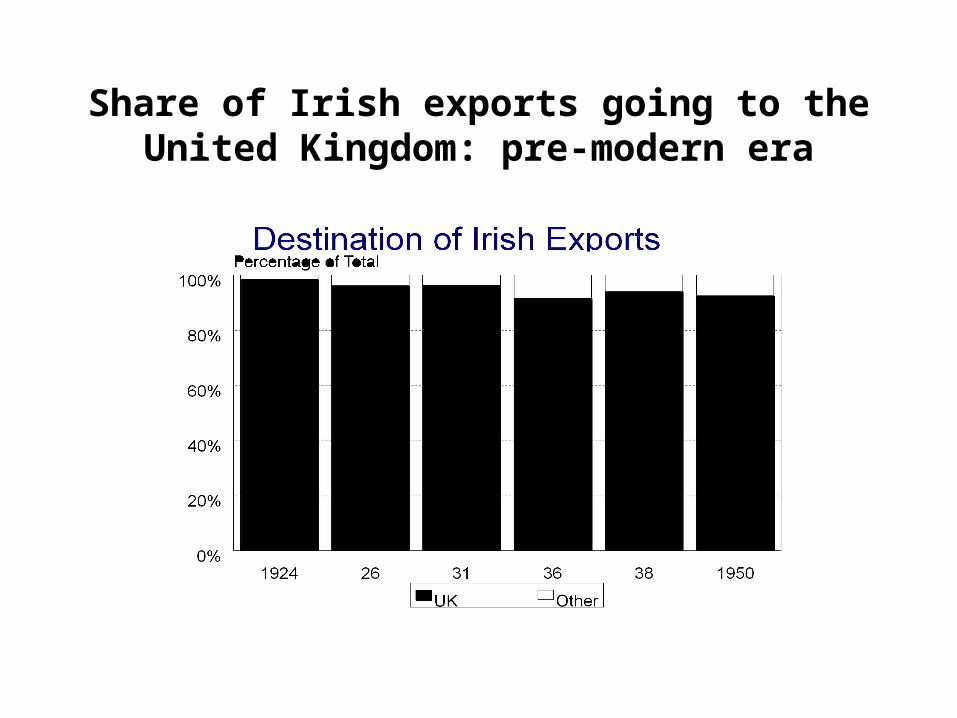
Share of Irish exports going to the United Kingdom: pre-modern era

GDP per head, PPP: EU-15=100
Country 1960Belgium 97.4
Denmark 126.0
Ireland 63.2
Greece 43.7
Portugal 40.6
Spain 59.4
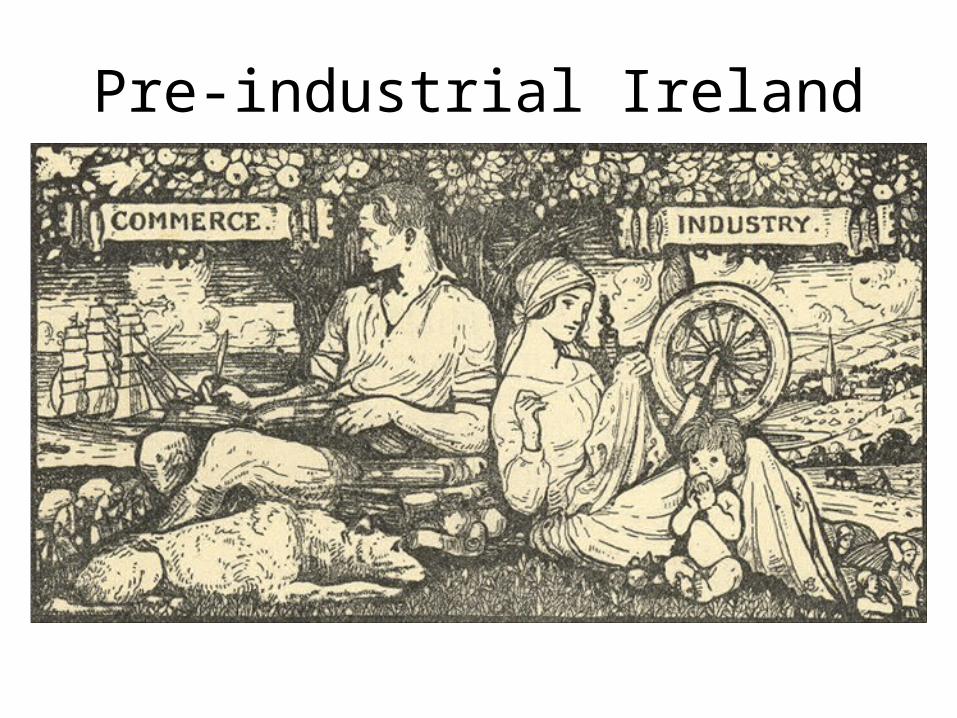
Pre-industrial Ireland


[2]
Ireland opens to the world:
post 1960

Initial policy changes: 1960
• Quick removal of tariff barriers
• Zero rate of corporation tax (on exports)
• An attractive range of investment incentives
• Training grants for firms
• Basic reforms in the second level education system

A new economic strategy:
Export-led growth

The crucial role for Industrial Strategy
• The “Nordic” model: Focused on indigenous industry
• The “Irish” model: Focused on foreign direct investment

The “Nordic” model (Denmark, Finland)
• Selected segments of indigenous industry, to increase efficiency and export market share
• The serious entry barriers: need for new product development, efficient marketing/distribution
• Domestic skill and cost base crucial

The small country “squeeze”

The “Irish” model
• Policy aimed at attracting export-oriented foreign direct investment
• Attractiveness of business and productive environment to capture greater share of mobile investment
• Being inside EU helps!!!• “Jobless” growth for a while, as old
industries fail

Industrial strategy
Picking winners? No!
Picking winning environments!
“Winning environments” are public goods

[3]
The long hard march! 1960-1989

Ireland’s changing policy environment
• 1922-1960: A dependent small underdeveloped state on the periphery of the United Kingdom
• 1960 onwards: A small regional modernising economy progressively integrating into an encompassing European economy


Globalisation and small states
“The real economic challenge ... [of a country or region] ... is to increase the potential value of what its citizens can add to the global economy, by enhancing their skills and capacities and by improving their means of linking those skills and capacities to the world market."
Robert Reich

GDP per head, PPP: EU-15=100
Country 1960 1973 1986Belgium 97.4 102.8 104.3
Denmark 126.0 120.9 117.8
Ireland 63.2 62.3 65.9
Greece 43.7 71.0 62.8
Portugal 40.6 57.5 54.5
Spain 59.4 77.2 71.8

[4]
Structural Funds: 1989-2006
A boost to Irish convergence:the rise of EU regional aid policy
in the late 1980s

Why Structural Funds?
• EU Enlargement after 1973: The “poorer” countries join (Ireland, Greece, Portugal, Spain)
• The need to prepare for market integration (the Single European Market and Monetary Union)
• EU Budgetary reform and an increase in regional aid allocations after 1989

The goal of EU regional investment aid policy
“To design and implement policies with the explicit aim of transforming the underlying structure of the (poorer) beneficiary economies in order to prepare them for exposure to the competitive forces unleashed by the Single European Market and Monetary Union”

How does EU regional investment aid work?
• EU financial aid with domestic co-financing• Monitored “national development planning”• Improvement of physical infrastructure (roads,
rail, ports, telecommunications)• Improvements in human resources (training,
education)• Direct investment aid to productive sectors
(marketing, design skills, R&D)

[5]
The Celtic Tiger roars! 1994-2002

Figure : GDP and GNP per head,PPS, EU 15 = 100
55
60
65
70
75
80
85
90
95
100
105
110
115
120
125
1960 1970 1980 1985 1986 1987 1988 1989 1990 1991 1992 1993 1994 1995 1996 1997 1998 1999 2000 2001 2002
GDP GNP

Irish GDP growth, before and after Structural Funds
(Including forecasts)
0
1
2
3
4
5
6
7
8
9
10
1970-75 1975-80 1980-85 1985-90 1990-95 1995-00 2000-05 2005-10 2010-15 2015-20

Government Expenditure, % of GDP
25
30
35
40
45
50
55
60

National Debt,% of GDP
25
50
75
100
125

Current Account Balance, % of GDP
-15
-10
-5
0
5

GDP per head, PPP: EU-15=100
Country 1960 1973 1986 2002Belgium 97.4 102.8 104.3 105.7
Denmark 126.0 120.9 117.8 120.8
Ireland 63.2 62.3 65.9 122.0
Greece 43.7 71.0 62.8 69.9
Portugal 40.6 57.5 54.5 73.7
Spain 59.4 77.2 71.8 83.9


[6]
The role of the foreign high-technology sector

The Irish “virtuous circle” of economic development
• Initial clustering in niche high technology areas (mainly foreign)
• Generates local demand for skilled workers: human capital
• Further spillovers to local firms: infrastructure
• A stable monetary/fiscal environment and social partnership
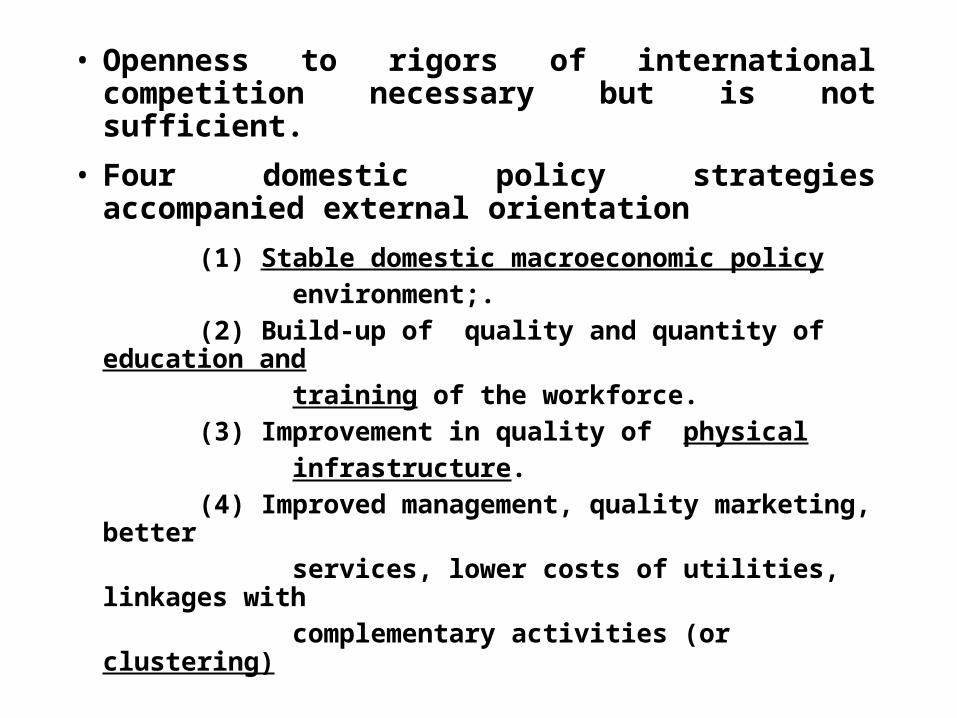
• Openness to rigors of international competition necessary but is not sufficient.
• Four domestic policy strategies accompanied external orientation
(1) Stable domestic macroeconomic policy
environment;.
(2) Build-up of quality and quantity of education and
training of the workforce.
(3) Improvement in quality of physical
infrastructure.
(4) Improved management, quality marketing, better
services, lower costs of utilities, linkages with
complementary activities (or clustering)

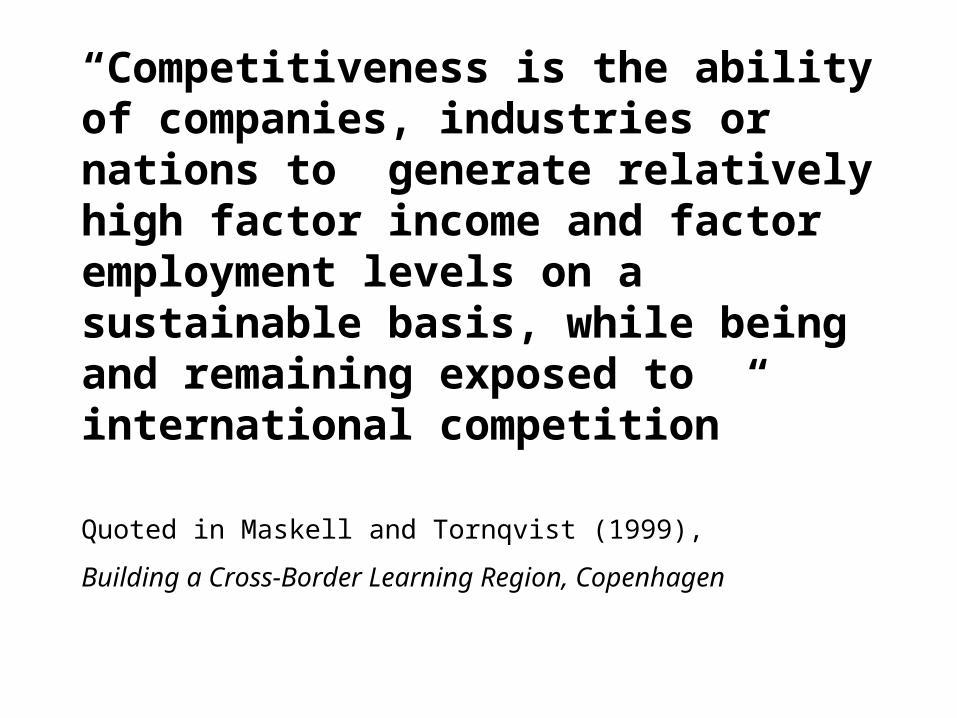
“Competitiveness is the ability of companies, industries or nations to generate relatively high factor income and factor employment levels on a sustainable basis, while being and remaining exposed to international competition”
Quoted in Maskell and Tornqvist (1999),
Building a Cross-Border Learning Region, Copenhagen


[7]
The new enlarged European Union:
implications for the future


Context is important!
• Economic development from a low base within a given political/economic regime (Ireland, Portugal, Greece)
• Reversing decline after a political/economic regime switch (Eastern Europe)

Estonia recovers: 1991-2002
55
65
75
85
95
105
115
1990 1992 1994 1996 1998 2000 2002
GDP GDP per capita

The two phases of transition
• Phase 1: Initial institution building, sectoral re-organisation and re-allocation
-> Early CEE entrants to EU: 1989-1995
-> Late entrants to EU: ?????
• Phase 2: Growth and convergence processes operate in a context of fairly stable but evolving institutional framework

Stages of transition and convergence in Eastern Europe
• Progressive trade integration with EU• Foreign direct investment inflows• Technology transfer
• EU-aided investment programmes, mainly for the support of infrastructural and human-capital development.

Copy Ireland?Risks with the Irish strategy
• Too heavy a dependence on foreign direct investment?
• Foreign direct investment (FDI) is concentrated into a narrow range of technologies that can quickly move through maturity and into decline
• Loss of “first mover” status and greater competition for FDI


Some lessons from Ireland for transition economies
• Adaptation to external market forces, but consistent with social objectives
• Detailed comprehensive sectoral “planning” inapplicable because of openness
• Strategy must be flexible, reactive and incremental

The key lesson from Ireland
• The intelligent combination of economic policy and business strategy generated huge synergies in terms of national growth and convergence

Characteristics of “good” governance
• Assessing strengths and weaknesses• Recognising trade-offs between policy
options, and building coalitions for action• Building a healthy business-government
relationship• Enhancing government-government co-
operation

Challenges for less developed economies of Eastern Europe
a) Development and renewal strategies must be at the centre of government activity
b) Optimising the “software” of human capital is the single most important act of government
c) Researchers and policy-makers in Eastern Europe need to engage increasingly in the emerging EU regional debate


