From Caesar to Twitter Structural Properties of Elites and Rich-Clubs Chen Avin 1 , Zvi Lotker 1 , Yvonne-Anne Pignolet 2 , Itzik Turkel 1 1 Ben Gurion University of the Negev, Be’er-Sheva, Israel 2 ABB Corporate Research, Baden, Switzerland {avin, zvilo, turkel}@cse.bgu.ac.il, [email protected]Abstract—In many societies there is an elite, a relatively small group of powerful individuals that is well connected and highly influential. Since the ancient days of Julius Caesar’s senate to the recent days of celebrities on Twitter, the size of the elite is a result of conflicting social forces competing to increase or decrease it. In this paper we formulate these forces as axioms and study their equilibrium and other properties of elites in social networks and complex systems. Our findings indicate that elite properties such as a size of Θ( √ m) (where m is the number of edges in the network), disproportionate influence, stability and density are universal and should join an increasing list of common phenomenon that complex systems share such: “small world”, power law degree distributions, high clustering, etc. As an approximation for the elite we study the subgraph formed by the highest degree nodes, also known as the rich-club. We analyze the structural properties of the k-rich-club of nine existing complex networks and three theoretical models systematically, where the k-rich- club is the subgraph induced by the k nodes with the highest degree in the network. In all real-life networks we observe similar elite properties for rich-clubs consisting of around √ m nodes, however, none of the theoretical models we analyzed captures all the elite properties, and thus they should be either adjusted or extended to address these findings. I. I NTRODUCTION In the past few decades, the study of the structure of complex systems and social networks revealed some of the universal properties they share. Some of the basic properties that these networks exhibit are: short average length (i.e., ”six degrees of separation”), a high clustering coefficient, a heavy- tailed degree distribution (e.g., scale-freeness), navigability and more recently densification and a shrinking diameter [34], [1], [21], [27]. These empirical findings led to a variety of random graph models that are trying to capture properties and the evolution of social networks. In turn, the models are used to predict and better understand the basic mechanisms that govern these networks. Some of the most popular models are the Preferential Attachment model (BA) [1], Kleinberg’s small-world model [12] the Copy model [16], the Forest Fire model [21] and more recently the Affiliation Networks model [18]. When “new” universal properties are found by empirical measurements, the existing models need to be rechecked with regard to them, and if necessary to be improved or replaced by new ones. In the current work, we draw attention to another basic and important phenomenon of (social) networks struc- ture: the existence of an elite. In the Cambridge Dictionary the elite is defined as: “The richest, most powerful, best educated or best trained group in a society.” Other definitions (e.g., Wikipedia) emphasize in addition that the elite group is “small” and “well-connected”. Intuitively, the best candidates for the elite group are nodes with the highest degree in the network, also called the rich- club [37]. These nodes are well-known to exist following the scale-free nature of complex systems and the power-law degree distribution that enforce such “superstars”; nodes with degree well above the average degree (aka “hubs” and “connectors”) [6]. Previous research on the rich-club phenomenon already demonstrated the existence of some interesting properties like the tendency of high degree nodes to be well connected among each other [4], [24], [37]. The importance of the rich-club with respect to the whole network was considered in [36] which shows that the rich-club connectivity has a strong influence of the assortativity and transitivity of a network (i.e., whether connections between nodes of similar degree are more likely and how many triangles occur). Based on these findings, the rich-club can be seen as the elite of a complex network due its influence on the rest of the network. We refer to Section V for a discussion of related notions. In this paper we perform a more systematic study on the structural properties of the rich-club subgraph; the graph that is induced by the highest degree nodes. This is motivated by several reasons. First of all, structural properties of the rich- club in a network may help understand the mechanisms and behavior of the whole network. Second, knowledge on these properties might facilitate the construction of new algorithms and heuristics to solve important problems, that are hard to solve on general graphs. And finally, another advantage of studying the rich club is its small size compared to the size of the complete network. Social networks can comprise billions of users and even more edges which makes an analysis more difficult. A smaller, yet important set of nodes can be analyzed with more sophisticated tools such as eigenvalue decompositions and flow computations, which might not be feasible for the whole network. The novel question we ask about the rich-club (and more generally the elite), is maybe the most basic one: “What is the size of the elite in complex networks?” Moreover, is the elite size a universal property of complex networks, similar to other universal properties we mentioned earlier? Our results indicate that this is the case, and the elite size, as well as others of its structural properties, are universal.
Transcript
From Caesar to TwitterStructural Properties of Elites and Rich-Clubs
Chen Avin1, Zvi Lotker1, Yvonne-Anne Pignolet2, Itzik Turkel11 Ben Gurion University of the Negev, Be’er-Sheva, Israel
Abstract—In many societies there is an elite, a relatively smallgroup of powerful individuals that is well connected and highlyinfluential. Since the ancient days of Julius Caesar’s senate to therecent days of celebrities on Twitter, the size of the elite is a resultof conflicting social forces competing to increase or decrease it.In this paper we formulate these forces as axioms and study theirequilibrium and other properties of elites in social networks andcomplex systems.
Our findings indicate that elite properties such as a size ofΘ(
√m) (where m is the number of edges in the network),
disproportionate influence, stability and density are universaland should join an increasing list of common phenomenonthat complex systems share such: “small world”, power lawdegree distributions, high clustering, etc. As an approximationfor the elite we study the subgraph formed by the highest degreenodes, also known as the rich-club. We analyze the structuralproperties of the k-rich-club of nine existing complex networksand three theoretical models systematically, where the k-rich-club is the subgraph induced by the k nodes with the highestdegree in the network. In all real-life networks we observe similarelite properties for rich-clubs consisting of around
√m nodes,
however, none of the theoretical models we analyzed captures allthe elite properties, and thus they should be either adjusted orextended to address these findings.
I. INTRODUCTION
In the past few decades, the study of the structure ofcomplex systems and social networks revealed some of theuniversal properties they share. Some of the basic propertiesthat these networks exhibit are: short average length (i.e., ”sixdegrees of separation”), a high clustering coefficient, a heavy-tailed degree distribution (e.g., scale-freeness), navigabilityand more recently densification and a shrinking diameter [34],[1], [21], [27]. These empirical findings led to a variety ofrandom graph models that are trying to capture propertiesand the evolution of social networks. In turn, the models areused to predict and better understand the basic mechanismsthat govern these networks. Some of the most popular modelsare the Preferential Attachment model (BA) [1], Kleinberg’ssmall-world model [12] the Copy model [16], the ForestFire model [21] and more recently the Affiliation Networksmodel [18].
When “new” universal properties are found by empiricalmeasurements, the existing models need to be rechecked withregard to them, and if necessary to be improved or replaced bynew ones. In the current work, we draw attention to anotherbasic and important phenomenon of (social) networks struc-ture: the existence of an elite. In the Cambridge Dictionarythe elite is defined as:
“The richest, most powerful, best educated or besttrained group in a society.”
Other definitions (e.g., Wikipedia) emphasize in addition thatthe elite group is “small” and “well-connected”.
Intuitively, the best candidates for the elite group are nodeswith the highest degree in the network, also called the rich-club [37]. These nodes are well-known to exist following thescale-free nature of complex systems and the power-law degreedistribution that enforce such “superstars”; nodes with degreewell above the average degree (aka “hubs” and “connectors”)[6]. Previous research on the rich-club phenomenon alreadydemonstrated the existence of some interesting properties likethe tendency of high degree nodes to be well connected amongeach other [4], [24], [37]. The importance of the rich-club withrespect to the whole network was considered in [36] whichshows that the rich-club connectivity has a strong influenceof the assortativity and transitivity of a network (i.e., whetherconnections between nodes of similar degree are more likelyand how many triangles occur). Based on these findings, therich-club can be seen as the elite of a complex network dueits influence on the rest of the network. We refer to Section Vfor a discussion of related notions.
In this paper we perform a more systematic study on thestructural properties of the rich-club subgraph; the graph thatis induced by the highest degree nodes. This is motivated byseveral reasons. First of all, structural properties of the rich-club in a network may help understand the mechanisms andbehavior of the whole network. Second, knowledge on theseproperties might facilitate the construction of new algorithmsand heuristics to solve important problems, that are hardto solve on general graphs. And finally, another advantageof studying the rich club is its small size compared to thesize of the complete network. Social networks can comprisebillions of users and even more edges which makes an analysismore difficult. A smaller, yet important set of nodes can beanalyzed with more sophisticated tools such as eigenvaluedecompositions and flow computations, which might not befeasible for the whole network.
The novel question we ask about the rich-club (and moregenerally the elite), is maybe the most basic one: “What is thesize of the elite in complex networks?” Moreover, is the elitesize a universal property of complex networks, similar to otheruniversal properties we mentioned earlier? Our results indicatethat this is the case, and the elite size, as well as others of itsstructural properties, are universal.
2
We observe that the size of the elite is determined byconflicting forces. Forces that try to increase the elite sizeversus forces that try to reduce its size. As a motivation for thistension and process we were inspired by some known anec-dotes from human history. Ancient Roman history provides anexample for forces that aspire to increase the size of the Romanelite, namely, the senate [10], [15]. When established around750 BC, the senate included representatives of the first 100families. When the population grew, it was extended, reaching300 members in 509 BC, and then 600 senators in 80 BC. Itwas Julius Caesar who finally increased the senate to arounda thousand senators. Interestingly, this number is about thesquare-root of the Rome population at the time, one million.On the other hand, the French Revolution 1789–1799, providesan example for a society that reduced its elite size. During theReign of Terror from 1793 to 1794 thousands of French elitemembers, the nobility, were executed by the guillotine [8].
Going back to our days, we make an effort to formalizesome of these social forces in terms of graphs and networksand to derive the elite size at equilibrium. A complex net-work is modeled as a graph G = (V,E) with n = |V |nodes connected by a set of (directed) edges E, m = |E|.These edges represent a relation between two nodes, such asfriendship, citations, following on Twitter, etc. We define thek-rich-club of a network to be the subgraph induced by thek highest-degree nodes. As it turns out, this simple definitionleads to some interesting observations when investigating thestructure of the inter-connectivity among the highest degreenodes and their interactions with the rest of the network for agrowing number of elite members, i.e., for k starting at 1 tothe total number of nodes. Our results show that the k-rich-club has different structural properties than the whole networkit belongs to and suggest a set of measurements to quantify the“power” of the k-rich-club. To the best of our knowledge, theset of properties we study (see next) have not been analyzed forgrowing rich-clubs before and we believe that future modelsfor social networks should capture the universal properties ofthe rich-club because of its role and significance.
Summary of our Results
Elite size: We take an axiomatic approach to concludethat the size of the elite is in the order of
√m, where m
is the number of edges in the network. This result followsfrom assuming that the elite is influential, stable and either ofminimum-size or dense (see Section III).
We then measured a variety of parameters for rich-clubsof growing size, providing empirical evidence that for a
√m-
rich-club the following statements hold for its structure andits interaction with the whole network1.
Inner Structure: (i) The induced subgraph of the√m-rich-
club of existing social networks is dense, in particular much
1Part of our findings reinforce some of the claims of previous rich-clubstudies on additional real-world networks, other findings reveal new features.In this paper we study them together since they were not considered beforein the context of a
√m-elite size.
denser than the whole network. (ii) The largest connected com-ponent of this subgraph contains almost all rich-club nodes.(iii) The average degree of the
√m-rich-club in its induced
subgraph is significantly higher than the average degree ofthe whole networks. Note that these findings are NOT amere consequence of the fact that the rich-club contains thehighest degree nodes (cf. to networks with the same number ofedges generated according to some complex network modelsdiscussed later).
Influence: The elite has a “disproportionate” power towardthe society. In graph terms, a significant constant fraction ofnodes outside the
√m-rich-club have a neighbor in the
√m-
rich-club. Related to this is the fact that the size of the cutbetween the
√m-rich-club and the rest of the network is a
significant constant fraction of all edges in the network.Stability: The elite is stable against “outside” pressure from
the society. In graph terms, the ratio of the outgoing edgesfrom elite to the inner edges of the elite is constant.
Symmetry: In directed networks the√m-rich-club is sig-
nificantly more symmetric than the whole network.Evolution: There is a high correlation between the high
degree nodes and the seniority of members in the networks.Note that while some models predict this well, others do not.
Some of the above properties might have been known ona anecdotal level or may seem obvious, however, they havenot been measured together for growing rich-clubs and theycannot be explained by only considering the fact that the k-rich-club contains the highest degree nodes. It does not holdfor arbitrary networks that the structure of the k-rich-club hasthese properties. In order to demonstrate this, we compare ourfindings on real-world data to the properties the popular Erdos-Renyi model, the Barabasi-Albert model and the Affiliationnetworks model exhibit. While there are some similarities,unfortunately these models fail to produce networks with arich-club featuring all the properties found in real networks.Related and additional shortcomings have been pointed outfor these and other models in previous work on the rich clubphenomenon together with the need to devise improved modelscapturing this [35].
In the next section we introduce the notions, complex net-works and models used in this paper, followed by an axiomaticderivation of the elite’s size. After presenting our measurementresults in more detail and reviewing related work, we discussour findings and some major open questions raised by themin Section VI.
II. DATASETS AND MODELS
Today several popular online social networking sites likeFacebook, Twitter, Flickr, YouTube, Orkut, and LiveJournalexist. These networking sites are based on an explicit usergraph to organize, locate, and share content as well as contacts.In many of these sites, links between users are public and canbe crawled automatically. This allows researchers to captureand study a large fraction of the user graph. The obtaineddata sets present an ideal opportunity to measure and studyonline social networks at a large scale. Mislove et al. [26], [25],
3
[31] have collected data from the most prominent online socialnetworks and made them available to the research community.We used their data on Facebook, Livejournal, Orkut, Flickr,YouTube in addition to data provided by the Stanford LargeNetwork Dataset Collection (http://snap.stanford.edu/data/) onAutonomous Systems (AS) and Wikipedia link graphs. Fur-thermore, we study the rich-club of Twitter [17] and a citationnetwork (who cites whom) derived from DBLP and the ACMdigital library.
To find out if the rich-club of real life complex networks isstructurally different from arbitrary networks and to examinethe rich-club of some well known graph models, we generatesome graphs according to the the Erdos-Renyi random graphmodel, the Barabasi-Albert model and the Affiliation model.One of the first and most simple models for networks is theErdos-Renyi (ER) random graph model [5]. In this model anedge between each pair of nodes exists with equal probabilityp, independently of the other edges. One model to generatescale-free graphs exhibiting some properties found in realnetworks is the Barabasi-Albert (BA) model [1]. It capturesgrowth and preferential attachment. More precisely it modelsthe evolution of a social network, where nodes join thenetwork and build links to existing nodes, based on theirdegree. The higher the degree of a node, the more likelyit is to attract new nodes to connect to it. The networkstarts as an initial network of m0 nodes. New nodes areadded to the network one at a time. Each new node isconnected to m′ ≤ m0 existing nodes with a probability thatis proportional to the number of neighbors that the existingnodes already have. Formally, the probability pi that the newnode is connected to node i is [1] pi = deg(i)/
∑j deg(j),
where deg(i) is the degree of node i. In this work we adoptthe convention m0 = m′ and start with an initial networkforming a complete graph (clique). Another model, based ona bipartite affiliation graph from which a social network isderived, was presented in [18]. The affiliation graph modelsthe fact that people (“actors”) are typically connected to otherpeople via “societies” (e.g., schools we visited, streets welive in, companies we work for, etc.). The social network isobtained by folding the bipartite graph, i.e., by generating an(undirected) edge in the social network for paths of length twoin the affiliation graph. The affiliation graph evolves by lettingnew actors and societies copy another node’s neighbors withsome probability in addition to preferential attachment edgesbased on the degree. For each of these models we producedgraphs with 1 million nodes. The parameters we used werep = 0.00002 for the ER model, m′ = 10 for the BA model,and cq = cu = 2 (the number of edges added in 1 evolutionstep), s = 2 (the number of edges added by preferentialattachment) and β = 0.5 (how often the left/right side ofthe bipartite graph grows). We decided to use these models asmost other models known to us are based on variations andcombinations of these models. All data sets (with degree rankas node identifiers) that we used in this paper are publiclyavailable by emailing [email protected].
∑
v∈Edi(v)
∑
v∈Edo(v)
E
Fig. 1. Graphical demonstration of the elite and parameters in the Axioms.m is the total number of edges in the graph, E is the elite set (colorednodes),
∑v∈E do(v) is the total number of outgoing edges from the elite
and∑
v∈E di(v) is the total number of edges within the elite.
III. ELITE SIZE - AN AXIOMATIC APPROACH
In this section we address one of the basic and mostintriguing questions about the elite: what is its size? Manydefinitions of the elite indicate that the elite is a small groupcompared to the whole population. But what is the “right”size? What is small?
To answer these questions, and to explain our empiricalresults we take an axiomatic approach: we assume that anelite features some basic properties in order to maintain itspower in the society and based on these we infer its size. Weclaim that the elite must be socially stable and influential. Byadding either a density or min-size property we conclude thatthe elite size is in the order of Θ(
√m), where m is the total
number of edges. When the number of edges is proportionalto the number of nodes n then the elite size turns out to beΘ(√n).2
More formally, let the set E ⊂ V denote the elite consistingof |E| nodes. For a node v ∈ E let di(v) denote the internaldegree of v within E , i.e., how many neighbors of v belong tothe set E ; analogously do(v) denotes the number of neighborsof v that are outside of the set E , i.e., in V \ E . Let c1, c2, c3be some constants. We postulate the following axioms for theelite set E .
1. Influence. The number of out-going edges from the eliteis a constant fraction of the total number of edges in thenetwork.
∑
v∈Edo(v) ≥ c1 ·m (1)
for 0 < c1 < 1.Motivation: This axiom captures the power and influencethat are associated with the elites. In complex networksan edge can be interpreted as a source of influence, thusa powerful group must control a large fraction of edgesin the network.
2While traditional research on social networks assumed that m = Θ(n),more recent models and observations[18], [21] show that m = ω(n), so mand n might differ in the order of magnitude.
4
data n m√m-rich-club Influence - c1 Stability - c2 Density - c3
TABLE IBASIC PROPERTIES OF THE EXAMINED NETWORKS AND MODELS (# OF NODES, # OF EDGES) AND THE AXIOM CONSTANTS c1, c2, c3 WHEN THE ELITE IS
THE√m-RICH-CLUB. THE AVERAGE AND STANDARD DEVIATION ARE OF THE REAL NETWORKS ONLY. HIGHLIGHT CELL INDICATE A PROBLEM.
2. Stability. The number of edges within the elite is propor-tional to the number of out-going edges from the elite.
∑
v∈Edi(v) ≥ c2 ·
∑
v∈Edo(v), (2)
for 0 < c2 < 1.Motivation: In order to adhere to its opinion, the elitemust be able to resist “outside” pressure, otherwise indi-viduals in the elite will change their option and will beinfluenced instead of being influential. Consider a nodev ∈ E that makes decision based on a weighted majorityof her friends. Since people in the elite are, by definition,more powerful (e.g., rich, educated, etc.) elite members’opinions count for more when v consults it neighborhood.If we weigh friends within the elite with power 1, thenthe weight of the outside friends w will be less than 1. c2represent the (average) power we associate with friendsoutside the elite in a stable case. Therefore we expect thatc2 < 1 in real networks.
3. Minimum-Size/Compactness. The number of elite mem-bers tends to be as small as possible.Motivation: This axiom is based on some basic principalsin science like Principle of minimum energy, Principle ofleast action and Occam’s razor. Giving that other thingsare equal (such as influence and stability) the elite sizewill tend to be as small as possible. In social terms thiscan be motivated by the idea that if the elite holds a givenrevenue or power it will attempt to split it between as fewmembers as possible.
4. Density. The elite is dense
∑
v∈Edi(v) ≥ c3 ·
(|E|2
)(3)
for 0 < c3 < 1.Motivation: The goal of the density property is to capturethe idea that the elite is a social “clique” where “everyoneknows everyone”. The density property holds when each
member of the elite knows (on average) a constantfraction of the elite members.
Based on these axioms we can infer the size of the elite |E|.First we show a lower bound.
Claim 3.1: If the elite satisfies Axioms 1 and 2 the size ofthe elite is: |E| = Ω(
√m).
Proof: First note that |E|2 >∑v∈E di(v). Using Eq. (1)and (2) we get |E|2 > ∑v∈X di ≥ c1 · c2 ·m which implies|E| ≥ Ω(
√m).
It is important to note that Axioms 1 and 2 alone donot guarantee a small elite. Take for example a linear sizeelite, i.e., |E| = Θ(m), of constant degree, e.g., a constantdegree expander [9]. If additionally each member of the eliteis connected to a constant number of nodes outside of theelite, the resulting elite is both stable and influential. Inorder to derive a small elite size we must assume additionalaxiom(s).We next show that assuming either Axiom 3 or 4,enable us to conclude an elite size in the order of
√m.
Theorem 3.2: If the elite satisfies Axioms 1, 2 and 3 thesize of the elite is: |E| = Θ(
√m) and the elite is dense.
Proof: The upper bound of |E| = O(√m) follows directly
from Claim 3.1 and Axiom 3. Now assume the elite is notdense. Then
∑v∈X di = o(|E|2) = o(m). But this contradicts∑
v∈X di ≥ c1 · c2 ·m, thus elite must be dense.Theorem 3.3: If the elite satisfies Axioms 1, 2 and 4 then
the size of the elite is: |E| = Θ(√m) and the elite is compact.
Proof: As before, |E|2 >∑v∈E di(v) and using Eq. (1),(2) and (3) we get |E|2 > c′ ·m ≥ c′′ · |E|2 for some constantsc′, c′′. Hence it must hold that |E| = Θ(
√m) which means the
elite is compact (i.e., of minimum possible size when assumingAxiom 1 and 2 ).
An important note is in place: the Axioms and results abovehold for undirected networks only. For directed networks likeTwitter, a more general treatment is needed and we leave thisfor future work.
In context of the above results we would like to mention thepioneering work of Linial et. al. [23] and Peleg [29] where anotion related to elites is discussed, namely coalitions (subsets
5
of nodes) that dominate neighborhood majority votings, so-called monopolies. Among the results regarding monopoliesare lower bounds for the size of these coalitions, namelyΩ(√m) nodes are necessary to control the outcome of all
neighborhood majority votings of general graphs and thenumber of edges within the monopoly has to be in the order ofm. Interestingly, we use a different perspective but our Axioms1 and 2 lead to the same result for a powerful elite.
In the next section we present measurements to supportour claim that the elite size in social networks is of sizeΘ(√m). We show that for existing networks a rich club of
size Θ(√m) is both stable in influential, where this is not the
case for standard models like the BA and Affiliation model.As discussed earlier we will focus on the rich-club of differentsizes as an approximation for the elite of the network.
IV. MEASUREMENTS ON REAL DATA AND MODELS
We studied a variety of parameters for rich-clubs of growingsize for nine real networks and three theoretical models(Erdos-Renyi (ER) model, Barabasi-Albert (BA) model andthe Affiliation model). We put our focus on k-rich-clubs fork in the order of
√m to point out our claim that rich-clubs
around this size satisfy our axioms. First we examine the con-stants c1, c2, c3 relevant to our axioms properties of influence,stability and density, and then other relevant properties.
A. Axiom constants - c1, c2, c3
Table I gives a summary on basic properties of the networksunder scrutiny such as the number of nodes and edges (nand m respectively) and the influence, stability and densityconstants (c1, c2, c3, respectively) for the
√m-rich club of each
network. Gray cells indicate a problem in the model, as wediscuss next: i) Influence - the influence constant fluctuatesbetween 9% − 66% in the real networks with high variance,c1 of the BA and Affiliation models both fall in this range, butclearly (and intuitively) in the ER model, the
√m-rich-club is
not influential enough. ii) Stability - All the constants for thereal networks are below one as expected. For the Affiliationmodel c2 > 2, (220%), which contradicts our Axiom. iii)Density - Real networks show a density constant between4% and 28% while all three models are problematic, ER andBA are too sparse and the Affiliation model is too dense. Wediscuss these findings in more detail later.
We now take a broader view of the results and check theabove constants for an increasing size of k-rich-club from k =1 to k = n. In order to compare networks of different sizes weuse plots where the x axis (the rich-club size, k) is normalizedto [0, 1]. To focus on small k-rich-clubs, the x-axis describesthe rich-club size for growing roots of the network size n,i.e., at x ∈ [0, 1] the measurement point for the nx-rich-club,in particular at x = 0.5 we have the values for the
√n-rich-
club. We emphasize the size of the√m-rich-club by adding
a large dot at its location which differs for each network. Inother figures (usually in a smaller size) we present the resulton a linear x-axis where k = nx which demonstrates that
0. 0.1 0.2 0.3 0.4 0.5 0.6 0.7 0.8 0.9 1.
0.0
0.1
0.2
0.3
0.4
0.5
0.6
0.7
nx ! rich club
InfluenceConstant!C1
0. 0.1 0.2 0.3 0.4 0.5 0.6 0.7 0.8 0.9 1.
0.0
0.1
0.2
0.3
0.4
0.5
0.6
0.7
n x! rich club
InfluenceConstant!C1
(A)
0. 0.1 0.2 0.3 0.4 0.5 0.6 0.7 0.8 0.9 1.0.0
0.5
1.0
1.5
2.0
2.5
nx ! rich club
StabilityConstant!
C2
0. 0.1 0.2 0.3 0.4 0.5 0.6 0.7 0.8 0.9 1.0.0
0.5
1.0
1.5
2.0
2.5
n x! rich club
StabilityConstant!
C2
(B)
0. 0.1 0.2 0.3 0.4 0.5 0.6 0.7 0.8 0.9 1.
0.0
0.2
0.4
0.6
0.8
nx ! rich club
DensityConstant!
C3
0. 0.1 0.2 0.3 0.4 0.5 0.6 0.7 0.8 0.9 1.
0.0
0.2
0.4
0.6
0.8
1.0
n x! rich club
DensityConstant!
C3
(C)
ER
BA
Affiliation
Facebook
AuthorCitations
AS
Orkut
Livejournal
Flickr
YouTube
Wikipedia
Twitter
Fig. 2. Three graphs that show the values for influence, stability and densityfrom the axioms on nine real networks (solid lines) and three models (dashedlines) for nx-rich-clubs. (A) the influence constant - c1, (B) the stabilityconstant - c2 and (C) the density constant - c3. The dotes indicate where the√m-rich-club is located and at x = 0.5 the value for the
√n-rich-club is
depicted. The small figures are the same but with a linear scale, i.e., k = nx.
6
interesting phenomena occur for a very small k compare tothe network size (i.e., in the order of
√m).
Fig. 2 (A), (B) and (C) presents the results for influence,stability and density of growing rich-clubs, respectively. Re-garding influence - c1, we observe some similar characteristicsfor all networks: i) influence increases monotonically until themaximum influence which is achieved at a rich-club size muchlarger than
√m. ii) the constant c1 is bound away from 0 at√
m (except in the ER model). Moreover, influence in mostreal networks is larger than in the models for low order k.Two extremes cases are the AS (Internet routers) network andTwitter. In particular Twitter is a directed network where thek-rich-club seems to have a much larger (directed) influence.Since we have data of Twitter only for a k-rich-club up tok =√n not the whole scale is presented for this network.
For the stability constant c2 we also observe similar behav-ior among the networks: stability monotonically increases withthe rich-club size. Except for Twitter and the ER model theconstant is clearly bounded away from 0 for
√m-rich-club.
Recall that our axiom results about the constants hold (andare well-defined) for the undirected case only, whereas Twitteris a highly asymmetric directed network. As noted whendiscussing Table I c2 of the Affiliation model exceeds 1 forat the
√m-rich-club (and much earlier) which contradicts the
second axiom.An important observation is that to increase both influence
and stability a larger k-rich-club is better. In contrast this in notthe case with density. The density of the k-rich-club exhibitsthe opposite behavior (common to all networks, but the ERmodel): the maximum density is achieved at a rich-club sizesignificantly smaller than
√n and from there on the density
decreases monotonically (except for the Affiliation model). Sofor the k-rich-club to be denser is must be smaller, while tobe influential and stable its size needs to be larger.
We conjecture that these conflicting forces determine the“right” size of the elite. The above empirical results (strength-ened by the axioms) indicate that the balance between theseforces, or the equilibrium, is achieved when the rich-club isin the order of
√m. Moreover none of the three theoretical
models seems to capture all of the properties (influence,stability and density) in the right scales as shown by the realnetworks.
To make the claims about the model more formal we canstate the following:
Proposition 4.1 (ER model rich-club density ): Theexpected number of edges in the k-rich-club of a ER graphis o(k2) for p = o(1) and large enough k.
It is also not hard to show that the BA model does not fulfillthe density requirement
Theorem 4.2 (Barabasi-Albert model rich-club density):The expected number of edges in the k-rich-club of aBarabasi-Albert graph is linear, i.e., O(k).
Proof: No matter which nodes belong to the k-rich-club,each node has m outgoing edges in the BA model. Hencethe total number of edges within the rich-club cannot exceed2k ·m. As a consequence the rich-club is not dense if k is not
in the same order of magnitude as m.A more challenging task from a theoretical point is to prove
that the Affiliation model does not capture the properties ofthe rich-club of complex systems or social networks. We leavethis as a conjecture in this work and provide more empiricalevidence in the next section.
B. Seniority
Besides a high degree, what other properties do the rich-clubmembers have? It is known that there is a strong correlationbetween high degree and time of arrival to the network [1],[14], [17]. We call nodes that arrive early senior membersof the network. We would like to point out the arrival orderof rich-club nodes in the Affiliation model compared toWikipedia. Fig. 3 shows that in the Wikipedia graph themembers of the 10’000-rich-club are indeed mostly seniors,i.e., they arrived early (low y-axis value). On the other hand,Fig.3 exposes what we think can be a major problem in theAffiliation model. The figure shows that significant number ofthe 10’000-rich-club are non-senior members, i.e., there aremany nodes that arrived late (high y-axis value) but have avery high degree (low x-axis value). This can be intuitivelyunderstood from the model: in the Affiliation model, a latecomer (i.e., non-senior) node usually joins a popular affiliationin the copying process. Once it joined an affiliation its degreeis (immediately!) at least the size of the affiliation. This leadsto a situation where all members of the largest affiliation (ofwhich many members are not senior) are part of the rich-club.We can clearly see these phenomena in Fig. 3. The nodes in thesame “black wave” in the plot belong to the same affiliation.
C. Maximum Sociability
Another measure for the structure and connectivity of thek-rich-club is the sociability. The sociability of a graph is itsnormalized average degree, i.e., for k-rich-club with mk edgesamong the rich-club members this value is mk/k
max1≤k′≤n m′k/k′ .
For a graph of growing size the maximum sociability capturesthe size of the network at which its members are, on average,most socially involved (or influenced) in the community. Asmentioned earlier the average degree of the BA model is thesame for any k-rich-club and therefore its sociability levelis more or less constant after 5% of the network size. Incontrast, real social networks are significantly different withthe maximum sociability achieved at a k-rich-club of sizearound n0.6. This can be seen in Fig. 4, where the figure showsthat the maximum is achieved at a small scale k-rich-club.Interestingly, all real social networks have a single peak for themaximum, this may indicate that this point is a good candidateto define the ”right” size of the rich-club. An exception to thisrule of thumb is the Wikipedia graph with two maxima. Whenexamining Figures 4, we notice that the maxima occur beforeor after k =
√m in some networks. One possible explanation
is that our data sets are not complete, i.e. some nodes andedges are missing, another one is that these networks are notin a balanced state, i.e., the elite will grow or shrink until anequilibrium is reached.
7
Wikipedia
0 2000 4000 6000 8000 10000Nodes ordered by degree, high to low
0
200000
400000
600000
800000
1x10⁶
1.2x10⁶
1.4x10⁶
1.6x10⁶
1.8x10⁶
Node
s ar
rival
tim
e
Affiliation model
0 2000 4000 6000 8000 10000Nodes ordered by degree, high to low
0
200000
400000
600000
800000
1x10⁶
Node
s ar
rival
tim
e
Fig. 3. (Top) Seniority in Wikipedia: high correlation between order of arrival(y-axis) and order of degree (x-axis). Most nodes depicted in this plot havearrived early and they belong to the 10’000-rich-club. (Bottom) Seniority inAffiliation model: many late comers (non-senior members) are part of the10’000-rich-club
0. 0.1 0.2 0.3 0.4 0.5 0.6 0.7 0.8 0.9 1.
0.0
0.2
0.4
0.6
0.8
1.0
nx ! rich club
edgecountnormalized
count
0. 0.1 0.2 0.3 0.4 0.5 0.6 0.7 0.8 0.9 1.
0.0
0.2
0.4
0.6
0.8
1.0
n x! rich club
Sociability
0. 0.1 0.2 0.3 0.4 0.5 0.6 0.7 0.8 0.9 1.
0.0
0.2
0.4
0.6
0.8
1.0
n x! rich club
Sociability
0. 0.1 0.2 0.3 0.4 0.5 0.6 0.7 0.8 0.9 1.
0.0
0.2
0.4
0.6
0.8
1.0
n x! rich club
Sociability
Fig. 4. Maximum Sociability: This graph depicts the number of rich-clubedges divided by the number of rich-club nodes with the maximum normalizedto one, for a k-rich-club with mk edges this value is mk/k
max1≤k′≤n m′k/k′ . This
ratio is equal to the average degree of the rich-club nodes.
D. Elite Connectivity
In social networks, the largest connected component (LCC)typically covers almost all nodes of the network. However thisdoes not imply that for any graph with a large LCC it musthold that the LCC of the k-rich-club contains almost all knodes. E.g., we found when analyzing the size of the LCCof the
√m-rich-club reveals that almost all nodes in the rich-
club of the social networks belong to the LCC. The same holdsfor the BA and Affiliation model. In the ER graph however,most rich-club nodes do not have any edges to other rich-club nodes, hence the rich-club is split into many separatecomponents, most of them consisting of one node only.
THE NUMBER OF CONNECTED COMPONENTS THE√m-RICH-CLUB, THE
SIZE OF ITS LARGEST CONNECTED COMPONENT (LCC).
E. Symmetry
In some networks the existence of an edge describes areciprocal, symmetric relation between the two nodes involved(undirected network), whereas in other networks an edge fromnode a to node b (directed network) means that a has a certainrelationship with b but not necessarily the other way around.Classically, sociologists make a distinction between directednetworks and undirected networks when analyzing them. E.g.,the first question of a decision tree for the analysis of cohesivesubgroups on page 78 of [33] is “Is the network directed?”.The mathematical tools that are used differ depending onthe answer, e.g., the notion of prestige (in-degree) does onlyapply to directed networks. On the other hand, in undirectedgraphs, degree centrality is used (see [32], Chapter 5). Clearlythe directed graph model contains more information than itsequivalent undirected version. However in many networks itis impossible or difficult to derive who initiated a relationshipand/or what the direction of an edge is. For directed networksa natural question is whether the rich-club of the networkis more symmetric than the rest of the network. Of ourdatasets the networks Wikipedia, Flickr, YouTube, Twitter andER graph are directed. The average symmetric degree in therich-club has a unique maximum in all three real networks.The maximum “ordinary” average degree of the rich-club isreached slightly after the maximum of the symmetric rich-clubdegree. Furthermore, it holds that the rich-club of the networksis more symmetric: the ratio between symmetric edges and all
8
edges in the k-rich-club starts at almost 1 for k = 2 and thendecreases rather quickly until reaching almost zero when kapproaches n. At around the maximum sociability (k ≈ √n)the symmetric edges are still a significant fraction of all edges.In the ER graph model there are no symmetric edges which isnot surprising for the chosen edge probability. Since the BAmodel and the Affiliation model are undirected they cannothelp to explain or model the high symmetry within the rich-club.
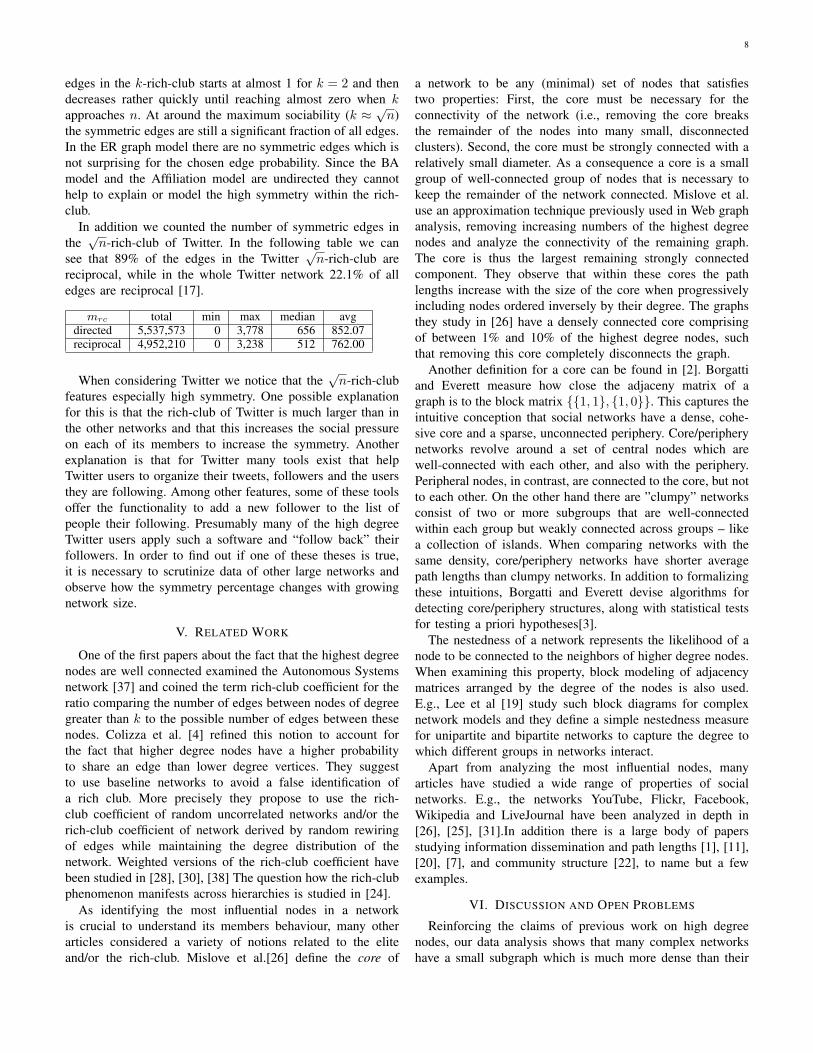
In addition we counted the number of symmetric edges inthe√n-rich-club of Twitter. In the following table we can
see that 89% of the edges in the Twitter√n-rich-club are
reciprocal, while in the whole Twitter network 22.1% of alledges are reciprocal [17].
mrc total min max median avgdirected 5,537,573 0 3,778 656 852.07reciprocal 4,952,210 0 3,238 512 762.00
When considering Twitter we notice that the√n-rich-club
features especially high symmetry. One possible explanationfor this is that the rich-club of Twitter is much larger than inthe other networks and that this increases the social pressureon each of its members to increase the symmetry. Anotherexplanation is that for Twitter many tools exist that helpTwitter users to organize their tweets, followers and the usersthey are following. Among other features, some of these toolsoffer the functionality to add a new follower to the list ofpeople their following. Presumably many of the high degreeTwitter users apply such a software and “follow back” theirfollowers. In order to find out if one of these theses is true,it is necessary to scrutinize data of other large networks andobserve how the symmetry percentage changes with growingnetwork size.
V. RELATED WORK
One of the first papers about the fact that the highest degreenodes are well connected examined the Autonomous Systemsnetwork [37] and coined the term rich-club coefficient for theratio comparing the number of edges between nodes of degreegreater than k to the possible number of edges between thesenodes. Colizza et al. [4] refined this notion to account forthe fact that higher degree nodes have a higher probabilityto share an edge than lower degree vertices. They suggestto use baseline networks to avoid a false identification ofa rich club. More precisely they propose to use the rich-club coefficient of random uncorrelated networks and/or therich-club coefficient of network derived by random rewiringof edges while maintaining the degree distribution of thenetwork. Weighted versions of the rich-club coefficient havebeen studied in [28], [30], [38] The question how the rich-clubphenomenon manifests across hierarchies is studied in [24].
As identifying the most influential nodes in a networkis crucial to understand its members behaviour, many otherarticles considered a variety of notions related to the eliteand/or the rich-club. Mislove et al.[26] define the core of
a network to be any (minimal) set of nodes that satisfiestwo properties: First, the core must be necessary for theconnectivity of the network (i.e., removing the core breaksthe remainder of the nodes into many small, disconnectedclusters). Second, the core must be strongly connected with arelatively small diameter. As a consequence a core is a smallgroup of well-connected group of nodes that is necessary tokeep the remainder of the network connected. Mislove et al.use an approximation technique previously used in Web graphanalysis, removing increasing numbers of the highest degreenodes and analyze the connectivity of the remaining graph.The core is thus the largest remaining strongly connectedcomponent. They observe that within these cores the pathlengths increase with the size of the core when progressivelyincluding nodes ordered inversely by their degree. The graphsthey study in [26] have a densely connected core comprisingof between 1% and 10% of the highest degree nodes, suchthat removing this core completely disconnects the graph.
Another definition for a core can be found in [2]. Borgattiand Everett measure how close the adjaceny matrix of agraph is to the block matrix 1, 1, 1, 0. This captures theintuitive conception that social networks have a dense, cohe-sive core and a sparse, unconnected periphery. Core/peripherynetworks revolve around a set of central nodes which arewell-connected with each other, and also with the periphery.Peripheral nodes, in contrast, are connected to the core, but notto each other. On the other hand there are ”clumpy” networksconsist of two or more subgroups that are well-connectedwithin each group but weakly connected across groups – likea collection of islands. When comparing networks with thesame density, core/periphery networks have shorter averagepath lengths than clumpy networks. In addition to formalizingthese intuitions, Borgatti and Everett devise algorithms fordetecting core/periphery structures, along with statistical testsfor testing a priori hypotheses[3].
The nestedness of a network represents the likelihood of anode to be connected to the neighbors of higher degree nodes.When examining this property, block modeling of adjacencymatrices arranged by the degree of the nodes is also used.E.g., Lee et al [19] study such block diagrams for complexnetwork models and they define a simple nestedness measurefor unipartite and bipartite networks to capture the degree towhich different groups in networks interact.
Apart from analyzing the most influential nodes, manyarticles have studied a wide range of properties of socialnetworks. E.g., the networks YouTube, Flickr, Facebook,Wikipedia and LiveJournal have been analyzed in depth in[26], [25], [31].In addition there is a large body of papersstudying information dissemination and path lengths [1], [11],[20], [7], and community structure [22], to name but a fewexamples.
VI. DISCUSSION AND OPEN PROBLEMS
Reinforcing the claims of previous work on high degreenodes, our data analysis shows that many complex networkshave a small subgraph which is much more dense than their
9
complete network. In addition the structure of the wholenetwork is influenced by this rich club. This can be exploitedto find good candidate networks for the problem of findingthe most dense subgraph (a NP-hard problem [13] on generalgraphs). One can apply the following procedure: Sort the nodesaccording to their degrees and choose the most dense subgraphamong the subgraphs that containing the first k highest degreenodes. We hope that this heuristic can be turned into anapproximation algorithm once there are better models thatcapture rich-club properties of complex networks.
In addition we provide answers to the central question ofhow symmetry is spread among the edges of directed socialnetworks. We show that edges inside the rich-club are muchmore symmetric than random edges that are not inside therich-club. We can also see that in real complex networks mostof the participants that are in the rich-club arrive early.
In order to make a step forward towards finding the “cor-rect” size of the rich-club we use rich-club expansion to deter-mine a subset which exhibits significant structural differenceand influence to the rest of the network. This is closely relatedto the question of finding the elite of a complex network. Basedon three axioms and on measurements performed on ninereal-world networks, we conclude that the elite of a networkconsists of around
√m nodes and the
√m-rich-club serves as
a good approximation for the elite.Unfortunately none of the existing models we examined are
able to predict all the phenomena we describe. Hence, wesupport the quest raised in [35] for models capturing the mainproperties of complex networks and their elites continues, tobe able to provide a better understanding of society and itscommunities.
VII. ACKNOWLEDGEMENTS
We would like to thank the anonymous reviewers and arXivreaders for their suggestions for improvements and pointers torelated work.
REFERENCES
[1] R. Albert and A. Barabasi. Statistical mechanics of complex networks.Reviews of modern physics, 74(1):47–97, 2002.
[2] S. Borgatti and M. Everett. Models of core/periphery structures. Socialnetworks, 21(4):375–395, 2000.
[3] S. Borgatti, M. Everett, and L. Freeman. Ucinet for windows: Softwarefor social network analysis. Harvard Analytic Technologies, 2006, 2002.
[4] V. Colizza, A. Flammini, M. Serrano, and A. Vespignani. Detectingrich-club ordering in complex networks. Nature Physics, 2(2):110–115,2006.
[5] P. Erdos and A. Renyi. On the evolution of random graphs, volume 5.1960.
[6] M. Gladwell. The tipping point: How little things can make a bigdifference. Little, Brown and Company, 2000.
[7] S. Goel, R. Muhamad, and D. Watts. Social search in small-worldexperiments. In World Wide Web, pages 701–710, 2009.
[8] D. Greer. Incidence of the terror during the french revolution: Astatistical interpretation author: Donald greer, publisher: Peter. 1935.
[9] S. Hoory, N. Linial, and A. Wigderson. Expander graphs and theirapplications. Bulletin of the American Mathematical Society, 43(4):439–562, 2006.
[10] M. Humphries. Roman senators and absent emperors in late antiquity.Acta ad archaeologiam et artium historiam pertinentia, 17:27–46, 2003.
[11] D. Kempe, J. Kleinberg, and E. Tardos. Maximizing the spreadof influence through a social network. In SIGKDD Conference onKnowledge discovery and data mining, pages 137–146, 2003.
[12] J. Kleinberg. The small-world phenomenon: an algorithm perspective.In Proceedings of the thirty-second annual ACM symposium on Theoryof computing, pages 163–170, 2000.
[13] G. Kortsarz and D. Peleg. On choosing a dense subgraph. In FOCS,pages 692–701, 1993.
[14] P. Krapivsky and S. Redner. Statistics of changes in lead node inconnectivity-driven networks. Phys. Rev. Letters, 89(25):258703, 2002.
[15] C. Kraus and T. Livius. Livy, Ab urbe condita. CUP, 2010.[16] R. Kumar, P. Raghavan, S. Rajagopalan, D. Sivakumar, A. Tomkins,
and E. Upfal. Stochastic models for the web graph. In Foundations ofComputer Science (FOCS), Symposium on, pages 57–65, 2000.
[17] H. Kwak, C. Lee, H. Park, and S. Moon. What is Twitter, a socialnetwork or a news media? In World Wide Web, pages 591–600, 2010.
[18] S. Lattanzi and D. Sivakumar. Affiliation networks. In Symposium onTheory of computing(STOC), pages 427–434, 2009.
[19] D. Lee, S. Maeng, and J. Lee. Scaling of nestedness in complexnetworks. Journal of the Korean Physical Society, 60(4):648–656, 2012.
[20] J. Leskovec and E. Horvitz. Planetary-scale views on a large instant-messaging network. In World Wide Web, pages 915–924, 2008.
[21] J. Leskovec, J. Kleinberg, and C. Faloutsos. Graph evolution: Densifi-cation and shrinking diameters. Transactions on Knowledge Discoveryfrom Data (TKDD), 1(1):2, 2007.
[22] J. Leskovec, K. Lang, A. Dasgupta, and M. Mahoney. Statistical prop-erties of community structure in large social and information networks.In World Wide Web, pages 695–704, 2008.
[23] N. Linial, D. Peleg, Y. Rabinovich, and M. Saks. Sphere packing andlocal majorities in graphs. In Theory and Computing Systems, pages141–149. IEEE, 1993.
[24] J. McAuley, L. da Fontoura Costa, and T. Caetano. Rich-club phe-nomenon across complex network hierarchies. Applied Physics Letters,91:084103, 2007.
[25] A. Mislove, H. S. Koppula, K. P. Gummadi, P. Druschel, and B. Bhat-tacharjee. Growth of the flickr social network. In Workshop on SocialNetworks (WOSN’08), 2008.
[26] A. Mislove, M. Marcon, K. P. Gummadi, P. Druschel, and B. Bhattachar-jee. Measurement and Analysis of Online Social Networks. In InternetMeasurement Conference (IMC’07), 2007.
[27] M. Newman. Networks: an introduction. Oxford University Press, 2010.[28] T. Opsahl, V. Colizza, P. Panzarasa, and J. Ramasco. Prominence
and control: The weighted rich-club effect. Physical review letters,101(16):168702, 2008.
[29] D. Peleg. Local majorities, coalitions and monopolies in graphs: areview. Theoretical Computer Science, 282(2):231–257, 2002.
[30] M. Serrano. Rich-club vs rich-multipolarization phenomena in weightednetworks. Physical Review E, 78(2):026101, 2008.
[31] B. Viswanath, A. Mislove, M. Cha, and K. P. Gummadi. On theEvolution of User Interaction in Facebook. In Workshop on SocialNetworks , 2009.
[32] S. Wasserman and K. Faust. Social Network Analysis: Methods andApplications (Structural Analysis in the Social Sciences). 1994.
[33] S. Wasserman and K. Faust. Exploratory Social Network Analysis withPajek (Structural Analysis in the Social Sciences). 2005.
[34] D. Watts and S. Strogatz. Collective dynamics of ‘small-world’ net-works. nature, 393(6684):440–442, 1998.
[35] X. Xu, J. Zhang, P. Li, and M. Small. Changing motif distributions incomplex networks by manipulating rich-club connections. Physica A:Statistical Mechanics and its Applications, 2011.
[36] X. Xu, J. Zhang, and M. Small. Rich-club connectivity dominatesassortativity and transitivity of complex networks. Phys. Review E,82(4):046117, 2010.
[37] S. Zhou and R. Mondragon. The rich-club phenomenon in the internettopology. Communications Letters, IEEE, 8(3):180–182, 2004.
[38] V. Zlatic, G. Bianconi, A. Diaz-Guilera, D. Garlaschelli, F. Rao, andG. Caldarelli. On the rich-club effect in dense and weighted networks.European Physical Journal B-Condensed Matter and Complex Systems,67(3):271–275, 2009.