Supercomputing Facility for Bioinformatics & Computational Biology IITD
2
Bioinformatics is an emerging interdisciplinary area of Science & Technology encompassing a systematic development and application of IT solutions to biological data.
Bioinformatics addresses biological data collection and warehousing, data base searches, analyses and interpretation, modeling and product design.
Bioinformatics involves discovery, development and implementation of computational algorithms and software tools that facilitate an understanding of the biological processes with the goal to serve primarily agriculture and healthcare sectors with several spin-offs.
For Bioinformatics to evolve as a branch of Science, it must be practised as a Hypothesis driven endeavor with Biological Data providing information for validation, leading to newer hypotheses and discoveries.
Bioinformatics
Supercomputing Facility for Bioinformatics & Computational Biology IITD
Information Knowledge Products Useful to Society
Bioinformatics & Agriculture* Increasing the nutritional content * Increasing the volume of the agricultural produce &* Implanting disease resistance etc.
Bioinformatics & Medicine* Reducing the cost and time involved in drug discovery* Development of personalized medicine
Supercomputing Facility for Bioinformatics & Computational Biology IITD
3
The highly interdisciplinary nature of Bioinformatics necessitates specialized training programmes
Chemistry
Biology
MedicineComputers
Physics
Mathematics Bioinformatics
Supercomputing Facility for Bioinformatics & Computational Biology IITD
RNA splicing model
Signal transductionpathways
Protein:DNA/RNAprotein:protein
recognition codes
Protein structureprediction
Transcription Model
Drug Design
Protein Evolution
Education
Gene ontologies
Speciation
Challenges for Bioinformatics
Supercomputing Facility for Bioinformatics & Computational Biology IITD
4
•• Pharmaceutical & Biotech. Companies involved in the innovativePharmaceutical & Biotech. Companies involved in the innovativedevelopment of drugs, agricultural products, genetically modifiedevelopment of drugs, agricultural products, genetically modified crops, d crops, medical and forensic tool kits…medical and forensic tool kits…
••Potential opportunities as entrepreneurs, researchers, software Potential opportunities as entrepreneurs, researchers, software developers, database developers, consultants and trainers.developers, database developers, consultants and trainers.
••Current Scenario: Supply exceeds demand but Current Scenario: Supply exceeds demand but Quality supply is far Quality supply is far below demand.below demand.
Employment Avenues in Bioinformatics
Supercomputing Facility for Bioinformatics & Computational Biology IITD
•Well-acknowledged IT Skills
• Active Governmental Initiatives, DBT, DST, CSIR, DIT, MHRD
•Changing Process to Product Patent Laws. In-house R&D in Pharmasector eg. at Dabur, Ranbaxy...
• Over 200 Software & Biotech. Indian companies actively involved in related R & D and promotion eg. HCLT, TCS, Wipro, Satyam, Biocon..
•Development of non-profitable yet essential medicines for third world diseases
• Increasing agricultural output to meet the needs of increasing population.
Bioinformatics & India
Supercomputing Facility for Bioinformatics & Computational Biology IITD
5
GLOBAL
INDIA
Growth potential for Bioinformatics based business opportunities in India according to IDC (International Data Corporation), India.
Much more is expected from the world leader in IT.
Growth potential of Bioinformatics
Supercomputing Facility for Bioinformatics & Computational Biology IITD
Major Research Activities in Progress &
Bioinformatics Software Suites Developed at SCFBio IIT Delhi
Supercomputing Facility for Bioinformatics & Computational Biology IITD
6
Research @ SCFBio IIT Delhi
• Gene Evaluation (ChemGene1.0)
• Protein Structure Prediction (Bhageerath1.0)
• Active Site Directed Lead Design (Sanjeevini1.0)
• Biogrid-India
Supercomputing Facility for Bioinformatics & Computational Biology IITD
The Gene to Drug suite is developed at the Supercomputing Facility for Bioinformatics & Computational Biology, IIT Delhi by Prof. B. Jayaram and coworkers (www.scfbio-iitd.org)
7
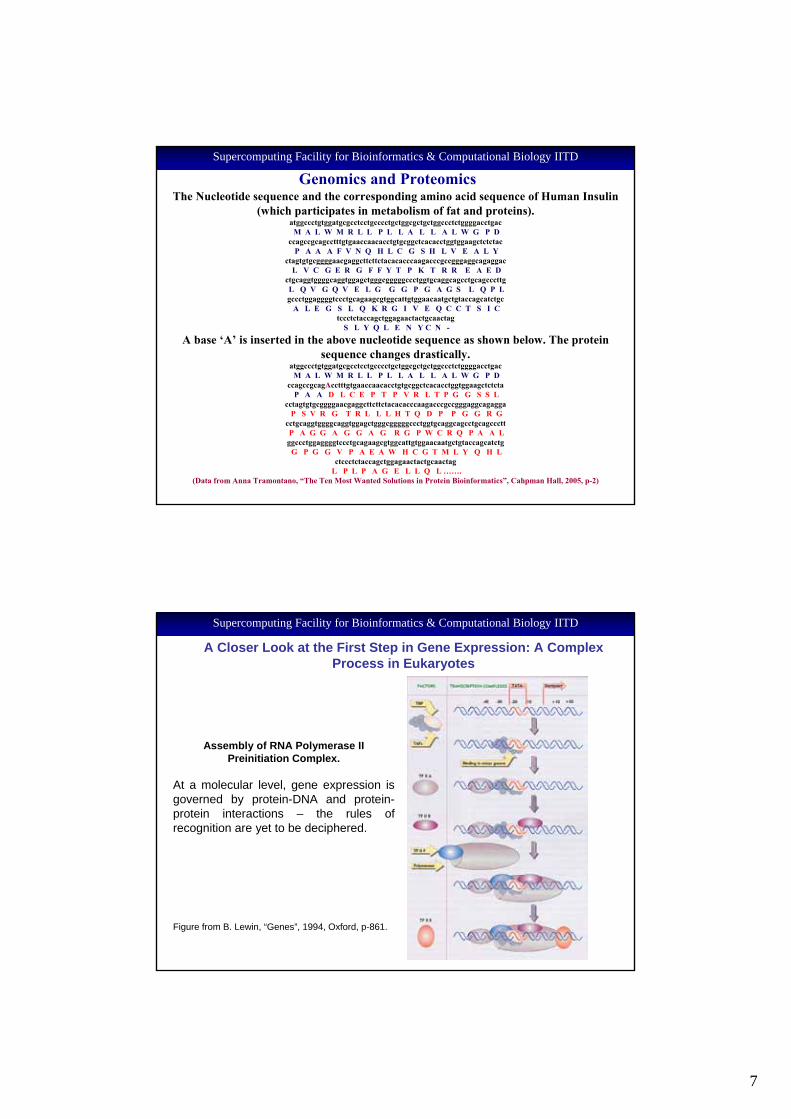
The Nucleotide sequence and the corresponding amino acid sequence of Human Insulin (which participates in metabolism of fat and proteins).
atggccctgtggatgcgcctcctgcccctgctggcgctgctggccctctggggacctgacM A L W M R L L P L L A L L A L W G P D
ccagccgcagcctttgtgaaccaacacctgtgcggctcacacctggtggaagctctctacP A A A F V N Q H L C G S H L V E A L Y
ctagtgtgcggggaacgaggcttcttctacacacccaagacccgccgggaggcagaggacL V C G E R G F F Y T P K T R R E A E D
ctgcaggtggggcaggtggagctgggcgggggccctggtgcaggcagcctgcagcccttgL Q V G Q V E L G G G P G A G S L Q P Lgccctggaggggtccctgcagaagcgtggcattgtggaacaatgctgtaccagcatctgc
A L E G S L Q K R G I V E Q C C T S I Ctccctctaccagctggagaactactgcaactag
S L Y Q L E N Y C N -
A base ‘A’ is inserted in the above nucleotide sequence as shown below. The protein sequence changes drastically.
atggccctgtggatgcgcctcctgcccctgctggcgctgctggccctctggggacctgacM A L W M R L L P L L A L L A L W G P D
ccagccgcagAcctttgtgaaccaacacctgtgcggctcacacctggtggaagctctctaP A A D L C E P T P V R L T P G G S S L
cctagtgtgcggggaacgaggcttcttctacacacccaagacccgccgggaggcagaggaP S V R G T R L L L H T Q D P P G G R G
cctgcaggtggggcaggtggagctgggcgggggccctggtgcaggcagcctgcagcccttP A G G A G G A G R G P W C R Q P A A Lggccctggaggggtccctgcagaagcgtggcattgtggaacaatgctgtaccagcatctg
G P G G V P A E A W H C G T M L Y Q H Lctccctctaccagctggagaactactgcaactag
L P L P A G E L L Q L ……. (Data from Anna Tramontano, “The Ten Most Wanted Solutions in Protein Bioinformatics”, Cahpman Hall, 2005, p-2)
Genomics and ProteomicsSupercomputing Facility for Bioinformatics & Computational Biology IITD
Assembly of RNA Polymerase II Preinitiation Complex.
At a molecular level, gene expression is governed by protein-DNA and protein-protein interactions – the rules of recognition are yet to be deciphered.
Figure from B. Lewin, “Genes”, 1994, Oxford, p-861.
A Closer Look at the First Step in Gene Expression: A Complex Process in Eukaryotes
Supercomputing Facility for Bioinformatics & Computational Biology IITD
8
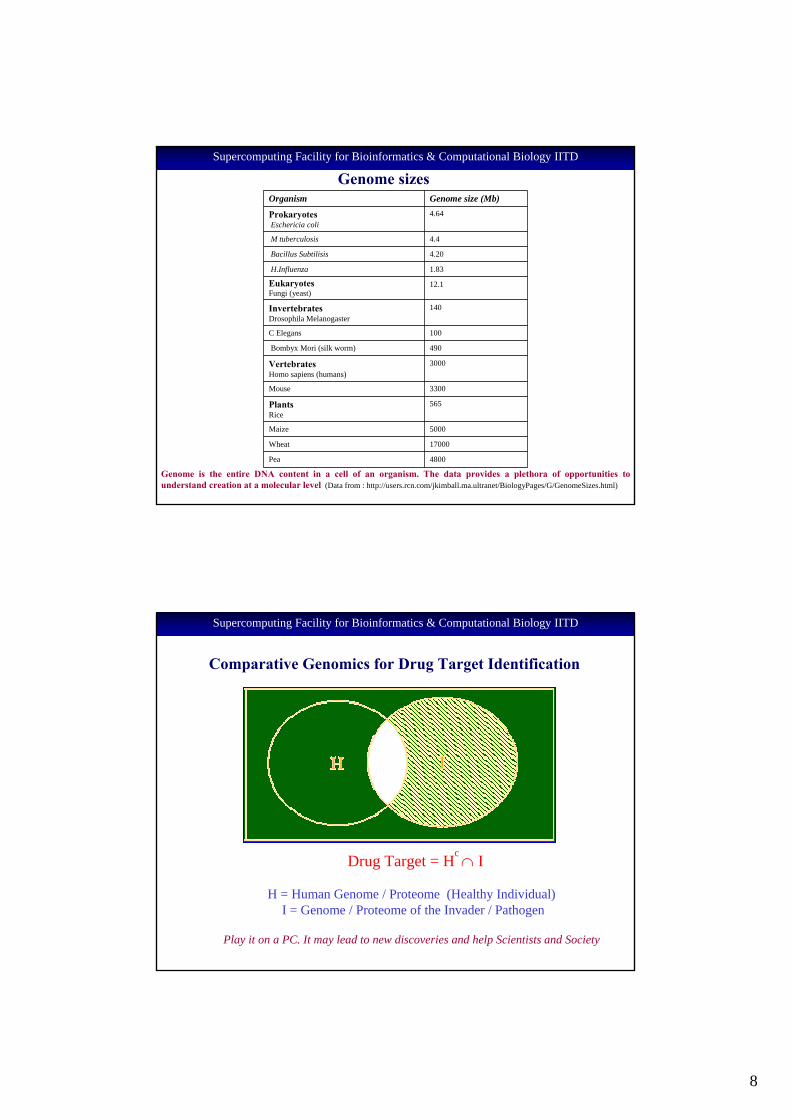
Genome sizesOrganism Genome size (Mb)
ProkaryotesEschericia coli
4.64
M tuberculosis 4.4
Bacillus Subtilisis 4.20
H.Influenza 1.83
EukaryotesFungi (yeast)
12.1
InvertebratesDrosophila Melanogaster
140
C Elegans 100
Bombyx Mori (silk worm) 490
VertebratesHomo sapiens (humans)
3000
Mouse 3300
PlantsRice
565
Maize 5000
Wheat 17000
Pea 4800
Genome is the entire DNA content in a cell of an organism. The data provides a plethora of opportunities to understand creation at a molecular level (Data from : http://users.rcn.com/jkimball.ma.ultranet/BiologyPages/G/GenomeSizes.html)
Supercomputing Facility for Bioinformatics & Computational Biology IITD
H = Human Genome / Proteome (Healthy Individual)I = Genome / Proteome of the Invader / Pathogen
Play it on a PC. It may lead to new discoveries and help Scientists and Society
Drug Target = Hc ∩ I
Comparative Genomics for Drug Target Identification
Supercomputing Facility for Bioinformatics & Computational Biology IITD
9
Hydrogen bond energy
Stac
king
ene
rgy
Groove p
otenti
als
Resulta
nt vect
or
GENE
NON-GENE
ChemGene1.0A Chemical Model to Distinguish Genes from Non-Genes
Supercomputing Facility for Bioinformatics & Computational Biology IITD
A Physico-Chemical Model to Analyze DNA SequencesChemGene1.0
We constructed a 3-D vector for each codon
•X – Hydrogen bond energy
•Y – Stacking energy
•Z – Groove potentials (Initially trained on a small data set of 1500 genes/shifted-gene pairs. Assignments made to confirm to symmetry & rule of conjugates ).
As the 3D vector walks along the genome, the net orientation of the resultant vector is calculated for gene and non-gene regions
“A Physico-Chemical Model for Analyzing DNA Sequences”, Dutta S, Singhal P, Agrawal P, Tomer R, Kritee, Khurana E & Jayaram B, J. Chem. Inf. Mod. , 2005, In Press.
“Beyond the Wobble: The rule of conjugates”. Jayaram, B., Journal of Mol Evol. 1997, 45, 704.
Supercomputing Facility for Bioinformatics & Computational Biology IITD
10
ChemGene Distinguishes Genes (blue) from Non- Genes (red) in 331 Prokaryotic Genomes
A B C D E F
Three dimensional plots of the distributions of gene and non-gene direction vectors for six best (A to F) cases calculated from the genomes of (A) Agrobacterium tumefaciens (NC_003304), (B) Wolinella Succinogenes (NC_005090), (C) Rhodopseudomonas palustris (NC_005296), (D) Bordetella bronchiseptica (NC_002927), (E) Clostridium Acetobutylicium(NC_003030), (F) Bordetella Pertusis (NC_002929)
Gene vectors point to the north and the non-gene vectors to the south with >0.85 probability
Supercomputing Facility for Bioinformatics & Computational Biology IITD
Gene evaluation data for prokaryotic genomes for experimentally verified gene (non-overlapping) and non-genes
S.No. NCBI_ID Species Name Genes TP# FP # SS# SP# CC#
FGENESPhttp://www.softberry.com/berry.phtml Hidden Markov Model 0.42 0.59
Supercomputing Facility for Bioinformatics & Computational Biology IITD
12
• An ab-initio physico-chemical model is proposed to analyze DNA sequences
•Analyses of 331 bacterial genomes and 21 eukaryotic genomes present a proof of concept.
• Gene and Non-gene regions separate out.
• Consequences of Frame-shift mutations are correctly predicted.
• The Sensitivities achieved are ~ 95%.
• Future work to address spatial and temporal profiles of gene expression at a molecular level and its control using ChemGene. (Which gene is expressed in which cell and when?)
•ChemGene [Journal of Chemical Information & Modelling, in press, (2005)] is web-enabled for wider usage at http://www.scfbio-iitd.res.in/ChemGene
ChemGene1.0 Summary
Supercomputing Facility for Bioinformatics & Computational Biology IITD
…………….GLU ALA GLU MET LYS ALA SER GLU ASP LEU LYS LYS HIS GLY VAL THR VAL LEU THR ALA LEU GLY ALA ILE LEU LYS LYS LYS GLY HIS HIS GLU ALA GLU LEU LYS PRO LEU ALA GLN SER HIS ALA THR LYS HIS LYS ILE PRO ILE LYS TYR LEU GLU PHE ILE SER GLU ALA ILE ILE HIS LEU HIS…………………...
Bhageerath 1.0Protein Structure Prediction
The Protein Folding ProblemPredicting the tertiary (3D) structure of a protein from the amino acid sequence and
understanding the principles and pathway of folding
Supercomputing Facility for Bioinformatics & Computational Biology IITD
13
• Active site directed drug- design
• Mapping the functions of proteins in metabolic pathways.
Supercomputing Facility for Bioinformatics & Computational Biology IITD
Understanding protein misfolding
WHY FOLD PROTEINS ?
Supercomputing Facility for Bioinformatics & Computational Biology IITD
14
Mad cow diseaseCaused due to protein misfolding of ‘prion’ protein
WHY FOLD PROTEINS?
Alzheimer’s diseaseCaused due to accumulation of beta-amyloid protein in
brain cells.
Supercomputing Facility for Bioinformatics & Computational Biology IITD
CataractCaused due to aggregation of lens proteins
WHY FOLD PROTEINS?
Gamma-crystallinThe protein has two similar globular domains of ‘Greek key’ motif
Supercomputing Facility for Bioinformatics & Computational Biology IITD
15
• Protein design:Nanobiomachines: ‘Self programmed’ machines working as
biosensors and carriers to aid in drug delivery processes. eg. ATPase in mitochondria
Nanofibres: Fibers coated with extracellular matrix proteins are used as protein scaffold, reconstruction of damaged tissues
Quantum dots: Small devices which can be used as biological probes for diagnostics.
• Biocatalyst design: “Catalysts of future” that will help in functions like: Making Designer Enzymes for any reaction that is thermodynamically feasible (involves inverse protein folding viz. what is the sequence to be used for obtaining an enzyme with the desired shape and function), Storing and releasing oxygen when required by the body, Controlling blood sugar level etc..
WHY FOLD PROTEINS?
Supercomputing Facility for Bioinformatics & Computational Biology IITD
• Sugar Industry: Invertase for the conversion of sucrose into glucose and fructose.
WHY FOLD PROTEINS?
• Chocolate Industry: During cocoa beans processing, enzymes activated by fermentation process gives the characteristic chocolate flavor.
• Pulp & Paper Industry: Esterase is used to break ‘stickies’ into smaller components for improving paper quality.
• Textile & Leather Industry: Proteases are used in dehairing & lipases are used for degreasing, cellulase in giving smoother, glossier brighter fabrics.
Supercomputing Facility for Bioinformatics & Computational Biology IITD
16
RAMACHANDRAN ANGLES
Prof G.N. Ramachandran
1922-2001
A resolution to the protein folding problem entails a specification of all the Ramachandran angles along the polypeptide main chain (backbone).
Supercomputing Facility for Bioinformatics & Computational Biology IITD
Experimental Techniques• X-Ray diffraction• Nuclear Magnetic Resonance (NMR)• Electron diffraction, Neutron diffraction, Electron
microscopy, Fluorescence transfer
Drawbacks of Experimental Methods• Expensive• Time consuming• Don’t work well for receptors
Supercomputing Facility for Bioinformatics & Computational Biology IITD
17
Comparative Modeling Approaches
Homology
Similar sequences adopt similar fold is the basis.Alignment is performed with related sequences. (SWISS-MODEL-www.expasy.org, 3DJIGSAW-www.bmm.icnet.uk etc).
Threading
Sequence is aligned with all the available folds and scores are assigned for each alignment according to a scoring function. (Threader - bioinf.cs.ucl.ac.uk)
The above methods are fairly reliable and fast but data base dependent. Given that only (~) 8000 unique protein structures are available in structural databases (PDB) this could become a limitation, particularly with sequences with low similarity scores.
Supercomputing Facility for Bioinformatics & Computational Biology IITD
Strategy A• Generate all possible conformations and find the most stable one.
• For a protein comprising 200 AA assuming 2 degrees of freedom per AA
• 2200 Structures => 2200 Minutes to optimize and find free energy.
2200 Minutes = 3 x 1054 Years!!
Strategy B• Start with a straight chain and solve F = ma to capture the most stable state
• A 200 AA protein evolves
~ 10-11 sec / day / processor
• 10-3 sec (Time it takes for a protein in vivo) => 108 days /protein / processor (to fold in silico) ~ 106 years
With 106 processors ~ 1 Year /protein
Ab initio Protein Folding Methods
Computational requirements of ab initio methods are insurmountable. A smart combination of Bioinformatics tools and ab initio methods is required
Supercomputing Facility for Bioinformatics & Computational Biology IITD
18
PROTEIN FOLDING LANDSCAPE
Finding the global minimum on a rugged multidimensional surface is a complex unsolved problem
Supercomputing Facility for Bioinformatics & Computational Biology IITD
AMINO ACID SEQUENCE
MONTE CARLO OPTIMIZATIONS AND MINIMIZATIONS OF RESULTANT STRUCTURES (~103 to 105)
TRIAL STRUCTURES (~106 to 109)
EXTENDED STRUCTURE WITH PREFORMED SECONDARY STRUCTURAL ELEMENTS
SCREENING THROUGH BIOPHYSICAL FILTERS1. Persistence Length2. Radius of Gyration3. Hydrophobicity4. Packing Fraction
NATIVE-LIKE STRUCTURES
ENERGY RANKING AND SELECTION OF 100 LOWEST ENERGY STRUCTURES
METROPOLIS MONTE CARLO SIMULATIONS
Bioinformatics Tools
From Sequence to Structure: The IITD Pathway
Narang P, Bhushan K, Bose S and Jayaram B ‘A computational pathway for bracketing native-like structures for small alpha helical globular proteins.’ Phys. Chem. Chem. Phys. 2005, 7, 2364-2375.
Supercomputing Facility for Bioinformatics & Computational Biology IITD
Supercomputing Facility for Bioinformatics & Computational Biology IITD
Trial Structure Generation
Supercomputing Facility for Bioinformatics & Computational Biology IITD
20
Filter-Based Structure Selection
Rad
ius o
f Gyr
atio
n (in
Å)
N3/5 (N= number of amino acids)
y=0.395x + 7.257
r2 = 0.86
Freq
uenc
y
Hydrophobicity Ratio (ΦH)
(ΦH) = Loss in ASA per atom of non-polar side chains
Loss in ASA per atom of polar side chainsASA : Accessible surface area
Persistence Length Analysis of 1,000 Globular Proteins Radius of Gyration vs N3/5 of 1,000 Globular Proteins
Frequency vs Hydrophobicity Ratio of 1,000 Globular Proteins
Freq
uenc
y
Packing Fraction
Frequency vs Packing Fraction of 1,000 Globular Proteins
N3/5 plot incorporates excluded volume effects (Flory P. J., Principles of Polymer Chemistry, Cornell University, New York, 1953) .
Globular proteins are known to exhibit packing fractions around 0.7
Freq
uenc
y
Persistence Length (Å)
Supercomputing Facility for Bioinformatics & Computational Biology IITD
Monte Carlo Optimization of Selected Structures
Selected structures are optimized using distance based Monte Carlo Method to remove atomic overlaps (steric clashes).
Supercomputing Facility for Bioinformatics & Computational Biology IITD
21
∑ ++= hpbvdwel EEEE
ij
jiel rrD
qqE
)(332
=
( ) ⎥⎦
⎤⎢⎣
⎡++⎟
⎠⎞
⎜⎝⎛ −
−= −ααα eDDDrD i 222
)( 2
⎥⎥⎦
⎤
⎢⎢⎣
⎡−= 6
61212
ij
ij
ij
ij
vdw rC
rCE
∗∗∗ += jiij RRR
( ) 2/1jiij εεε =
( )1212
∗= ijijij RC ε
( )66 2 ∗= ijijij RC ε
( )⎪⎩
⎪⎨
⎧ +≥×=
otherwise
RRrV
Vf
E HjHiijw
exclij
hpb
,0
;,
( ) ( ) ( )22332223
232
412 HjHiij
HjHiij
HjHiijexcl RR
rRR
rRRr
V +−+++
−=
Electrostatics van der Waals Hydrophobic
An Empirical Scoring Function for Ranking Trial Structures
Arora N and Jayaram B, J. Phys. Chem., 1998, 102, 6139-6144.Arora N and Jayaram B, J. Comp. Chem., 1997, 18, 1245-1252.
The above Scoring function captures native as the lowest energy structure from among 61,640 decoys belonging to 67 different proteins and diverse decoy sets. The all-atom energy based scoring function is used to select 100 lowest energy structures.
Supercomputing Facility for Bioinformatics & Computational Biology IITD
Metropolis Monte Carlo Simulations
Metropolis Monte Carlo Simulations
The selected structures are optimized using Metropolis Monte Carlo Simulations
Supercomputing Facility for Bioinformatics & Computational Biology IITD
Narang P, Bhushan K, Bose S and Jayaram B ‘A computational pathway for bracketing native-like structures for small alpha helical globular proteins.’ Phys. Chem. Chem. Phys. 2005, 7, 2364-2375.
Structures with native-like topology are bracketed within the 100 lowest energy structures.
Supercomputing Facility for Bioinformatics & Computational Biology IITD
23
Predicted Structures for 12 Small Helical Proteins
1VII 1DV0 1GVD 1MBH
1GAB 1IDY 1PRV 1HDD
1BDC 1HP8 1BW6 2EZH
Predicted structure
Native structure
Supercomputing Facility for Bioinformatics & Computational Biology IITD
*Numbers in parenthesis represent the length (number of amino acids) of the protein model.#Structure with lowest RMSD bracketed in the 100 lowest energy structures.
The above two proteins have maximum sequence similarity of 38% and 48% respectively.
In cases where related proteins are not present in structural databases, Bhageerath achieves comparable accuracies.
Supercomputing Facility for Bioinformatics & Computational Biology IITD
24
Conclusions and Future Perspectives
•Structures with native-like topology are bracketed within the 100 lowest energy structures. “Needle in a haystack problem” is thus reduced to finding best 100 energy structures at least for small proteins. The suite of programs christened “Bhageerath” is made accessible at www.scfbio-iitd.res.in/bhageerath for wider usage.
•Further improvements to the methodology such as topological equivalence have been introduced to reduce the number of candidate structures for the native.
•It is envisioned that explicit solvent molecular dynamics simulations on the selected candidate structures can aid in optimizing side chain orientations, promoting favorable packing interactions bringing the RMSD to less than 3Å.
Supercomputing Facility for Bioinformatics & Computational Biology IITD
Active Site Directed Lead DesignSanjeevini1.0
Structure based drug design is like designing a key to open or jam a dynamic lock. The shape of the lock as well as its key hole are known.
Active Site
Supercomputing Facility for Bioinformatics & Computational Biology IITD
25
Nearly 6 million die each year due to these diseases.• Estimated cost $ 12 billion to fight the disease of poverty.• AIDS medication about $15K per annum.• An estimated $750 million is needed worldwide to stop TB.• To date, Global Fund has committed $ 3 billion for medical intervention against these diseases
in 128 countries.• Diarrhoea, Small pox, Polio, River blindness, Leprosy are the other major third world country diseases.
A new economic analysisInfections are not only the product of poverty; they also create poverty. Relieving a population of burdenof the diseases for 15 to 20 years will give a huge boost to economic development.
Millions for Viagra, Pennies for the Diseases of the PoorOf all new medications brought to the market (1223) by Multinationals from 1975 only 1% (13) are for tropical diseases plaguing the third world.
Life style drugs dominate Pharma R&D(1) Toe nail Fungus (2) Obesity (3) Baldness (4) Face Wrinkle(5) Erectile Dysfunction (6) Separation anxiety of dogs etc.
WHO Calls for Global Push Against AIDS & Tuberculosis & Malaria
Supercomputing Facility for Bioinformatics & Computational Biology IITD
High End Computing Needs for In Silico Drug Design
Estimates of current computational requirements to complete a binding affinity calculation for a given drug
Supercomputing Facility for Bioinformatics & Computational Biology IITD
28
De novo Lead Design : The IIT Delhi Pathway Library of Templates
Mutate/Optimize
Hydrogen bond energy
Trial structures of candidate ligands
Drug-like filters
Geometry Optimization & Derivation of quantum mechanical charges
Assignment of force field parameters
Molecular Dynamics &post-facto free energy component analysis
Binding Free Energy Estimates
Lead-like compound
Ligand substitution in the active site of the receptor Monte Carlo Docking
Drug target identification
3-Dimensional structure of the target
Latha, N., Jain, T., Sharma, P. and Jayaram, B ‘A free energy based computational pathway from chemical templates to lead compounds: a case study of COX-2 inhibitors.’. J. Biomol. Struct. Dyn. 21, 791-804, 2004.
Supercomputing Facility for Bioinformatics & Computational Biology IITD
Main Modules in Sanjeevini
1. Template library
2. Molecule generator
3. Molecular descriptors / drug-like filters
4. Molecular docking
5. Structural analysis of the receptor-candidate complex
6. Energy analysis of the receptor-candidate complex
7. Binding affinity analysis
Jayaram, B., Latha, N.,Jain, T., Sharma, P., Gandhimathi, A., Pandey, V.S., ‘Sanjeevini: A Comprehensive Active-Site Directed Lead Design Software.’ Indian Journal of Chemistry-A. 2005 (In Press)
Supercomputing Facility for Bioinformatics & Computational Biology IITD
29
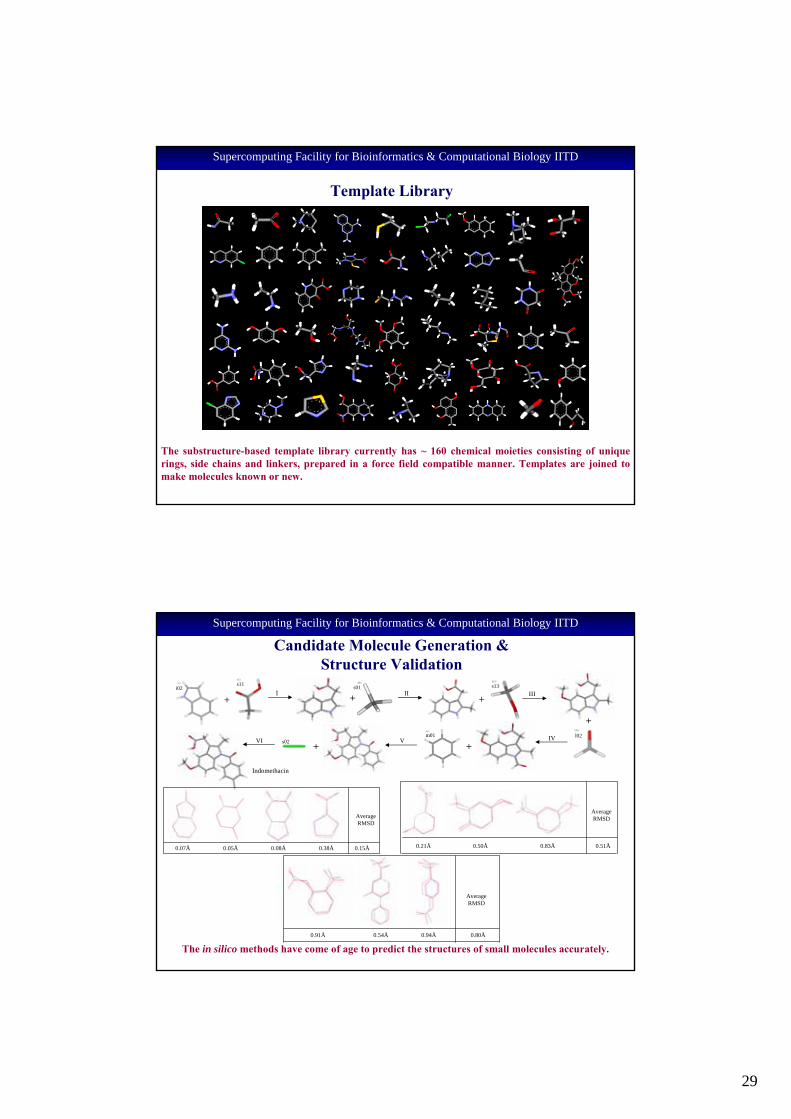
Template Library
The substructure-based template library currently has ~ 160 chemical moieties consisting of unique rings, side chains and linkers, prepared in a force field compatible manner. Templates are joined to make molecules known or new.
Supercomputing Facility for Bioinformatics & Computational Biology IITD
The in silico methods have come of age to predict the structures of small molecules accurately.
Supercomputing Facility for Bioinformatics & Computational Biology IITD
30
Molecular Descriptors / Drug-like Filters
Lipinski’s rule of five
Molecular weight ≤ 500
Number of Hydrogen bond acceptors < 10
Number of Hydrogen bond donors < 5
logP ≤ 5
Molar Refractivity ≤ 140
Number of Rotatable bonds < 10
Additional filters
Introduction of drug-like filters in the early stages of in silico drug design eliminates improbable candidates and improves the chances of success in lead design.
Supercomputing Facility for Bioinformatics & Computational Biology IITD
Accurate quantum mechanical calculations (charges) are necessary for generating reliable estimates of the binding energetics of protein – drug candidate.
Supercomputing Facility for Bioinformatics & Computational Biology IITD
31
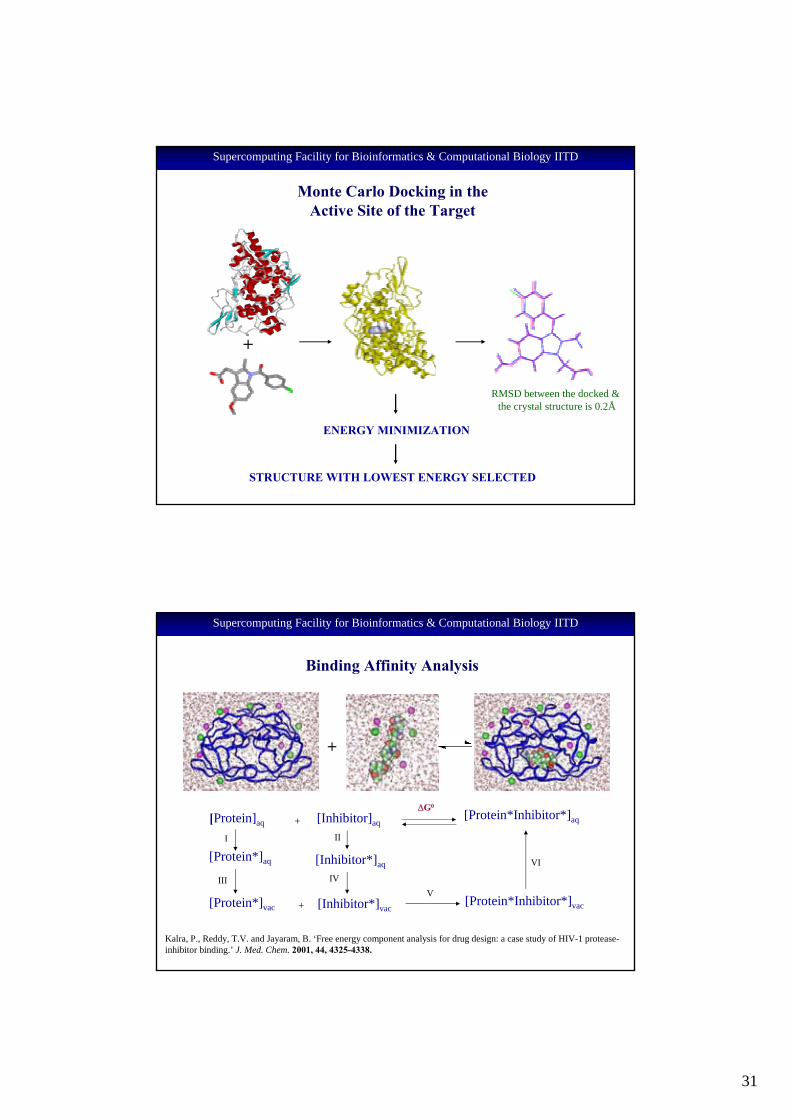
ENERGY MINIMIZATION
STRUCTURE WITH LOWEST ENERGY SELECTED
Monte Carlo Docking in the Active Site of the Target
+
RMSD between the docked & the crystal structure is 0.2Å
Supercomputing Facility for Bioinformatics & Computational Biology IITD
Binding Affinity Analysis
+
[Protein]aq + [Inhibitor]aq[Protein*Inhibitor*]aq
[Protein*]aq
[Protein*]vac + [Inhibitor*]vac
[Inhibitor*]aq
[Protein*Inhibitor*]vac
I II
III IVV
VI
∆G0
Kalra, P., Reddy, T.V. and Jayaram, B. ‘Free energy component analysis for drug design: a case study of HIV-1 protease-inhibitor binding.’ J. Med. Chem. 2001, 44, 4325-4338.
Supercomputing Facility for Bioinformatics & Computational Biology IITD
Supercomputing Facility for Bioinformatics & Computational Biology IITD
33
Sanjeevini distinguishes Drugs (NSAIDS, blue) from Non-Drugs (red) for COX-2
-50
-40
-30
-20
-10
0
10
20
30
Bin
ding
Fre
e E
nerg
y (k
cal/m
ol)
Supercomputing Facility for Bioinformatics & Computational Biology IITD
Molecular Dynamics Simulations
CONFIGURATIONAL AVERAGING ENHANCES THE QUALITY OF BINDING AFFINITY ESTIMATES
Energy components After minimization(kcal/mol)
Molecular dynamics (2 nanoseconds)
(kcal/mol)
van der Waals - 21.3 -20.8
Net electrostatics -13.3 -8.6
Cavitation -3.4 -3.6
Entropy 22.5 23.9
Adaptation 0 3.7
Net binding free energy* -15.5 - 5.4
Experimental binding free energy
-5.9
net Bfe
adap
ent
cav
net elec
vdw-25
-20
-15
-10
-5
0
5
10
15
20
25
30
Ene
rgy
( kca
l/mol
e)
EXPMD
MIN
*The computed absolute binding free energies with current state of the art methodologycarry an uncertainty of the order of + 2 kcal/mol.
Supercomputing Facility for Bioinformatics & Computational Biology IITD
34
exp bfevdw
ele
cav
ent
ion effects
adp
net bfe
-100
-80
-60
-40
-20
0
20
40
60
Ener
gy (
kcal
/mol
e)
Free Energy Component Analysis of Binding of Two Inhibitors to HIV-1 Protease Target
4hvp 8hvpKalra, P., Reddy, T.V. and Jayaram, B. ‘Free energy component analysis for drug design: a case study of HIV-1 protease-inhibitor binding.’ J. Med. Chem. 2001, 44, 4325-4338.
Supercomputing Facility for Bioinformatics & Computational Biology IITD
C. Hydrogen bond donors and acceptors 0m0.016s 0m0.002s
D. log P 0m0.014s 0m0.001s
E. Molar refractivity 0m0.014s 0m0.001s
F. Rotatable bonds 0m0.012s 0m0.005s
4. Molecular docking (@ Nine processors) 21m15.338s 17m40.997s
5. Structural analysis of the receptor-candidate complex 0m0.779s 0m0.450s
A. Clash identification 0m0.573s 0m0.434s
B. RMSD calculation 0m0.070s 0m0.006s
C. Charge alignment identification 0m0.068s 0m0.005s
D. Donor / acceptor alignment identification 0m0.068s 0m0.005s
6. Energy analysis of the receptor-candidate complex 0m7.621s 0m3.775s
7. Binding affinity analysis 4m90.254s
*The time factors are given in minutes (m) and seconds (s). CPU times for all the modules are for single processor, except for Molecular docking (Module 4) which is implemented in parallelmode over nine processors. GAMESS14 and AMBER13 for quantum mechanical and molecular mechanics calculations respectively have been implemented. CPU time for AM1 geometry
optimization is 2m7.000s, for HF/6-31G*/RESP calculations is 74m2.000s for energy minimization is 16m13.507s and for a 2 nanosecond molecular dynamics simulation on COX-2 aspirincomplex containing 22,442 atoms, with explicit solvent took 210 days..
CPU Times for Various Modules in Sanjeevini
Supercomputing Facility for Bioinformatics & Computational Biology IITD
35
DNA-Drug Interaction
Shaikh, S.A., Ahmed, S.R. and Jayaram, B. ‘A molecular thermodynamic view of DNA-drug interaction: A case study of 25 minor groove binders.’ Arch. Biochem. Biophys. 429, 81, 2004.
Based on detailed thermodynamic, dynamic and structural studies on a series of DNA-minor groove binder complexes, design principles are being incorporated in Sanjeevini for DNA-directed lead design
Rise
2
2.5
3
3.5
4
4.5vibent ci adapt
vdW
eleccavity
rtent
BFE-80-60-40-20
02040
kcal
/mol
Energy Minimization Molecular Dynamics Experimental Value
Convergence Plot
-150
-100
-50
0
50
100
0 50 100 150 200 250 300 350
Time(ps)
Bin
ding
free
ene
rgy
(kca
l/mol
)
DNA-Drug Complex
DynamicsThermodynamicsStructural Studies
Supercomputing Facility for Bioinformatics & Computational Biology IITD
Sanjeevini1.0 sorts out drugs from non-drugs for enzyme and receptor targets.
Predicts relative affinities of drugs in conformity with experiment (COX-2, HIV-1 protease, Estrogen receptor).
Known specificity of COX inhibitors reproduced.
An efficient Scoring Function is developed for a rapid assay of candidates to any target
A small molecule database comprising over 3 million molecules prepared in force-field dependent manner is being developed for high throughput lead discovery
Work on other systems including diverse targets such as hormone receptors and nucleic acids is in progress
Several utilities of use in computer aided drug design are made freely accessible at www.scfbio-iitd.res.in/utility.
SUMMARY
Supercomputing Facility for Bioinformatics & Computational Biology IITD
36
1. Gene Prediction
Homology/string comparison. 300 Giga flop~ 3*109 bp
Time complexity of algorithm [order N] [100 flops per bp]
Molecular Dynamics100 structures 30 Peta flop1-ns simulation for structure refinementTotal Compute Time 5000nsNumber of atoms per simulation 25000
3. Active site directed drug design
Scan 1000 drug molecules/protein 18 Peta flop3ns simulation per drug molecule(Active site searches, docking, rate and affinity determinations etc.)Total Compute Time 3000ns25000 atoms per simulation
SummaryTotal Computational requirement to design one lead compound from genome
~ 50 Peta flop (5.x1016 floating point operations)To design ten lead compounds per day (on a dedicated machine)the requirement is 5.8 tera flops capacity.
(Out of every 100 lead compounds, only one may become a drug, which further increases the computer requirements)
Genome to drug discovery research A rough estimate of computational requirements
Supercomputing Facility for Bioinformatics & Computational Biology IITD
Supercomputer at SCFBio2003
A 70 processor machine (over 100 GFlops) with 4.5 terabytes of storage spaceSeveral utilities along with computational resources are freely accessible at www.scfbio-iitd.res.in
Supercomputing Facility for Bioinformatics & Computational Biology IITD
37
Vision: SCFBio IIT Delhi as one of the nodal centers with multi Teraflops capacity on a national biocomputing grid with both hardware and bioinformatics software(s) accessible freely, round the clock, to scientists, engineers and students.
SCFBio is currently connected on a VPN to
1) JNU Bioinformatics center
2) University of Delhi (south campus)
3) Madurai Kamaraj University
4) Indian Institute of Science
5) National Institute of Immunology6) Institute of Microbial Technology Chandigarh
7) DBT CGO Complex
8) University of Pune
9) IGIB Mall Road New Delhi
10) NBRC Gurgaon
11) CDFD Hyderabad
12) IIT Delhi
Supercomputing Facility for Bioinformatics & Computational Biology IITD
CELL
TISSUE
ORGAN
ORGANISM
Molecular Level Movie of an Entire Organism2025
Entire DNA Content in Cell of an Organism2000
Projections into the Future of Bioinformatics
Supercomputing Facility for Bioinformatics & Computational Biology IITD
38
Department of Biotechnology
Department of Science & Technology,
Council of Scientific & Industrial Research
Indo-French Centre for the Promotion of Advanced Research
HCLTechnologies
Dabur Research Foundation
Indian Institute of Technology Delhi
Acknowledgements
Supercomputing Facility for Bioinformatics & Computational Biology IITD
1. Dutta,S., Singhal,P., Agrawal,P., Tomer,R., Kritee, Khurana,E. and Jayaram.B. A Physico-Chemical Model for Analyzing DNA sequences, 2005, Journal of Chemical Information & Modelling, In Press
2. Narang,P, Bhushan,K., Bose,S. and Jayaram,B. A computational pathway for bracketing native-like structures for small alpha helical globular proteins. 2005, Phys. Chem. Chem. Phys., 7, 2364.
3. Jayaram, B.,Latha, N.,Jain, T.,Sharma, P.,Gandhimathi, A and Pandey, V.S.,Sanjeevini: A Comprehensive Active-Site Directed Lead Design Software. 2005 Indian Journal of Chemistry-A, In Press
4. Latha,N and Jayaram,B. A Binding Affinity Based Computational Pathway for Active-Site Directed Lead Molecule Design:Some Promises and Perspectives. 2005, Drug Design Reviews-Online, 2(2),145.
5. Shaikh, S.A., Ahmed, S.R. and Jayaram, B. A molecular thermodynamic view of DNA-drug interaction: A case study of 25 minor groove binders. 2004, Arch. Biochem. Biophys. 429, 81.
6. Latha, N., Jain, T., Sharma, P. and Jayaram, B. A free energy based computational pathway from chemical templates to lead compounds: a case study of COX-2 inhibitors. 2004 J. Biomol. Struct. Dyn. 21, 791.
7. Jayaram, B. and Jain, T. The role of water in protein-DNA recognition. 2004 Annu. Rev. Biophys. Biomol. Struct. 33, 343.
8. Narang P, Bhushan K, Bose S and Jayaram B, Protein structure evaluation using an all-atom energy based empirical scoring function, 2005, J. Biomol.Str.Dyn, Under Revision.
9. Jain, T and Jayaram, B. An all atom energy based computational protocol for predicting binding affinities of protein-ligand complexes. 2005, Manuscript Submitted
10. Shaikh S.A and B.Jayaram A Computational Tool for Predicting DNA-Drug Interaction Energy, 2005, Manuscript submitted.
Publications 2004 -2005
Supercomputing Facility for Bioinformatics & Computational Biology IITD
39
BioComputing Group, IIT Delhi
Pooja Narang Tarun Jain
Kumkum Bhushan Saher Afshan Shaikh
Surojit Bose Pankaj Sharma
Praveen Agrawal Vidhu S. Pandey
Poonam Singhal Samrat Dutta
A.Gandhimathi Gurvisha Sandhu
Shashank Shekhar Anuj Gupta
Mahima Shankar Dr. Sandhya Shenoy
Dr. N. Latha Prof. B. Jayaram (PI)
Supercomputing Facility for Bioinformatics & Computational Biology IITD