24
From GLM to HLM Working with Continuous Outcomes EPSY 5245 Michael C. Rodriguez
| Date post: | 28-Dec-2015 |
| Category: |
Documents |
| Upload: | margery-stafford |
| View: | 215 times |
| Download: | 0 times |
From GLM to HLMWorking with
Continuous Outcomes
EPSY 5245Michael C. Rodriguez
Continuous Variables
• Review statistical procedures for continuous variables
• Consider options on Variables Chart• Generalize options under the GLM approach
Statistical Paradigm
• Model Building • Estimation of Parameters• Testing Fit of the Model
Model Building
• Theory• Model Specification• Measurement• Data Collection
Estimation of Parameters
• Conceptualizing Relevant Factors• A General Approach to Data Analysis• GLM Model Assumptions

General Approach to Data Analysis
• Univariate & bivariate descriptive analyses• Specifying the model• Testing interaction terms• Removing insignificant terms• Examining outliers• Checking assumptions
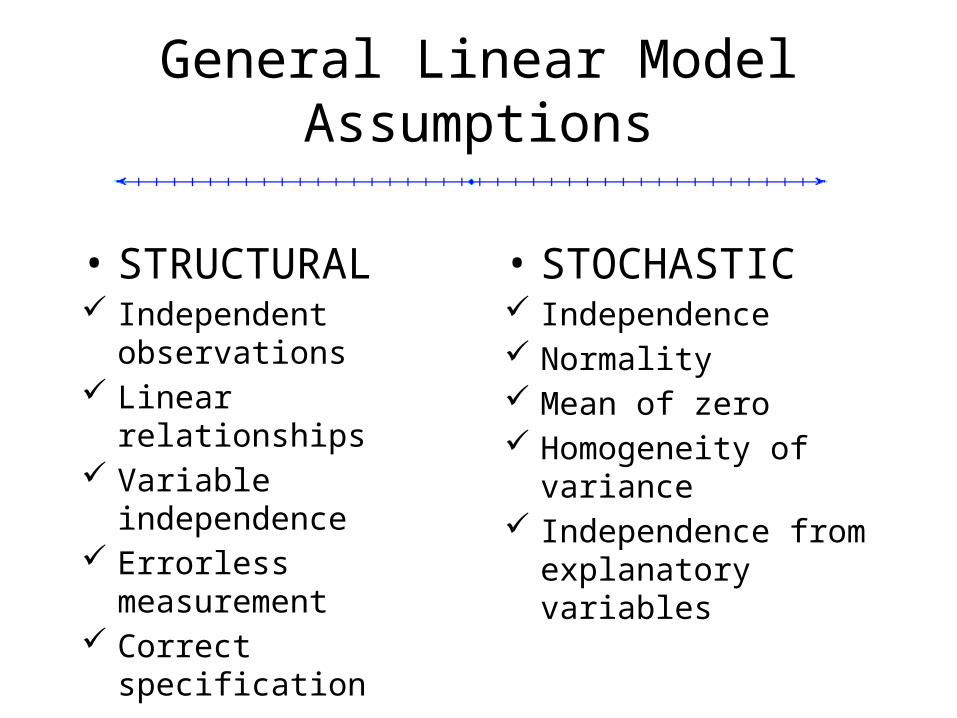
General Linear Model Assumptions
• STOCHASTIC Independence Normality Mean of zero Homogeneity of variance Independence from
explanatory variables
• STRUCTURAL Independent observations Linear relationships Variable independence Errorless measurement Correct specification
Testing Model-Data Fit
• Parsimony• Indicators
– Correlation– Simple Regression– Multiple Regression
• Controlling Type-I error
Common Problemsin the analysis of clustered (nested) data
• The “unit of analysis” problem – misestimated precision
• Testing hypotheses about effects occurring at each level and across levels
• Problems related to measurement of change or growth
Estimation of parameters requires some distributional assumptions. One requires the error term (the part of the outcome that is not explained by observed factors) to be independent and identically distributed.
This is in contrast with the idea that people exist within meaningful relationships in organizations.
Frank, K. (1998). Quantitative methods for studying social contexts. Review of Research in Education, 23, 171-216.
Estimation Requirements
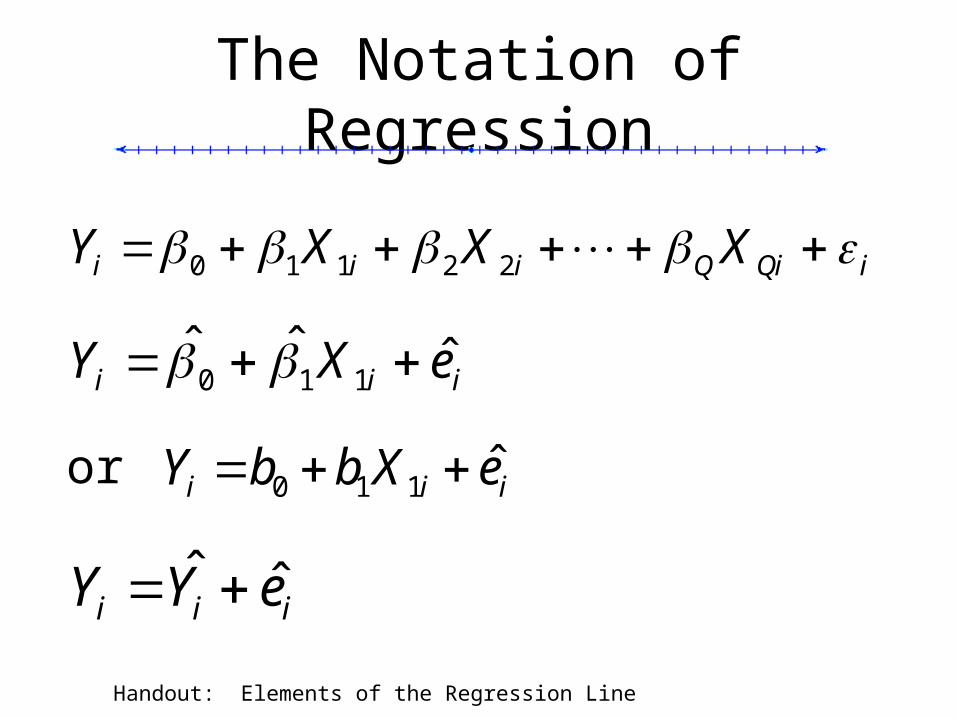
Handout: Elements of the Regression Line
The Notation of Regression
iQiQiii XXXY 22110
iii eXY ˆˆˆ110
iii eYY ˆˆ
iii eXbbY ˆ110 or
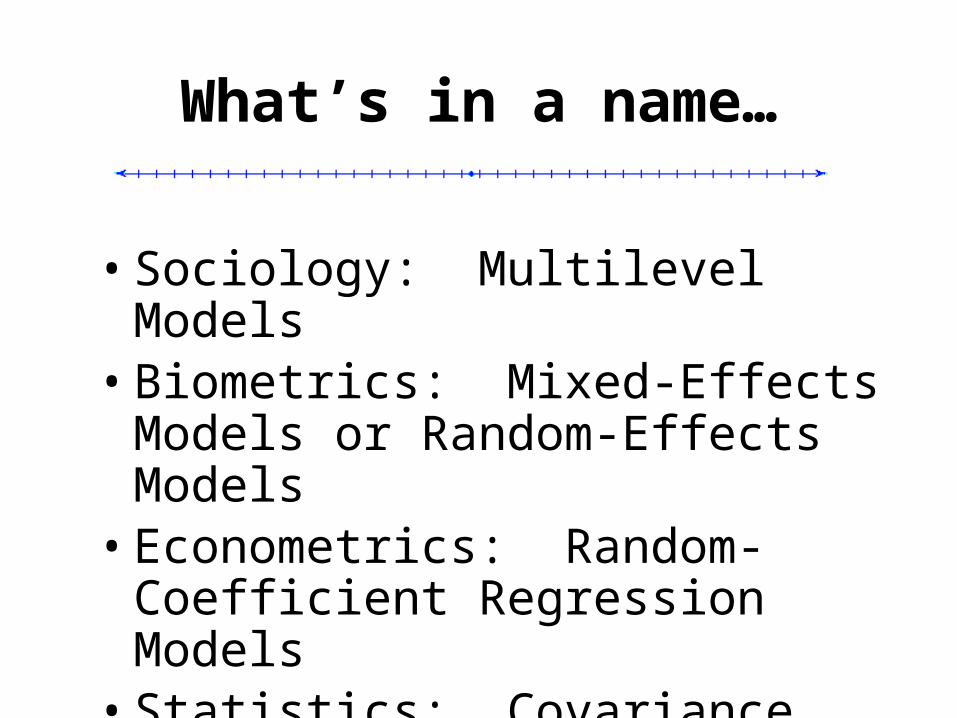
What’s in a name…
• Sociology: Multilevel Models• Biometrics: Mixed-Effects Models or
Random-Effects Models• Econometrics: Random-Coefficient
Regression Models• Statistics: Covariance Components
Models
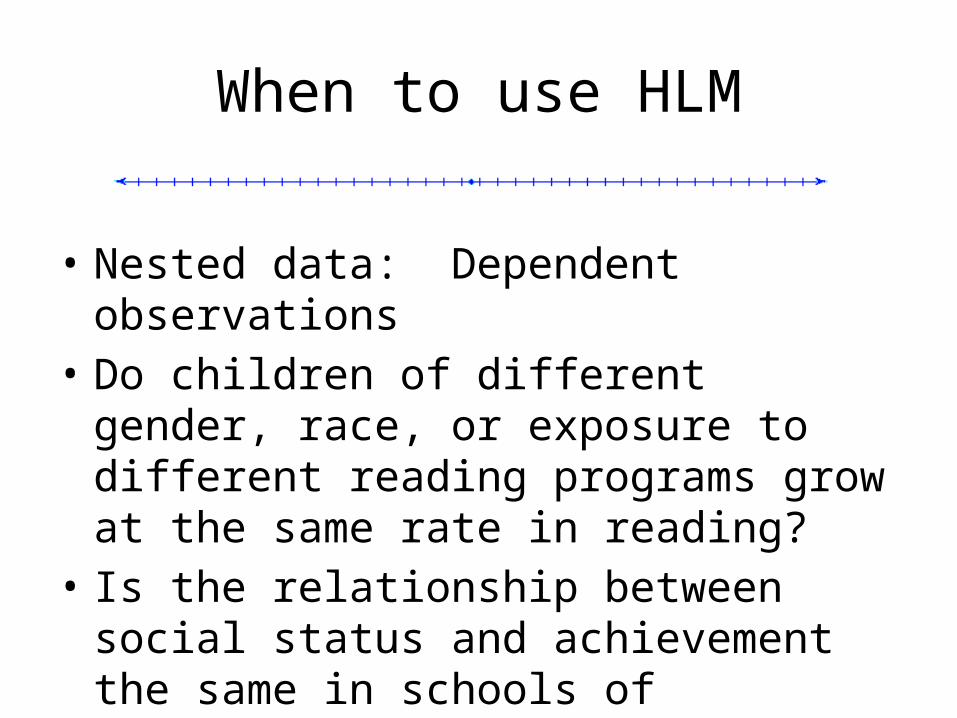
When to use HLM
• Nested data: Dependent observations• Do children of different gender, race, or
exposure to different reading programs grow at the same rate in reading?
• Is the relationship between social status and achievement the same in schools of different size or sector (public v. catholic)?
Building Models in HLM
• Level One– Within Units
• Level Two– Between Units
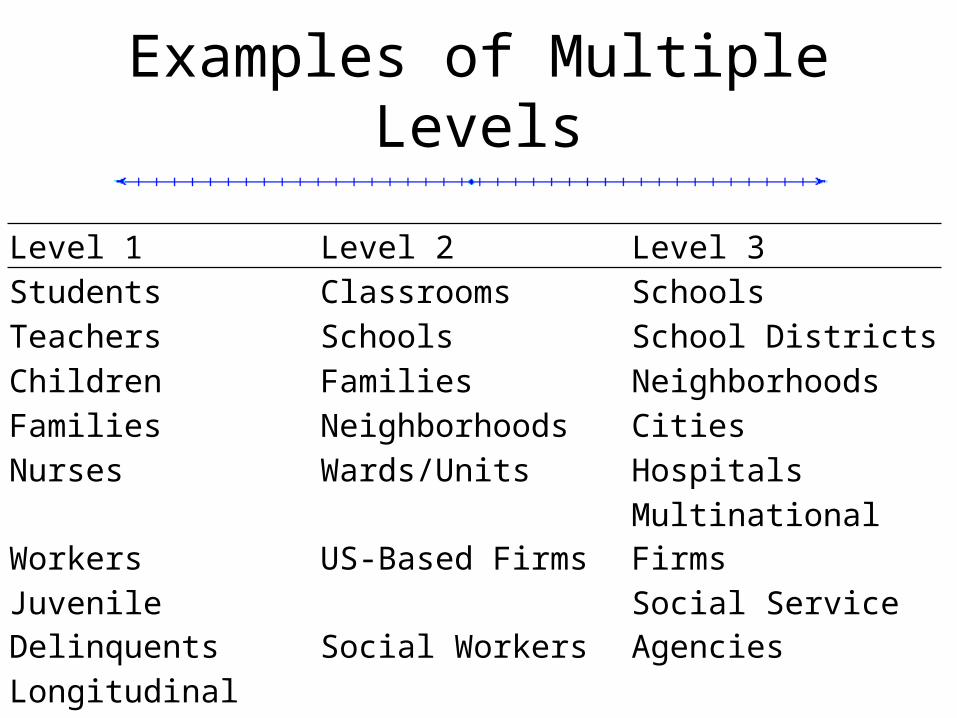
Examples of Multiple Levels
Level 1 Level 2 Level 3Students Classrooms SchoolsTeachers Schools School DistrictsChildren Families NeighborhoodsFamilies Neighborhoods CitiesNurses Wards/Units HospitalsWorkers US-Based Firms Multinational FirmsJuvenile Delinquents Social Workers Social Service AgenciesLongitudinal Scores Students Teachers
Advantages of HLM
• Adjusting for nonindependence of observations within subjects
• Larger framework for real-life problems• Unbalanced designs and missing data are
accommodated
Alternatives to HLM
• Individual level example• Group level example• Just use regression
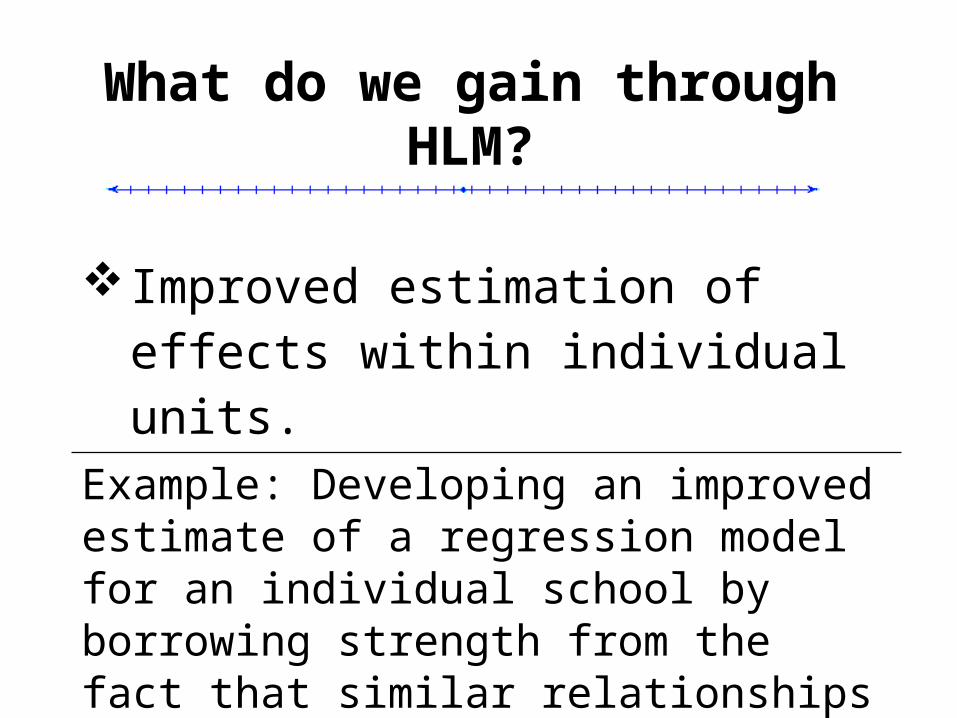
What do we gain through HLM?
Improved estimation of effects within individual units.
Example: Developing an improved estimate of a regression model for an individual school by borrowing strength from the fact that similar relationships exist for other schools.

What do we gain through HLM?
Formulation and testing of hypotheses about cross-level effects.
Example: How school size might be related to the magnitude of the relationship between social class and academic achievement within schools.
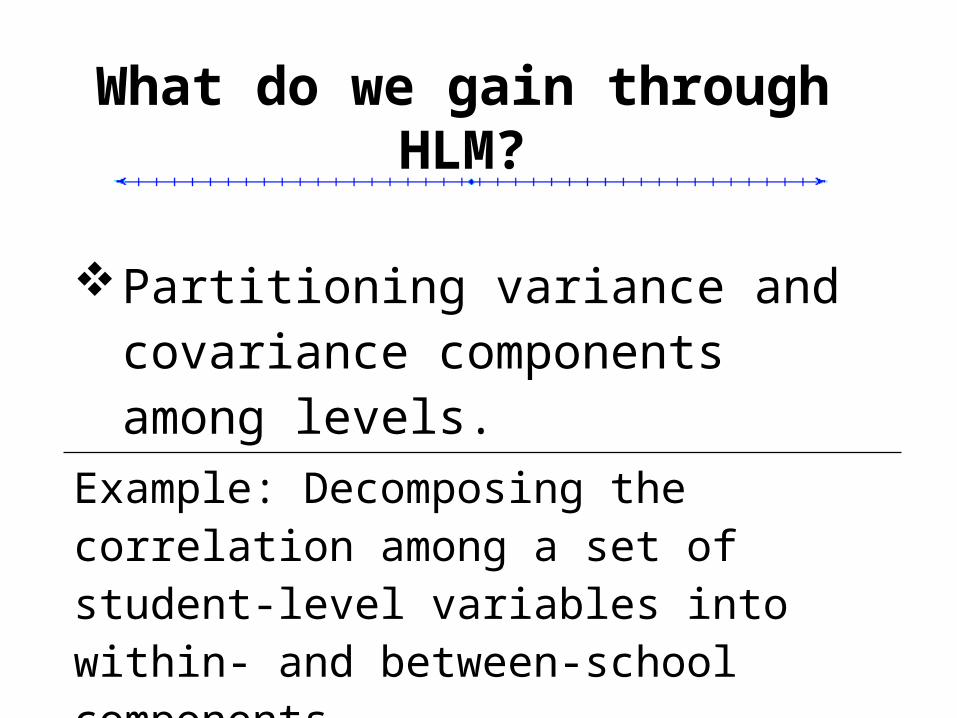
What do we gain through HLM?
Partitioning variance and covariance components among levels.
Example: Decomposing the correlation among a set of student-level variables into within- and between-school components. How much of the variance is within or between schools?
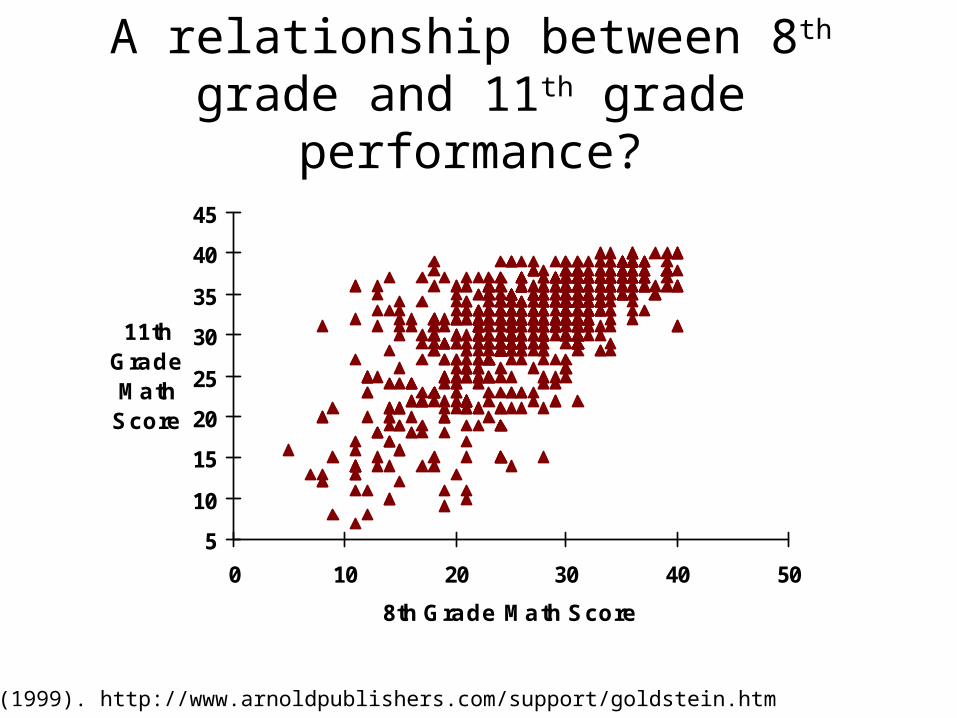
A relationship between 8th grade and 11th grade performance?
5
10
15
20
25
30
35
40
45
0 10 20 30 40 50
8th Grade Math Score
11thGrade Math Score
Goldstein (1999). http://www.arnoldpublishers.com/support/goldstein.htm
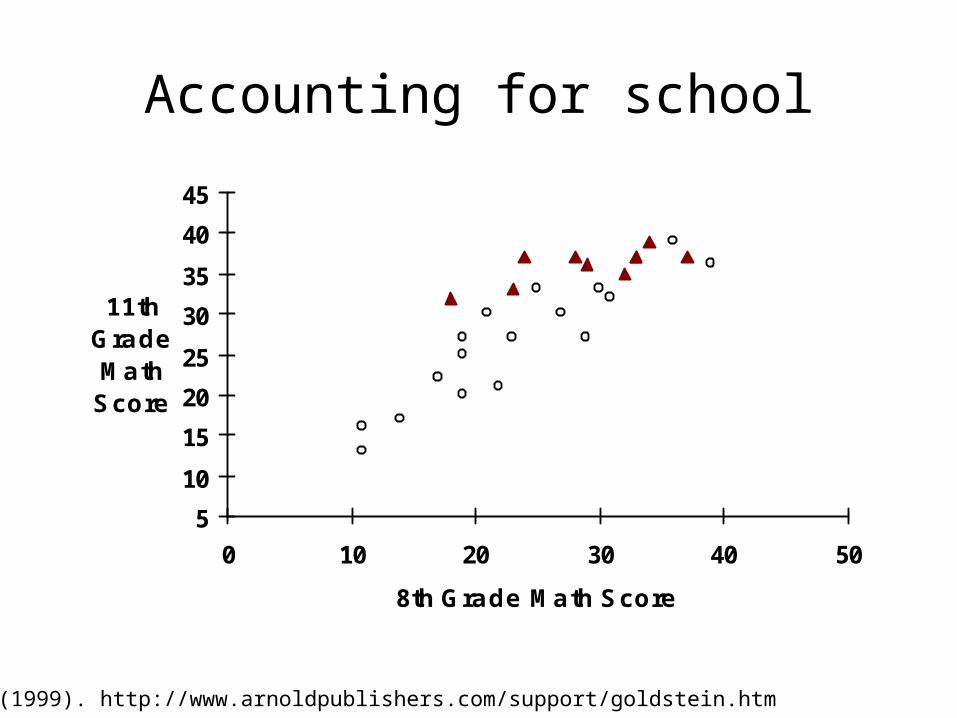
Accounting for school
5
10
15
20
25
30
35
40
45
0 10 20 30 40 50
8th Grade Math Score
11thGradeMathScore
Goldstein (1999). http://www.arnoldpublishers.com/support/goldstein.htm
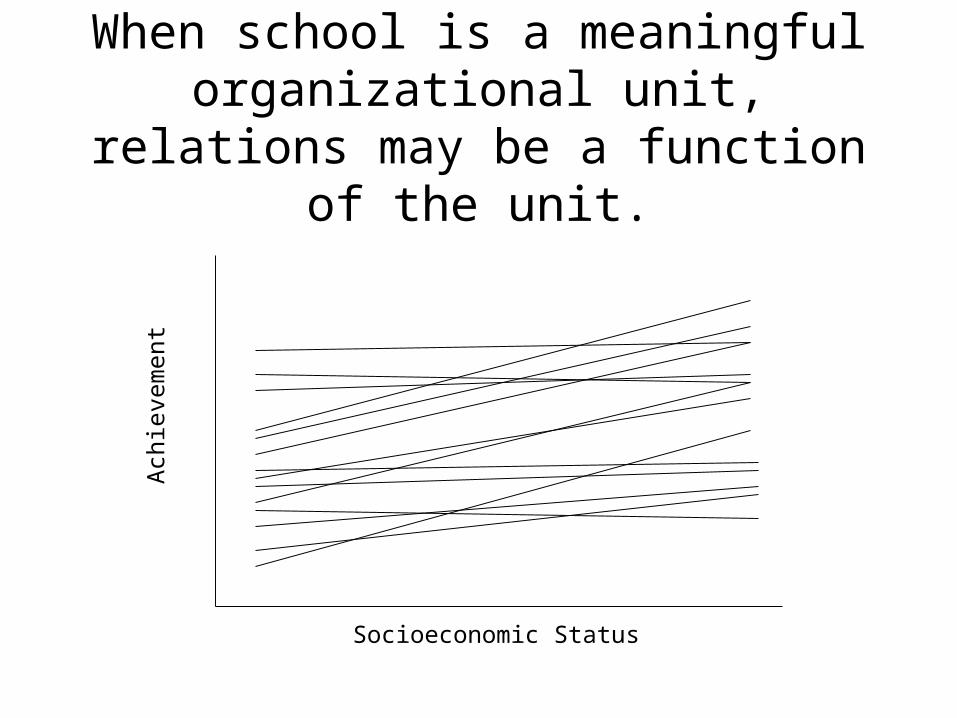
Socioeconomic Status
Ach
ieve
men
t
When school is a meaningful organizational unit, relations may be a
function of the unit.
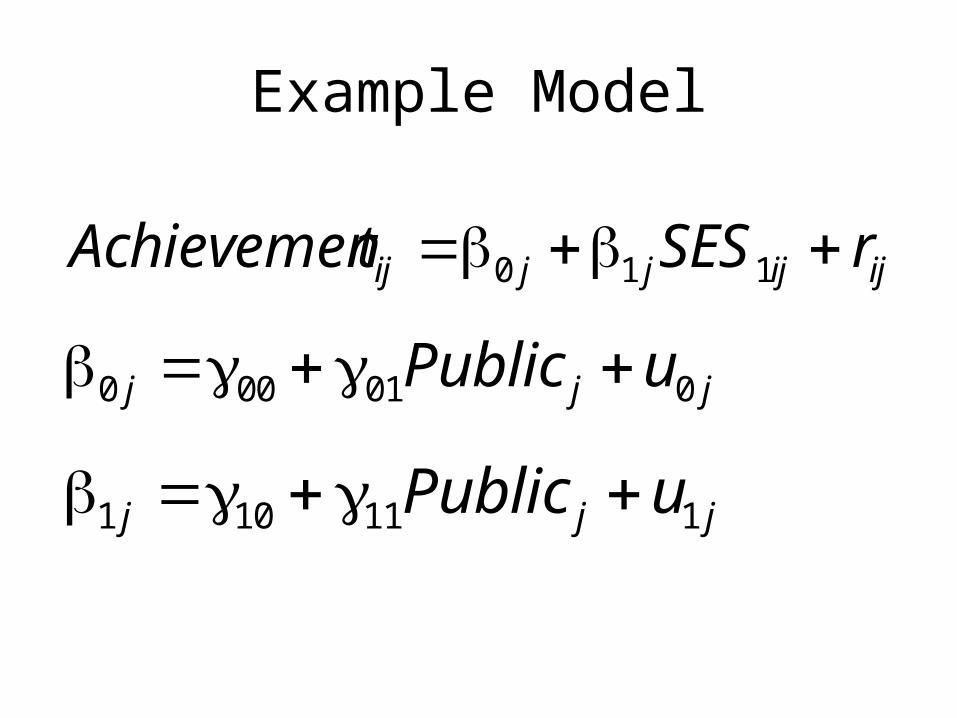
Example Model
jjj uPublic 001000
jjj uPublic 111101
ijijjjij rSEStAchievemen 110


