49
From Molecular Surfaces to Nanomaterials T. Pradeep [email protected] 1. Introduction to molecular surfaces 2. Materials through monolayers 3. New approaches for nanomaterials
From Molecular Surfaces to Nanomaterials
1. Introduction to molecular surfaces 2. Materials through monolayers3. New approaches for nanomaterials
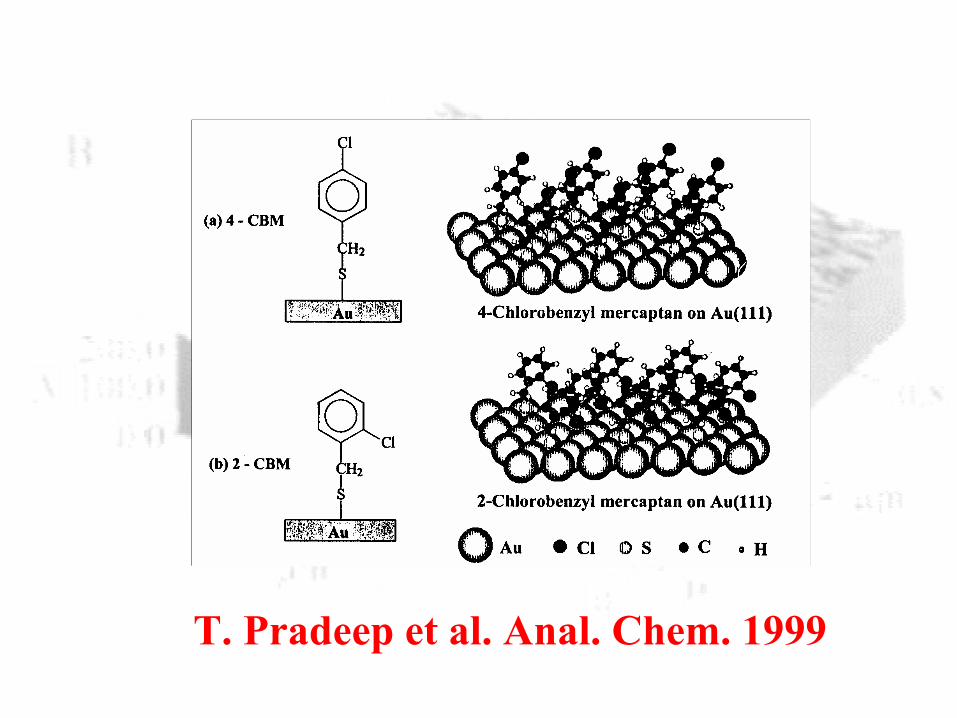
T. Pradeep et al. Anal. Chem. 1999
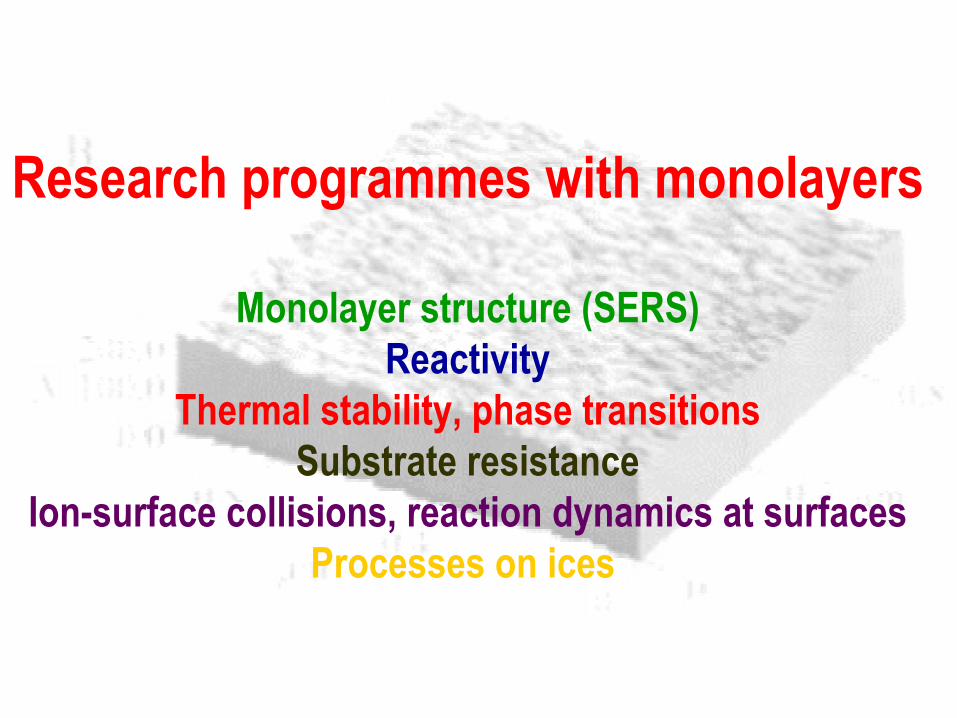
Research programmes with monolayers
Monolayer structure (SERS)Reactivity
Thermal stability, phase transitionsSubstrate resistance
Ion-surface collisions, reaction dynamics at surfacesProcesses on ices
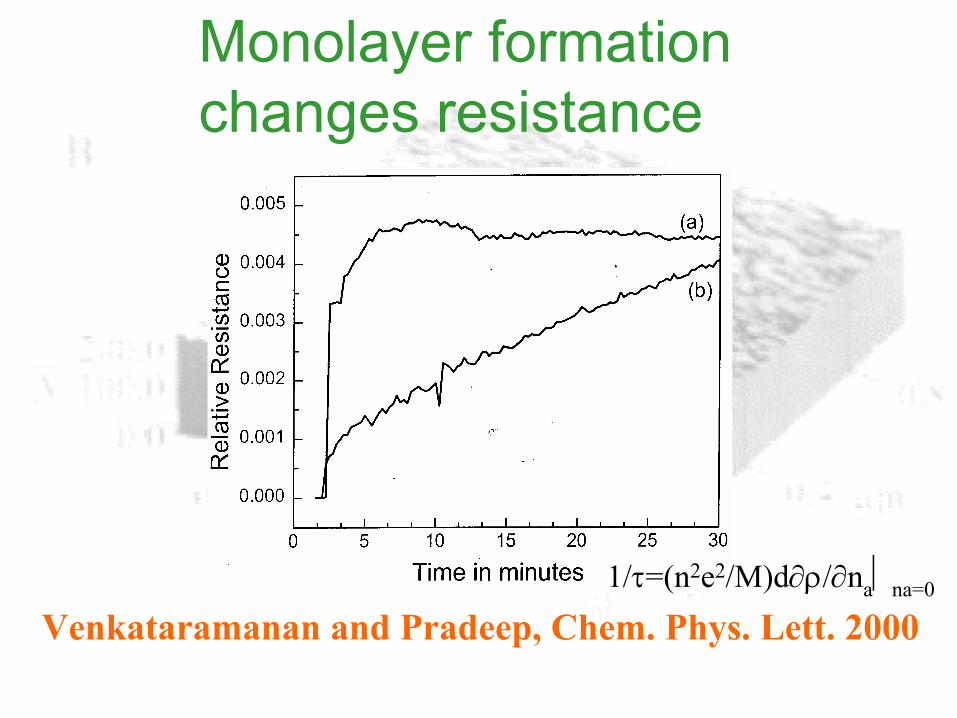
Monolayer formation changes resistance
Venkataramanan and Pradeep, Chem. Phys. Lett. 20001/τ=(n2e2/M)d∂ρ/∂nana=0
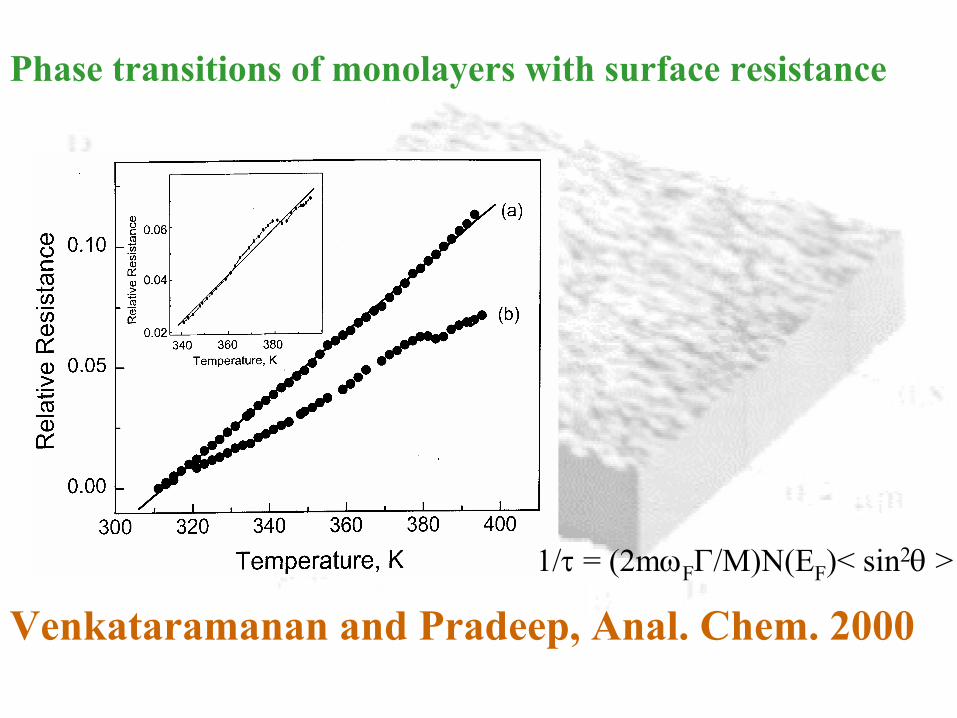
Venkataramanan and Pradeep, Anal. Chem. 2000
Phase transitions of monolayers with surface resistance
1/τ = (2mωFΓ/M)N(EF)< sin2θ >
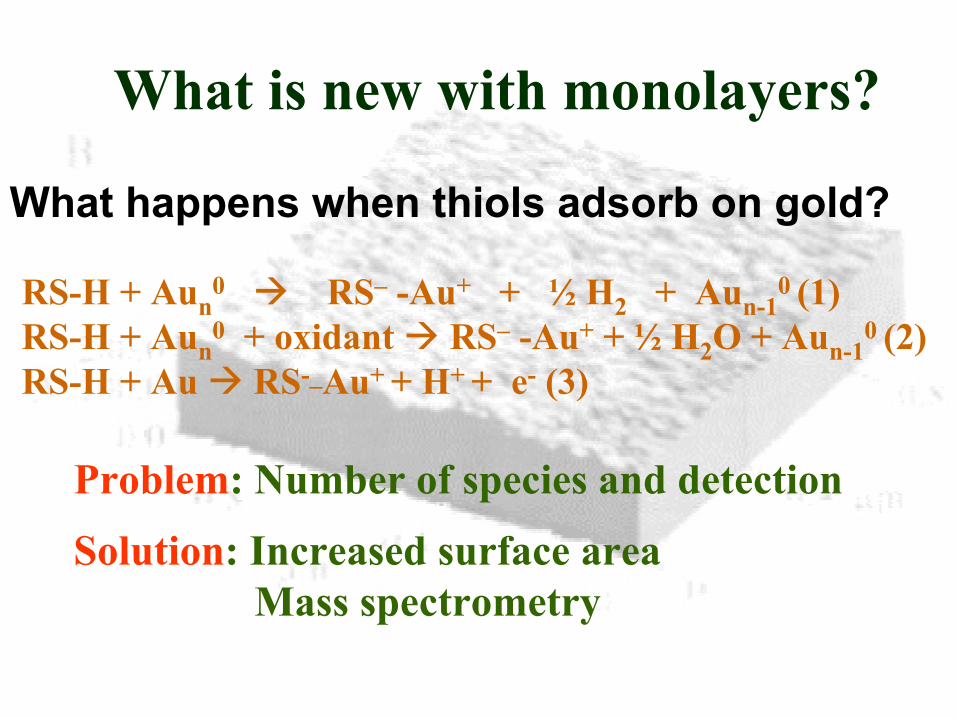
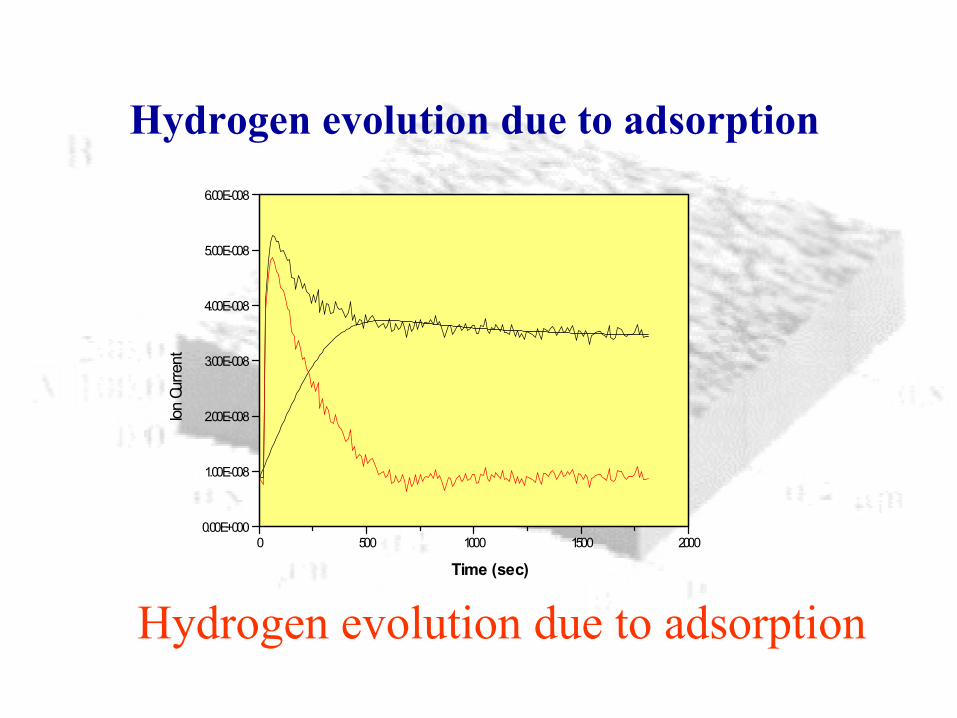
RS-H + Aun0 RS– -Au+ + ½ H2 + Aun-1
0 (1)RS-H + Aun
0 + oxidant RS– -Au+ + ½ H2O + Aun-10 (2)
RS-H + Au RS-_Au+ + H+ + e- (3)
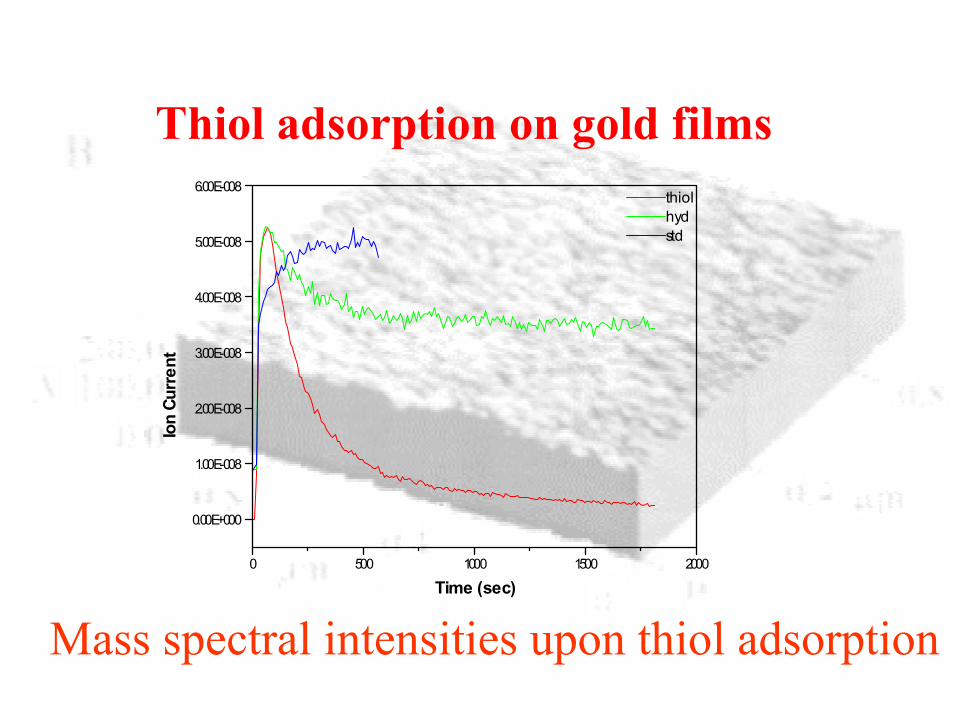
What happens when thiols adsorb on gold?
Solution: Increased surface areaMass spectrometry
Problem: Number of species and detection
What is new with monolayers?
1
NV MassSpec
DP
RP
2
RP
3
4
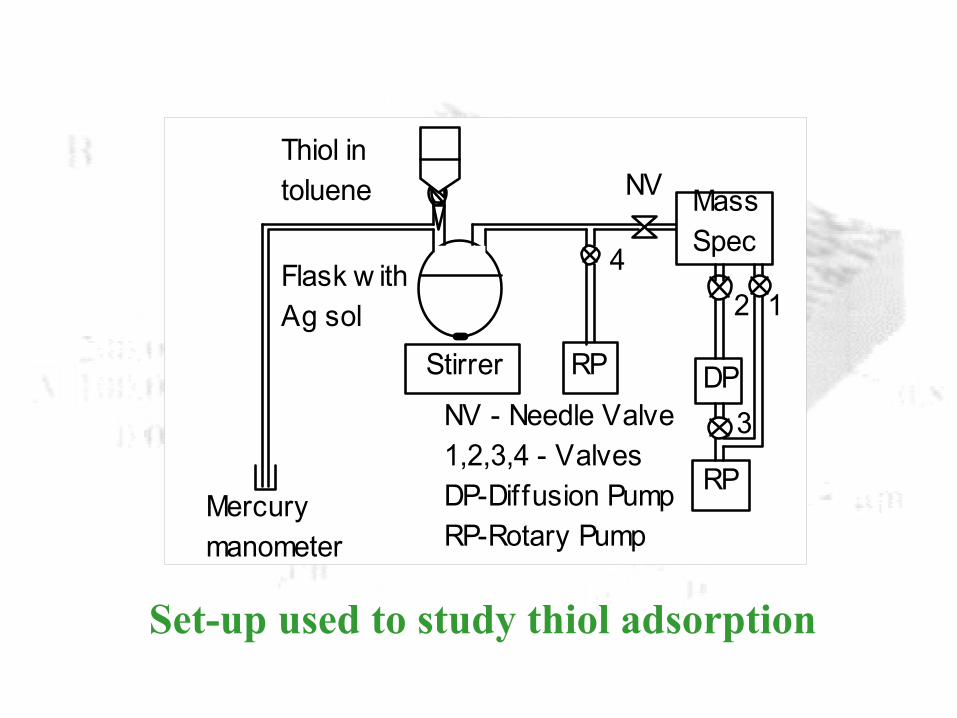
Mercurymanometer
Stirrer
Flask w ithAg sol
Thiol intoluene
NV - Needle Valve1,2,3,4 - ValvesDP-Diffusion PumpRP-Rotary Pump
Set-up used to study thiol adsorption
0 500 1000 1500 2000
0.00E+000
1.00E-008
2.00E-008
3.00E-008
4.00E-008
5.00E-008
6.00E-008Io
n Cu
rren
t
Time (sec)
thiolhydstd
Mass spectral intensities upon thiol adsorption
Thiol adsorption on gold films
0 500 1000 1500 20000.00E+000
1.00E-008
2.00E-008
3.00E-008
4.00E-008
5.00E-008
6.00E-008Ion
Cur
rent
Time (sec)
Hydrogen evolution due to adsorption
Hydrogen evolution due to adsorption
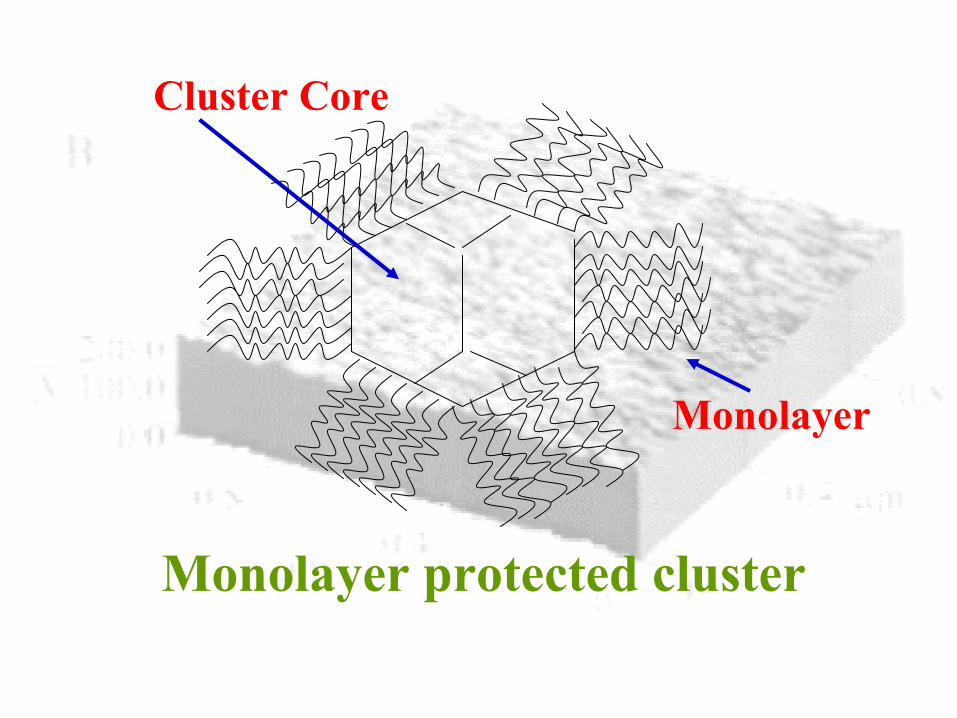
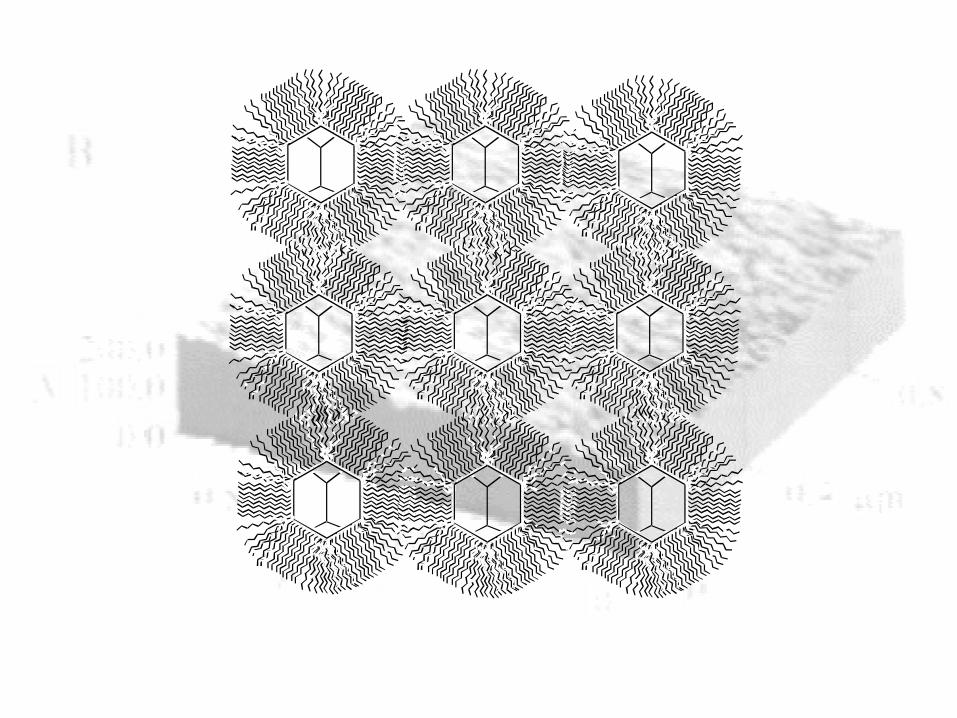
Cluster Core
Monolayer
Monolayer protected cluster
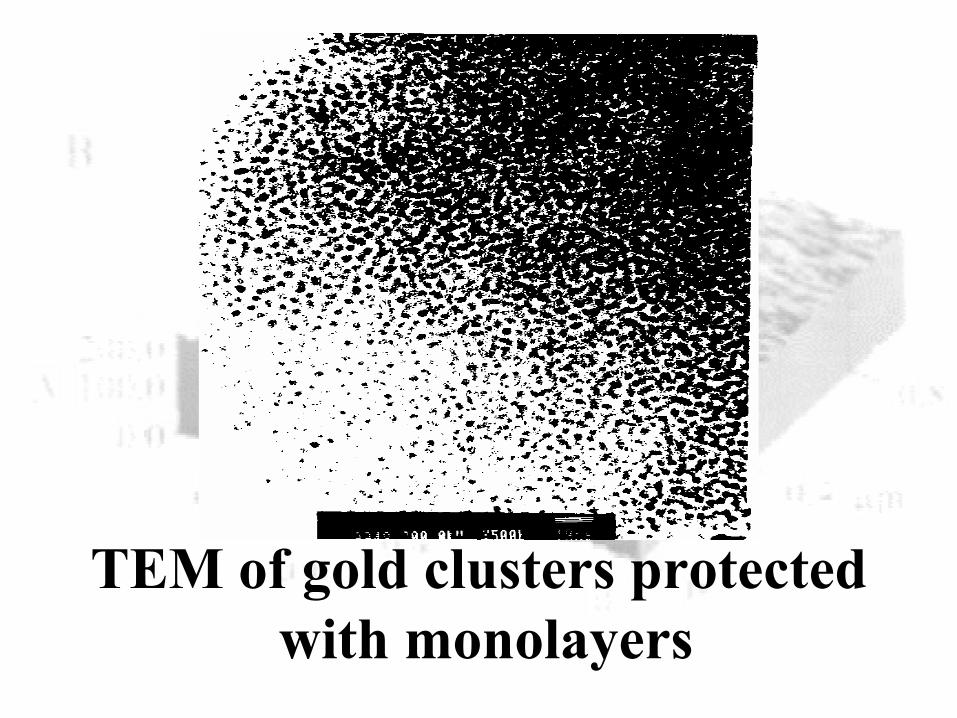
TEM of gold clusters protectedwith monolayers
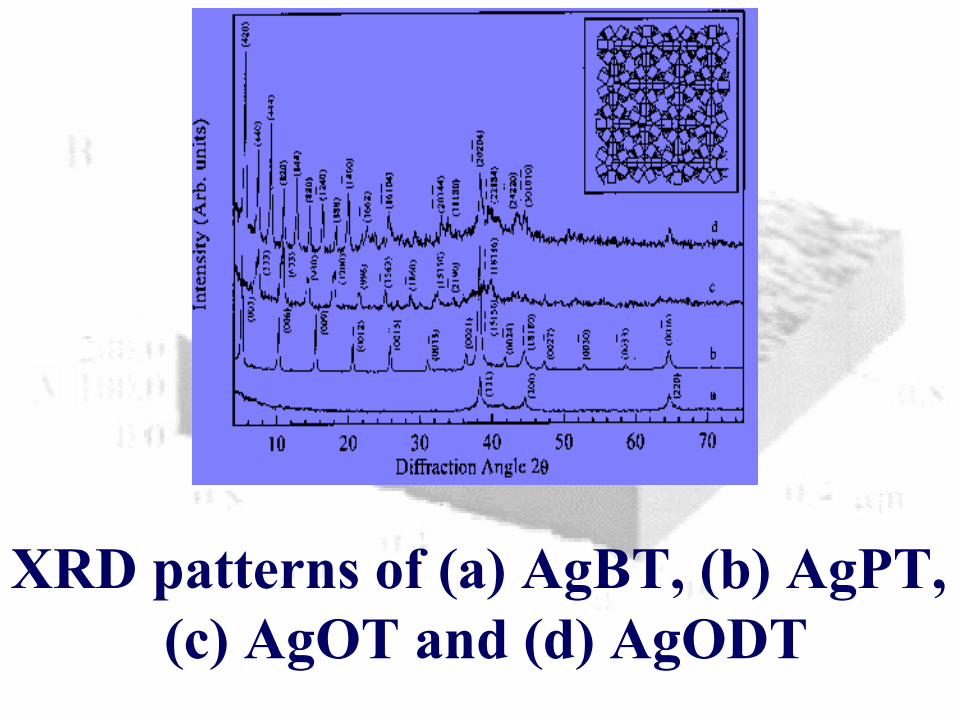
XRD patterns of (a) AgBT, (b) AgPT,(c) AgOT and (d) AgODT
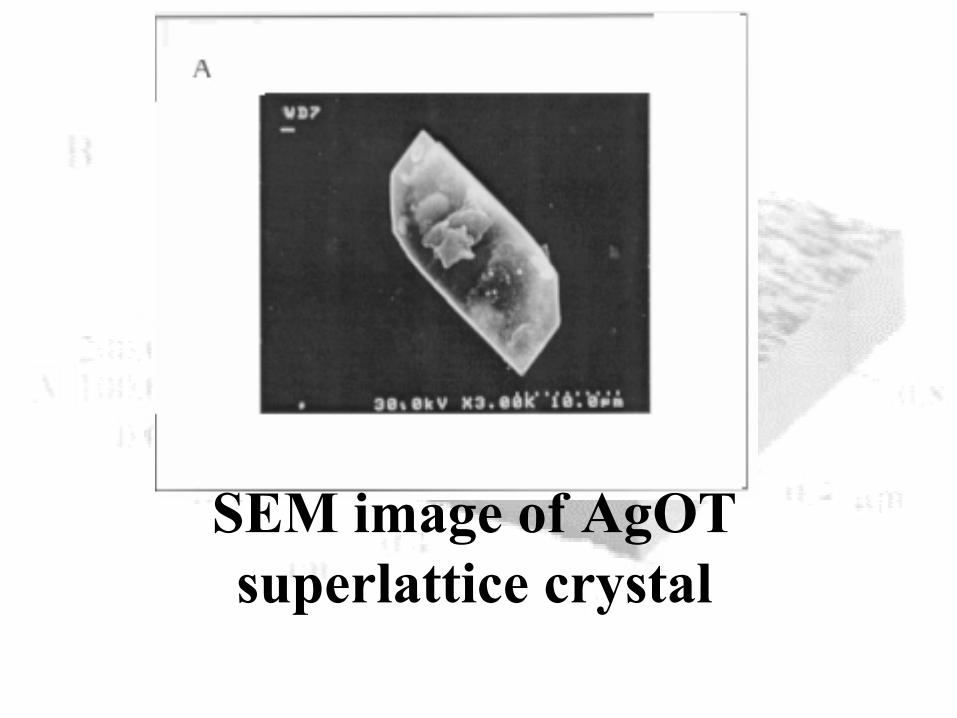
SEM image of AgOT superlattice crystal
(N. Sandhyarani et. al.).
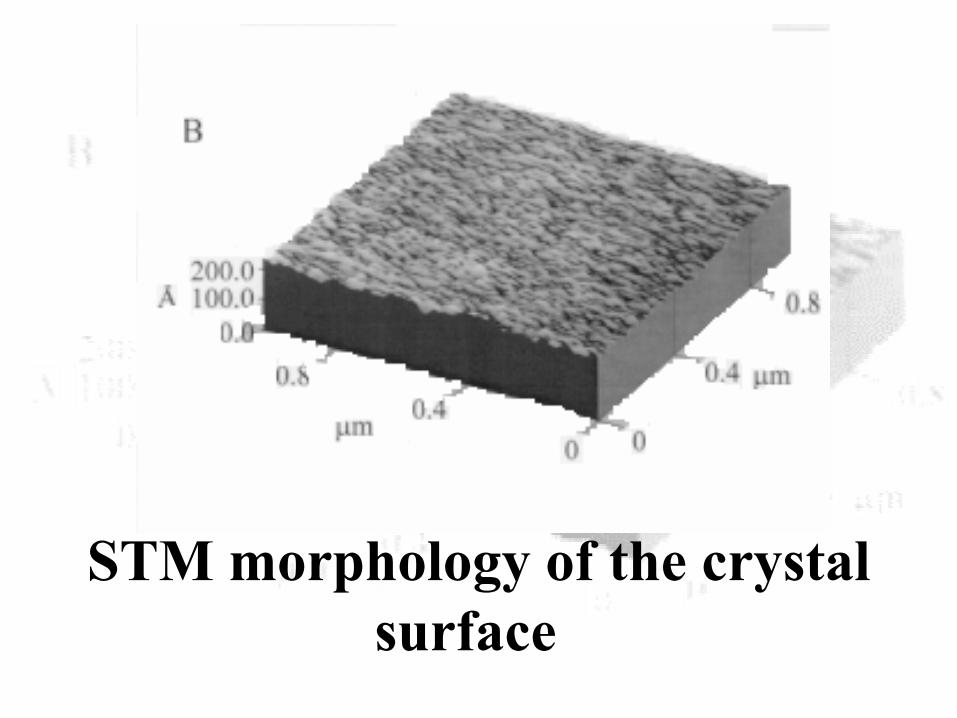
STM morphology of the crystal surface.).
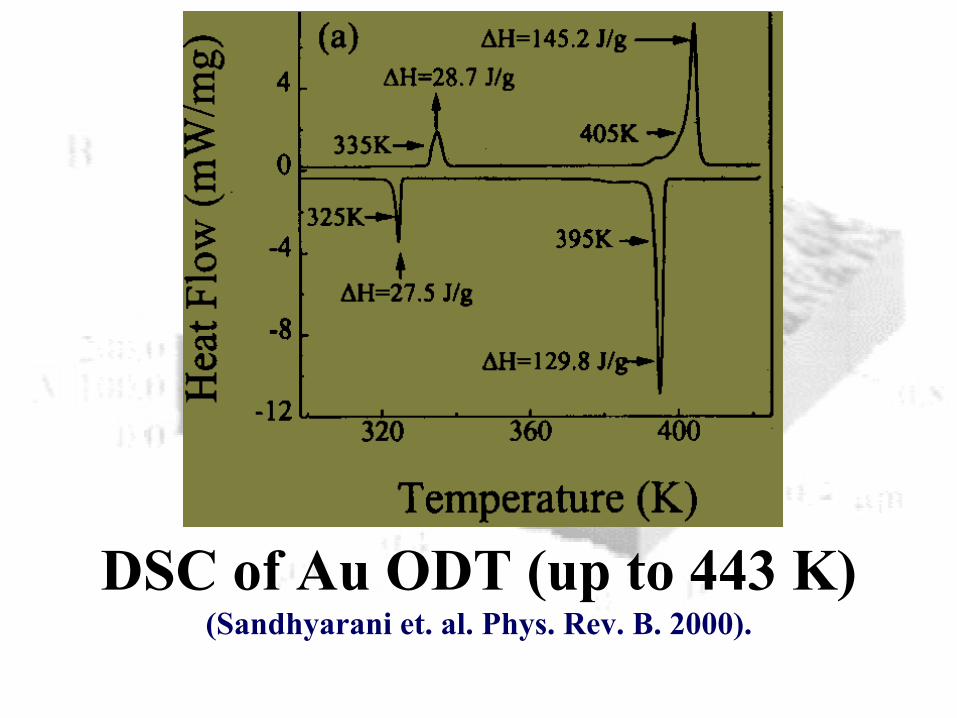
DSC of Au ODT (up to 443 K) (Sandhyarani et. al. Phys. Rev. B. 2000).
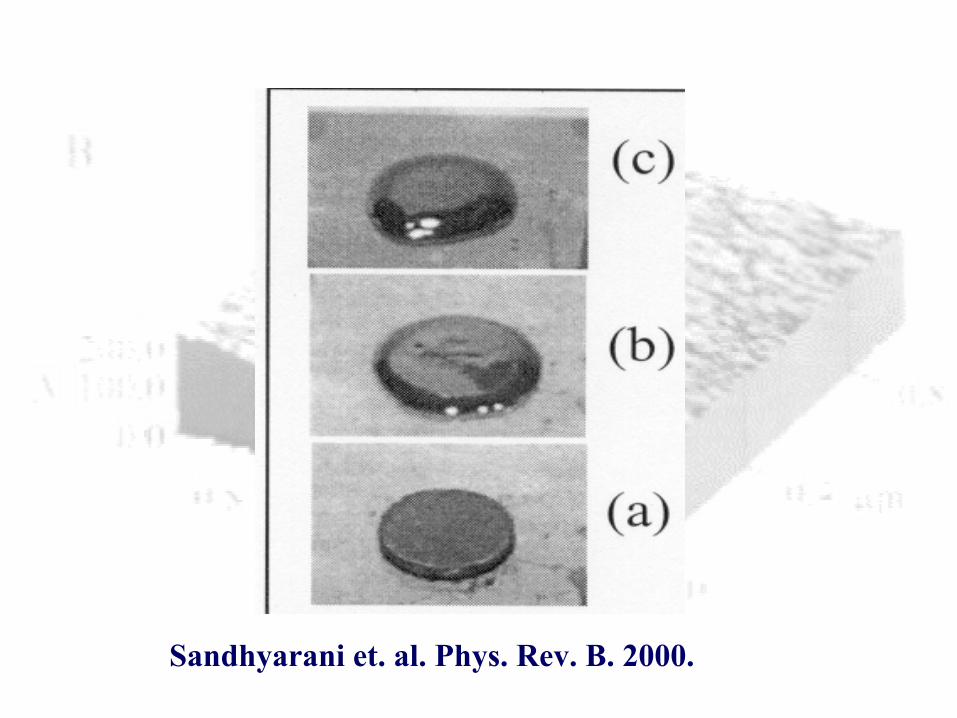
Sandhyarani et. al. Phys. Rev. B. 2000.
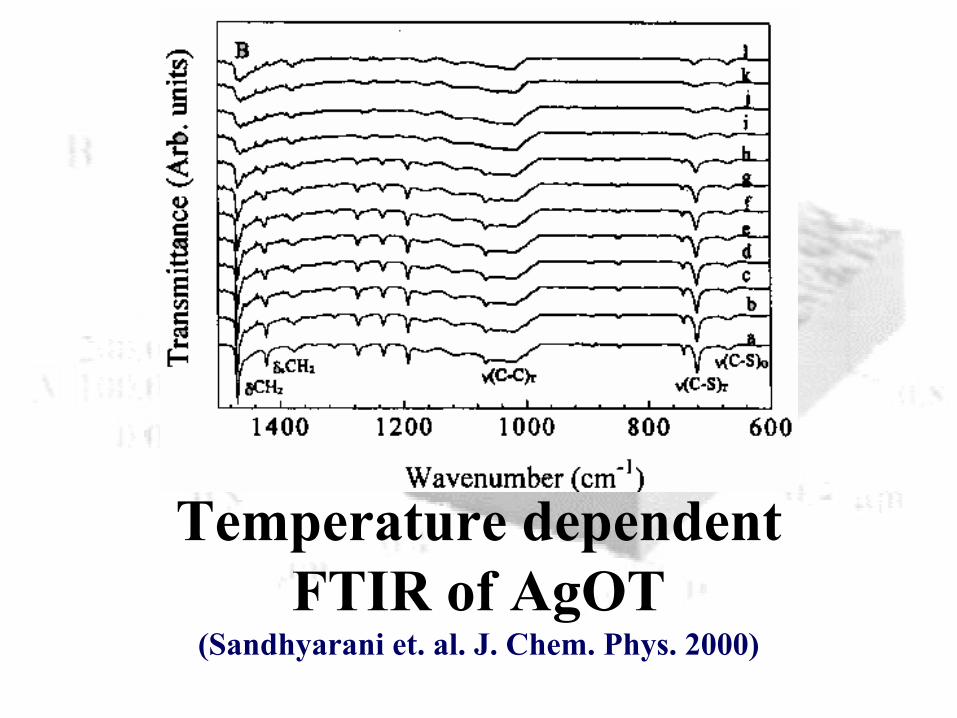
Temperature dependent FTIR of AgOT
(Sandhyarani et. al. J. Chem. Phys. 2000)
C1
H
H
(b)
SS
(a)
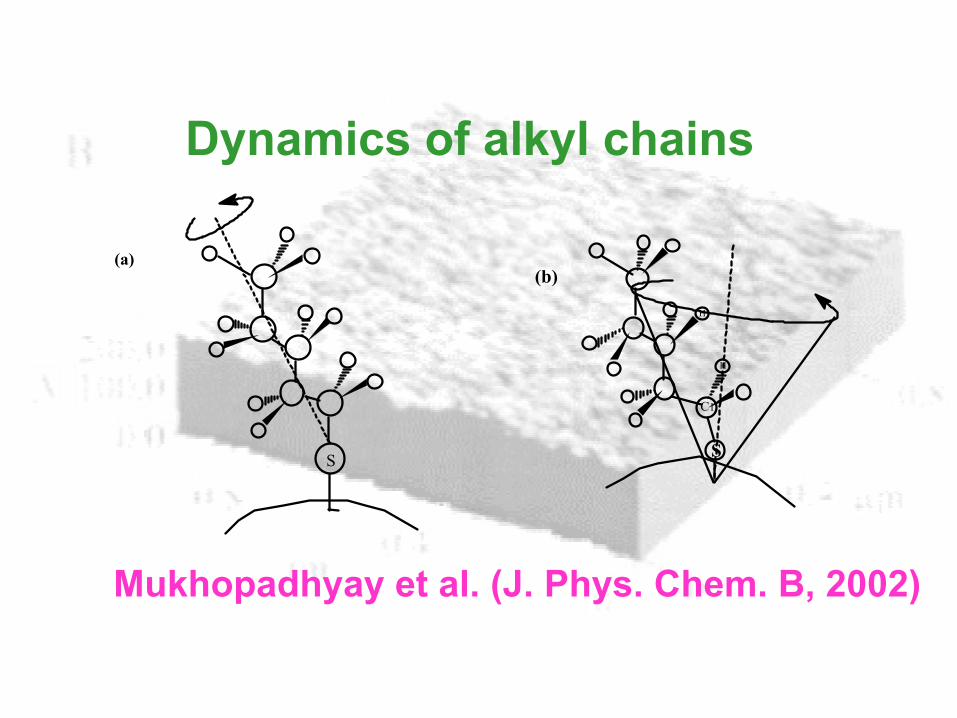
Dynamics of alkyl chains
Mukhopadhyay et al. (J. Phys. Chem. B, 2002)
-1.0 -0.5 0.0 0.5 1.00
50
100
150
Q=0.8 Å-1
Energy Transfer (meV)
0
40
80
120
Q=1.08 Å-1
0
30
60
Q=1.58 Å-1
T=360 K
Q=1.8 Å-1
0
20
40
60
(b)
-1.0 -0.5 0.0 0.5 1.00
50
100 T=300 K
S(Q
, ω) (
arb.
uni
ts)
Energy Transfer (meV)
0
30
60
90
T=340 K
0
25
50
75
T=360 K
0
20
40
60
80
(a) Q=1.32 Å-1
T=380 K
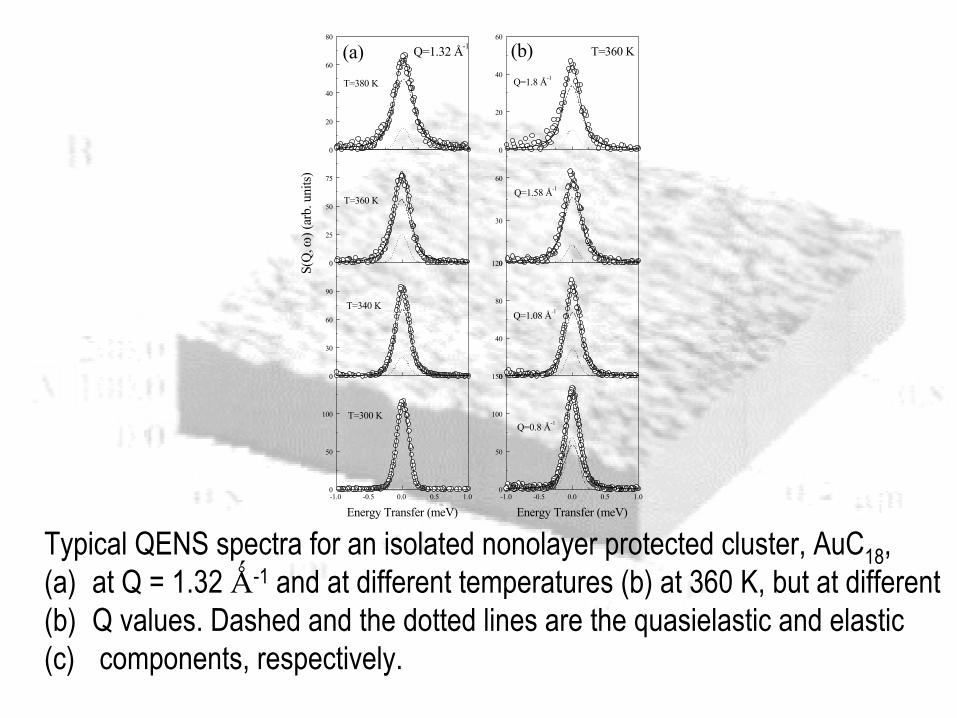
Typical QENS spectra for an isolated nonolayer protected cluster, AuC18, (a) at Q = 1.32 Ǻ-1 and at different temperatures (b) at 360 K, but at different (b) Q values. Dashed and the dotted lines are the quasielastic and elastic(c) components, respectively.
0.0 0.5 1.0 1.5 2.00.0
0.2
0.4
0.6
0.8
1.0 340 K 360 K 380 K
EISF
Q(Å-1)
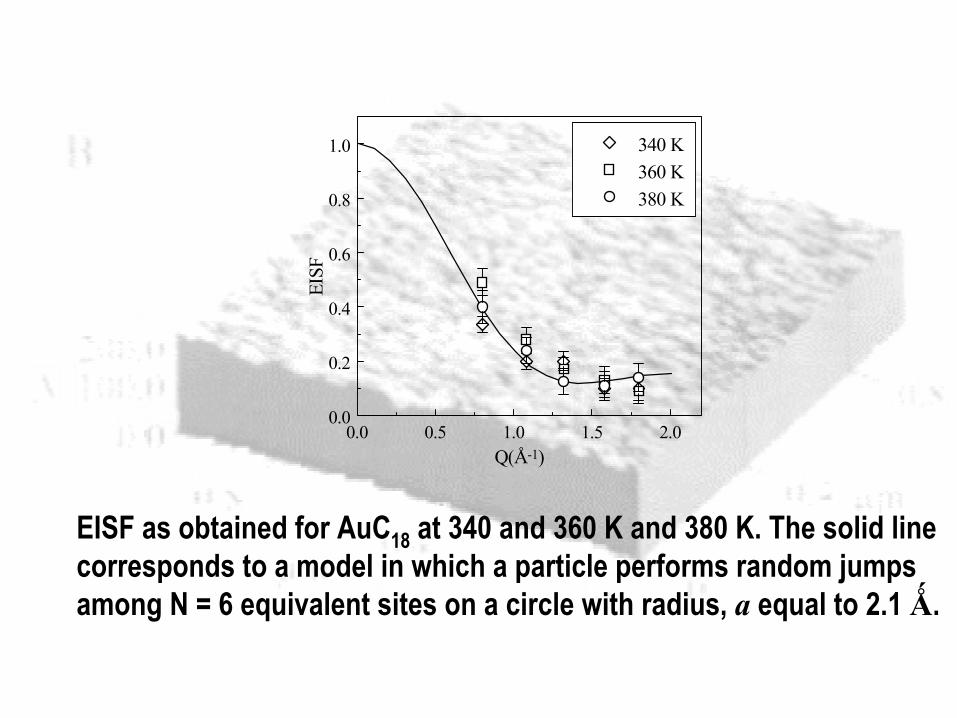
EISF as obtained for AuC18 at 340 and 360 K and 380 K. The solid line corresponds to a model in which a particle performs random jumpsamong N = 6 equivalent sites on a circle with radius, a equal to 2.1 Ǻ.
0.1 1 100.5
0.6
0.7
0.8
0.9
1.0
1.1
(b)
tran
smitt
ance
input fluence (J/cm2)
0.1 10.8
0.9
1.0(c)
tran
smitt
ance
input fluence (J/cm2)
0.1 10.6
0.7
0.8
0.9
1.0
1.1
(a)
trans
mitt
ance
input fluence (J/cm2)
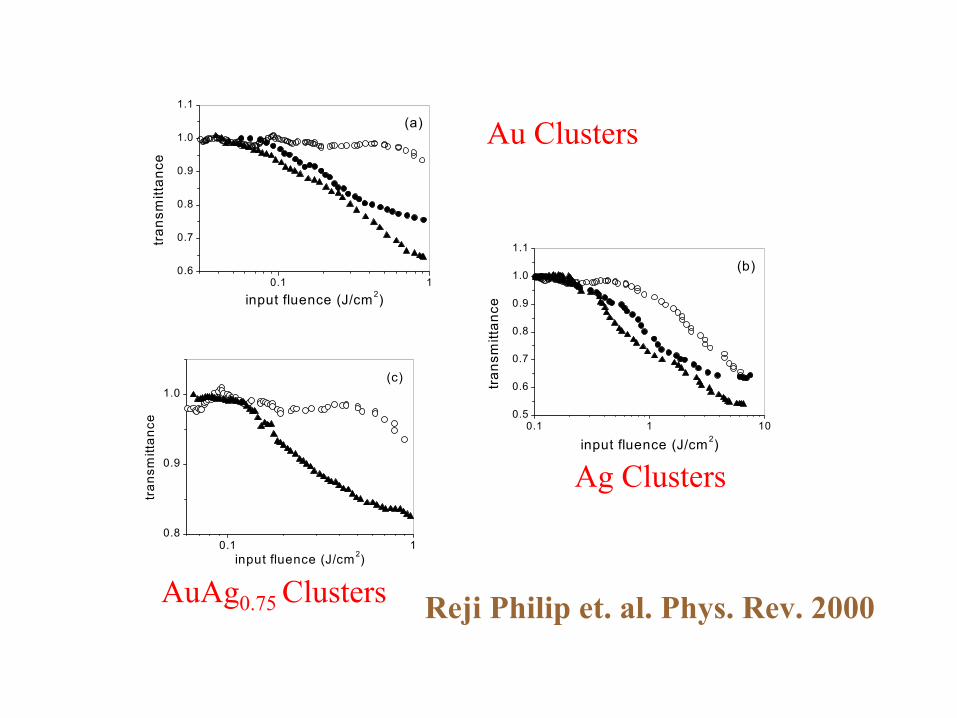
Reji Philip et. al. Phys. Rev. 2000
Au Clusters
Ag Clusters
AuAg0.75 Clusters
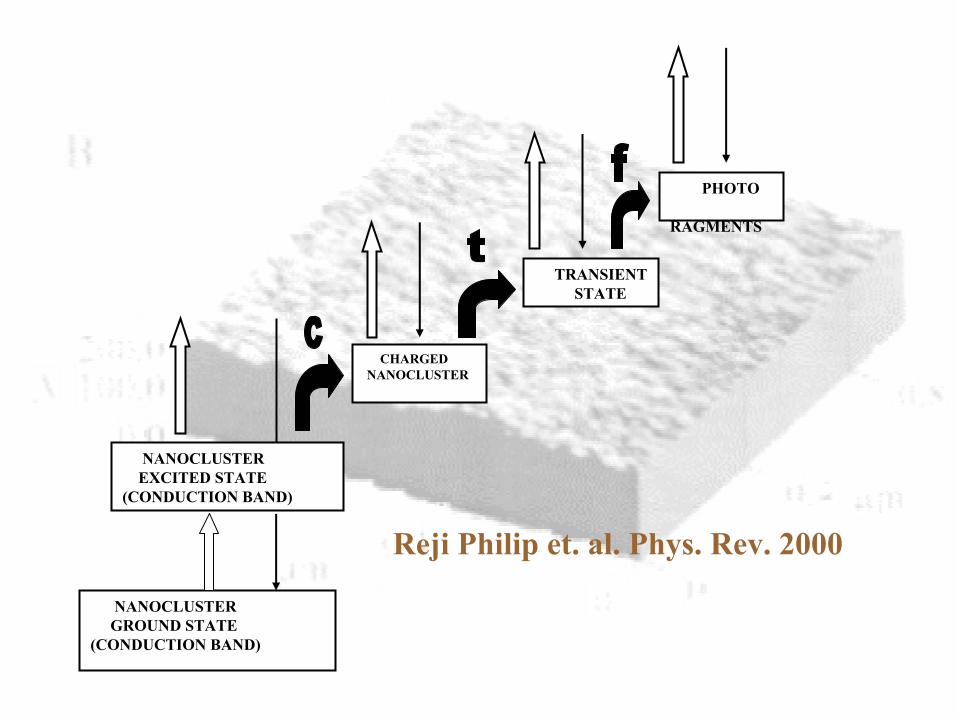
NANOCLUSTER GROUND STATE
(CONDUCTION BAND)
NANOCLUSTER EXCITED STATE
(CONDUCTION BAND)
CHARGED NANOCLUSTER
TRANSIENT STATE
PHOTO
RAGMENTS
Reji Philip et. al. Phys. Rev. 2000
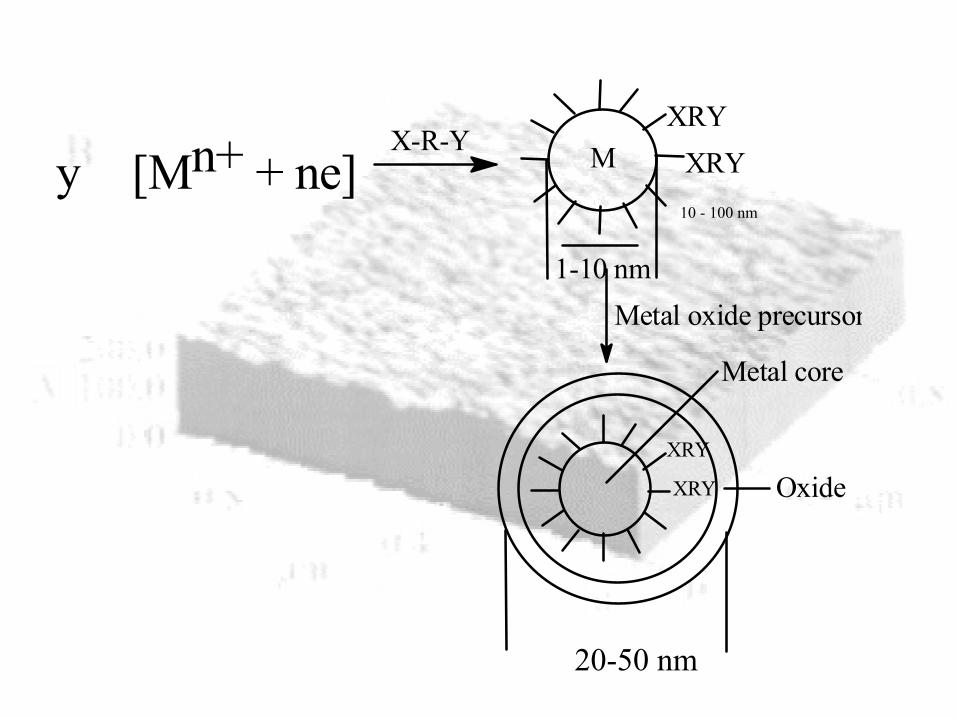
10 - 100 nm
y [ M n + + n e ] X - R - Y M X R Y
X R Y
1 - 1 0 n m M e t a l o x i d e p r e c u r s or
X R Y
X R Y O x i d e
M e t a l c o r e
20-50 nm
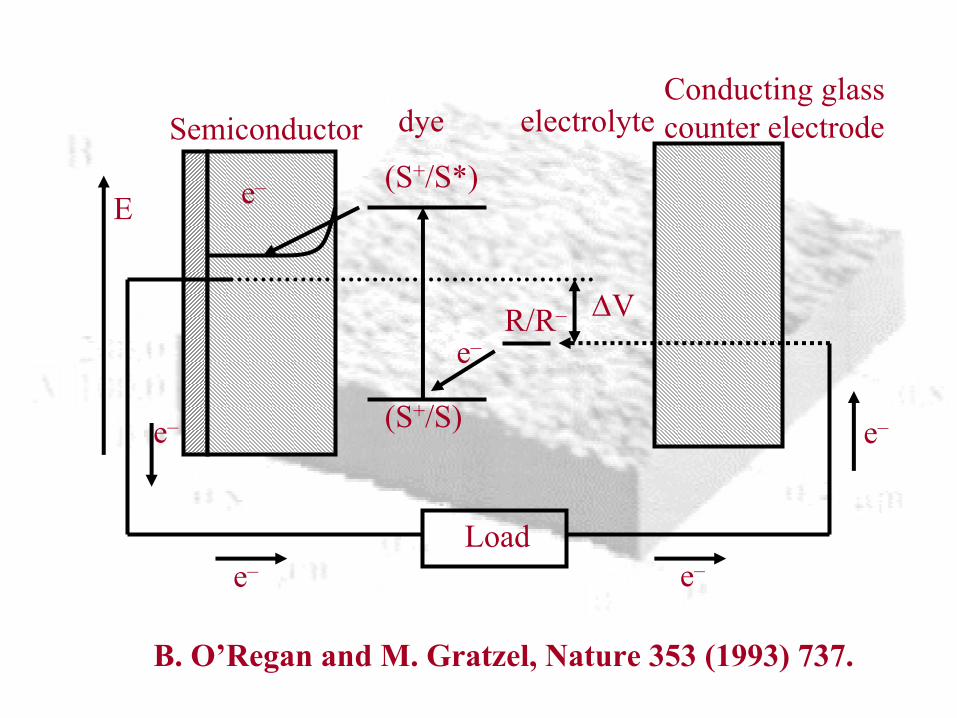
Load
E(S+/S*)
(S+/S)
e–
Semiconductor dye electrolyteConducting glass counter electrode
e–
e– e–
e–
e–
∆VR/R–
B. O’Regan and M. Gratzel, Nature 353 (1993) 737.
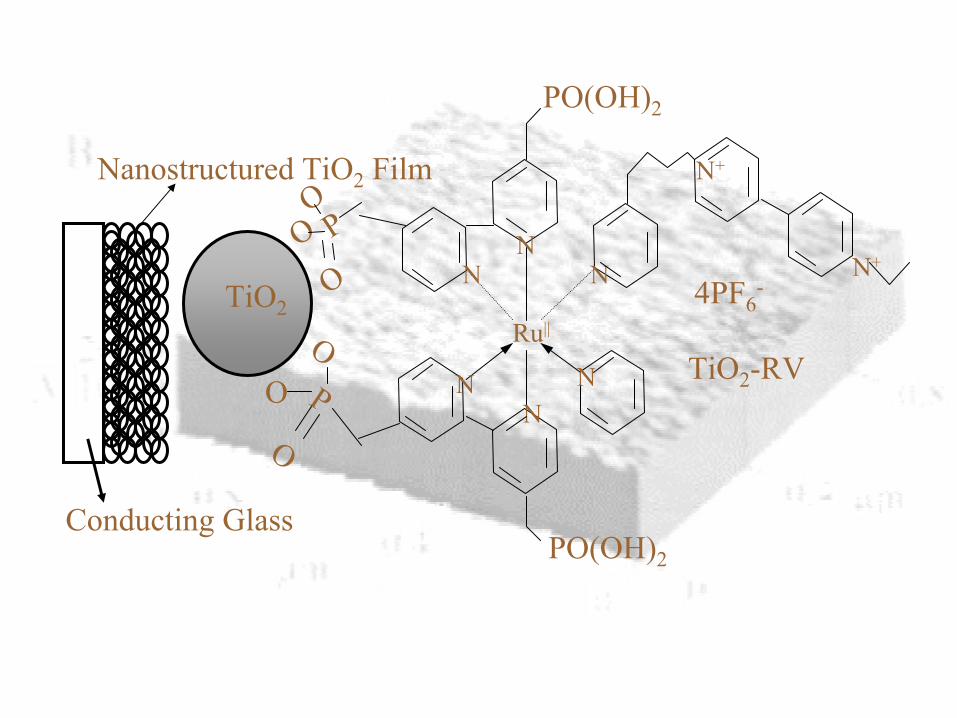
Ru||
OOP
ON
N
NN N
N
O PO
O
N+
N+
PO(OH)2
PO(OH)2
Conducting Glass
Nanostructured TiO2 Film
TiO2
TiO2-RV
4PF6-
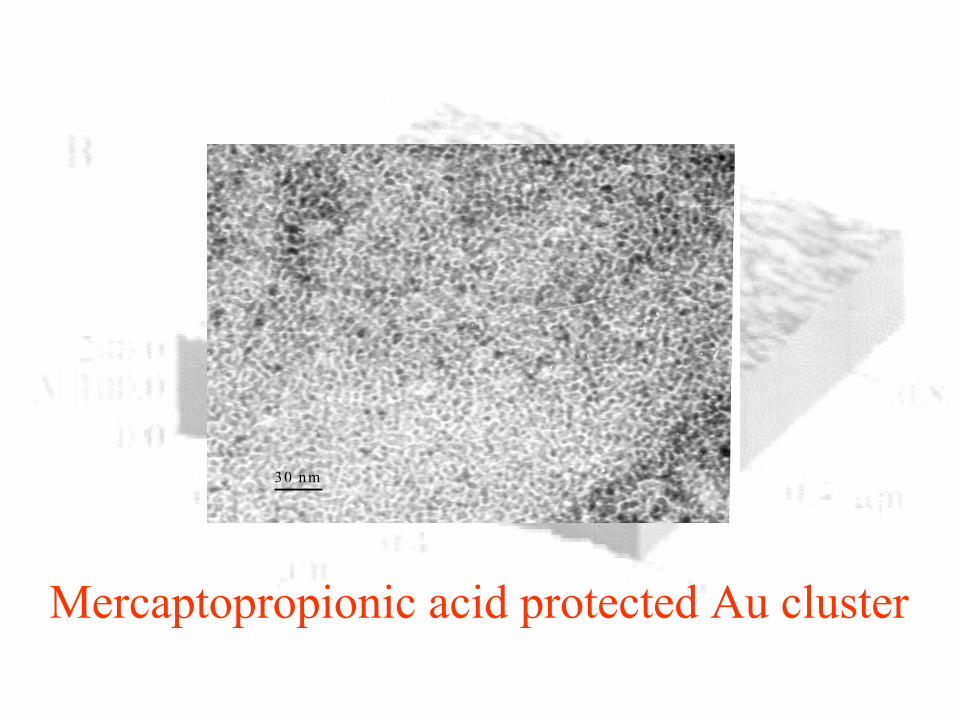
30 nm
Mercaptopropionic acid protected Au cluster
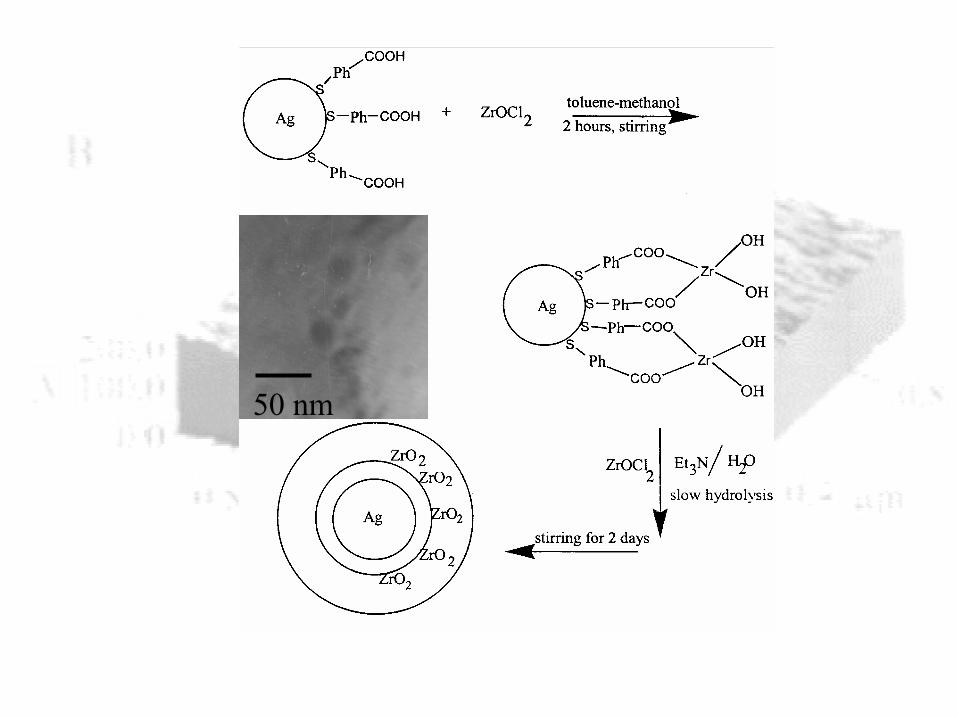
50 nm
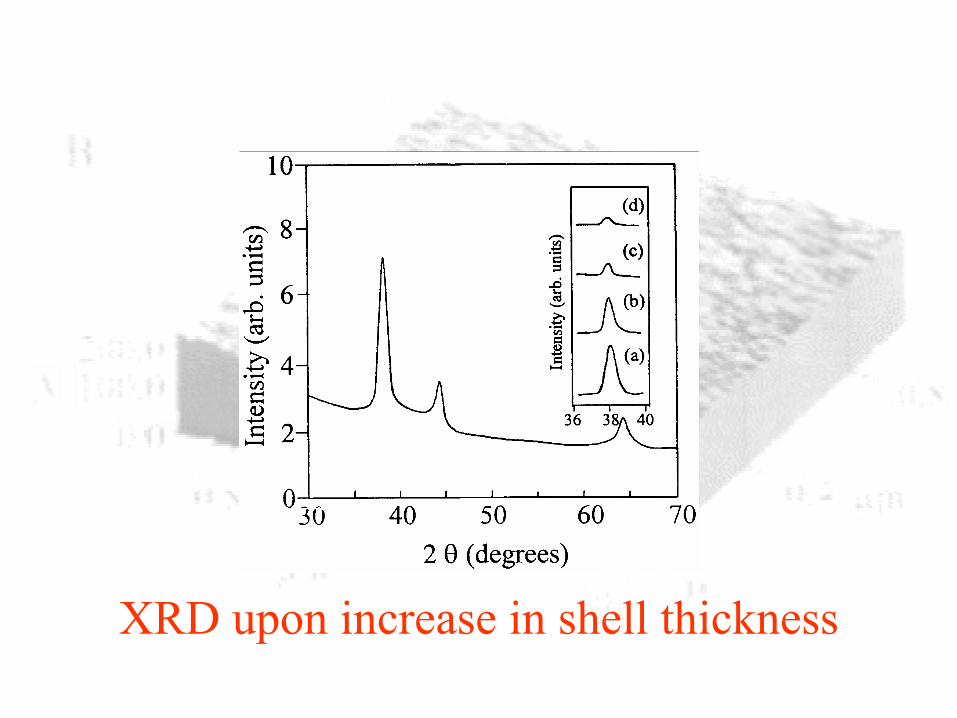
XRD upon increase in shell thickness
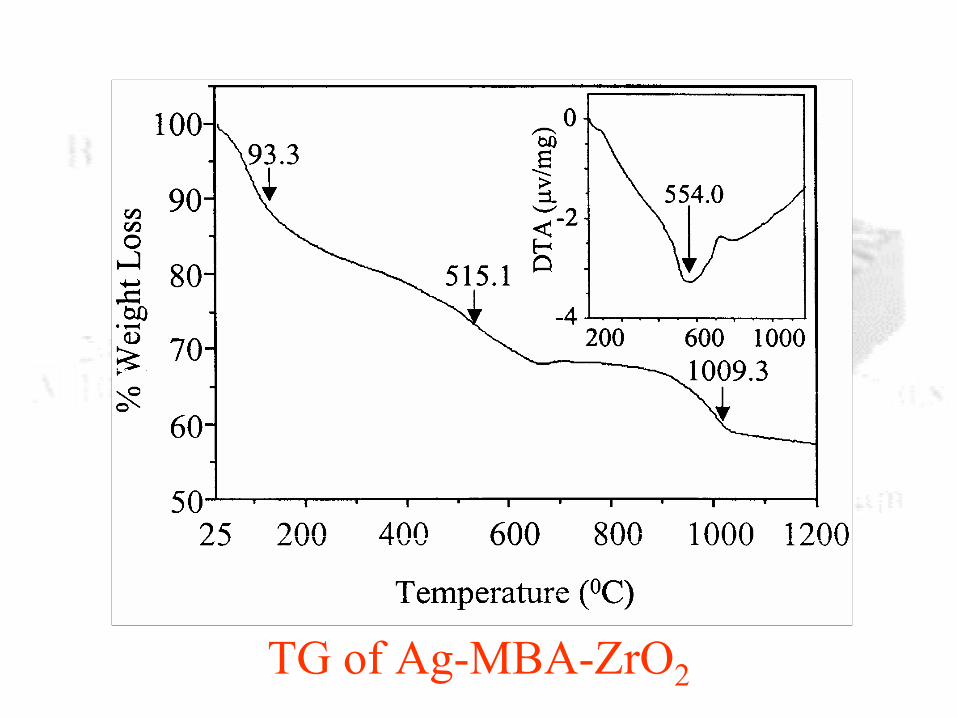
TG of Ag-MBA-ZrO2
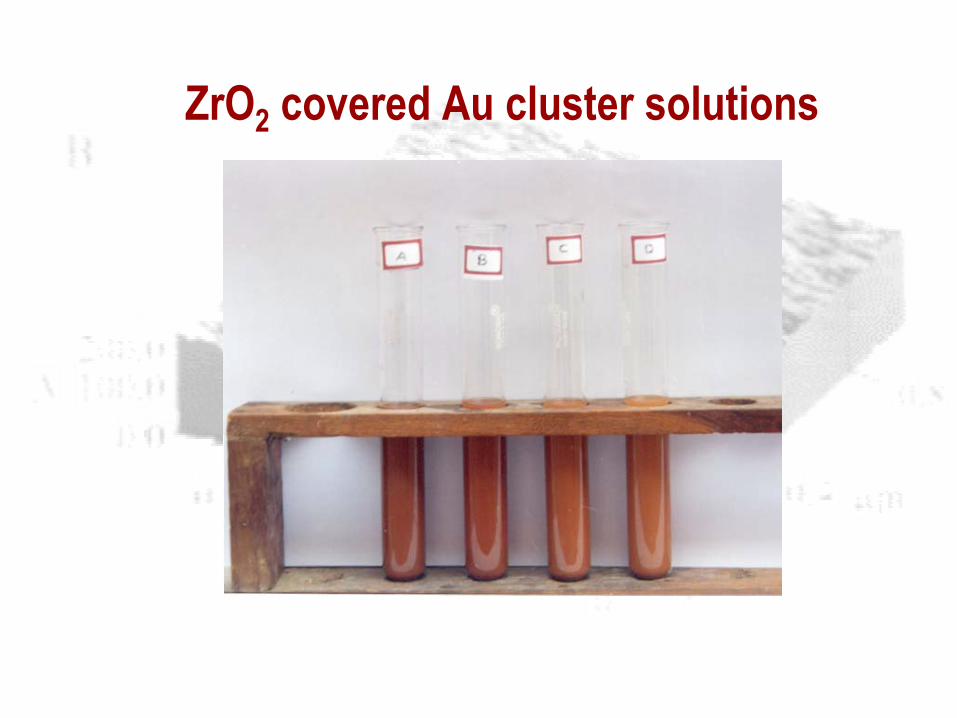
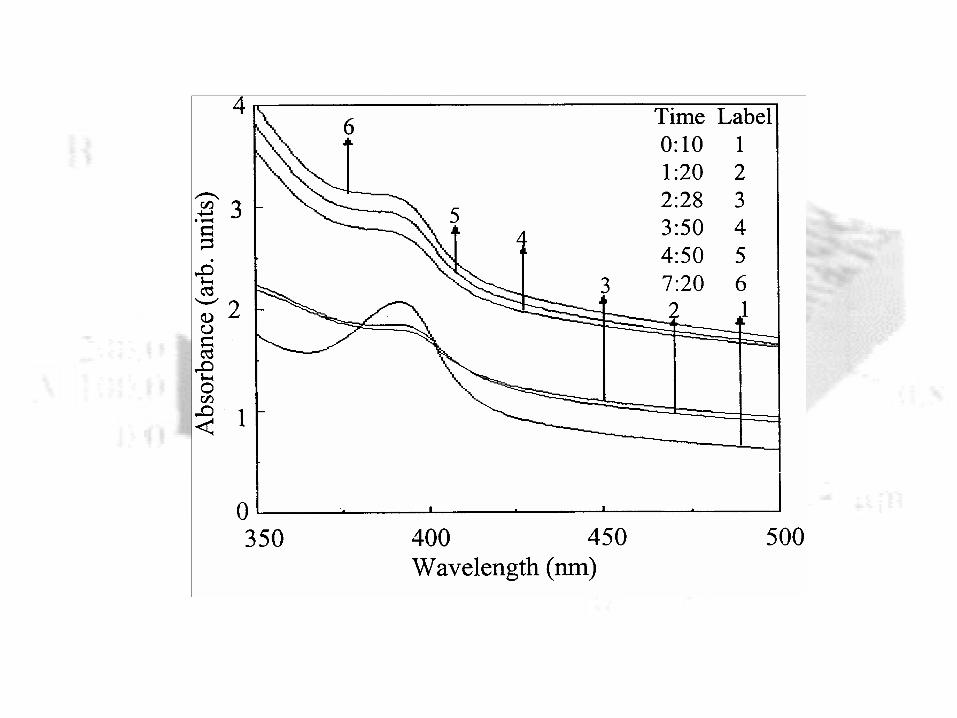
ZrO2 covered Au cluster solutions
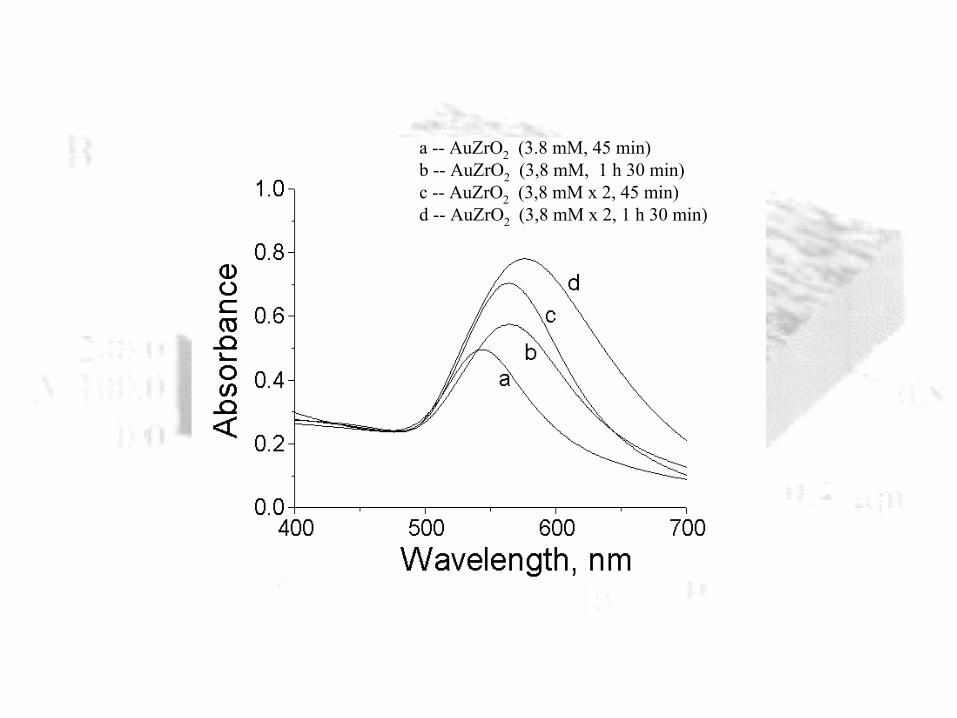
a -- AuZrO2 (3.8 mM, 45 min)b -- AuZrO2 (3,8 mM, 1 h 30 min)c -- AuZrO2 (3,8 mM x 2, 45 min)d -- AuZrO2 (3,8 mM x 2, 1 h 30 min)
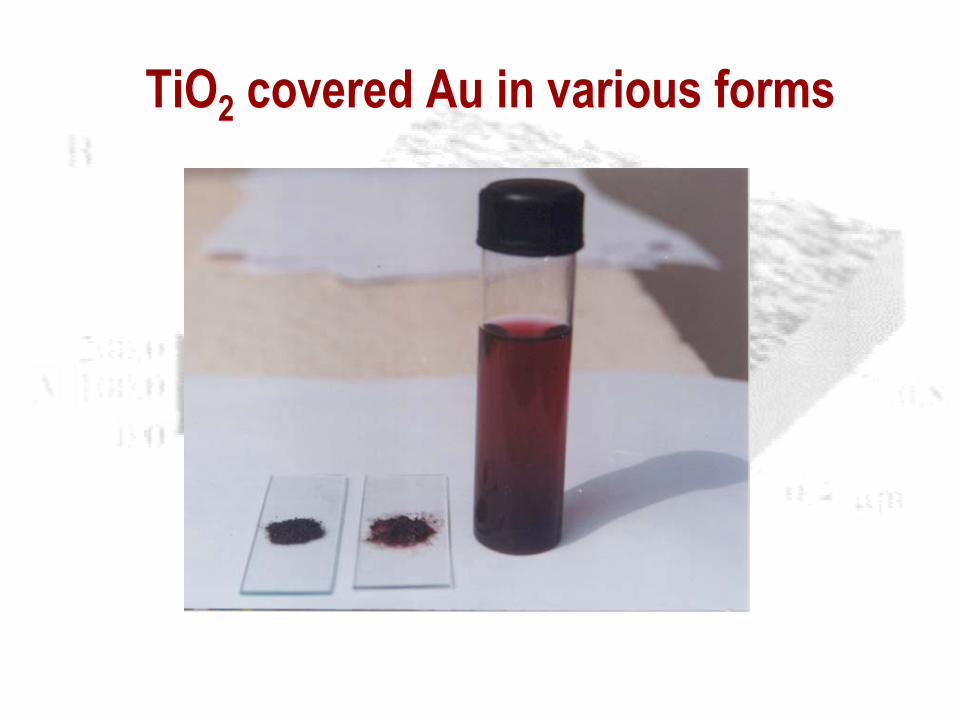
TiO2 covered Au in various forms
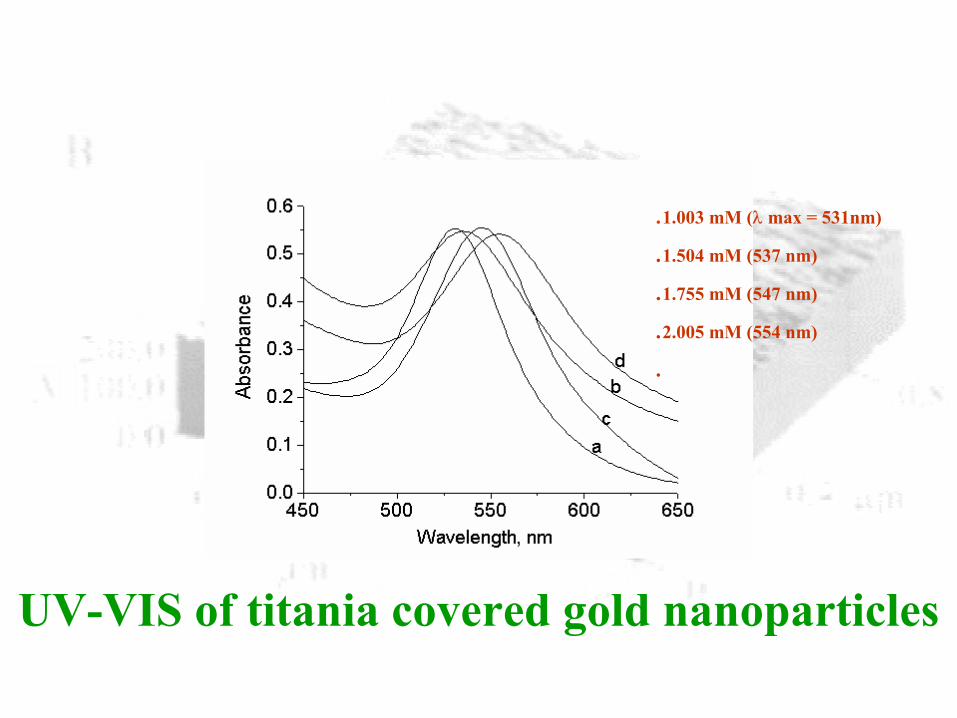
UV-VIS of titania covered gold nanoparticles
.1.003 mM (λ max = 531nm)
.1.504 mM (537 nm)
.1.755 mM (547 nm)
.2.005 mM (554 nm)
.
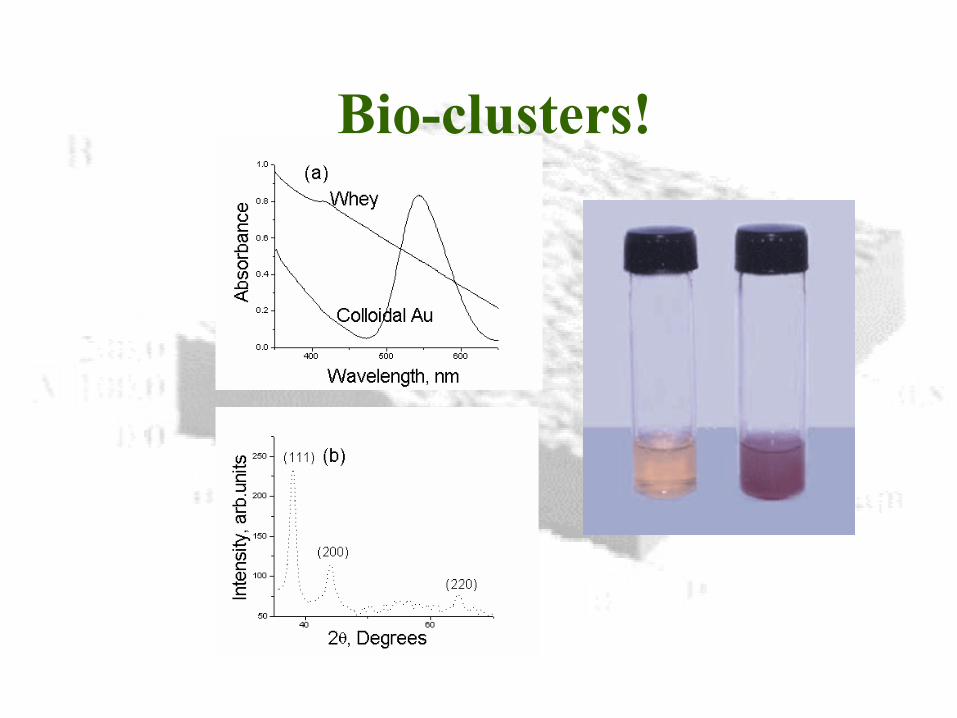
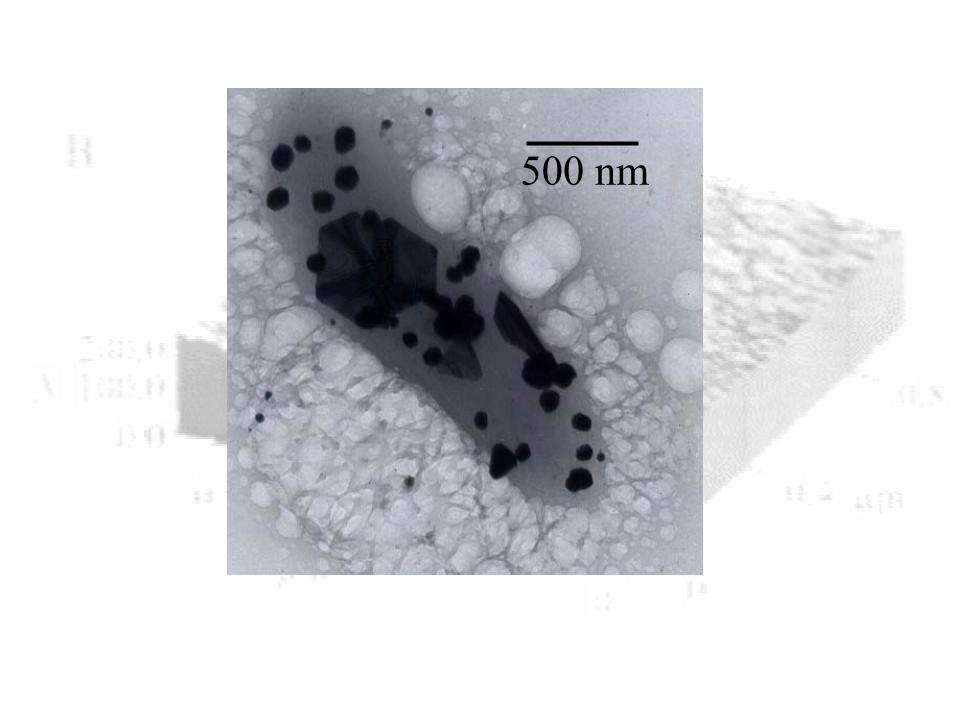
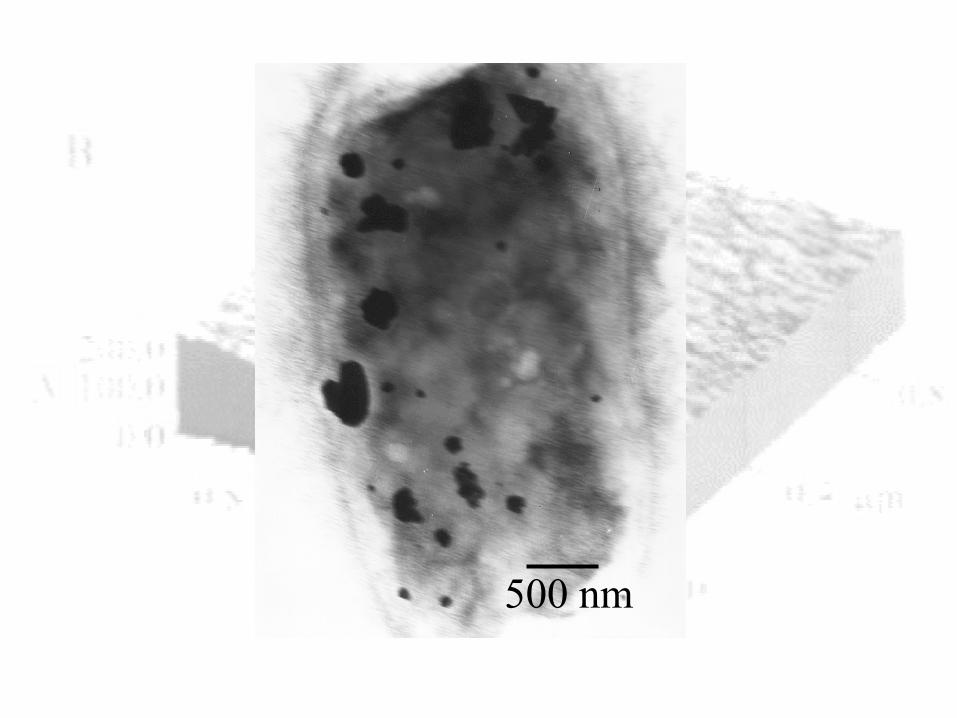
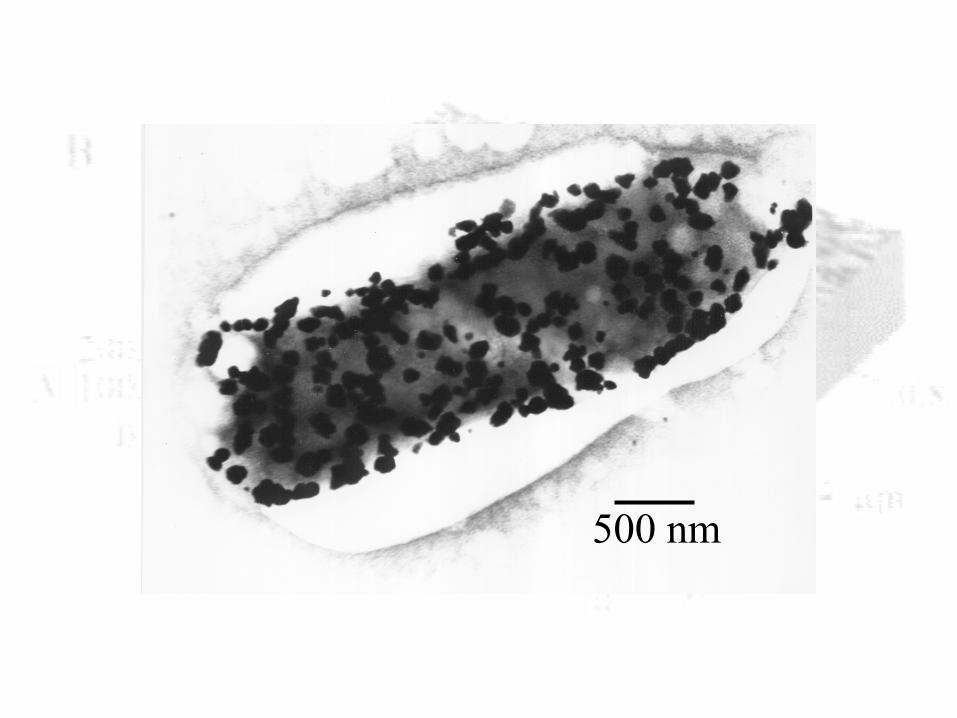
Bio-clusters!
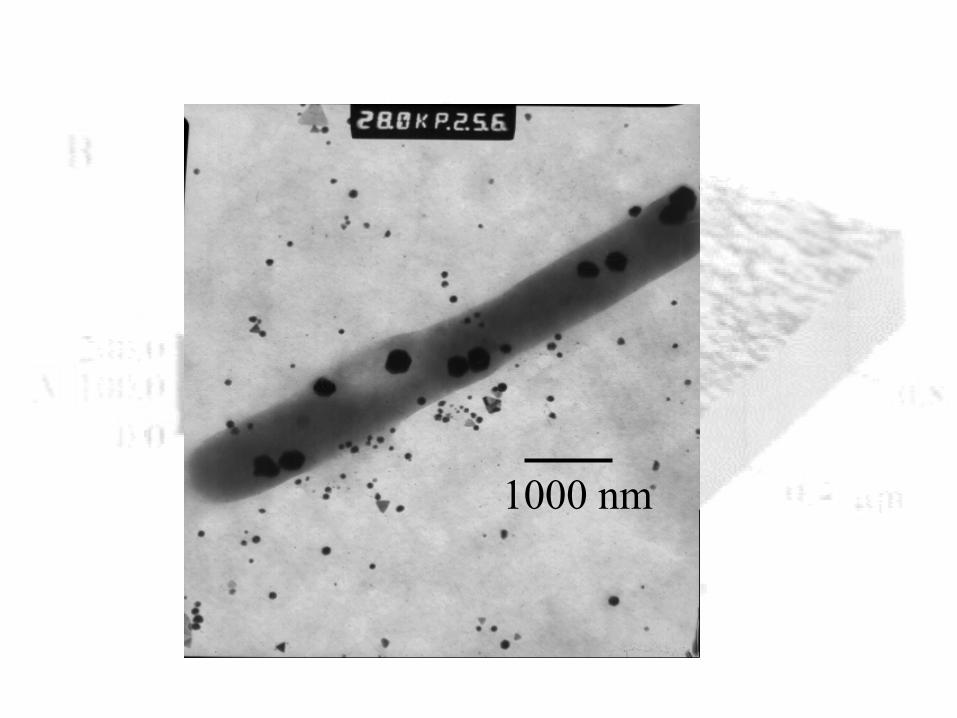
1000 nm
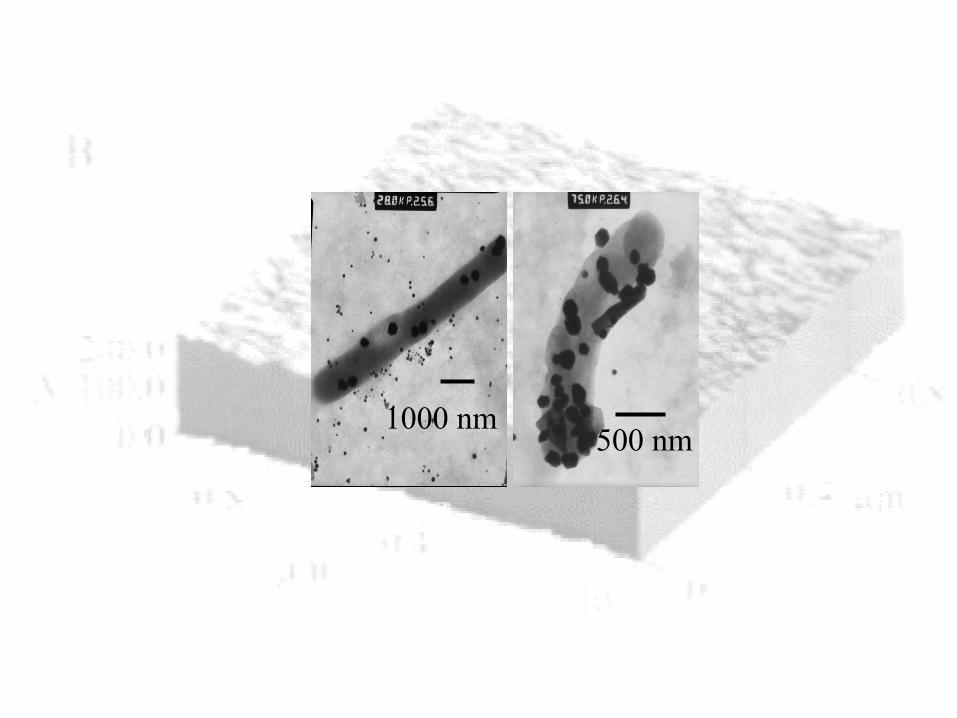
1000 nm500 nm
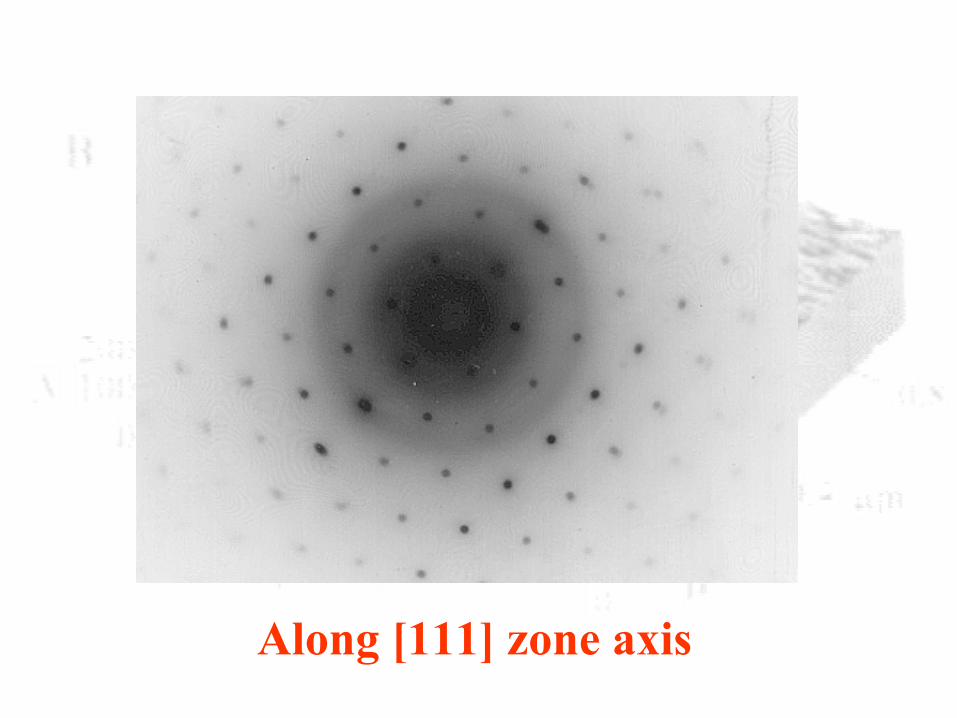
Along [111] zone axis
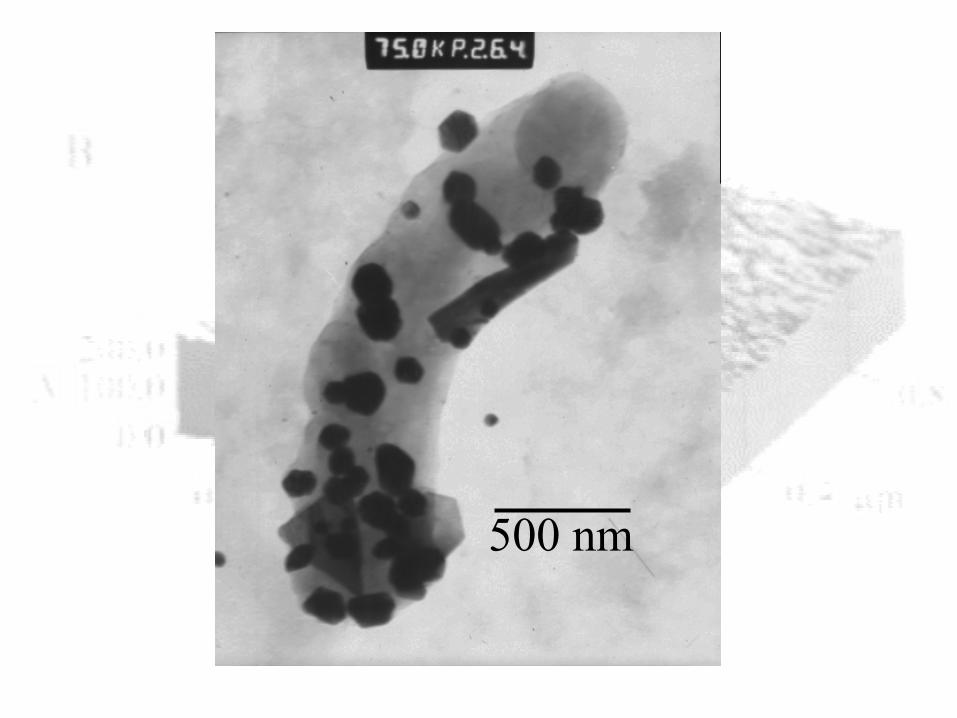
500 nm
500 nm
500 nm
500 nm
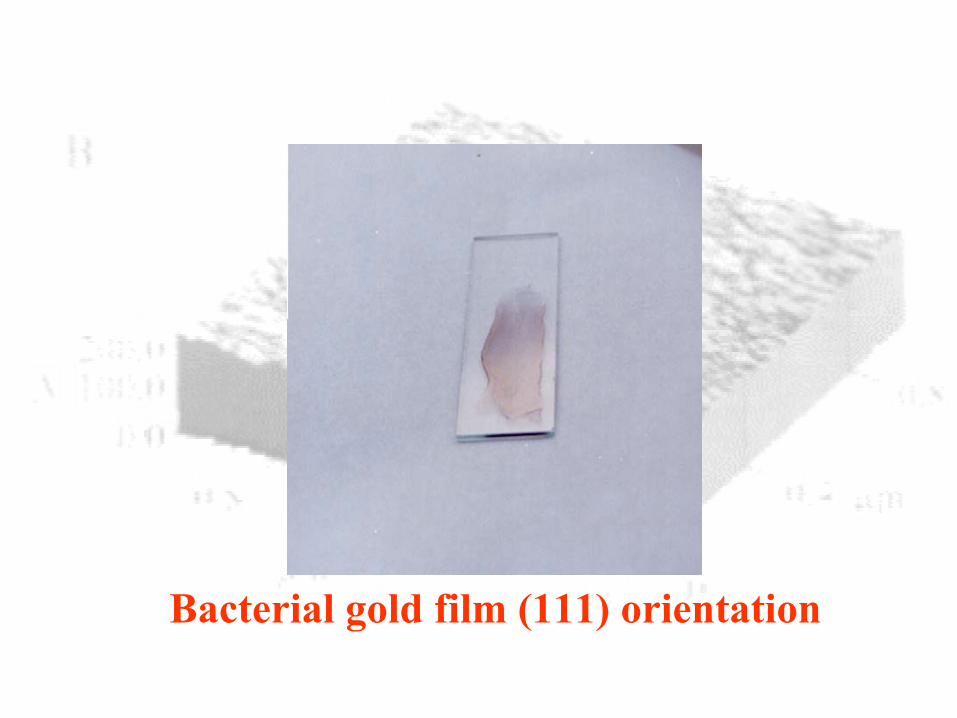
Bacterial gold film (111) orientation
Materials through monolayers: a viable approachThiol adsorb on gold with hydrogen evolutionOxide protected metal clusters can be synthesised in bulkProperties can be tuned depending on the dimensions of both oxide and metal
Summary

Acknowledgements
PeopleV. EswaranandRajesh Komban
Renjis TomSreekumaran NairDr. Beena Mathew
Dr. T. K. ManojkumarFundingCSIR, DST
FacilitiesRSIC and IIT
Teachers


