Page 1
The Innovation Journal: The Public Sector Innovation Journal, Volume 22(2), 2017, article 3.
___________________________________________________________________________________________________________________________________________________________________________________________
1
From NASA to EU: the evolution of the
TRL scale in Public Sector Innovation
Mihály Héder
Hungarian Academy of Sciences Institute for Computer Science and
Control, Lágymányosi u. 11, Budapest, Hungary H-1111
Page 2
The Innovation Journal: The Public Sector Innovation Journal, Volume 22(2), 2017, article 3.
___________________________________________________________________________________________________________________________________________________________________________________________
2
From NASA to EU: the evolution of the TRL scale in
Public Sector Innovation
Mihály Héder
ABSTRACT
This study examines how the Technology Readiness Level (TRL) scale became, through
various mutations, an innovation policy tool of the European Union (EU), and summarizes the
risks and opportunities created along the way. The paper presents a comparative study about the
evolution of two innovation-related policies that share a common concept. This document-centric
study relies on position papers, white papers, government documents, policy documents and
research program descriptions. The paper establishes that the concreteness and sophistication of
the TRL scale gradually diminished as its usage spread outside its original context (space
programs). A discipline-specific tailoring of the scale is essential in every area before
application. Yet for a number of disciplines this has not happened, while in some other areas the
available customizations and handbooks are not used in EU context. This uncritical usage of the
scale in the current EU framework program seems to carry more risks than advantages. In the
absence of discipline-specific guides, TRLs will predictably become a source of confusion and a
subject of abuse in efforts to obtain EU funding.
Key words: EU, NASA TRL, innovation policy, public sector innovation
Introduction
This article explains how the Technology Readiness Level (TRL) scale became, through
various mutations, an official innovation policy tool of the European Union (EU). TRL
originated at the American National Aeronautics and Space Administration (NASA), where it
began as a means of measuring how far a technology was from being deployed in space. Later,
since 1999, as an outcome of a US Government investigation, the US Department of Defense
(DoD) was required to use TRL in weapons technology acquisition (Schinasi, et al., 1999).
Similarly, the Commonwealth of Australia conducted the Kinnaird Defense Procurement Review
(Kinnaird, et al., 2003) and started using TRL in its own DoD. Around that time, the usage of
TRL spread among other governmental and military organizations in English-speaking countries
and was also adopted by the European Space Agency. A glossary of terms is provided in
Appendix I.
From the very beginning, TRL was used to define boundaries between different
organizational and financial modes of technological development. Perhaps this is why it made
sense to the High-Level Expert Group on Key Enabling Technologies (HLG-KET) of the
European Union to build TRL into the foundation of its new public innovation policy. The
universal usage of TRL in EU policy was proposed in the final report of the first HLG-KET
Page 3
The Innovation Journal: The Public Sector Innovation Journal, Volume 22(2), 2017, article 3.
___________________________________________________________________________________________________________________________________________________________________________________________
3
(HLG-KET, 2011), and it was indeed implemented in the subsequent EU framework program,
called H2020, running from 2013 to 2020. This means not only space and weapons programs,
but everything from nanotechnology to informatics and communication technology.
Central Argument
This article argues that it has never been established whether the originally space and
weapons technology-specific TRL scale can be used fruitfully in all areas of innovation. Because
of this, the EU-wide mandate to use TRL across all publicly funded programs is a risky
innovation of the innovation policy itself. This article argues that the subtle mutations happened
to the TRL concept in the last three decades. Many aspects of the TRL scale were lost, forgotten
or abstracted away during its journey to the EU, while in the meantime; new meanings and
associations were formed. In the absence of discipline-specific guides, TRLs will predictably
become a source of confusion and a subject of abuse in efforts to obtain EU funding.
Article Organization and Methodology
The article first covers the evolution of TRL from its beginning at NASA to 2013 when it
became both an International Organization for Standardization (ISO) standard and a de facto
standard within space and weapons industry. The aim of this first section is to see through the
often one-sided laudation of TRL and find the actual, rather hidden factors and conditions that
made it widely accepted. The method of this part is the historical analysis of policy documents,
program descriptions and other sources.
The hidden factors uncovered in the first section facilitate the evaluation of the TRL
usage in EU public sector innovation context. This section covers the developments from the
first HLG-KET report (HLG-KET, 2011), presents how the H2020 program attempts to
implement the TRL scale and ends in 2015 when the final report of the second EU HLG-KET
report was written (HLG-KET, 2015). The focus of this description is on the mutations of the
practices of using TRL for decision making.
These first two sections provide the necessary background to the discussion of the
opportunities and risks of TRL bring to the EU in the third section.
Limitations
This article is based on publicly available sources only. There might have been various
reasons behind the adoption of the TRL scale in the EU in addition to those revealed in these
public documents. Therefore, some issues presented herein may have been caused by the simple
lack of communication and not necessarily a lack of clear strategy making. Then again, the
majority of those who will have to adopt the TRL scale in order to participate in EU programs
have no choice but to rely on public documents.
Another limitation of this works is that it cannot present quantitative data on the
implications the EU’s decision to adopt TRL had. As it will be explained later, there is an
ongoing usage of TRL by the European Commission since 2014 only. This means that by the
time of writing this article (2016-17) hardly any projects that were mandated to rely on TRL
have ended. An assessment of the impact would be necessary in a later stage of the research. It is
too early then to tell whether this policy change is beneficial, detrimental or neutral to EU public
innovation.
Page 4
The Innovation Journal: The Public Sector Innovation Journal, Volume 22(2), 2017, article 3.
___________________________________________________________________________________________________________________________________________________________________________________________
4
Origins of TRL
When an airplane is about to take off, people who have a stake in its safe voyage are
understandably eager to verify that the vehicle is in a fit state. Therefore, people in aviation tend
to have pre-flight rituals that consist of checking and double-checking critical parts of their
planes. This process is often called a flight readiness review. Not surprisingly, these reviews
have always been a daily activity at NASA, ever since the first space programs.
At the peak of the Apollo program, in 1969, NASA was already making plans for the
post-Apollo era. These plans involved space stations. To evaluate whether the technology was
ready to start such a program, a technology readiness review was suggested (Mankins, 2009). It
is easy to see how the practice of flight readiness reviews was generalized to another area –
instead of checking whether the vehicle is ready to fly, a technology readiness review checks
whether an envisaged vehicle can actually be developed in the first place. Although the 1969
Space Base proposal was never implemented (Johnson Space Center, 1997), the idea of the
technology readiness review endured for two decades, after which the concept of readiness levels
was finally fleshed out in a white paper (a document with its terms, concepts and arguments
explained rigorously like in a scientific paper, but explaining a proposal) for the first time.
New NASA research policy, 1989
In a 1989 paper by Stanley R. Sadin, Frederick P. Povinelly and Robert Rosen (Sadin, et
al., 1989), all of them working at NASA Headquarters, the concept of readiness levels was
introduced. (The term “Technology Readiness Level” does not appear in the paper). The paper
proposed a new technology development strategy for NASA and can be understood as a response
to President Reagan’s Directive on National Space Policy (Reagan, 1988), which encouraged
cooperation between NASA and civil and commercial as well as international partners.
Additionally, while the word “Challenger” is never mentioned in the paper, there are multiple
obvious references to the 1986 space shuttle disaster, which served as a strong reason for a
strategy change aiming at a safer development model of space technology.
The core of the new strategy is a departure from the program pull model. Program pull
meant that all technology development by NASA was driven by the needs of large space
programs, such as Apollo, Viking or the Space Shuttle. Instead, the new strategy included an
element of technology push – the development of some technologies should be allowed without
any specific space program needing them. The authors called this a push or opportunity-driven
model of development. The new model was applied in the Civil Space Technology Initiative
(CSTI), which aimed to create low-earth-orbit satellites, and in Pathfinder.
The results of an opportunity-driven technology development model must be properly
assessed because they cannot necessarily prove their feasibility in an actual space mission at the
time of development. This was the function of the readiness level scale.
The 1989 paper explained that the need for such categorization strongly emerged when
the series of successful programs – Explorers, Pioneers, Mariners and Apollo – generated a vast
inventory of new technology. The managers of later programs in the nineteen-seventies aimed to
evaluate and adapt these technologies to their own needs. This type of work was called a
Page 5
The Innovation Journal: The Public Sector Innovation Journal, Volume 22(2), 2017, article 3.
___________________________________________________________________________________________________________________________________________________________________________________________
5
Supporting Research and Technology (SRT) project, while Advanced Research Technology
(ART) projects sought to try out new concepts in parallel (Banke, 2010).
However, in this pre-TRL period, technology handoff between the ART to the new
mission too often failed, and the new concepts were not applied. It will be explained later that a
similar problem was perceived by the HLG-KET group of the EU at the end of the 2000s with
the European R&D.
NASA management analyzed a number of successful and failed technology transfer
projects. It emerged that in those cases when the technology transfer was successful, the ART
project pursued a higher level of maturity – they aimed to achieve something close to flight
readiness.
The authors therefore suggested a common categorization scheme among SRT and ART
projects, one that would also express how proven a certain technology was. The established scale
featured the following seven levels:
Level 1 – Basic principles observed and reported
Level 2 – Potential application validated
Level 3 – Proof-of-Concept demonstrated analytically and/or experimentally
Level 4 – Component and/or breadboard laboratory validated
Level 5 – Component and/or breadboard validated in simulated or real-space environment
Level 6 – System adequacy validated in simulated environment
Level 7 – System adequacy validated in space
These levels were proposed to replace the previous, less definitive categories in use:
“basic research”, “feasibility”, “development” and “demonstration”. These are the elements of a
linear development process. The new scale did not change this linear property; it merely
provided more defined phases in it.
A very important aspect of the levels – something that is completely lost in contemporary
applications of TRL in non-space domains – is the existence of a Technology Flight Readiness
requirement – the readiness level when a component is eligible for a space mission. This level
differed for different types of components. For instance, they found that electronic circuitry
could be accepted after successful ground tests in a simulated environment (Level 5 readiness),
while propulsion systems had to be at least level 6 but preferably level 7 to be included in a
mission. This type of sophistication is nowhere to be seen in later attempts to use TRLs as policy
tools.
This conceptualization of risk management was very resourceful on the part of NASA
management because in addition to minimizing risk in future missions, it also created a good
argument for building a space station. That is, if the requirement for a certain class of technology
is to have a maximal level of 7 (proven in space) before they depend on it on a space mission,
then the only option is to test that technology in a laboratory that is itself in space. In the paper,
the authors already proposed that technology tests be carried out by astronauts in space in
addition to the usual natural sciences experiments.
Page 6
The Innovation Journal: The Public Sector Innovation Journal, Volume 22(2), 2017, article 3.
___________________________________________________________________________________________________________________________________________________________________________________________
6
Another very important detail of the usage of the readiness levels is how they were
applied to delimit research programs. The so-called “Base” programs aimed at levels 1-4, while
the more focused efforts ran through levels 3-7, meaning that they overlapped on two levels in a
conscious effort at flexibility. Notably, this overlap contrasts with the contemporary
reinterpretation of the TRLs, which establishes strict cut-off barriers in research projects along
these levels without overlapping.
Finally, readiness levels are used when communicating with partners and prospective
users outside the organization, such as the military or commercial organizations. An inventory of
technologies assessed in a standard way is very useful for that purpose. However, such an
inventory can only be built by an entity that has adopted a homogenous assessment process. This
description fits NASA much more than the EU.
The nine-level NASA scale
Two years later, in 1991, NASA used the TRL scale in its Integrated Technology Plan for
Civil Space Program (OAST, 1991). By that time, the scale had two new levels, 8 and 9. These
were added in the late 1980s by John C. Mankins, who later wrote a white paper (Mankins,
1995) that also slightly rephrased the description of the lower levels. Thus, the scale became
slightly more general. More crucially, Mankins provided a “discussion” for each level that
included multiple examples of technologies at certain TR levels as illustrations. Moreover, he
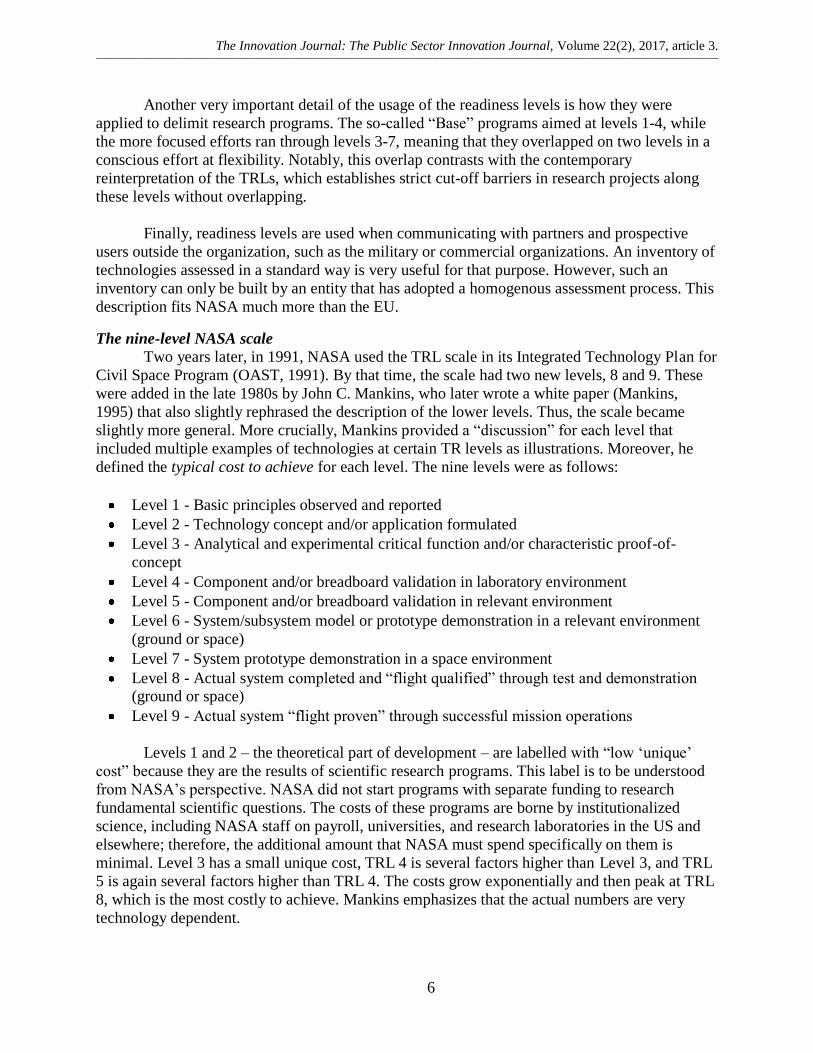
defined the typical cost to achieve for each level. The nine levels were as follows:
Level 1 - Basic principles observed and reported
Level 2 - Technology concept and/or application formulated
Level 3 - Analytical and experimental critical function and/or characteristic proof-of-
concept
Level 4 - Component and/or breadboard validation in laboratory environment
Level 5 - Component and/or breadboard validation in relevant environment
Level 6 - System/subsystem model or prototype demonstration in a relevant environment
(ground or space)
Level 7 - System prototype demonstration in a space environment
Level 8 - Actual system completed and “flight qualified” through test and demonstration (ground or space)
Level 9 - Actual system “flight proven” through successful mission operations
Levels 1 and 2 – the theoretical part of development – are labelled with “low ‘unique’
cost” because they are the results of scientific research programs. This label is to be understood
from NASA’s perspective. NASA did not start programs with separate funding to research
fundamental scientific questions. The costs of these programs are borne by institutionalized
science, including NASA staff on payroll, universities, and research laboratories in the US and
elsewhere; therefore, the additional amount that NASA must spend specifically on them is
minimal. Level 3 has a small unique cost, TRL 4 is several factors higher than Level 3, and TRL
5 is again several factors higher than TRL 4. The costs grow exponentially and then peak at TRL
8, which is the most costly to achieve. Mankins emphasizes that the actual numbers are very
technology dependent.
Page 7
The Innovation Journal: The Public Sector Innovation Journal, Volume 22(2), 2017, article 3.
___________________________________________________________________________________________________________________________________________________________________________________________
7
Indeed, in 2008, a chief scientist at Boeing looking back at the track record of TRL usage
(Whelan, 2008) in Boeing’s R&D concluded that most projects reach TRL 6 before even 10% of
the total funds are committed. However, notably, while this original NASA TRL scheme predicts
that costs will multiply at nearly every step between TRL 3-8, in the EU application, the costs
associated with TRL levels are either not explored at all or assumed to increase linearly or with a
gentle curve.
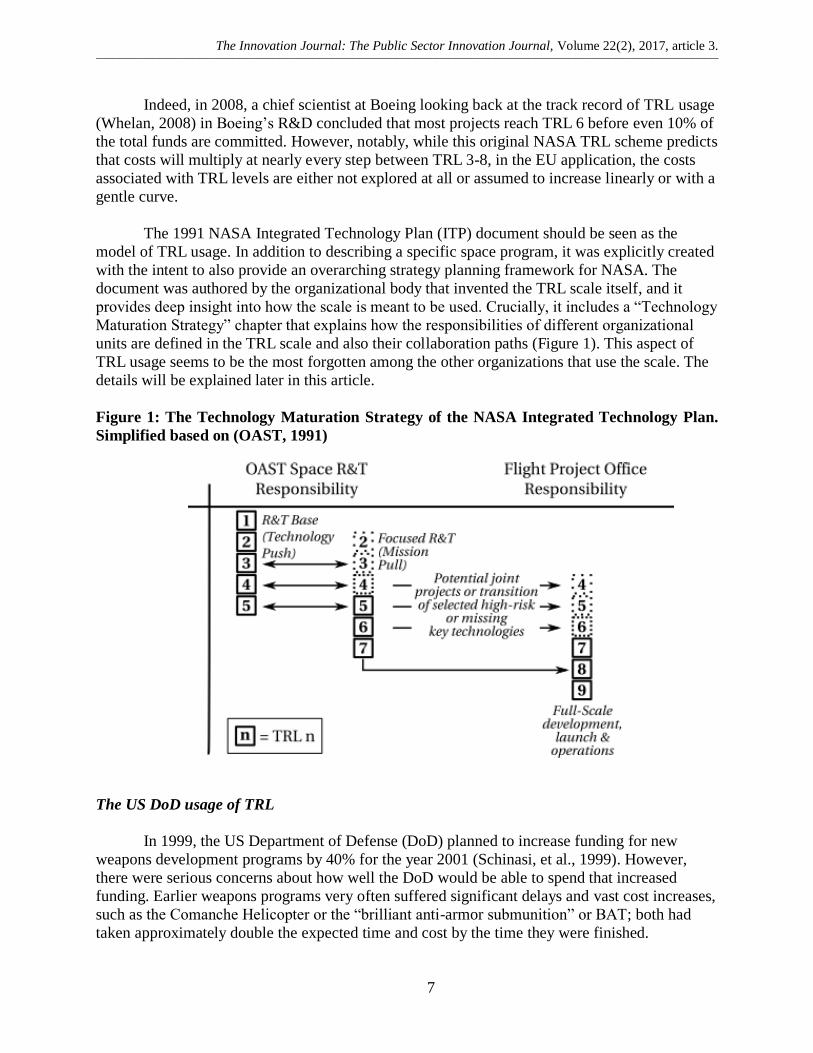
The 1991 NASA Integrated Technology Plan (ITP) document should be seen as the
model of TRL usage. In addition to describing a specific space program, it was explicitly created
with the intent to also provide an overarching strategy planning framework for NASA. The
document was authored by the organizational body that invented the TRL scale itself, and it
provides deep insight into how the scale is meant to be used. Crucially, it includes a “Technology
Maturation Strategy” chapter that explains how the responsibilities of different organizational
units are defined in the TRL scale and also their collaboration paths (Figure 1). This aspect of
TRL usage seems to be the most forgotten among the other organizations that use the scale. The
details will be explained later in this article.
Figure 1: The Technology Maturation Strategy of the NASA Integrated Technology Plan.
Simplified based on (OAST, 1991)
The US DoD usage of TRL
In 1999, the US Department of Defense (DoD) planned to increase funding for new
weapons development programs by 40% for the year 2001 (Schinasi, et al., 1999). However,
there were serious concerns about how well the DoD would be able to spend that increased
funding. Earlier weapons programs very often suffered significant delays and vast cost increases,
such as the Comanche Helicopter or the “brilliant anti-armor submunition” or BAT; both had
taken approximately double the expected time and cost by the time they were finished.
Page 8
The Innovation Journal: The Public Sector Innovation Journal, Volume 22(2), 2017, article 3.
___________________________________________________________________________________________________________________________________________________________________________________________
8
As a result, politically, the planned increase budget increase had to be accompanied by
some type of convincing reform proposal about how these programs would be managed.
Therefore, the Armed Services Committee of the US Senate asked the US General Accounting
Office (GAO), sometimes also called the “congressional watchdog”, to investigate the situation
at the DoD.
In its report, the GAO investigated various programs, both well and poorly performing.
The GAO applied the TRL scale from NASA to the technologies that the programs acquired –
this was not done by DoD itself at the time. The GAO found that the DoD incorporated
technologies anywhere from TRL 2 to TRL 9 and that when lower-level technologies were
incorporated, “filling the gap” between the requirements and the technology maturity caused
most of the extra cost and delay.
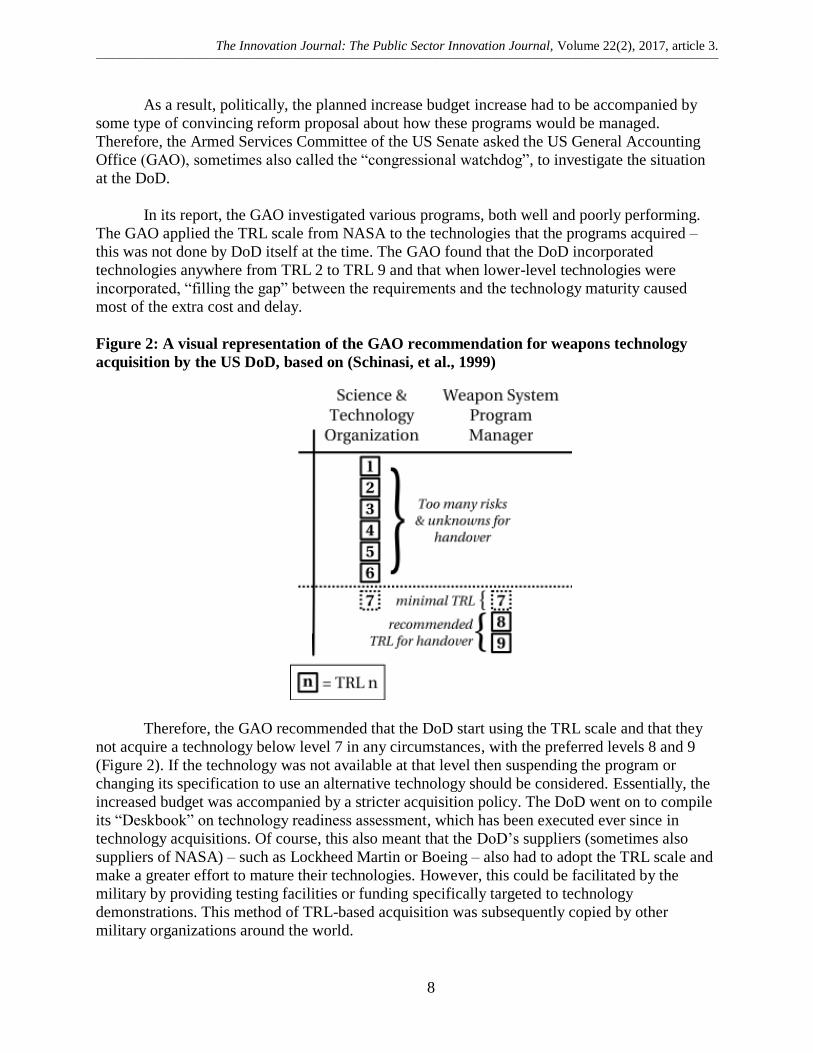
Figure 2: A visual representation of the GAO recommendation for weapons technology
acquisition by the US DoD, based on (Schinasi, et al., 1999)
Therefore, the GAO recommended that the DoD start using the TRL scale and that they
not acquire a technology below level 7 in any circumstances, with the preferred levels 8 and 9
(Figure 2). If the technology was not available at that level then suspending the program or
changing its specification to use an alternative technology should be considered. Essentially, the
increased budget was accompanied by a stricter acquisition policy. The DoD went on to compile
its “Deskbook” on technology readiness assessment, which has been executed ever since in
technology acquisitions. Of course, this also meant that the DoD’s suppliers (sometimes also
suppliers of NASA) – such as Lockheed Martin or Boeing – also had to adopt the TRL scale and
make a greater effort to mature their technologies. However, this could be facilitated by the
military by providing testing facilities or funding specifically targeted to technology
demonstrations. This method of TRL-based acquisition was subsequently copied by other
military organizations around the world.
Page 9
The Innovation Journal: The Public Sector Innovation Journal, Volume 22(2), 2017, article 3.
___________________________________________________________________________________________________________________________________________________________________________________________
9
It is important to recognize that the risks of technology transition were addressed both in
Sadin’s work (by proposing projects that are overlapping in TR levels) and by the GAO (by
prohibiting the acquisition of sub-TRL-7 technologies). As we will see, this is not the case with
the EU, which recommends financial mode switching and technology transfer at arbitrary TR
levels.
The usage of TRL at ESA and the ISO 16290:2013 standard
The TRL scale found its way to Europe through its space agency. The European Space
Agency adopted the TRL scale in the mid-2000s. Its handbook (ESA, 2008) closely follows the
NASA definition of TRLs, to the point that even NASA’s thermometer-shaped TRL figure is
reused. While the handbook does not contain a similarly sophisticated strategic planning
framework to that in the NASA ITP document, it still features a detailed description of each level
and also a workflow for technology readiness assessment. Moreover, it provides additional
information on how to use the TRL scale in software development.
ESA’s utilization of the scale led to the first occurrence of TRL in a European
Commission work program – in the Space section of the 2010 work program of the EU’s Frame
Program 7 (European Commission, 2009).
In 2013, the ISO standard 16290:2013 “Space systems – definition of the Technology
readiness Levels (TRLs) and their criteria of assessment” was released (ISO, 2013). The
structure of this standard is similar to that of the 1995 Mankins white paper in that it provides
examples for each level – in this case three examples are given for each of the 9 levels. The
standard also resembles the DoD usage of TRL because it provides elements of documented
achievements for every level, which serve as a basis for TRL assessment. Finally, the standard
relies on the ISO 10795:2011 vocabulary in definitions such as process or performance. At ESA,
ISO 16290 replaced its own internal document and is the official TRL scale definition. This has
not occurred at NASA, which continues to use the TRL scale in NASA Management Instruction
7100.
Summary of the assumptions behind TRL
This section presented not only how TRL was universally deployed as a management tool
in weapons and space industry, but also the reasoning behind it and the accompanying
assumptions. These are the following:
The Technology Readiness is an analogue to Flight Readiness. It helps decide whether to proceed with a program.
The initial aim of TRL was to enable opportunistic, technology push projects. With TRL classification it became possible to develop technologies without the clear need for that
technology in a program.
TRL was originally intended to be used as an intra-organization tool as means of
communication and risk-minimizing of internal technology handoffs.
The development cost of a technology grows exponentially towards the higher TR levels.
TRL was deployed at US DoD to regulate state spending after years of budget overrun and to enforce contractor-side and buyer-side testing.
Page 10
The Innovation Journal: The Public Sector Innovation Journal, Volume 22(2), 2017, article 3.
___________________________________________________________________________________________________________________________________________________________________________________________
10
The Usage of TRL in EU public sector innovation
The basis for the EU’s use of TRLs as a policy tool is a 2009 communication from the
European Commission titled Preparing for our future: Developing a common strategy for key
enabling technologies in the EU (European Commission, 2009).
European Commission’s Communication No. 512
This communication introduces the concept of Key Enabling Technologies (KETs).
These are depicted as foundational technologies on which industrial prowess depends. In
addition to the KET concept itself being defined, particular KETs are identified, such as
nanotechnology, advanced materials, biotechnology, micro- and nano-electronics (including
semiconductors), and photonics. The list is complemented by Communication No. 614 on
advanced manufacturing (European Commission, 2010).
Excelling at these KETs supposedly ensures economic competitiveness while also
assisting in the response to so-called “grand societal challenges”. The latter, however, are
vaguely characterized.
The important point here is that the concept of Technological Readiness Levels is widely
used in those six industries recognized as KETs by the European Commission. These industries
adopted TRLs by being in contact with governmental organizations that began to increasingly
demand the usage of the scale following the example of the US DoD.
In this interpretation, Technological Readiness Level is a metric that shows how far a
technology is from being ready for use in its intended operational environment. As seen,
originally that meant space; however, in this more abstract understanding, it appears to be
interpreted as a product’s readiness to be marketed.
The High-Level Expert Group on Key Enabling Technologies – a group established by
the EC to ensure the implementation of the KET strategy – identified the problem of the Valley
of Death as one that particularly hinders the European Union. They explained it in terms of
TRLs. The Valley of Death means that while the EU has ample results in theoretical areas – that
is, it succeeds on low TRL levels – these results do not translate to TRL 9 technologies at an
adequate rate. By switching terminology, we could state that the problem is that basic research
does not translate to applications well enough.
The final report produced by this group not only uses the TRL scale to analyse the
problem but also recommends that the scale be adopted EU-wide: “Recommendation n°2: The
EU should apply the TRL scale R&D definition. (…) The Commission should also systematically
apply this definition in order to include technological research, product development and
demonstration activities within its RDI portfolio.”
The authors do not examine the question of what conversion rate would be natural at
certain TRLs. The strategic document instead seems to aim at a conversion rate of 1 and
proposes a “three-pillar bridge” to be built into the Valley of Death. The three pillars are
“technological research”, “product demonstration”, and “advanced world-class manufacturing”.
Page 11
The Innovation Journal: The Public Sector Innovation Journal, Volume 22(2), 2017, article 3.
___________________________________________________________________________________________________________________________________________________________________________________________
11
This declaration is essentially a turn towards a more industry-driven research policy.
(Indeed, it is called “Industry Policy” in the COM documents.) The HLG group, consisting of
representatives of large industries, agreed on the importance of their industries by defining them
as Key Enabling Technologies (this article does not examine how the 6 technologies were
identified as KETs). By defining the KETs, they also imported the TRL scale, which many of
them already had had to use for some years to qualify as suppliers of ESA and various military
organizations. Therefore, the proposed universal EU-wide usage of TRLs is only a collateral,
potentially fruitful or harmful side effect (depending on how it ends up in practice) of this
industrial turn in EU strategy.
TRLs in the EU Horizon 2020 program
By 2014, the usage of TRLs was widespread but not ubiquitous in proposals for EU-
funded projects. Some chapters of the 2014-15 work program documentation of Horizon 2020
use TRLs to set boundaries for the funded projects on some topics. The definitions of the TRL
levels to be used are in General Annexes / annex G (European Commission, 2014). These differ
slightly from the NASA definitions (some differences are explained later):
TRL 1 – basic principles observed
TRL 2 – technology concept formulated
TRL 3 – experimental proof of concept
TRL 4 – technology validated in laboratory
TRL 5 – technology validated in relevant environment (industrially relevant environment in the case of key enabling technologies)
TRL 6 – technology demonstrated in relevant environment (industrially relevant
environment in the case of key enabling technologies)
TRL 7 – system prototype demonstration in operational environment
TRL 8 – system complete and qualified
TRL 9 – actual system proven in operational environment (competitive manufacturing in
the case of key enabling technologies or in space)
However, the chapters of the Work Program rely on TRLs in different ways. For
instance, the Cross-cutting activities chapter states that the implementation of the Paper-based
electronics item in the program should start at TRL 3 and target TRL 5. However, more often,
this chapter states that “Activities are expected to focus on Technology Readiness Levels 5 to 7
and to be centered around TRL 6”. The “Leadership in enabling industrial technologies” chapter
uses TRLs in a similar manner, as well as the chapter on climate change, resources, and raw
materials. The chapter on ICT and on smart and green transportation does not specify TRL
ranges for each item – rather, it uses TRLs in the general description section. The chapter on
nanotechnology consistently instructs starting projects at TRL 4-5 and targeting TRL 6.
The “Space” and “Secure, clean and efficient energy” chapters utilize TRLs in a slightly
more sophisticated way. The space chapter proposes a technology development strategy that is in
part similar to the strategy outlined in the Sadin et. al. 1989 paper. The plan in this chapter is to
develop in a “Bottom-up” manner, trying out technologies even when they are not demanded by
a specific space mission. In other words, this is a technology push approach.
Page 12
The Innovation Journal: The Public Sector Innovation Journal, Volume 22(2), 2017, article 3.
___________________________________________________________________________________________________________________________________________________________________________________________
12
The “Secure, clean and efficient energy” chapter uses TRLs in a different way. It uses
three different TRL ranges for different technologies (4-6, 5-7, 7-9) and also addresses the
problem of assessment, at least for TRL 7+ technologies.
The “Fast track to innovation” pilot also uses the TRL scale aptly. It expects projects with
TRL 7+ technology at the outset and recommends that projects aim to reach production-ready
(TRL 9) maturity.
However, the chapters on health and “Future Emerging Technologies” (FET) do not rely
on TRLs at all, showing an uneven adoption of the scale for the Work Program.
In 2015, a second HLG-KET group released its report (HLG-KET, 2015). The report
provides a snapshot of the project aiming at the re-industrialization of Europe. It explains that the
EU’s share of global manufacturing has declined since 2010-11. The report does not discuss
TRLs; it only uses them to explain which areas of the globe are strong at certain levels. It also
advocates for specific evaluation criteria for high-TRL projects to ensure the projects’ impact
and industrial exploitation. This is advancement because, as explained before, TRLs in EU
policy were introduced without assessment frameworks in every field except space technology.
Discussion
In this section the problem of the costs, the EU-s approach to risk, the lack of assessment
guidelines, sector-specific issues are discussed along with some opportunities that the adoption
of TRL creates for the EU.
TRL in EU policy: the problem of the costs
The 1991 NASA ITP document states that R&T Base projects (Research and Technology
Projects in the TRL 1-5 range) should obtain one third of the total funding, while Focused R&T
(TRL 2-7 with a deliberate multi-level overlap with R&T Base) should receive the rest. It is also
clear that the number of Base projects is significantly higher. According to the strategy, the new
projects started each year account for 15-20% of the total Base budget. Room in the budget for
these new projects is created by terminating already-running projects with the same cost. Only a
portion of these Base projects will be carried on to reach the “Focused” stage, which reaches
TRL 7, and these still consume two thirds of the cost (flight programs that adopt TRL 7 projects
and bring them to TRL 9 are even more expensive). This means that the costs are multiplied
when transitioning from TRL 5 to 6 and then again to TRL 7, as indeed is confirmed by Mankins
and at Boeing, where 90% of the total cost has been found to be spent in moving from TRL 6 to
9. Even in the first HLG-KET report, it is noted that the costs of pilot line activities are 5-10x
higher than those for other R&D activities.
However, the Fast Track to Innovation (FTI) program, which aims to fund the maturation
of technologies from TRL 6 to TRL 9, is expected to fund projects with 1-2M EUR, with a
maximum of 3M EUR and a 70% funding rate. Projects envisioned in other parts of the Work
Program are typically approximately the same size in funding but aim for TRL 4 to 6 or TRL 5
to 7 maturing, whereas the actual cost of TRL 6 to 9 projects is 10+ times higher. Therefore, the
Page 13
The Innovation Journal: The Public Sector Innovation Journal, Volume 22(2), 2017, article 3.
___________________________________________________________________________________________________________________________________________________________________________________________
13
levels of funding in the H2020 agenda are inconsistent with the levels of costs to be expected, if
the estimates were based on the history of TRL.
No Risk?
As explained in the preceding chapters, the costs of R&D at low TRL levels are a fraction
of those of high-TRL developments. In contrast, the number of low-level projects is necessarily
much higher. In other words, only a fraction of low-TRL projects reach high TRL. This
proportionality might be called the drop-out rate. The problem that the HLG addresses is that
while in Europe there are strong results in fundamental research, these are too often not
commercialized. This gap is called the valley of death. However, as seen in the case of NASA
and the DoD, in the US it is believed to be natural that technologies drop out at every TRL level.
In the NASA ITP, in the base program, 15-20% of the incumbents are terminated each year. It is
also clear from the document that these are mostly multi-year projects – during their planning,
the planners are thinking in terms of 5-year granularity. This means that a technology must
survive such purge several times. If the average time to spend in the R&D Base program were
indeed 5 years, the above dropout rate would mean that approximately 50-60% of all projects
would be dropping out between TRL 1-5.
Additionally, the GAO found that the DoD should acquire technology at TRL 8 most of
the time; otherwise, it bears the costs of unforeseen problems, including the risk that some issue
might prevent the eventual use of the technology entirely.
Establishing the average industry-specific drop-out rates at each TR level would be a
challenging research subject that is beyond the scope of this rather historical paper. However, as
a thought experiment, let us suppose that the drop-out rate at every TR level transition would be
uniformly as low as 5%; then still only 66% of the TRL 1 ideas would reach TRL 9. At 10%,
15% and 20% drop-out at each level, the figures are 43%, 27% and 17%, respectively.
The HLG-KET does not touch on this question or indeed the question of risk at all. It
appears to implicitly dismiss the possibility that the drop-out rate it is experiencing might be
natural. The drop-out rate the HLG-KET would accept is unset, and at several points it appears to
be zero as in this passage at p. 29 “(…) products arising from the demonstration phase will have
been correctly specified, they will naturally find an optimal usage value which will in turn lead
to a relevant demonstration. The return on investment of this stage is therefore de-facto
guaranteed” (emphasis added. HLG-KET, 2011: 29).
All this seems to be very problematic if we compare with the conclusions of the
literature. As the literature points it out (Wan, 2005) willingness to take risks is an important
determinant of innovativeness and public policy should encourage enterprises to take risks by
compensation with grants or more accessible funding (Wojnicka-Sycz and Sycz, 2016). This is
to the contrary of what the HLG-KET seems to be proposing: a complete elimination of risks.
No customization and no assessment guidelines
As presented earlier in this paper, NASA, the US DoD, and private corporations all
developed TRLs together with assessment guidelines, and started to perform assessments using
independent parties from the R&D team that is working on the given technology. Without a
Page 14
The Innovation Journal: The Public Sector Innovation Journal, Volume 22(2), 2017, article 3.
___________________________________________________________________________________________________________________________________________________________________________________________
14
defined set of criteria to meet at a certain level, there appear to be no undisputable way to
establish the TR level of a technology.
The need for tailoring was already noted by the EARTO organization in its TRL criticism
(EARTO, 2014) and in the second HLG-KET report to some extent. Such tailoring for specific
fields has not been performed by the EC or others in the context of EU policy; as a result,
assessment guidelines are only in place where preceding efforts created them (mainly space and
the weapons industry, as well as the software industry to some extent). The EU appears not to
utilize the various technology readiness guidelines that were developed around the world.
Sector-specific problems
As explained in the first part of this paper, TRL Scale was invented with space programs
in mind. What is special about space applications in comparison to other fields is that the
operational environment of the technology – space – is essentially unchanging. At the other end
of the spectrum we find ICT, in which technologies have to work in diverse virtual
environments. For instance, a cryptography primitive considered safe and reliable – TRL9 – at a
given time might become obsolete because of the advancement of computing resources makes it
vulnerable to brute-force attacks. For instance, the cost of finding a collision (that is, the ability
of forging one message) for a given SHA-1 hash fell to the vicinity of $100000 by 2015 at the
prices of the Amazon cloud (REF) and therefore SHA-1 is deemed obsolete. At the time of its
publication in 1993 this attack would have been practically impossible for even well-funded
nations. The reason for this is the well-known “Moore law”. So in this case a TRL9 technology
fell to the point where it is not applicable anymore (there is no TRL level to designate that),
because the change of the operational environment.
This means that assigning a TRL level to an IC Technology without designating a date on
the TRL level is an inadequate use of the TRL scheme. For example, IT technology X is at TRL
8 is virtually meaningless. IT technology X is at TRL 8 in environment Y at date D is the
minimal statement that makes sense. Clearly, the original TRL scale itself is not prepared to
handle situations like that.
Apparently the more physical the nature of a discipline, the better TRL can be applied to
it. For instance, TRL proved to be useful in manufacturing, weapons and energy technologies,
which all are close applications of the unchanging laws of physics and the relevant operational
environment is the physical world. But one field of the military technology, cyber warfare is
surely a counterexample. For another disciplines, like healthcare or services industry the
contextualization of the TRL scale is yet to be made. The reason why it is not yet been done is
probably that these fields themselves have their own ways of managing maturity and the EU-s
decision raises a new, external constraint, instead of being the result of an internal evolution.
The timing of technology handoff
The HLG-KET report and the subsequent H2020 Work Program that implements many
of its recommendations delimit funding-eligible projects in certain chapters by providing
boundaries in terms of TR levels; e.g., “at the beginning it should be at least TRL 5 and aim at
TRL 7”. What is entirely unclear in the strategy is whether technology handoff (meaning that one
group or organization hands off technology to another set of people who are acquiring it) is also
envisaged at these boundaries. The findings of the GAO and the practice of NASA are clear: The
Page 15
The Innovation Journal: The Public Sector Innovation Journal, Volume 22(2), 2017, article 3.
___________________________________________________________________________________________________________________________________________________________________________________________
15
US DoD normally acquires technology that is TRL 7-8. At NASA, technology R&D up to TRL 7
was the responsibility of the Office of Aeronautics and Space Technology (OAST), which runs
both the Base and Focused programs (at the time of the writing of the ITP document). There is
communication between the specific flight program offices at earlier stages, and sometimes there
are joint projects; however, in general, technology is handed over at TRL 7. As the GAO
concluded, technology handoff before that stage is very risky because the acquiring organization
might encounter budget multiplication and significant delays. This is because in such cases, the
acquiring organization bears the high risk associated with the middle part of the development
process. From the case of NASA, it appears that development at TRL 1 and sometimes TRL 2 –
when the technology is basically just an idea – might also occur elsewhere; however, the middle
part of the maturation, at least starting from the first practical experiments, is better performed by
the same organization up to at least TRL 7.
While it is not made explicit by the GAO report, it emerges that part of the reason why
the middle part of maturation is better handled by the same organization is that the explicit and
tacit knowledge of the party that originally developed the technology cannot be easily handed
over.
The EC implementation of TRLs does not seem to consider this problem. Instead, the
documents seem to assume that technology handoff between parties can be done at arbitrary TR
levels. The risk of doing so is that the TRL scale not only will affect the mode and source of
funding but will also be a basis for creating organizational boundaries and division of labor –
e.g., organization A works between TRL 1-6, and then organization B works on the maturation
from TRL 6-9 (demonstrations, operations) because they are funded solely to do that. Such
practice is not consistent with the studies and investigations that led to the invention of the TRL
scale in the first place, which showed that the proper level of handoff is not at the middle of the
scale.
Technology Readiness versus Commercial Readiness
The HLG-KET and the H2020 Work Program interpret the path from TRL 1 to TRL 9 as
the path from “idea to market”. However, increasing technology readiness does not mean nearing
a successful product. TRL 9 means that the system in question is proven in its operational
environment with some stretching of the scale that might include conformity to all market
regulations. However, it is not understood to mean that the product is properly branded, the
product is still fashionable, there is purchasing power present to buy the product, there is no
disruptive competition and so on – elements of market readiness. In the original HLG Report, it
is assumed that these will all be given because the high-TRL projects will be defined in the first
place by commercial parties in that know the market.
In Australia, to tackle this problem, the Commercial Readiness Index (CRI) was created
(ARENA, 2014). CRI was developed with the renewable energy market in mind but also aims to
be useful in other areas. The problem that ARENA is addressing with CRI is the risk that still
remains after a technology has achieved TRL 9. These risks concern whether successful scale-up
and commoditization will be achieved. The 6 levels of CRI measure the maturity of a technology
by the financial arrangement of its deployment. The stages are as follows:
Page 16
The Innovation Journal: The Public Sector Innovation Journal, Volume 22(2), 2017, article 3.
___________________________________________________________________________________________________________________________________________________________________________________________
16
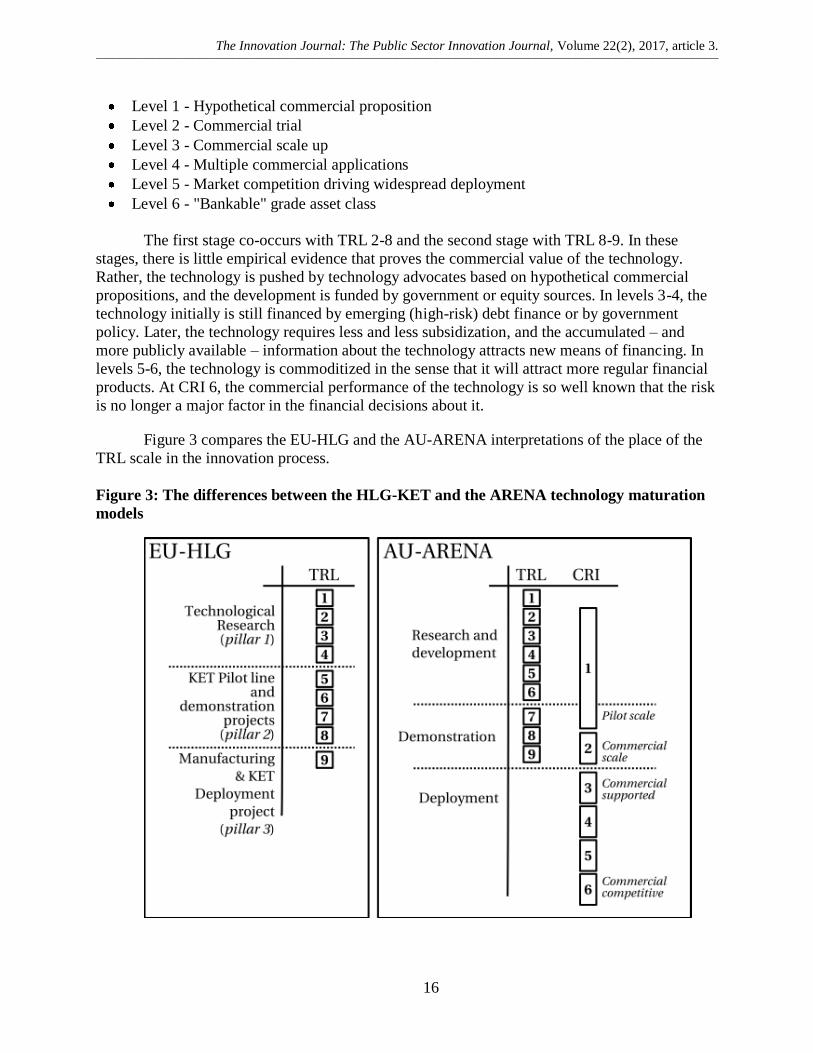
Level 1 - Hypothetical commercial proposition
Level 2 - Commercial trial
Level 3 - Commercial scale up
Level 4 - Multiple commercial applications
Level 5 - Market competition driving widespread deployment
Level 6 - "Bankable" grade asset class
The first stage co-occurs with TRL 2-8 and the second stage with TRL 8-9. In these
stages, there is little empirical evidence that proves the commercial value of the technology.
Rather, the technology is pushed by technology advocates based on hypothetical commercial
propositions, and the development is funded by government or equity sources. In levels 3-4, the
technology initially is still financed by emerging (high-risk) debt finance or by government
policy. Later, the technology requires less and less subsidization, and the accumulated – and
more publicly available – information about the technology attracts new means of financing. In
levels 5-6, the technology is commoditized in the sense that it will attract more regular financial
products. At CRI 6, the commercial performance of the technology is so well known that the risk
is no longer a major factor in the financial decisions about it.
Figure 3 compares the EU-HLG and the AU-ARENA interpretations of the place of the
TRL scale in the innovation process.
Figure 3: The differences between the HLG-KET and the ARENA technology maturation
models
Page 17
The Innovation Journal: The Public Sector Innovation Journal, Volume 22(2), 2017, article 3.
___________________________________________________________________________________________________________________________________________________________________________________________
17
Overall Readiness Level – what is the subject of TRL?
In many disciplines, like in ICT, a system consists of many different components. An
interesting question raised by theoreticians is how the overall system readiness level can be
calculated from the TRL of the components? One approach is that the overall readiness level is
the lowest of the sub-component TRLs (Bolat, 2014). This approach is based on the assumption
that the entire system is only as mature as its weakest part, or in other words that every
component is critical in producing the overall system performance.
In this respect, it is worth examining the application of TRL at NASA, where the tool
originated. From the 1989 Sadin paper, it emerges that initially a concept called technology flight
readiness was used. TRL 5 electronics could be considered ready to fly, while with propulsion
systems, TRL 7 or higher was required. In this approach, all of the sub-components were
enumerated, and the vehicle was considered to be flight-ready once all of the sub-components
reached the individual flight readiness threshold of its own category. In other words, an overall
readiness level calculation method was devised specifically for spacecraft.
Mankins, who extended the TRL scale to nine levels at NASA, has written a white paper
(Mankins, 2002) about the limitations of the TRL scale in the context of complex systems and
proposed a new scale called R&D degree of difficulty (R&D3), which appraises systems at a
“program” level. This scale is based on risk and the probability of success. Essentially, R&D3 is
measured by forecasting how many different approaches will be tried before the program reaches
its goal. This scale, however, unlike TRL, has not become a widely used tool.
Another, more profound effort to address the problem of overall readiness is the Systems
Readiness Level (SRL) metric (Sauser, et al., 2006). SRL is a 5-level scale in which at the
highest level a technology is operational and supported cost-effectively. The SRL scale is
calculated using a concept called Integration Readiness Level (IRL), which measures the
maturity of the interfacing between two technologies (themselves characterized by TRLs). Their
motivating example is the well-known case of the NASA Mars Climate Orbiter, which has been
lost because some components used the metric unit system while others used the imperial unit
system. The technologies in question were at high TRLs – separately – and yet the integrated
system failed because integration readiness is an entirely different question from technology
readiness. SRL is calculated by taking into account the individual component TRLs and the IRLs
at the interfaces.
In the EU usage, however, there is no apparent strategy regarding the problem of overall
readiness level. From the wording of the H2020 TRL levels, it is clear that the subjects of the
first three levels are theoretical entities; levels 4-6 refer to “technology”, while 7-9 switch to the
term “system”. In the NASA original, the middle levels were “components”, while from TRL 6
onwards it was “system/subsystem”. However, from the provided examples in the 1995 Mankins
white paper, it is clear that at NASA a system/subsystem is still only an element of a greater
entity, usually called a “program”. In contrast, from the HLG-KET report, it appears that at high
TRL levels the subject of TRL becomes a complete “product” (e.g., combining many different
Key Enabling Technologies); however, the problems of the methodological difference between
the TRL assessment of a single technology in contrast with an aggregate product are not
explored.
Page 18
The Innovation Journal: The Public Sector Innovation Journal, Volume 22(2), 2017, article 3.
___________________________________________________________________________________________________________________________________________________________________________________________
18
Opportunities provided by the usage TRLs for EU
The benefits of TRLs were manifold in the organizations that have been using them for
several decades. First, it appears that TRLs are useful to facilitate the communication of the
status of technology. This communication might ease collaboration in such a diverse and multi-
cultural place as the EU. The scientific and engineering education and corporate cultures are
varied – indeed, fragmented – across European countries. An EU-level terminology, promoted
by H2020 funding (and beyond), could be very significant by creating a common terminological
framework – provided that the currently lacking discipline-specific assessment frameworks are
created.
The TRL scale proved to be efficient at technology selection and procurement in the
areas where there are guidelines developed. This can be deduced from the fact that its adoption
in defense and space industries is very wide and by the lack of critical papers in this respect.
TRL provides an off-the shelf strategy of procurement for organizations by mandating
assessments and assigning the risks to the lower levels visible. In addition to supporting such
decisions, it also helps by implicitly providing a common documentation scheme for the
procured technology.
The implementations of the TRL scale in assessment guidelines explicitly promote
testing and verification. If an assessment framework is followed – one that is similar to the DoD
deskbook, for example – at each of the nine levels, theoretical or empirical tests must be carried
out and duly documented. This ninefold verification – which stems from the need for safety in
the very complex and inherently dangerous space programs – means a step-up of scrutiny for the
vast majority of the areas of innovation.
Conclusion
This paper summarized the history of the TRL scale from its creation to recent years,
when it was adopted by the EU as a tool for organizing innovation policy and funding. This
description of TRL history concentrated on how the aims of using TRL have evolved. It was
shown that as the usage of the TRL scale spread further from its original context – space
programs – its concreteness and sophistication gradually diminished.
As an intra-organization technology categorization and strategy helper tool, it was used to
enable a technology push strategy, manage risk, assess technologies by independent parties by
providing guidelines, and safely hand off and procure technologies. However, the policy
documents of the EU do not contain a strategy to combine technology push and program pull. In
fact, it appears that the goal is to implement an innovation value chain that enables the
maturation of technologies all of the way from TRL 1 to 9. In the current EU strategy, the
projects along this maturation should always “showcase” the eventual exploitation
(demonstrating some type of market pull) of their results, and it appears that the risk of
technology drop-out – which might concern a substantial portion of the technologies - is not
acknowledged.
Page 19
The Innovation Journal: The Public Sector Innovation Journal, Volume 22(2), 2017, article 3.
___________________________________________________________________________________________________________________________________________________________________________________________
19
The problems of technology hand-off – its timing in terms of TRL and the control of it in
terms of assessment guidelines – are also not addressed in by the policy documents. The usage of
the TRL scale in technology procurement in areas other than space and weapons technology
appear to be problematic because there are no assessment guidelines agreed upon.
Additionally, with the introduction of TRL as an innovation policy tool to areas where
there are no established TRL best practices raised some practical problems. There is a debated
question as to how to calculate the TR level of a system that has parts at different TR levels.
Furthermore, because TR level is to be understood in the context of a certain application, a
technology has multiple TR levels concurrently because it has multiple applications.
The drive towards “re-industrialization” of the EU is motivated by the numbers presented
in the second HLG-KET report. It appears that the EU’s share of manufacturing declined
between 2000 and 2013, and the number of patents stagnated, while other areas of the globe
achieved gains. A similar trend applies for the figures in investment. In theoretical research, US
universities are still dominant, and in manufacturing Asia has the lead, while the EU is only
strong at the middle TRL levels because of its research and technology organizations. The HLG-
KETs intuition seems to have been leading them to the conclusion that industry must enjoy
priority in the upcoming funding cycle, but as the literature points out (Wojnicka-Sycz and Sycz,
2016) the industrial strength is only one out of many determinants of innovation (like supply of
scientists and engineers, innovative milieu, business-academic links, proximity of suppliers, etc).
Eventually, a change in strategy, a turn toward industry was proposed and the TRL scale
was a part of the HLG-KET proposal. This paper aimed to show by examining the history of
TRL that its introduction as a general ruler in EU innovation policy also meant a gradual loss of
sophistication and content, which raises questions about the consistency of this strategy. This
article concluded that there is a high risk that the current implementation of TRL scale in
European Policy will be detrimental. This statement is based on the fact that the EU’s take on
TRL is rather superficial, and the goal sought - elimination of risk - is both unattainable and
undesirable according to the literature.
Further work is needed in several areas. First, a deeper understanding of realistic goals
for EU innovation is necessary, as the elimination of risky basic research – a goal set out by the
HLG-KET – seems to be irrational. Second, development of discipline-specific TRL assessment
handbooks is necessary. Finally, currently very little information is available about the cost of
progress in function of the TR level. Available information shows that at the higher TR levels,
costs grow exponentially. However, there could be huge discipline-specific differences in this.
The lack of information on costs makes establishing the right level of funding guesswork, which
is clearly detrimental to EU innovation.
About the Author:
Mihály Héder is an Associate Professor at Eötvös Lóránd University and a Research
Fellow at Hungarian Academy of Sciences Institute for Computer Science and Control. He holds
an MSc degree in Computer Science and a PhD in Philosophy. His main area of research is the
Philosophy of Technology, including Artificial Intelligence, Social Constructivism, Engineering
Page 20
The Innovation Journal: The Public Sector Innovation Journal, Volume 22(2), 2017, article 3.
___________________________________________________________________________________________________________________________________________________________________________________________
20
Methodology and Innovation. He has been a practitioner of R&D in the area of Information
Technology in the last 15 years, providing him a first-person experience in the Engineering
Process.
References:
ARENA (Australian Renewable Energy Agency). 2014. “Commercial Readiness Index for
Renewable Energy Sectors”. Accessed July 20, 2017 at:
http://arena.gov.au/files/2014/02/Commercial-Readiness-Index.pdf
Banke, J. 2010. “Technology readiness levels demystified”. Accessed July 20, 2017 at:
http://www.nasa.gov/topics/aeronautics/features/trl_demystified.html
Boehm, B. W. 1988. A spiral model of software development and enhancement. Computer,
21(5): 61-72.
Bolat, S. 2014. “Technology Readiness Level (TRL) math for innovative SMEs”. Accessed July
20, 2017 at: https://serkanbolat.com/2014/11/03/technology-readiness-level-trl-math-for-
innovative-smes/
DoD (Department of Defense). U. S. 2009. Technology Readiness Assessment (TRA) Deskbook.
Washington, WA: Prepared by Deputy Undersecretary of Defense for Science and Technology
(DUSD (S&T)).
EARTO (European Association of Research and Technology Organisations). 2014. “The TRL
Scale as a Research & Innovation Policy Tool”. Accessed July 20, 2017 at:
http://www.earto.eu/fileadmin/content/03_Publications/The_TRL_Scale_as_a_R_I_Policy_Tool
_-_EARTO_Recommendations_-_Final.pdf
ESA (European Space Agency). 2008. “Technology Readiness Levels Handbook For Space
Applications”. Accessed July 20, 2017 at:
https://artes.esa.int/sites/default/files/TRL_Handbook.pdf
European Commission. 2009. “COM 512:Preparing for our future: Developing a common
strategy for key enabling technologies in the EU”. Accessed July 20, 2017 at:
https://ec.europa.eu/digital-single-market/sites/digital-agenda/files/COM%282009%29512.pdf
European Commission. 2009. “Space Work Programme 2010”. Accessed July 20, 2017 at:
http://ec.europa.eu/research/participants/data/ref/fp7/89281/j-wp-201101_en.pdf
European Commission. 2010. “COM 614: An Integrated Industrial Policy for the Globalisation
Era - Putting Competitiveness and Sustainability at Centre Stage”. Accessed July 20, 2017 at:
http://ec.europa.eu/transparency/regdoc/rep/1/2015/EN/1-2015-614-EN-F1-1.PDF
European Commission. 2014. “Technology readiness levels (TRL)”. Accessed July 20, 2017 at:
Page 21
The Innovation Journal: The Public Sector Innovation Journal, Volume 22(2), 2017, article 3.
___________________________________________________________________________________________________________________________________________________________________________________________
21
http://ec.europa.eu/research/participants/data/ref/h2020/other/wp/2016_2017/annexes/h2020-
wp1617-annex-g-trl_en.pdf
HLG-KET (High-Level Expert Group on Key Enabling Technologies). 2011. “Final report”.
Accessed July 20, 2017 at:
http://ec.europa.eu/DocsRoom/documents/11283/attachments/1/translations/en/renditions/native
HLG-KET (High-Level Expert Group on Key Enabling Technologies). 2015. “Final report -
KETs: Time to Act”. Accessed July 20, 2017 at:
http://ec.europa.eu/transparency/regexpert/index.cfm?do=groupDetail.groupDetailDoc&id=2211
3&no=2
ISO (International Organization for Standardization). 2013. “Space systems — Definition of the
Technology Readiness Levels (TRLs) and their criteria of assessment”. Accessed July 20, 2017
at: http://www.iso.org/iso/catalogue_detail.htm?csnumber=56064
Johnson Space Center. 1997. A History of U.S. Space Station. Houston, TX: NASA (National
Aeronautics and Space Administration).
Kinnaird, M., L. Early & B. Schofield. 2003. Defence Procurement Review 2003. Canberra:
Department of the Prime Minister and Cabinet.
Lord, D. R. 1970. Advanced Technology Requirements. Paris, France: NASA (National
Aeronautics and Space Administration).
Mankins, J. C. 1995. “Technology readiness levels”. Houston, TX: NASA (National
Aeronautics and Space Administration). Accessed July 20, 2017 at:
http://www.hq.nasa.gov/office/codeq/trl/trl.pdf
Mankins, J. C. 2002. Approaches to strategic research and technology (R&T) analysis and road
mapping. Acta Astronautica, 51(1): 3-21.
Mankins, J. C. 2009. Technology readiness assessments: A retrospective. Acta Astronautica,
65(9): 1216-1223.
Nolte, W. L. 2008. Did I ever tell you about the whale?, or, Measuring technology maturity.
Charlotte, NC: Information Age Publishing.
OAST (Office of Aeronautical and Space Technology). 1991. Integrated Technology Plan for
the Civil Space Program. Houston: NASA (National Aeronautics and Space Administration).
Reagan, R. 1988. Presidential Directive on National Space Policy 11. Washington DC: The
White House.
Sadin, S. R., Povinelli, F. P. & R. Rosen. 1989. The NASA technology push towards future
space mission systems. Acta Astronautica, 20: 73-77.
Page 22
The Innovation Journal: The Public Sector Innovation Journal, Volume 22(2), 2017, article 3.
___________________________________________________________________________________________________________________________________________________________________________________________
22
Sauser, B., Verma, D., Ramirez-Marquez, J. & R.Gove. 2006. From TRL to SRL: The concept of
systems readiness levels. Los Angeles, CA: Conference on Systems Engineering Research.
Schinasi, K. V. et al. 1999. Best Practices - Better Management of Technology Development Can
Improve Weapon System Outcomes, Washington: General Accounting Office (GAO).
Space Task Group, 1969. The Post-Apollo Space Program: Directions for the Future, Houston:
NASA.
Stevens, M., Karpman P., & Th. Peyrin. 2016. Freestart collision for full SHA-1. Annual
International Conference on the Theory and Applications of Cryptographic Techniques. Springer
Berlin Heidelberg.
Wan, D., Ch. Haut Ong & F. Lee. 2005. Determinants of Firm Innovation in Singapore,
Technovation, 25(3): 261-268.
Whelan, D. 2008. Impact of Technology Readiness Levels on Aerospace R&D. Washington:
Department of Energy.
Wojnicka-Sycz, E., & P. Sycz. 2016. Public Innovation Policy and Other Determinants of
Innovativeness in Poland. The Innovation Journal: The Public Sector Innovation Journal, 21(3),
article 1.
Page 23
The Innovation Journal: The Public Sector Innovation Journal, Volume 22(2), 2017, article 3.
___________________________________________________________________________________________________________________________________________________________________________________________
23
Appendix I: Glossary
ARENA: Australian Renewable Energy Agency;
ART: Advanced Research Technology;
CSTI: Civil Space Technology Initiative (USA);
DoD: Department of Defense (both in USA and Australia);
EC: European Commission;
EP: European Parliament;
ESA: European Space Agency;
EU: European Union;
FET: Future Emerging Technologies;
GAO: Government Accountability Office (USA);
HLG-KET: High Level Expert Group on Key Enabling Technologies;
ICT: Information and Communication Technologies;
ISO: International Standards Organization;
ITP: Integrated Technology Plan (NASA);
NASA: National Aeronautics and Space Administration (USA);
OAST: Office of Aeronautical and Space Technology (NASA);
R&D: Research and Development
SRT: Supporting Research Technology;
TRL: Technology Readiness Levels.