Abstract-- Congestion management schemes have taken a
prominent place in current electricity market design discussions. In this paper, the implications of establishing zonal pricing in Europe are analyzed with regard to potential zonal delimitations and associated effects on total system costs. Thereby, a nodal model sets the benchmark for efficiency and provides high-resolution input data for a cluster analysis based on Ward’s minimum variance method. The proposed zonal configurations are tested for sensitivity to the number of zones and structural changes in the electricity market. Furthermore, dispatch and redispatch costs are computed to assess the costs of electricity generation and transmission. The results highlight that suitable bidding zones are not bound to national borders and that losses in static efficiency resulting from the aggregation of nodes into zones are relatively small.
Index Terms-- Cluster Analysis, DC Load-Flow, Electricity
�� cluster i �� sum of squared Euclidean distances of cluster i �� price vector of node n ��� mean vector of prices in cluster i �� possible cluster set at clustering step k �,� binary parameter indicating neighboring nodes n, m �� critical distance at clustering step N total number of nodes �� mean of �� �� standard deviation of ��
II. INTRODUCTION AND LITERATURE REVIEW
n the way to the internal electricity market (IEM) special attention is paid to possible advancements in congestion
management schemes. Important improvements have already
This work is supported by a PhD sponsorship of the Foundation for
Research on Market Design and Energy Trading FORMAET. * B. Burstedde is with the Institute of Energy Economics at the University of Cologne (EWI), Vogelsanger Str. 321, 50827 Koeln, Germany (e-mail: [email protected]).
been made by the successive introduction of implicit auctions of transmission capacities (see e.g. the Central Western European (CWE) market coupling between France, the BeNeLux and Germany). Following this process, the scope of the discussion has broadened to include national transmission networks as well.
In the recently published Framework Guidelines on Capacity Allocation and Congestion Management for Electricity (CACM, [1]) the Agency for the Cooperation of Energy Regulators (ACER) explicitly recommends the definition of zones (bidding areas) whose implementation is meant to support adequate congestion management and to contribute towards locational price signals. Thereby, the zonal delimitations shall be proposed by the transmission system operators (TSOs) and may span one or more control areas in case no significant congestion occurs within or between areas.
However, the CACM guidelines do not clarify at which degree of congestion a bottleneck qualifies as significant. Instead, ACER defines “overall market efficiency” as the main principle in the definition of zones, including aspects of “socio economic welfare, liquidity, competition, network structure and topology, planned network reinforcement and redispatching costs” (cf. [1], p. 7). Especially, the TSOs’ analysis of zonal delimitations shall be based on detailed data on redispatching costs and structural congestion.
Relevant criteria for the evaluation of zonal market configurations are also discussed in [8] and [22]. In [8], the consequences of a potential division of the German-Austrian bidding zone are analyzed with regard to technical and economic implications. The mainly qualitative evaluation covers changes in market concentration, liquidity and transactions costs as well as in static and dynamic market efficiency and is based on a hypothetical division of today’s market zone into two separate areas along the most critical bottleneck observed in the year 2009. Thereby, congestion arises at 10% of the hours of the year. Reference [22] introduces further criteria for the choice of bidding zones such as the direction of the wind power flow and a coincidence of zonal boundaries with physical congestion points. Finally, a zonal configuration is proposed which divides the European market into 45 zones. Thereby, Germany, the BeNeLux countries, France, Austria and Switzerland are assigned to 11 zones.
A stronger focus on quantitative measures is put in [21], [23] and [2]. In [21], the author states that the definition of zones should be based on nodal price differences which
From Nodal to Zonal Pricing: A Bottom-Up Approach to the Second-Best
comprise all relevant information on network related costs. This is underlined by the findings in [19] which show that the loss in welfare by creating uniformly priced zones despite internal congestion is proportional to the squared error in the uniform prices. In [9], the decrease in welfare induced by implementing a single price zone instead of nodal pricing is quantified for the English and Welsh system as 1.3% of the generators’ revenues. Reference [23] thus combines statistical test for price uniformity with information from practical experience to identify zones, but does not formalize a method to test the results’ adequacy. In [2], the authors show that absolute differences in nodal prices do not yet provide an adequate basis for the definition of zones since similar price differences may lead to variations in the optimal zonal configurations in different scenarios. Thus, cluster analysis is suggested as one possible methodological refinement.
Cluster analysis is i. a. used in [17] and [25]. Authors in [17] apply two clustering methods, Autoregressive Kohonen Maps and the k-means algorithm, to a set of power transfer distribution factors (PTDF) due to a lack of information needed for nodal computations. PTDFs give the relative impact of a marginal change in the net input of a node on any given line in the system and therefore do not reflect all relevant information on the structure of the electricity system. In [25], a set of potentially congested lines is identified by the means of probability analysis. Then, sensitivities of nodal power injections to the flows over the congested lines are computed and used as a substitute for nodal prices in a fuzzy c-means cluster analysis.
The research presented in this paper develops a set of market zones for the CWE region, Switzerland and Austria for both 2015 and 2020 on the basis of hourly nodal prices and a hierarchical cluster analysis. Knowing that zonal pricing is in general the second-best solution to enhancing efficiency (see e.g. [13]), the error made in aggregating nodes into zones is reduced by including as much information on the (spatial) market structure as possible. The underlying methodology is introduced in section III. while section IV. describes the data basis and relevant assumptions. In section V. the results of the nodal model and the zonal aggregation are discussed. In order to challenge the newly defined market zones, their dispatch and redispatch is calculated. Thus, the change in total system costs by switching from the first-best nodal solution to a zonal system is quantified. Some implications of the gained insights are given in section VI..
III. M ETHODOLOGY
The derivation of market zones and the subsequent evaluation of total system costs are based on two methodological building blocks. The NEULING Model optimizes the European (re-)dispatch for given nodal and zonal configurations, while the latter result from cluster analysis subject to a minimum variance criterion.
A. The NEULING Model
The New European Linear Investment and Grid Model (NEULING, cf. [3]) calculates the cost-minimal generation
dispatch and redispatch of a given power plant portfolio for 8760 hours of a year. The high temporal resolution allows for the consideration of general structural patterns such as seasonal variations in load as well as of extreme events. Thus, an adequate data base for the later cluster analysis is generated.
1) Dispatch and DC-Load-Flow: The spot market dispatch of conventional power plants is determined such that the residual demand (exogenous system demand including network losses less electricity produced by renewable energy sources (RES-E) and less must-run generation from combined heat and power plants) is met in each hour. Furthermore, the demand for positive and negative balancing reserve needs to be covered. The conventional power plant fleet including hydro storage (Hyd-S), pumped storage (Hyd-PS) and compressed air energy storage (CAES) plants is grouped into 25 so-called vintage classes according to primary fuel, age and technological characteristics such as efficiency. Each vintage class is then dispatched under consideration of variable and ramping costs, as well as minimum- and part-load restrictions.
The cost-minimal nodal dispatch is subject to network restrictions implemented by a DC power flow model as introduced in [20] and applied e.g. in [15]. The DC power flow gives an approximation of the physical flows over the high-voltage alternating current transmission network in the so-called core model region (cf. [20] for the derivation of the DC model and [10] for a discussion on optimal power flow models). Thereby, both losses as well as reactive power are neglected in order to keep the problem linear. The lines’ physical capacities are standardized and multiplied with a factor of 0.8 in order to account for a security margin. Furthermore, interconnectors to and in between so-called satellite regions are implemented by the use of net transfer capacities (NTC).
2) Redispatch: The basic spatial resolution of NEULING gives a nodal representation of the core model regions. Depending on the object of investigation, the nodes can be aggregated into zones. Although the zonal dispatch assumes internal copperplates, the information on the nodal net injections is preserved. Thus, the usage of the internal grid can be determined ex-post and the necessary redispatch in case of violations of network constraints can be calculated based on the plants’ operating status and their utilization.
The optimal flow-based redispatch is represented by the least-cost combination of upward and downward ramping, which at the same time relieves the overloaded line and keeps the balance between demand and supply at each node. The marginal costs of a plant’s upward redispatch are given by its variable fuel and ramping costs, while the marginal savings of its downward redispatch equal the avoided costs of generation. This setup corresponds to a cost-based mechanism in which the generators are either compensated or charged as to render them indifferent with regard to being redispatched.
In theory, the nodal injections after cost-based redispatch correspond to those of the optimal nodal dispatch if no restrictions on technical flexibility apply and the plants’ cost functions are identical in dispatch and redispatch (cf. [12]). In
this case, the total costs of both designs are equal. However, this assumption is not trivial. Due to the time lag between day-ahead dispatch and redispatch the technical restrictions on the latter are tighter, thus increasing the variable costs of generation. Furthermore, intraday trade requires costly adjustments of the redispatch schedule on short notice.
In the presented approach, redispatch is priced with the hourly variable costs of the dispatch. Furthermore, the same technical flexibility as in the dispatch is assumed, with the exception of limiting quick starts of non-spinning units to open cycle gas turbines (OCGT) and hydro power. Both assumptions underestimate the true costs of redispatch by trend. However, redispatch is modeled by the hour such that ramping costs are overestimated in comparison to an intertemporal optimization. This is especially true if structural congestion requires continuous redispatch.
B. Cluster Analysis
In multivariate statistics, cluster analysis is used to group variables with multiple observations according to the variables’ similarity. Two prominent model-classes are connectivity-based and centroid-based clustering, which differ in their basic definition of similarity (refer to [11] for an introduction). Connectivity models rely on metrics such as Euclidean distances between the variables’ observations to identify clusters in a hierarchical process. Thus, clusters are merged in the order of increasing distances (agglomerative clustering) or split in the order of decreasing distances (divisive). As a result, the number and composition of clusters are given subject to critical distance levels. Hierarchical models are complemented by various algorithms which allow for different linkage criterions. The best choice of an algorithm finally depends on the structure of the given data set. Instead of explicitly evaluating distances between variables, centroid-based clustering defines cluster centers and measures the distance of the data points to the centers. Each variable is then grouped to the nearest center, which is not necessarily an element of the original data set. Most of the associated heuristic k-means algorithms require an ex-ante specification of the number of cluster centers k, whose location is then optimized. Furthermore, the result depends on the given starting points of the centers’ locations.
Since the goal of the presented research is to identify structural differences between price regions as well as the loss of information produced by merging zones, the leaps in critical distance levels between clustering steps is a valuable information which is easily provided by agglomerative hierarchical methods. Furthermore, the desired number of price zones cannot be specified beforehand. Thus, the continuous computation of optimal clusters for each possible level of aggregation provides the complete range from which to choose in one model run. In consequence, a hierarchical model is applied.
The input data for the cluster analysis is provided by NEULING and consists of 8760 observations of marginal costs of generation for each node. Since an aggregation of nodes is supposed to yield homogeneous zones in terms of absolute
height of and variation in marginal costs, Ward’s minimum variance criterion [24] is implemented. At each clustering step, the algorithm merges two classes such that the resulting increase in in-cluster variance is minimal. At the beginning of each step, the sum of squared Euclidean distances �� between the price vectors �� of each node � that belongs to the i th cluster �� and the cluster’s mean vector ��� is calculated:
�� � ∑ ��� � ����′������� � ����. �1�
�� is thus a measure for the homogeneity of a cluster and is equal to zero at the starting point where every node forms a separate cluster. The measure for the quality of the complete cluster set is given as the sum of �� over all classes i. In consequence, the optimal configuration of clusters is chosen as the combination that yields the minimal decrease in quality:
min� ∆ � ∑ �����
� ∑ �""�� #$ �2�
where �� is a feasible cluster set at the kth stage of the algorithm. Thereby, only combinations of neighboring nodes give valid clusters. The latter restriction is implemented in an additional constraint that includes a binary parameter �,� which is equal to 1 if the nodes n and m are adjacent.
The result of the hierarchical clustering can be further evaluated by analyzing the critical distances at which two clusters are merged. These distances are denoted by ��, where � 1, … , ' � 1 is the index of the agglomerative clustering step and N is the total number of nodes. Reference [18] proposes a benchmark based on the normalized measure
�(� � � )�*
+, �3�
which increases monotonically over k and where �� is the mean over all �� and �� is the standard deviation of ��. Based on simulations, [16] recommend to choose the previously optimized cluster set containing ' . 1 � clusters, where k is determined by the index of the first cluster step at which �(� / 1.25 holds.
IV. DATA AND PARAMETERIZATION
The regional coverage used in the model runs is given in Fig. 1. Colored in yellow are the core regions Austria, Switzerland, Germany, the Netherlands, Belgium and France. These regions are divided into 72 basic regions, which each represent one node of the DC network. The shape of the regions is chosen to best reflect the grid structure, but also considers the boundaries of national administrative areas. Countries given in blue in Fig. 1 are modeled as national, one-node regions.
The network structure as well as relevant technical parameters such as line resistance, reactance and capacity are provided by the Institute for Energy Systems, Energy Efficiency and Energy Management at TU Dortmund University. Planned grid extensions are considered on the basis of the Ten Year Network Development Plan provided by the European Network of Transmission System Operators for Electricity (ENTSO-E). In total, NEULING’s DC load-flow simulates the optimal power flow between 79 nodes via 434 lines (2015) and 446 lines (2020) respectively. Additionally,
the NTC values of interconnectors to and between satellite regions are implemented according to ENTSO
Fig. 1. Regional coverage of NEULING.
The power plant database of the Institute of Energy Economics at the University of Cologne (coded data of the existing and planned Europeangeneration capacities, including expected dedates. The installed capacities per main technology on a national level in Table II. Fuel and COassumptions are based on [6] and given in
TABLE III FUEL AND CO2 PRICE ASSUMPTIONS
The data on conventional plants is supplemented by location-specific capacities of renewable energy sourcescore regions which have been researched for the purpose of this study. The location of today’s capacities, regional potentials and historic regional developments arallocate the forecasted installations given in the EUNational Renewable Energy Action Plans (NREAP). Total electricity production from RES also corresponds to the values given in the NREAP. The feed-in structure of wind and solar power is derived from locational hourly data on wind speeds and solar radiation provided for the year 2008
International Conference on the European Energy Market (EEM) · 10-12 May 2012 · Florence, Italy
o and between satellite ENTSO-E.
the Institute of Energy Economics at the University of Cologne (EWI) provides geo-
European conventional , including expected decommissioning
technology are given Fuel and CO2 price
and given in Table III.
SSUMPTIONS
is supplemented by
specific capacities of renewable energy sources for all core regions which have been researched for the purpose of
of today’s capacities, regional potentials and historic regional developments are used to allocate the forecasted installations given in the EU-wide National Renewable Energy Action Plans (NREAP). Total electricity production from RES also corresponds to the values
in structure of wind and solar erived from locational hourly data on wind speeds
and solar radiation provided for the year 2008 (cf. Fig. 4).
Thus, the concurrence of power generation between regions and between RES-technologies is consistent.
Regional load data is derived from electricity demand or population and its future development. Total demand includes network losses and is assumed according to [5]. Aggregatedgiven in Table V.
Fig. 4. Regional wind speeds onshore and global solar irradiation.
V. R
In the following section, the results of cluster analysis are presented. Although the focus is on the results for 2015, the stability of the results is controlled for by a comparison with calculationsto the CACM guidelines, which propose a regular asseof zonal delimitations every two years. Regarding the effort of market participants to prepare for changes in zonal definitions, [8] suggest a time frame ofmodifications. Furthermore, an auxiliary scenario in which a flow-based market coupling of national copperplates is implemented provides a further benchmark.
A. Nodal Dispatch
As a first result of the nodal dispatch calculation, the generation mix for the year 2015 is given incore and satellite model regions.
Thus, the concurrence of power generation between regions technologies is consistent.
derived from information on regional electricity demand or population and its future development. Total demand includes network losses and is assumed
. Aggregated data on RES and demand is
Regional wind speeds onshore and global solar irradiation.
RESULTS
In the following section, the results of NEULING and of the cluster analysis are presented. Although the focus is on the results for 2015, the stability of the results is controlled for by a comparison with calculations for the year 2020. This relates to the CACM guidelines, which propose a regular assessment of zonal delimitations every two years. Regarding the effort of market participants to prepare for changes in zonal definitions,
suggest a time frame of five years between those modifications. Furthermore, an auxiliary scenario in which a
based market coupling of national copperplates is a further benchmark.
As a first result of the nodal dispatch calculation, the generation mix for the year 2015 is given in Fig. 6, both for core and satellite model regions. The characteristics of the
respective national power plant fleets translate in deviations in the use of primary fuels.
Fig. 6. Annual electricity generation in the year 2015 per technology.
Table VII gives an overview of the weighted average marginal-cost-based prices in 2015, both for the nodal model and the national copperplates (CU). In each case, the marginal prices comprise generation- and network-based costs. The only difference between the calculations consists in the assumptions concerning the transmission capacities between the core regions. In the nodal model, the full network as described in chapter II is implemented. In contrast, the underlying assumption in the national model is that network capacities within countries are abundant.
TABLE VII AVERAGE MARGINAL COSTS (AMC) OF ELECTRICITY SUPPLY IN 2015
The comparison of average marginal costs shows that on a national level marginal costs of supply are by trend lower in the CU than in the nodal model. In the given set-up, these results are straight forward: Since the CU computation is less restrictive, the market coupling allows for the realization of greater efficiency gains from international trade. The further implications of this result are twofold. First, it shows the social benefit of network extensions (but not the cost). Second, it proves that evaluations of total costs of electricity supply are never complete without assessing the costs of congestion.
Getting back to Table VII, the results draw attention to the differences in the regional distribution of marginal costs (and ultimately in producer and consumer rents) between the national and the nodal model. While on a national level the average marginal costs (AMC) of electricity supply are mostly lower in the CU calculation, average marginal prices at some locations in the nodal case undercut the former. On the one hand, this is due to the fact, that locational marginal prices reflect the flow-based effect of a change in the nodal net-input on congested lines. In case the effect is relieving, the node’s marginal network costs are negative and reduce the overall price. And analogously, a congestion aggravating effect is associated with positive costs. Both kinds of externalities are ignored in the CU case. On the other hand, differences in marginal prices reflect variations in the generation mix at each
node including the contribution of RES, as well as locational demand. In consequence, the difference between the overall maximum AMC (Vierverlaten, NL) and their minimum (Tauern, AT) amounts to 12.57 €/MWh. While the generation in Tauern is exclusively hydro-based, the only power plants available at Vierverlaten are gas-fired. Additionally, Vierverlaten is a net-importing node with a disadvantageous position in the network. Nonetheless, the highest in-country difference is observable in Austria (10.24 €/MWh) because of the steep increase in the national merit order between the dominating hydro and gas-fired technologies.
The analysis of the DC power flows and the utilization of the transmission network shows that 54 out of 390 lines in or between core regions are subject to congestion in the course of the modeled year 2015. Congestion is hereby referred to as a 100% rate of utilization of the lines’ capacity after the reduction by the security margin. The lines’ average utilization amounts to 45%, whereas congestion of at least one of these lines occurs in 82% of the hours of a year. The most critical line is found to be the connection between Vierverlaten (vide supra) and Eemshaven in the Netherlands, which is congested in 57% of the hours and has an average rate of utilization of 83%. Eemshaven is a small but important node to which a 700MW high voltage direct current line to Norway is connected and an average of 400MW of offshore wind power is fed in per hour. Not surprisingly, Eemshaven accounts for an average net input into the network of 1.240 MWh. 11 of the said 54 lines are interconnectors between countries, which have an average utilization of 45% and of which at least one is congested in 58% of the time. In consequence, no clear differentiation between national and international congested lines can be made.
TABLE IX AVERAGE MARGINAL COSTS (AMC) OF ELECTRICITY SUPPLY IN 2020
The results for 2020 do not show significant changes in the generation mix but mainly changes in the absolute amounts of electricity produced. The resulting changes in the marginal costs of supply are noticeable both in height and regional development. First, the average marginal price of electricity rises noticeably in the core regions. Furthermore, Tauern does no longer account for the least marginal cost but observes a rise of 15€/MWh between the model years. The associated rise in the average marginal costs in Austria is the strongest among all core regions which is due to the rise in exports which requires a higher utilization of costlier lignite and gas-based technologies and also increases the opportunity costs of hydro production. In contrast, the in absolute terms stronger increase in French exports does lead to a smaller increase in AMC since the slope of the national merit order is less steep. Overall, Le Havre, which is an important node with regard to
-50,000
0
50,000
100,000
150,000
200,000
250,000
300,000
AT CH DE NL BE FR ES GB DK-WDK-E NO SE PL CZ HU SI IT
the connection of French offshore wind power plants, shows the lowest average marginal prices.
B. Cluster Analysis
Both the hourly locational marginal prices computed for 2015 and 2020 serve as an input for two runs of the clustering model described in chapter III. The result of the model is a tree or dendrogram which illustrates the successive grouping of nodes into clusters, starting with 72 singleending with one all-encompassing cluster.the dendrogram is dominated by groupings of German nodes which exhibit the smallest in group variance. Furthermore, the first Dutch and the first Austrian nodes are clusteAlthough this result shows a preferred grouping of small nodes at the first stages which is due to the structural similarities within limited geographical areas, the first major French nodes (Paris, Le Havre and Avoine) are also clustered during the first 19 steps of the algorithm.that the relatively rough division of France into nodal areas is justified. After half of the clustering steps, the cluster size is still heterogeneous. Nonetheless, several big clusters are already observable, e.g. Eastern Germany (8 nodes), NorthWest Germany (8) and Northern France (4 nodes)Furthermore, the first cross-border cluster connected (11.1 GW) nodes Herbertingen (DE), Buers (AT), Westtirol (AT) has been formed. After ¾ of the clsteps the dominant cluster comprises a corridor of from Central Germany to parts of the Netherlands.significant groups are formed by nodes of Eastern Germany (8), Southern Germany, Switzerland and Austria (8), the Netherlands and Belgium (6), NorthSouthern France (5) and Eastern Switzerland (4).
The differences in the quality of the clusters between the clustering stages (cf. (2)) increases exponentially with the number of steps. Nonetheless, the test for the statoptimal number of clusters (cf. (3)) determines a small number of six zones as the optimal configuration for the number of countries included in the core regions, except that the cluster analysis does not follow national borderscut of the dendrogram at this stage shows 4 big clusters and two single-node zones, namely Tauern (AT) and Vierverlaten (NL). As discussed in the previous sectionexhibit the lowest and the highest overall average marginal costs respectively. Thus, the cluster algorithm does not merge these nodes with other clusters until the (Tauern) and fourth to last step (Vierverlaten). extreme imbalance in the number of nodes per zone likely constitutes a political no-go, the two nodes are added to the respective neighboring zone with the best network connection. In return, other clusters are split. This method is problematical for two reasons. First, the optimal splitting of clusters may produce new single-node zones asteps of the clustering have to be reversed, the more outliers by tendency appear. Second, the inefficiency created by the inclusion of extreme nodes is especially high (cf. chapter II and [19]). Nonetheless, the strategy is kept for now and leads to the six zones given in Fig. 10. Thereby,
International Conference on the European Energy Market (EEM) · 10-12 May 2012 · Florence, Italy
the connection of French offshore wind power plants, shows
marginal prices computed for 2015 and 2020 serve as an input for two runs of the clustering
The result of the model is a the successive grouping
single-node zones and encompassing cluster. The first quarter of
the dendrogram is dominated by groupings of German nodes which exhibit the smallest in group variance. Furthermore, the first Dutch and the first Austrian nodes are clustered. Although this result shows a preferred grouping of small nodes at the first stages which is due to the structural similarities within limited geographical areas, the first major French nodes (Paris, Le Havre and Avoine) are also clustered
irst 19 steps of the algorithm. The latter indicates vision of France into nodal areas is
justified. After half of the clustering steps, the cluster size is still heterogeneous. Nonetheless, several big clusters are
rvable, e.g. Eastern Germany (8 nodes), North-) and Northern France (4 nodes).
border cluster of the well connected (11.1 GW) nodes Herbertingen (DE), Buers (AT),
After ¾ of the clustering corridor of 12 nodes
from Central Germany to parts of the Netherlands. Other significant groups are formed by nodes of Eastern Germany (8), Southern Germany, Switzerland and Austria (8), the
elgium (6), North-West France (6), Southern France (5) and Eastern Switzerland (4).
The differences in the quality of the clusters between the clustering stages (cf. (2)) increases exponentially with the
Nonetheless, the test for the statistically optimal number of clusters (cf. (3)) determines a small number of six zones as the optimal configuration for 2015. This equals the number of countries included in the core regions, except that the cluster analysis does not follow national borders. The cut of the dendrogram at this stage shows 4 big clusters and
node zones, namely Tauern (AT) and Vierverlaten section, these outliers
exhibit the lowest and the highest overall average marginal Thus, the cluster algorithm does not merge
these nodes with other clusters until the second to last (Tauern) and fourth to last step (Vierverlaten). Since an
balance in the number of nodes per zone most-, the two nodes are added to
the respective neighboring zone with the best network other clusters are split. This method is
problematical for two reasons. First, the optimal splitting of node zones and the more
steps of the clustering have to be reversed, the more outliers by tendency appear. Second, the inefficiency created by the inclusion of extreme nodes is especially high (cf. chapter II
). Nonetheless, the strategy is kept for now and leads Thereby, the only non-split
country is Belgium. As sensitivity, a ninecreated. In the latter, France East-Switzerland is separated from Southern Germany and an Eastern-German zone is created.
Fig 10. Results of the cluster analysis for the model year 2015 with 9 (left) and 6 clusters.
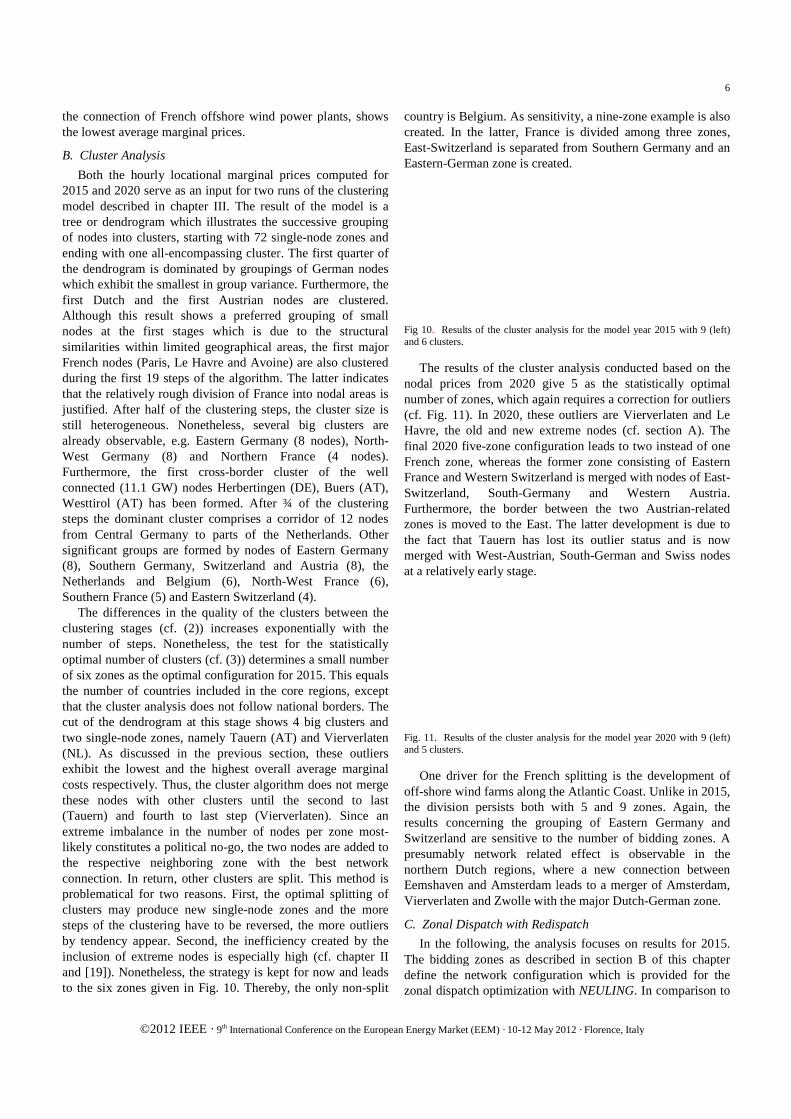
The results of the cluster analysis nodal prices from 2020 give 5 asnumber of zones, which again (cf. Fig. 11). In 2020, these Havre, the old and new extreme nodes (cf. sectifinal 2020 five-zone configuration leads to two instead of one French zone, whereas the former zone consisting of Eastern France and Western Switzerland is merged with nodes of EastSwitzerland, South-Germany and Western Austria. Furthermore, the border between the two Austrianzones is moved to the East. The latter development is due to the fact that Tauern has lost its outliermerged with West-Austrian, Southat a relatively early stage.
Fig. 11. Results of the cluster analysis for the model year 2020 with 9 (left) and 5 clusters.
One driver for the French splitting off-shore wind farms along the Atlantic Coast. Unlike in 2015, the division persists both with results concerning the groupingSwitzerland are sensitive to the number of bidding zones. A presumably network related effect is observable in the northern Dutch regions, where a new connection between Eemshaven and Amsterdam leads to Vierverlaten and Zwolle with the
C. Zonal Dispatch with Redispatch
In the following, the analysis focuses on results for 2015. The bidding zones as described in section B of this chapterdefine the network configuration which is provided for the zonal dispatch optimization with
12 May 2012 · Florence, Italy
6
sensitivity, a nine-zone example is also In the latter, France is divided among three zones,
Switzerland is separated from Southern Germany and an German zone is created.
Results of the cluster analysis for the model year 2015 with 9 (left)
the cluster analysis conducted based on the give 5 as the statistically optimal
again requires a correction for outliers outliers are Vierverlaten and Le
Havre, the old and new extreme nodes (cf. section A). The configuration leads to two instead of one
French zone, whereas the former zone consisting of Eastern France and Western Switzerland is merged with nodes of East-
Germany and Western Austria. e border between the two Austrian-related
The latter development is due to the fact that Tauern has lost its outlier status and is now
Austrian, South-German and Swiss nodes
11. Results of the cluster analysis for the model year 2020 with 9 (left)
driver for the French splitting is the development of shore wind farms along the Atlantic Coast. Unlike in 2015,
the division persists both with 5 and 9 zones. Again, the grouping of Eastern Germany and
sensitive to the number of bidding zones. A presumably network related effect is observable in the northern Dutch regions, where a new connection between
terdam leads to a merger of Amsterdam, Vierverlaten and Zwolle with the major Dutch-German zone.
Redispatch
In the following, the analysis focuses on results for 2015. The bidding zones as described in section B of this chapter
the network configuration which is provided for the zonal dispatch optimization with NEULING. In comparison to
the nodal model runs, information on the network structure within a zone is removed and all included nodes are aggregated. This means that the model is indifferent between dispatching two power plants of the same techno-economic characteristics which are located at different nodes within the zone. Transmission lines between zones remain unchanged except for the definition of their start and end nodes which now correspond to the superordinate zone.
The zonal dispatch provides information on locational marginal costs which only partly reflect costs of congestion. An overview of the results is given in Table XII, where also the corresponding weighted average over the marginal costs of the zones’ nodes as calculated in the nodal dispatch is given. Positive as well as negative deviations of zonal from nodal averages are observable on a regional level due to the neglect of external network effects.
The information on the nodal net-input under zonal pricing is used to calculate the resulting power flows over the full network. This implies that the utilization of the “zonal” lines is calculated again, too. The redispatch algorithm now chooses the least-cost option to relieve congestion. Thereby, NEULING can access running power plants for downward redispatch with the exception of units with balancing market obligations. The generating units are ramped down in the order of decreasing cost savings and decreasing effectiveness with regard to congestion relieve. No restrictions on the geographic distance between redispatchable plants and congested lines are imposed, such that perfect cooperation between the control areas is implied. When the conventional potential for downward redispatch is exhausted, RES can be curtailed. This option is least attractive since curtailment of renewables does not yield savings in variable generation costs. Concerning upward redispatch, the model may access spinning units with unused capacity, again under consideration of balancing market commitments. Furthermore, quick-starting units like open cycle gas-turbines (OCGT) may be activated.
TABLE XII AVERAGE MARGINAL COSTS IN SYSTEMS WITH 6 AND 9 ZONES IN 2015
In the six-zone case, congestion occurs in 7,650 hours of the year and requires a total amount of redispatch of 11.8TWh. Spinning hard coal fired plants are redispatched most often, followed by standing OCGTs. RES need to be curtailed in 1,924 hours to guarantee the stability of the network. In the zonal configuration based on nine clusters, 9.9TWh of conventional generation capacities have to be redispatched. In 1,566 out of a total 7,390 hours RES are used for downward redispatch. Most frequently OCGTs are used for upward redispatch while hard-coal plants are still the most prominent technology used for downward ramping.
D. Total System Costs
NEULING provides information on the total costs originating from the wholesale market dispatch and from ex-post redispatch. An overview of the total system costs for all market configurations analyzed so far is given for the model year 2015 in Table XIII. Thereby, total system costs include the costs of supply in both core and satellite model regions.
TABLE XIII TOTAL COSTS OF ELECTRICITY SUPPLY IN 2015
The comparison of the annual wholesale market costs shows only small deviations between nodal and zonal models. Nearly no savings (9 million EUR) are realized by reducing the number of bidding zones from 72 to 9, whereas the cost difference between the nine- and six-zone models is slightly higher (76 million EUR).
Regarding the costs caused by redispatch in the core regions, a higher number of zones is clearly preferable. Although the amount needed for redispatch is only 20% higher in the six-zone than in the nine-zone configuration, costs increase by more than 40%. This is due to the slope in the redispatch merit order which leads to increasing marginal costs. The relative significance of the redispatch costs becomes slightly more apparent when comparing them to the wholesale market costs of the CWE, Swiss and Austrian regions only. Given dispatch related costs of 144,346 million EUR and 144,292 million EUR in the nine- and six-zone case respectively, redispatch costs amount to 0.46% and 0.65% of the wholesale market costs of the core regions.
In total, the nodal pricing model is – from a cost-based point of view – clearly preferable to the zonal options. Nonetheless, the increase in overall system costs which results from aggregating nodes into zones remains negligible in relative terms. It also has to be kept in mind that a strict compliance with cluster analysis which allows for single-node zones would lead to lower total system costs of the zonal configurations and to even smaller differences with regard to the nodal model. Directly related to this is the noteworthy insight that not only the number of bidding zones but also their delimitations are decisive: refraining from the status quo of national borders (CU) to a design derived from true structural barriers decreases overall costs even when keeping the number of bidding zones constant.
Finally, the disregard of dynamic effects in the given setup has to be considered. Due to the analysis of isolated scenario years, beneficial effects of system adaptation triggered by locational price signals are not included. Thus, the presented total system costs are not fully comprehensive.
VI. CONCLUSION AND OUTLOOK
From the analyses of this paper useful insights into both methodological as well as real-world aspects of the debate on congestion management schemes have been gained.
[€/MWh] A B C D E FZonal (6) 47.64 53.66 49.93 52.02 52.93 52.09
as in Nodal 51.36 53.91 52.59 52.84 53.45 51.71
[€/MWh] I II III IV V VI VII VIII IXZonal (9) 47.38 48.12 53.82 49.77 53.39 51.91 53.31 51.95 51.42
The calculation of the optimal nodal prices has highlighted the importance of in-depth modeling of generation and transmission systems for the identification of scarcities and unexploited potentials for increasing efficiency. At the same time, the model results show that nodal pricing in Europe comes with a noticeable heterogeneity in locational marginal prices which underlines the (political) relevance of distribution effects. Furthermore, the application of cluster analysis has given valuable insight into structural differences and similarities between regions and has eased the way to the identification of suitable bidding zones. Nonetheless, the instrument needs to be supplemented with information such as the desirable minimum zonal size and an ex-post test on the optimality of the results.
In this paper, no optimal zonal configuration has been defined. Especially, various important issues such as market concentration, liquidity and transaction costs have been excluded. Nonetheless, the comparative static analysis of total costs in European nodal and zonal systems allows for several relevant conclusions. First, the nodal-based delimitations of bidding zones in a strongly meshed network most often not coincide with national borders, even with relatively large zones. Second, even a dramatic reduction in the number of bidding zones yields only a relatively small increase in overall system costs. Third, nodes with extreme characteristics do exist and are worth identifying.
The first two points suggest that efficiency gains from redefining market areas can be realized without compromising relevant factors such as liquidity. The third point leads to research questions related to dynamic effects of market design changes. Transparency on structural bottlenecks is indispensable for stimulating the adaptation of both generation and transmission systems. Nonetheless, the magnitude of price signals which is necessary to trigger changes in behavior has not yet been identified. This is especially true if zonal delimitations are dynamic themselves.
VII. A CKNOWLEDGMENT
The author gratefully acknowledges the support of the Institute for Energy Systems, Energy Efficiency and Energy Management (ie³) at TU Dortmund in questions related to transmission network modeling, as well as the support of Dr. Sebastian Kranz in the econometric analysis.
VIII. REFERENCES
[1] Agency for the Cooperation of Energy Regulators (2011, July). Framework guidelines on capacity allocation and congestion management for electricity (FG-2011-E-002) [Online]. Available: http://www.acer.europa.eu/portal/page/portal/ACER_HOME/Public_DoDo/Acts%20of%20the%20Agency
[2] M. Bjørndal and K. Jørnsten, “Zonal pricing in a deregulated electricity market,” The Energy Journal, vol. 22(1), pp. 51-73, 2001.
[3] B. Burstedde, “The New European Linear Investment and Grid Model NEULING. Model description and performance”, EWI Working Papers, Institute of Energy Economics at the University of Cologne, forthcoming.
[4] K. Dietrich, F. Leuthold and H. Weigt, “Will the market get it right? The placing of new power plants in Germany,” Zeitschrift für Energiewirtschaft, Vol. 34(4), pp. 255-265, 2010.
[5] Eurelectric, “Power statistics,” (2010 ed.), full report. Union of the Electricity Industry, Brussels, 2011.
[6] EWI, „Roadmap to 2050 – a closer look,“ Institute of Energy Economics at the University of Cologne, Cologne, 2011.
[7] Frontier Economics and Consentec, “Notwendigkeit und Ausgestaltung geeigneter Anreize für eine verbrauchsnahe und bedarfsgerechte Errichtung neuer Kraftwerke,“ final report for the German Federal Ministry of Economics and Technology, 2008.
[8] Frontier Economics and Consentec, “Bedeutung von etablierten nationalen Gebotszonen für die Integration des europäischen Strommarktes – ein Ansatz zur wohlfahrtsorientierten Beurteilung,“ Final Report for the German Federal Network Agency, 2011.
[9] R. Green, „Nodal pricing of electricity: how much does it cost to get it wrong?” Journal of Regulatory Economics, vol. 31, pp.125-149, 2007.
[10] M. Groschke, A. Eßer, D. Möst, and W. Fichtner, “Neue Anforderungen an optimierende Energiesystemmodelle für die Kraftwerkseinsatz- und Zubauplanung bei begrenzten Netzkapazitäten,” Zeitschrift für Energiewirtschaft, vol. 2009(1), pp. 14-22, 2009.
[11] A. Handl, Multivariate Analysemethoden: Theorie und Praxis multivariater Verfahren unter besonderer Berücksichtigung von S-PLUS, 2nd ed. Heidelberg: Springer, 2010.
[12] R. M. Hermans, P. P. J. Van den Bosch, A. Jokić, P. Giesbertz, P. Boonekamp and A. Virag, “Congestion management in the deregulated electricity market: an assessment of locational pricing, redispatch and regulation,” in Proc. 2011 8th International Conference on the European Energy Market, pp. 8-13.
[13] W. W. Hogan, Independent system operator: pricing and flexibility in a competitive electricity market, Harvard University, 1998.
[14] A. Kumar, S. C. Srivastava and S. N. Singh, “A zonal congestion management approach using real and reactive power rescheduling,” IEEE Transactions on Power Systems, vol. 19(1), 2004.
[15] F. Leuthold, H. Weigt, and C. von Hirschhausen, “Efficient pricing for European electricity networks – The theory of nodal pricing applied to feeding-in wind in Germany,” Utilities Policy, vol. 16(2008), pp. 284-291, 2008.
[16] G. W. Milligan and M. C. Cooper, “An examination of procedures for determining the number of clusters in a data set,” Psychometrika, vol. 50, pp.159-179, 1985.
[17] L. Olmos and I. J. Pérez-Arriaga, “Definition of single price areas within a regional electricity system,” in Proc. 16th Power Systems Computation Conference, Glasgow, 2008.
[18] R. Mojena, “Hierarchical grouping methods and stopping rules: an evaluation,” Computer Journal, vol. 20, pp. 359-363, 1977.
[19] S. Stoft, “Analysis of the California WEPEX Applications to FERC,” POWER Working Paper PWP-042A, University of California Energy Institute, Berkeley, 1996.
[20] F. C. Schweppe, M. C. Caraminis, R. D. Tabors, R. F. Bohn, Spot Pricing of Electricity, Boston: Kluwer, 1988.
[21] S. Stoft, “Transmission pricing zones: simple or complex?” The Electricity Journal, Jan/Feb 1997, pp. 24-31.
[22] M. Supponen, “Influence of national and company interests on European Transmission Investments,” doctoral dissertation, Dept. of Electrical Engineering, Aalto University, Espoo, 2011.
[23] S. Walton and T. Tabors, “Zonal transmission pricing: methodology and preliminary results from the WSCC,” The Electricity Journal, Nov 1996, pp. 34-41.
[24] J. H. Ward Jr. “Hierarchical Grouping to Optimize an Objective Function,” Journal of the American Statistical Association, vol. 48, pp. 236-244, 1963.
[25] H. Yang, Y. Zhang and J. Win, “A new zone partitioning method of electricity price under market uncertainty”, in IET Conference Publication, vol. 2006 (CP523), 2006.
IX. BIOGRAPHY
Barbara Burstedde received her Diploma in Economics from the University of Cologne, Germany, in 2009. Presently, she is a PhD candidate and research associate at the Institute of Energy Economics at the University of Cologne (EWI). She has worked on several studies for federal ministries as well as for German TSOs and has thus gained expertise on topics related to electricity market design and electricity market modelling.