Review of Economic Studies (2004) 71, 1001-1026 0034-6527/04/00401001$02.00 ? 2004 The Review of Economic Studies Limited From Physical to Human Capital Accumulation: Inequality and the Process of Development ODED GALOR Brown University, Hebrew University and CEPR and OMER MOAV Hebrew University and CEPR First version received June 2001; final version accepted July 2003 (Eds.) This paperdevelops a growththeory that captures the replacement of physical capital accumulation by human capital accumulation as a prime engine of growthalong the process of development. It argues thatthe positive impact of inequality on the growth process was reversed in this process. In early stages of the Industrial Revolution,when physical capital accumulation was the prime source of growth,inequality stimulated developmentby channelling resources towardsindividualswith a higher propensity to save. As human capitalemerged as a growthengine, equality alleviatedadverseeffects of credit.constraints on human capitalaccumulation, stimulating the growthprocess. 1. INTRODUCTION This research develops a growth theory that captures the endogenous replacement of physical capital accumulation by human capital accumulation as a prime engine of economic growth in the transition from the Industrial Revolution to modem growth. The proposed theory offers a unifiedaccountfor the effect of income inequality on the growth process during this transition. It argues thatthe replacement of physical capital accumulation by human capital accumulation as a primeengine of economic growthchanged the qualitative impact of inequality on the process of development. In the early stages of the Industrial Revolution, when physical capital accumulation was the prime source of economic growth,inequality enhancedthe process of development by channelling resources towardsindividualswhose marginalpropensity to save is higher. In the later stages of the transition to modem growth, as human capital emerged as a prime engine of economic growth, equality alleviated the adverse effect of credit constraints on human capital accumulation and stimulated the growthprocess. The proposed theory unifies two fundamental approaches regarding the effect of income distributionon the process of development: the Classical approach and the Credit Market Imperfection approach.' The Classical approach was originated by Smith (1776) andwas further interpreted and developed by Keynes (1920), Lewis (1954), Kaldor (1957), and Bourguignon (1981). According to this approach, saving rates are an increasing function of wealth and inequality thereforechannels resourcestowardsindividualswhose marginal propensity to save 1. The socio-political economy approach provides an alternative mechanism: equality diminishes the tendency for socio-political instability, or distortionary redistribution, and hence it stimulatesinvestmentand economic growth. See the comprehensive survey of Benabou (1996b). 1001
Transcript
Review of Economic Studies (2004) 71, 1001-1026 0034-6527/04/00401001$02.00
? 2004 The Review of Economic Studies Limited
From Physical to Human Capital
Accumulation: Inequality and the
Process of Development ODED GALOR
Brown University, Hebrew University and CEPR
and
OMER MOAV Hebrew University and CEPR
First version received June 2001; final version accepted July 2003 (Eds.)
This paper develops a growth theory that captures the replacement of physical capital accumulation by human capital accumulation as a prime engine of growth along the process of development. It argues that the positive impact of inequality on the growth process was reversed in this process. In early stages of the Industrial Revolution, when physical capital accumulation was the prime source of growth, inequality stimulated development by channelling resources towards individuals with a higher propensity to save. As human capital emerged as a growth engine, equality alleviated adverse effects of credit.constraints on human capital accumulation, stimulating the growth process.
1. INTRODUCTION
This research develops a growth theory that captures the endogenous replacement of physical capital accumulation by human capital accumulation as a prime engine of economic growth in the transition from the Industrial Revolution to modem growth. The proposed theory offers a unified account for the effect of income inequality on the growth process during this transition. It argues that the replacement of physical capital accumulation by human capital accumulation as a prime engine of economic growth changed the qualitative impact of inequality on the process of development. In the early stages of the Industrial Revolution, when physical capital accumulation was the prime source of economic growth, inequality enhanced the process of development by channelling resources towards individuals whose marginal propensity to save is higher. In the later stages of the transition to modem growth, as human capital emerged as a prime engine of economic growth, equality alleviated the adverse effect of credit constraints on human capital accumulation and stimulated the growth process.
The proposed theory unifies two fundamental approaches regarding the effect of income distribution on the process of development: the Classical approach and the Credit Market Imperfection approach.' The Classical approach was originated by Smith (1776) and was further interpreted and developed by Keynes (1920), Lewis (1954), Kaldor (1957), and Bourguignon (1981). According to this approach, saving rates are an increasing function of wealth and inequality therefore channels resources towards individuals whose marginal propensity to save
1. The socio-political economy approach provides an alternative mechanism: equality diminishes the tendency for socio-political instability, or distortionary redistribution, and hence it stimulates investment and economic growth. See the comprehensive survey of Benabou (1996b).
1001
REVIEW OF ECONOMIC STUDIES
is higher, increasing aggregate savings and capital accumulation and enhancing the process of development. Strands of the capital market imperfection approach suggests, in contrast, that equality in sufficiently wealthy economies alleviates the adverse effect of credit constraints on investment in human capital and thereby enhances economic growth (Galor and Zeira, 1993).2
The proposed unified theory provides an intertemporal reconciliation between the conflicting viewpoints about the effect of inequality on economic growth. It suggests that the classical viewpoint, regarding the positive effect of inequality on the process of development, reflects the state of the world in early stages of industrialization when physical capital accumulation was the prime engine of economic growth. In contrast, the credit market imperfection approach regarding the positive effect of equality on economic growth reflects later stages of development when human capital accumulation becomes a prime engine of economic growth, and credit constraints are largely binding.
The fundamental hypothesis of this research stems from the recognition that human capital accumulation and physical capital accumulation are fundamentally asymmetric. In contrast to physical capital, human capital is inherently embodied in humans and the existence of physiological constraints subjects its accumulation at the individual level to diminishing returns. The aggregate stock of human capital would be therefore larger if its accumulation would be widely spread among individuals in society, whereas the aggregate productivity of the stock of physical capital is largely independent of the distribution of its ownership in society.3 This asymmetry between the accumulations of human and physical capital suggests therefore that as long as credit constraints are largely binding, equality is conducive for human capital accumulation, whereas provided that the marginal propensity to save increases with income, inequality is conducive for physical capital accumulation.
The paper develops a growth model that captures the endogenous replacement of physical capital accumulation by human capital accumulation as a prime engine of economic growth in the transition of the currently advanced economies from the Industrial Revolution to modem growth. As argued by Abramovitz (1993, p. 224) "In the nineteenth century, technological progress was heavily biased in a physical capital-using direction.... In the twentieth century, however, the physical capital-using bias weakened; it may have disappeared altogether. The bias shifted in an intangible (human and knowledge) capital-using direction and produced the substantial contribution of education and other intangible capital accumulation to this century productivity growth..." Indeed, evidence provided by Abramovitz and David (2000) and Goldin and Katz (2001) suggest that over the period 1890-1999 in the U.S. the contribution of human capital accumulation to the growth process nearly doubled whereas the contribution of physical capital declined significantly. Goldin and Katz (2001) show that the rate of growth of educational productivity was 0-29% per year over the period 1890-1915, accounting for about 11% of the annual growth rate of output per capita over this period. In the period 1915-1999, the rate of growth of educational productivity was 0-53% per year accounting for about 20% of the annual growth rate of output per capita over this period. Abramovitz and David (2000) report that the fraction of the growth rate of output per capita that is directly attributed to physical capital
2. Benabou (1996a, 2000), Durlauf (1996), Fernandez and Rogerson (1996), and Mookherjee and Ray (2003) provide additional theoretical contributions and Perotti (1996) and Easterly (2001) provide evidence in support of this link between equality, human capital and growth. Banerjee and Newman (1993) and Aghion and Bolton (1997) among others, suggest that equality positively affects an individual's investment opportunities that could be in physical capital rather than human capital.
3. One may argue that the accumulation of physical capital at the individual's level is also subjected to diminishing returns due to agency problems. However, the proposed hypothesis remains valid as long as the return to human capital accumulation at the individual's level diminishes significantly faster than the return on physical capital and the adverse effect of equality on saving is larger than its positive effect on the aggregate productivity of physical capital.
1002
FROM PHYSICAL TO HUMAN CAPITAL ACCUMULATION 1003
accumulation declined from an average of 56% in the period 1800-1890 to 31% in the period 1890-1927 and 21% in the period 1929-1966.
The process of industrialization in England, as well, is characterized by a gradual increase in the importance of the accumulation of human capital relative to physical capital. In the first phase of the Industrial Revolution (1760-1830), capital accumulation as a fraction of GNP increased significantly whereas literacy rates remained largely unchanged. Skills and literacy requirements were minimal, the state devoted virtually no resources to raise the level of literacy of the masses, and workers developed skills primarily through on-the-job training (Green (1990), Mokyr (1990, 1993)). Consequently, literacy rates did not increase during the period 1750-1830 (Sanderson, 1995). As argued by Landes (1969, p. 340) "although certain workers-supervisory and office personnel in particular-must be able to read and do the elementary arithmetical operations in order to perform their duties, a large share of the work of industry can be performed by illiterates as indeed it was especially in the early days of the industrial revolution".
In the second phase of the Industrial Revolution, however, capital accumulation subsided, the education of the labour force markedly increased and skills became necessary for production. Investment ratio has increased from 6% in 1760 to 11 .7% in the year 1831 and it remained around 11% on average in the period 1856-1913 (Matthews, Feinstein and Odling-smee (1982, p. 137), Crafts (1985, p. 73)). In contrast, the average years of schooling of the male labour force which had not changed significantly until the 1830s, tripled until the beginning of the twentieth century (Matthews et al., 1982, p. 573). School enrolment of 10 year olds increased from 40% in 1870 to 100% in 1900, the literacy rate among men, which was stable at around 65% in the first phase of the Industrial Revolution, increased significantly during the second phase reaching nearly 100% at the end of the nineteenth century (Clark, 2003), and the proportion of children aged 5-14 in primary schools increased significantly in the second half of the nineteenth century, from 11% in 1855 to 74% in 1900 (Flora, Kraus and Pfenning, 1983).
The proposed growth model captures the historical intensification in the importance of human capital relative to physical capital in the process of development and its significance for the determination of the effect of inequality on economic growth. The model is based on three central elements, in addition to the fundamental asymmetry between human capital and physical capital. The first element captures the central mechanism in the classical approach. The preference structure is designed such that, consistently with empirical evidence, the marginal propensity to save and to bequeath increases with wealth (e.g. Tomes (1981), Menchik and David (1983), Dynan, Skinner and Zeldes (2000)).4 Hence, consistently with some empirical evidence, inequality has a positive effect on aggregate savings (e.g. Cook, 1995).5
The second element captures the central mechanism of the credit market imperfection approach. The economy is characterized by credit constraints that, consistently with empirical evidence, undermine investment in human capital (e.g. Flug, Spilimbergo and Wachtenheim (1998), Checchi (2001)). Although, there is no asymmetry in the ability of individuals to borrow for investment in either human capital or physical capital, credit constraints along with the inherent diminishing marginal returns in the production of human capital generate an inefficient investment only in human capital. Given the competitive neoclassical aggregate production structure, the return to physical capital across all individuals and firms is identical, and individuals, therefore, have no incentive to borrow for investment in physical capital.
4. Dynan et al. (2000) find that saving rates in the U.S. rise from 3% in the lowest quintile to 25% in the top quintile, and 44% in the top 5% of the income distribution. Their findings are consistent with models in which precautionary saving and bequest motives drive variations in saving rates across income groups.
5. It should be noted that some studies do not find any significant effect of inequality on aggregate savings (e.g. Schmidt-Hebbel and Serven, 2000).
GALOR & MOAV
REVIEW OF ECONOMIC STUDIES
The third element is designed to capture the increasing importance of human capital in the process of development. Consistently with historical evidence (Goldin and Katz, 1998), the economy is characterized by capital-skill complementarity. The accumulation of physical capital increases the demand for human capital and induces human capital accumulation.6
In early stages of industrialization physical capital is scarce, the rate of return to human capital is lower than the rate of return to physical capital and the process of development is fuelled by capital accumulation. The positive effect of inequality on aggregate saving dominates therefore the negative effect on investment in human capital and inequality raises aggregate savings and capital accumulation and enhances the process of development. In later stages of development, as physical capital accumulates, the complementarity between capital and skills increases the rate of return to human capital. Investment in human capital accumulation increases and the accumulation of human capital as well as physical capital fuel the process of development. Since human capital is embodied in individuals and individuals' investment in human capital is subjected to diminishing marginal returns, the aggregate return to investment in human capital is maximized if investment in human capital is widely spread among individuals in society. Equality alleviates the adverse effect of credit constraints, and has therefore a positive effect on the aggregate level of human capital and economic growth. Moreover, the differences in the marginal propensities to save across individuals narrow as wages increase, and the negative effect of equality on aggregate saving subsides. In later stages of development, therefore, as long as credit constraints are sufficiently binding, the positive effect of inequality on aggregate saving is dominated by the negative effect on investment in human capital, and equality stimulates economic growth. As wages further increase, however, credit constraints become less binding, differences in the marginal propensity to save further decline, and the aggregate effect of income distribution on the growth process becomes less significant.7
The ordering of regimes is important for the understanding of the role of inequality in the process of development of the currently developed economies. Nevertheless, the insights that the effect of inequality is determined by the return to human capital relative to the return to physical capital is relevant for the current LDCs as well. In contrast to the historical growth path of the currently developed economies, human capital accumulation may be the prime engine of economic growth in some LDCs, even in early stages of development, due to the importation of capital and skill-biased technologies.
The proposed unified theory generates an unexplored testable implication about the effect of inequality on economic growth.8 Unlike previous theories this research suggests that the effect of inequality on growth depends on the relative return to human and physical capital. Inequality is beneficial for economic growth in economies in which the return to human capital relative to the return to physical capital is low, whereas equality is beneficial for economic growth in economies in which the relative return to human capital is high. In particular, as long as credit constraints
6. Evidence provided by Galor and Moav (2003) suggests that in the second phase of the Industrial Revolution, education reforms in Europe were designed primarily to satisfy the increasing skill requirements in the process of industrialization. It should be noted that although physical capital accumulation increased the demand for human capital, investment in education had the opposite effect on the return to human capital. For instance, the decline in the reward for education in the U.S. in the period 1910-1940 despite a rapid skill-biased technological change is due to the growth of the relative supply of more educated labour that accelerated during the high school movement (Goldin and Katz, 1998, 1999).
7. Inequality may widen once again due to skill or ability-biased technological change induced by human capital accumulation. This line of research was explored theoretically by Galor and Tsiddon (1997), Caselli (1999), Galor and Moav (2000), Gould, Moav and Weinberg (2001), and Acemoglu (2002), among others. It is supported empirically by Autor, Katz and Krueger (1998) and Goldin and Katz (1998), among others.
8. The existing empirical analysis of the relationship between inequality and growth is inconclusive and controversial. See Alesina and Rodrik (1994), Persson and Tabellini (1994), Perotti (1996), Barro (2000), Forbes (2000), Dollar and Kraay (2002), Panizza (2002), Quah (2002), and Banerjee and Duflo (2003).
1004
FROM PHYSICAL TO HUMAN CAPITAL ACCUMULATION 1005
are largely binding, the higher is the relative return to human capital the more adverse (or the less beneficial) is the effect of inequality on economic growth. In contrast, the credit markets imperfection approach suggests that the effect of inequality on economic growth depends on the country's level of income-inequality is beneficial for poor economies and harmful for rich ones.
2. THE BASIC STRUCTURE OF THE MODEL
Consider an overlapping-generations economy in a process of development. In every period the economy produces a single homogeneous good that can be used for consumption and investment. The good is produced using physical capital and human capital. Output per capita grows over time due to the accumulation of these factors of production. The stock of physical capital in every period is the output produced in the preceding period net of consumption and human capital investment, whereas the level of human capital in every period is the outcome of individuals' education decisions in the preceding period, subject to borrowing constraints.
2.1. Production offinal output
Production occurs within a period according to a neoclassical, constant-returns-to-scale, production technology. The output produced at time t, Yt, is
Yt = F(Kt, Ht) Htf (kt) = AHtk; kt = Kt/Ht; a E (0, 1), (1)
where Kt and Ht are the quantities of physical capital and human capital (measured in efficiency units) employed in production at time t, and A is the level of technology. The production function, f(kt), is therefore strictly monotonic increasing, strictly concave satisfying the neoclassical boundary conditions that assure the existence of an interior solution to the producers' profit- maximization problem.
Producers operate in a perfectly competitive environment. Given the wage rate per efficiency unit of labour, wt, and the rate of return to capital, rt, producers in period t choose the level of employment of capital, Kt, and the efficiency units of labour, Ht, so as to maximize profits. That is, {Kt, Ht = arg max[Ht f(kt) - wt Ht - rt Kt . The producers' inverse demand for factors of production is therefore
In every period a generation which consists of a continuum of individuals of measure 1 is born. Each individual has a single parent and a single child. Individuals, within as well as across generations, are identical in their preferences and innate abilities. They may differ, however, in their family wealth and thus, due to borrowing constraints, in their investment in human capital.
Individuals live for two periods. In the first period of their lives individuals devote their entire time to the acquisition of human capital. The acquired level of human capital increases if their time investment is supplemented with capital investment in education.9 In the second period of their lives (adulthood), individuals supply their efficiency units of labour and allocate
9. If alternatively, the time investment in education (foregone earnings) is the prime factor in the production of human capital, the qualitative results would not be affected, as long as physical capital would be needed in order to finance consumption over the education period. Both formulations assure that in the presence of capital markets imperfections investment in human capital depends upon family wealth.
GALOR & MOAV
REVIEW OF ECONOMIC STUDIES
the resulting wage income, along with their inheritance, between consumption and transfers to their children. The resources devoted to transfers are allocated between an immediate finance of their offspring's expenditure on education and saving for the future wealth of their offspring.
2.2.1. Wealth and preferences. In the second period life, an individual i bor in period t t the (a member i of generation t) supplies the acquired efficiency units of labour, h+, at the+
competitive market wage, wt+l. In addition, the individual receives an inheritance of xi The individual's second period wealth, It+i, is therefore
II - ??' -J"i It+l = wt+lh+l +Xt+l (3)
The individual allocates this wealth between consumption, cit+ and transfers to the offspring, bt+l. That is,
ct+1 + bt+l < t+. (4)
The transfer of a member i of generation t, b+1, is allocated between an immediate finance of their offspring's expenditure on education, e+1, and saving, s , for the future wealth of their
offspring. That is, the saving of a member i of generation t, t+l, is
= 1- . 1 (5) st+1 bt+1 -
et+1 .
The inheritance of a member i of generation t, xt+1, is therefore the return on the parental saving, st
=Rt+l = (b - e)Rt+ (6) X t+1 -- St t)Rt+(
where Rt+l = 1 + rt+l - 8 = R(kt+i). For simplicity the rate of capital depreciation 8 = 1. Preferences of a member i of generation t are defined over family consumption in period
t + 1, ct+l and the value in period t + 1 of total transfer to t off (i.e. the sum offspring, b the immediate finance of the offspring's investment in human capital, el+, and the saving for the
offspring's future wealth, s+l). They are represented by a log-linear utility function that, as will become apparent, captures the spirit of Kaldorian-Keynesian saving behaviour (i.e. the saving rate is an increasing function of wealth),
ut = (1 -) log + + log( + b ) (7)
where P E (0, 1) and 0 > O.11
2.2.2. The formation of human capital. In the first period of their lives individuals devote their entire time to the acquisition of human capital. The acquired level of human capital increases if their time investment is supplemented with capital investment in education. However, even in the absence of real expenditure individuals acquire one efficiency unit of labour-basic skills. The number of efficiency units of labour of a member i of generation t in period t + 1,
10. This formulation of the saving function is consistent with the view that bequest as a saving motive is perhaps more important than life cycle considerations (e.g. Deaton, 1992).
11. Moav (2002) shows that long-run inequality could persist in Galor and Zeira's (1993) framework, if this type of a "Keynesian saving function" replaces the assumption of non-convexities in the production of human capital. Fishman and Simhon (2002) analyse the effect of income distribution on the division of labour and thereby on economic growth in a setting that integrates the classical and the credit market imperfections approaches. They argue that equality contributes to specialization and long-run growth if capital markets are imperfect and individuals' saving rates increase with income.
1006
FROM PHYSICAL TO HUMAN CAPITAL ACCUMULATION 1007
hi+l, is a strictly increasing, strictly concave function of the individual's real expenditure on education n period t, e.12
ht- =h (e), (8) t+1 where h(0) = 1, limeiO+ h(et) = y < oo, and lim iooh'(e) = 0. As is the case for
et t ete->oc the production of physical capital (which converts one unit of output into one unit of capital), the slope of the production function of human capital is finite at the origin. This assumption along with the ability of individuals to supply some minimal level of labour, h(O), regardless of the physical investment in human capital (beyond time), assures that under some market conditions (non-basic) investment in human capital is not optimal.13 The asymmetry between the accumulation of physical and human capital that is postulated in the paper is manifested in the larger degree of diminishing marginal productivity in the production of human capital (i.e. the strict concavity of h(e\) in contrast to the linearity of the production function of physical capital).
Given that the indirect utility function is a strictly increasing function of the individual's second period wealth, the unconstrained optimal real expenditure on education in every period t, e, from the viewpoint of individual i of generation t, maximizes the second period wealth, It.
= argmax[wt+lh(e) + (b - et)Rt+]. (9) e t t (9) Although, formally parents are indifferent about the internal allocation of the aggregate intended transfers to the offspring, the allocation of funds to the offspring's education is assumed to be optimal from the offspring's viewpoint.
Hence, as follows from the properties of h(el), the optimal unconstrained real expenditure on education in every period t, et, is unique and identical across members of generation t.
If Rt+l > wt+ y then et = 0, otherwise et is given by
wt+lh'(et) = Rt+l. (10)
Moreover, since wt+l = w(kt+l) and Rt+l = R(kt+l), it follows that et = e(kt+l). Given the properties of f (kt), there exists a unique capital-labour ratio k, below which
individuals do not invest in human capital (i.e. do not acquire non-basic skills). That is, R(k) = w(k)y, where limeiO+ h'(et) = y. As follows from (2), k = a/(l - a)y _ k(y) > 0 where
k'(y) < 0. Since R'(kt+l) < O, w'(kt+l) > 0, and h"(et) < 0, it follows that the optimal unconstrained real expenditure on education in every period t is a function of the capital-labour ratio in the subsequent period. In particular,
et = e(kt+l) = 0 if+ (11) > 0 ifkt+i > k,
where e'(kt+l) > 0 for kt+l > k. Hence, if the capital-labour ratio in the next period is expected to be below k individuals do not acquire non-basic skills.
Suppose that individuals cannot borrow. It follows that the expenditure on education of a member i of generation t, et is limited by the aggregate transfer, bt, that the individual receives. mII~III IembeItr Wi~ of~ L generaItio n t,
12. A more realistic formulation would link the cost of education to (teacher's) wages, which may vary in the
process of development. For instance, hi1, = h (e /wt) implies that the cost of education is a function of the number of
efficiency units of teachers that are used in the education of individual i. As will become apparent from (10) and (11), under both formulations the optimal capital expenditure on education, ei, is an increasing function of the capital-labour ratio in the economy, and the qualitative results are therefore identical under both formulations.
13. The Inada conditions are typically designed to simplify the exposition by avoiding corer solution, but surely they are not realistic assumptions.
GALOR & MOAV
REVIEW OF ECONOMIC STUDIES
As follows from (10) and the strict concavity of h(et), et = bt if bt < et, whereas et = et if bt > et. That is, the expenditure on education of a member i of generation t, et,is
= min[e(kt+), b'], (12)
where et is a non-decreasing function of kti+ and b\.
2.2.3. Optimal consumption and transfers. A member i of generation t chooses the level of second period consumption, ct+, and a non-negative aggregate level of transfers to the offspring, b'+l, so as to maximize the utility function subject to the second period budget constraint (4).
Hence the optimal transfer of a member i of generation t is:
(l[+-0) if I+ >0; b1 -b(It1) -f- - (13) b -bt+ I ) =
0 if Ilt+l I< 0
where 0 - 0(1 - f)//f. As follows from (13), the transfer rate bt+l/It+1 is increasing in I+l. Moreover, as follows from (5) and (11) the saving of a member i of generation t - 1, s, is
= bt if kt+l (14) t
\b -ei ifkt+l > k.
Hence, since b+I /t+^ Iis increasing in l+l , it follows from (0 and 0) that st+ /It+ is increasing Hencte,sinc b t + 1 / It + 1 in It+l as well. The transfer function and the implied saving function capture the properties of the Kaldorian-Keynesian saving hypothesis.
2.3. Aggregate physical and human capital
Suppose that in period 0 the economy consists of two groups of adult individuals-rich and poor. They are identical in their preferences and differ only in their initial capital ownership. The rich, denoted by R, are a fraction X of all adult individuals in society, who equally own the entire initial physical capital stock. The poor, denoted by P, are a fraction 1 -X of all adult individuals in society, who have no ownership over the initial physical capital stock. Since individuals are ex ante homogeneous within a group, the uniqueness of the solution to their optimization problem assures that their offspring are homogeneous as well. Hence, in every period a fraction X of all adults are homogeneous descendents of the rich, denoted by members of group R, and a fraction 1 - X are homogeneous descendents of the poor, denoted by members of group P.
The optimization of groups P and R of generations t - 1 and t in period t, determines the levels of physical capital, Kt+ , and human capital, Ht+l, in period t + 1,
where in period 0 there is no (non-basic) human capital, i.e. ho = 1 for all i = R, P and thus Ho= 1.
Hence, (0 and 0) implies that the levels of physical capital, Kt+l, and human capital, Ht+l, in period t + 1, are functions of intergenerational transfers in each of the groups, btR and b/P, and the capital-labour ratio in the subsequent period, kt+l,
Ht+i = H(btR, bfP, kt+); (1/)
Kt+l = K(btR, bf , kt+l),
1008
FROM PHYSICAL TO HUMAN CAPITAL ACCUMULATION 1009
where (11), (0 and 0) and e'(kt+1) > 0, imply that aHt+1i/kt+l > 0, aKt+l/lkt+l < 0, H(bR, b, 0) = 1, and K(bt, bf, 0) > 0 for bt > 0.
The capital-labour ratio in period t + 1 is therefore,
K(bfR, bp, kt+i) kt+l = , (18)
H(bf , bt, kt+l)' where the initial level of the capital-labour ratio, ko, is assumed to be
ko E (0, k). (Al)
This assumption assures that in the initial stages the rate of return to physical capital is higher than the rate of return to human capital.
As follows from (11), this assumption is consistent with the assumption that the initial level of human capital is Ho = 1.
Hence, it follows from (18) and the properties of the functions in (17) that there exists a continuous single valued function K (bR, bf) such that the capital-labour ratio in period t + 1 is fully determined by the level of transfer of groups R and P in period t.
kt+l = K(btR, bp), (19)
where K (0, 0) = 0 (since in the absence of transfers and hence savings the capital stock in the subsequent period is zero).
2.4. The evolution of transfers within dynasties
The evolution of transfers within each group i = R, P, as follows from (13), is
bt = max{f[wt+ih(e') + (b - e)Rt+l -0], 0}; i = R, P. (20)
Hence, it follows from (0 and 0) that
b1/ = maxf 1[w(kt+l)h(bt)-0] if b) < e(kti) b1 = max t . . 0 t+1 fl[w(kt+l)h(e(kt+I))+(b - e(kt+l))R(kt+?) - 0] if bI > e(kt+l),
(21) Namely, intergenerational transfers within group i in period t + 1, b1t+ are determined by the intergenerational transfers within the group in the preceding period, as well as the rewards to factors of production, as determined by the capital-labour ratio in the economy, i.e.
b +1l = p (b', kt+ ). (22)
Let k be the critical level of the capital-labour ratio below which individuals who do not receive transfers from their parents (i.e. b =- 0 and therefore h(b\) = 1) do not transfer income to their offspring. That is, w(k) = 0. As follows from (2), k = [0/(1 - a)A]/ -k(0), where if kt+l < k then w(kt+l) < 0, whereas if kt+l > k then w(kt+l) > 0. Hence, intergenerational transfers within group i in period t + 1, b t+ are positive if and only if kt+l > k, i.e.
bt+l =(O, kt+l) i= if kt+l (23)
> 0 ifkt+i > k.
In order to reduce the number of feasible scenarios for the evolution of the economy, suppose that once wages increase sufficiently such that members of group P transfer resources to their offspring, i.e. kt+l > k, investment in human capital is profitable, i.e. kt+l > k. That is,
GALOR & MOAV
k < k. (A2)
REVIEW OF ECONOMIC STUDIES
Note that, since k = k(0) and k'(0) > 0, it follows that for any given y, there exists 0 sufficiently large such that k(y) < k(0).
Let f + 1 be the first period in which the capital-labour ratio exceeds k (i.e. kt+1 > k). That is, since ko < k, it follows that kt+l < k for all 0 < t < t. Let t + 1 be the first period in which the capital-labour ratio exceeds k. That is, kt+l < k for all 0 < t < t. It follows from Assumption (A2) that t < t.
The evolution of transfers within each of the two groups, as follows from the fact that kt+l = K(bR bP), is fully determined by the evolution of transfers within both types of dynasties. Namely,
where the initial transfers of the rich and the poor are
bR = max[i[w(ko) + koR(ko)/- - 0], 0]; (25)
bp = max[r[w(ko) - 0], 0],
noting that the level of human capital of every adult i in period 0 is ho = 1, and the entire stock of capital in period 0 is distributed equally among the rich.
Lemma 1. The intergenerational transfers of members of group R (the rich) are higher than that of members of group P (the poor) in every time period, i.e.
bR > bp for all t.
The proof follows from (22) noting thatR b b.
3. THE PROCESS OF DEVELOPMENT
This section analyses the endogenous evolution of the economy from early to mature stages of development. The dynamical system is uniquely determined by the joint-evolution of the intergenerational transfers of members of groups P and R. As follows from (24), the evolution of the economy is given by the sequence {bP, bR} oo that satisfies in every period
bp = Vfp(b R b, b) (+1 = P (b, bt ); (26)
bR+l = f R (bt, bt),
where bo and boR are given by (25). As will become apparent, if additional plausible restrictions are imposed on the basic model,
the economy endogenously evolves through two fundamental regimes:
* Regime I: In this early stage of development the rate of return to human capital is lower than the rate of return to physical capital and the process of development is fuelled by capital accumulation.
* Regime II: In these mature stages of development, the rate of return to human capital increases sufficiently so as to induce human capital accumulation, and the process of development is fuelled by human capital as well as physical capital accumulation.
In Regime I, physical capital is scarce and the rate of return to human capital is therefore lower than the rate of return to physical capital. Since there is no incentive for investment in human capital the process of development is fuelled by capital accumulation. The wage rate
1010
FROM PHYSICAL TO HUMAN CAPITAL ACCUMULATION 1011
is lower than the critical level that would enable individuals who do not own any capital to engage in intergenerational transfers (and thus savings). The poor, therefore, consume their entire wages, they are not engaged in saving, capital accumulation, and intergenerational transfers. Their descendants, therefore, are also unable to engage in savings and intergenerational transfers and the poor are in a temporary steady-state equilibrium in which there is neither investment in physical capital nor in human capital. In contrast, the income of the rich, who own the entire stock of capital in the economy, is sufficiently high, permitting intergenerational transfers and capital accumulation. Intergenerational transfers among the rich increase over time and the stock of physical capital in the economy, therefore, increases as well. During this regime, physical capital accumulation by the rich raises the wages and therefore the return to human capital and decreases the return to physical capital. However, as long as the rate of return to human capital remains lower than the rate of return to physical capital, the qualitative structure of the economy remains unchanged. That is, the poor are in a poverty trap, the rich get richer and the process of development is based solely on physical capital accumulation. Inequality in Regime I, increases the wealth of individuals whose marginal propensity to save is higher and consequently increases aggregate savings and capital accumulation and enhances the process of development.
The accumulation of physical capital by the rich in Regime I raises gradually the rate of return to human capital. Ultimately, the rate of return to human capital is sufficiently high so as to induce human capital accumulation, and the economy enters into Regime II where the process of development is fuelled by human capital accumulation as well as physical capital accumulation.
Regime II is subdivided into three stages. In Stage I, investment in human capital is selective and it is feasible only for the rich. In Stage II, investment in human capital is universal but it is still sub-optimal due to binding credit constraints, and in Stage III, investment in human capital is optimal since credit constraints are no longer binding.
Stage I (Selective Human Capital Accumulation). In this stage, the capital-labour ratio in the economy is higher than that in Regime I, and although it generates wage rates that justify investment in human capital, these wages are still lower than the critical level that would permit intergenerational transfers for individuals who do not own any capital. Hence, although the rate of return justifies investment in human capital, in the absence of parental support, credit constraint deprives the poor from this investment. The poor consume their entire income and they are not engaged in saving and capital accumulation. Their descendents are therefore unable to engage in savings and intergenerational transfers and the poor remain in a temporary steady- state equilibrium in which there is neither investment in physical capital nor in human capital. In contrast, the income of the rich is sufficiently high, permitting intergenerational transfers and physical capital accumulation as well as human capital accumulation. Intergenerational transfers and the accumulation of physical capital by the rich gradually rise in Stage I of Regime II, and ultimately the wage rate is sufficiently high so as to permit some investment in human capital by the poor (i.e. the economy enters Stage II of Regime II).
Stage II (Universal Human Capital Accumulation). In this stage, the capital-labour ratio in the economy generates wage rates that permit some investment in human capital by all individuals. In contrast to the rich, the investment of the poor is constrained by parental wealth and it is therefore sub-optimal. That is, the marginal return on investment in human capital among the poor is higher than that among the rich. Equality alleviates the adverse effect of credit constraints on the investment of the poor in human capital, and has therefore a positive effect on the level of human capital and economic growth. The gradual increase in the wage income of the descendents of the poor that takes place in Stage II of Regime II, due to a gradual increase in their investment in human capital, makes the credit constraint less binding over time and the aggregate effect of income distribution on the growth process subsides.
GALOR & MOAV
REVIEW OF ECONOMIC STUDIES
Stage III (Unconstrained Investment in Human Capital). In Stage III, credit constraints are non-binding due to the increase in wage income in Stage II, the rate of return to human capital is equalized across groups, and inequality therefore has no effect on economic growth.
3.1. Regime I: physical capital accumulation
In this early stage of development the rate of return to human capital is lower than the rate of return to physical capital and the process of development is fuelled by capital accumulation.
Regime I is defined as the time interval 0 < t < t. In this early stage of development the capital-labour ratio in period t + 1, kt+1, which determines the return to investment in human capital in period t, is lower than k. The rate of return to human capital is therefore lower than the rate of return to physical capital, and the process of development is fuelled by capital accumulation. As follows from (11) the level of real expenditure on education in Regime I is therefore zero and members of both groups acquire only basic skills. That is, h(e(kt+l)) = 1. Furthermore, as established in Appendix A, since the income of members of group P (the poor) is lower than the threshold that permits intergenerational transfer there are no intergenerational transfers among dynasties of this group, i.e.
b = 0 for 0< t <t. (27)
As follows from (15) to (19), and (27), since ef = ef = bP = 0 in the time interval 0 < t < t (where t < t as follows from (A2)), the capital-labour ratio kt+l is determined in Regime I by the intergenerational transfers of members of group R, according to their fraction in the population ; kt+l = K (bf, 0) = kbR for 0 < t < t (i.e. for kt+1 E (0, k)). Since bR e [0, b] for 0 < t < t,
kt+l = K(btR, ) = XbR for bt e [0, b], (28)
where b k/X = ac/[(l - a)yk].14
The dynamics of transfers A. Unconditional dynamics
The evolution of the economy in Regime I, as follows from (26) and (27), is given by
for bR e [0, b], where bo = 0 and bo is given by (25). In order to assure that the economy would ultimately take off from Regime I to II, it is
assumed that the technology is sufficiently productive. That is,
A> A =A(a, y, , , 0). (A3)
As depicted in Figure 1 and established in Appendix A, the function f R (bR, 0) is equal to zero for bR < b, it is increasing and concave for b < bR < b and it crosses the 45? line once in
the interval b < bR < b.
14. Note that one can assure that the economy remains in Regime I for at least one period. For instance, since ko E (0, k(y)) there exist a sufficiently large 0 and a sufficiently small y such that the economy is in Regime I in period 0. In particular, as follows from Lemma 3, bR is decreasing in 0 and is independent of y. Furthermore, k is
decreasing in y and k is increasing in 0. Hence, since k l- kbR if iXb < k there exist a sufficiently small level of y and a sufficiently large level 0 such that kl < k and the economy is in Regime I in period 0.
1012
FROM PHYSICAL TO HUMAN CAPITAL ACCUMULATION
R(b ,0) 45?
A
b b b b bR
FIGURE 1
The dynamical system in Regime I and Stage I of Regime II
Hence, the dynamical system 1R (bR, 0), depicted in Figure 1, has two steady-state equilibria in the interval bR E [0, b]; a locally stable steady state, b = 0, and an unstable steady state, b E (b, b). If bR < T then the transfers within each dynasty of type R contract over time and the system converges to the steady-state equilibrium b = 0. If b > b then the transfers within each dynasty of type R expand over the entire interval (bu, b], crossing into Regime II. To assure that the process of development starts in Regime I and ultimately reaches Regime II, it is assumed that15
bR (u, b). (A4)
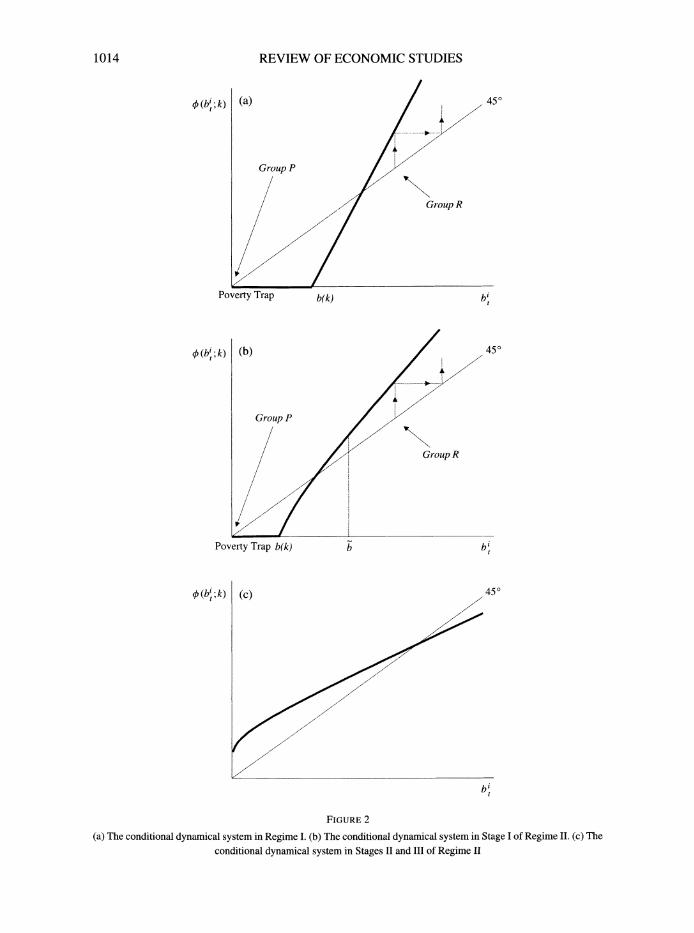
B. Conditional dynamics In order to visualize the evolution of the threshold for the departure of members of group P from the zero transfer state, the dynamics of transfers within dynasties is depicted in Figure 2(a), for a given k. This conditional dynamical system is given by (20). For a given k E (0, k], the dynamic of transfers within dynasty i, is
b - = 0(bt; k) = max{[w(k) + bR(k) - 0], 0}. (30) t+ l t
Hence, there exist a critical level b(k) below which 0 (bi; k) = 0 and above which (b\; k) is linear in b\, with a slope ,BR(k) > 1, i.e.
(p(b'; k) = 0 for 0 < b' < b(k); Y/ \V ' h/ -V t -(31) 30a(b; k)/ bt = f R(k) > 1 for b > b(k).
Note that under Assumption (A3) PR(k) > 1. Otherwise / R(bR, 0) < bR for bR e (0, b], in contradiction to Lemma 4.
As depicted in Figure 2(a), in Regime I, members of group P are trapped in a zero transfer temporary steady-state equilibrium, whereas the level of transfers of members of group R
15. As follows from (25), there exists a feasible set of parameters A, a, , ko, 0, and X that satisfy Assumptions Al () and (A3) such that b (b, b). In particular, given the initial level of capital, if the number of the rich in the initial period is sufficiently small bR > bU.
1013 GALOR & MOAV
REVIEW OF ECONOMIC STUDIES
Group P
450
Group R
b(k)
450
Group P
Group R
Poverty Trap b(k)
450
FIGURE 2
(a) The conditional dynamical system in Regime I. (b) The conditional dynamical system in Stage I of Regime II. (c) The conditional dynamical system in Stages II and III of Regime II
1014
(bt; k) (a)
0(b.;k) (b)
0 (b'; k) (c)
FROM PHYSICAL TO HUMAN CAPITAL ACCUMULATION 1015
increases from generation to generation. As the transfers of members of group R increase the capital-labour ratio increases and the threshold level of transfer, b(k), that enables dynasties of type P to escape the attraction of the no-transfer temporary steady-state equilibrium, eventually declines.
Inequality and the dynamics of output per worker. The evolution of output per worker, Yt, in Regime I, follows from (1), (2), (28) and (29). Provided that Assumption (A4) is satisfied, output per worker, Yt+l, is
where Y'(Yt) > 0. In order to examine the effect of inequality on economic growth, consider two economies
(or two alternative initial states of the same economy): a relatively egalitarian economy, E, and a relatively unegalitarian one, U. Suppose that the economies are identical in all respects except for their degree of inequality. Suppose that income in period t is distributed differently between group R and group P in the two economies. That is, the income of members of group i, (Iti)E, in the egalitarian economy, E, is
(IR E = (IR)U t IR(IR, t); (i^~t E)- ~8t I= Y~ ^~ Et);^
^(33) (ItP)E = (ItP)U + X8t/(l - ) = IP(t, ?t),
where Et > 0, is sufficiently small such that: (i) the economy does not depart from its current stage of development, and (ii) the net income of members of group P remains below that of members of group R.
The transfer of member i of generation t to the offspring in economy, E, is therefore
(b)E = max{fi[I(It, et) - 0], 0} = b(It, t) i = P, R. (34)
Proposition 1. (The effect of inequality on economic growth in Regime I.) Consider two economies (or two alternative initial states of the same economy). Suppose that the economies are identical in all respects except for their degree of inequality. Under Assumptions (A2)-(A4), the less egalitarian economy would be characterized by a superior path of output per worker
Proof. See Appendix A.
Inequality enhances the process development in Regime I since a higher concentration of wealth among members of group P (the poor), would increase aggregate consumption, decrease aggregate intergenerational transfers, and thus would slow capital accumulation and the process of development.
Remark 1. If income is distributed less equally within groups (i.e. if additional income groups are created), then it would not affect output per worker as long as the marginal propensity to save remains equal among all sub-groups of each of the original groups (i.e. f for group R and 0 for group P). Otherwise, since saving is a convex function of wealth, more inequality would promote economic growth.
3.2. Regime II: human capital accumulation
In these mature stages of development, the rate of return to human capital increases sufficiently so as to induce human capital accumulation, and the process of development is fuelled by human
GALOR & MOAV
REVIEW OF ECONOMIC STUDIES
capital as well as physical capital accumulation. In Stages I and II members of group P are credit constrained and their marginal rate of return to investment in human capital is higher than that on physical capital, whereas those marginal rates of returns are equal for members of group R who are not credit constrained. In Stage III all individuals are not credit constrained and the marginal rate of return to investment in human capital is equal to the marginal rate of return on investment in physical capital.
3.2.1. Stage I: selective human capital accumulation. Stage I of Regime II is defined as the time interval t < t < t. In this time interval kt+l E (k, k) and the marginal rate of return on investment in human capital is higher than the rate of return on investment in physical capital for individuals who are credit constrained (members of group P), whereas those rates of returns are equal for members of group R.16
As follows from (11) and Lemma 3, eR > 0 and eP = 0. Hence, given (18), it follows that the capital-labour ratio, kt+l in the interval kt+l E (k, k) is determined by the savings of members of group R, as well as their investment in human capital. Namely,
(bR - e(kt+l)) + - + h(e(kt+l)) (35)
Since e'(kt+l) > 0, it follows that kt+l = K(btR, 0) where aK(btR , O)//bt > 0. Hence, there
exists a unique value b of the level of bt such that kt+l = k. That is, K(b, 0) = k.
The dynamics of transfers A. Unconditional dynamics
The evolution of the economy in Stage I of Regime II, as follows from (24) and (26) is given by17
for bR E [b, b]. In order to assure that the process of development does not come to a halt in this pre-mature
stage of development (i.e. in order to assure that there is no steady-state equilibrium in Stage I of Regime II) it is sufficient that 18[w(Xb) + bR(Xb) - 0] > b-a condition that is satisfied under Assumption (A3).18 This condition assures that if the equation of motion in Regime I would remain in place in Stage I of Regime II, then there is no steady state in Stage I. As established in Appendix B this condition is sufficient to assure that given the actual equation of motion in Stage I of Regime II, the system has no steady state in this stage.
Figure 1 depicts the properties of pR (btR, 0) over the interval bR [b, b]. The transfers within each dynasty of type R expand over the entire interval crossing into Stage II.
16. In all stages of development members of group R are not credit constrained. That is, et < bR, and the level of investment in human capital, et, permits therefore a strictly positive investment in physical capital, b - et, by the members of group R. If et > bR and hence, as follows from Lemma 1, et > bP there would be no investment in physical capital, the return to investment in human capital would be zero and et = 0 < bR in contradiction to et > bR.
17. bR > 0 in this interval since as established in Lemma 4 bR > 0, and as follows from Lemma 5 t+1 t aCR(btR, O)/abtR > 0.
18. For any given b > b (where b is independent of A), since fl[w(Xb) + bR(Xb) - 0] is strictly increasing in A, there exists a sufficiently large A such that t[w(Xb) + bR(Xb) - 0] > b. Note that b decreases with A, however a
sufficiently large 0 assures that k > k.
1016
FROM PHYSICAL TO HUMAN CAPITAL ACCUMULATION 1017
B. Conditional dynamics In order to visualize the evolution of the threshold for the departure of dynasties of type P from the zero transfer state, the dynamics of transfers within dynasties is depicted in Figure 2(b) for a given k. This conditional dynamical system is given by (22). For a given k E (k, k]
= [mx w(k)h(b) - 0] if b < e(k) t+1 m [w(k)h(e(k)) + (b - e(k))R(k) - 0] if b > e(k),
- 0(b, k). (37)
Hence, for a given k E (k, k) there exists a critical level b(k) below which 4)(b\; k) = 0 and above which 0 (bi; k) is increasing and concave in b\. In particular,19
Note that L (bi, k) > bt for all b1 > b. As depicted in Figure 2(b), in Stage I of Regime II, members of group P are still trapped in
a zero transfer temporary steady-state equilibrium, whereas the level of transfers of members of group R increases from generation to generation. As the transfer of members of group R increases the capital-labour ratio increases and the threshold level of transfer, b(k), that enables members of group P to escape the attraction of the no-transfer temporary steady-state equilibrium, eventually declines and ultimately vanishes as the economy enters Stage II.
Stage I of Regime II is an intermediate stage in which inequality has an ambiguous effect on the rate of economic growth. A lower level of wealth among members of group R, along with a higher level of wealth, but below the threshold 0, among some members of group P, would increase aggregate consumption, decrease aggregate intergenerational transfers, and thus would slow physical and human capital accumulation and the process of development. However a lower level of wealth among members of group R, along with a higher level of wealth, above the threshold 0, among some members of group P, would generate investment in human capital among these individuals, bringing about an increase in the aggregate stock of human capital that can offset the negative effect of equality on the accumulation of physical capital.
3.2.2. Stage II: universal human capital investment. Stage II of Regime II is defined as the time interval t < t < t*, where t* is the time period in which the credit constraints are no longer binding for members of group P, i.e. bp > et*. In this time interval, the marginal rate of return on investment in human capital is higher than the marginal rate of return on investment in physical capital for members of group P, whereas these rates of return are equal for members of group R. As established previously once t > t the economy exits Stage I of Regime II and enters Stage II of Regime II. In the initial period kf+l > k and therefore bpl > 0 and consequently as
established in Appendix C, the sequence {bR, bP } increases monotonically over the time interval < t < t*.
As follows from (11), (0 and 0), and (18), in Stage II ef = bP < and et and = and therefore the capital-labour ratio is determined by intergenerational transfers and investment in human capital of both types of individuals,
(b/R -e(kt+l)) kt+l . (39)
(1 -l )h(bP) + .h(e(kt+l))
19. Note that the condition f,[w(Xb) + bR(Xb) - 0] > b that follows from Assumption (A3) and assures that there is no steady state in Stage I of Regime II, implies that /BR(k) > 1.
GALOR & MOAV
REVIEW OF ECONOMIC STUDIES
Since e'(kt+l) > 0, it follows that kt+l = K(bR, bP) where K(bR, bP)/abtR > 0 and aK (b/R, bp)/abp < 0.
The dynamics of transfers A. Unconditional dynamics
The evolution of the economy, in Stage II of Regime II (i.e. as long as credit constraints are still binding-bP < et), as follows from (20) and (26), is given by
where kt + = K (btR, bf). The unconditional dynamical system in Stage II of Regime II is rather complex and the
sequence of technical results that is presented in Appendix C characterizes the properties of the system. In particular, it is shown that intergenerational transfers within the two groups, (b/R, bf), increase monotonically over time in Stage II of Regime II and the economy necessarily enters into Stage III of Regime II.
B. Conditional dynamics
The evolution of transfers within dynasties is depicted in Figure 2(c) for a given k > k.20 This conditional dynamical system is given by (22). For a given k > k,
bi + {P[w(k)h(b) - 0] if b) < e(k) t+l |Bi[w(k)h(e(k)) + (bt - e(k))R(k) - 0] if b[ > e(k)
=0(bt, k). (41)
Hence, for a given k > k, over the interval 0 < b\ < e(k), / (b; k) is a positive, increasing, and concave function of b[, where
3a(bt; k)/lbt > pR(k) > 0 for < b\ < e(k); t t t (42) a p(b'; k)/abt = PR(k) for b' > e(k).
Note that for k > k it follows that 0 (b\, k) > b[ for at least a strictly positive range b[ e [0, b], where b > b.
As depicted in Figure 2(c), in Stage II of Regime II, members of group P depart from the zero transfer temporary equilibrium. The level of transfers of members of group P increases from generation to generation. Eventually members of group P are not credit constrained, i.e. bp > et and the economy endogenously enters into Stage III of Regime II.
Inequality and the dynamics of output per worker. Since in Stage II and III of Regime II the income of each individual is greater than 0, it follows from (13) that the marginal propensity to transfer is equal to P among all individuals. The aggregate transfers of members of generation t, b R + (1 - ,)bt, are therefore simply a fraction , of Yt - 0 > 0. That is,
kbtR + (1 - )bf = P3(Yt -0). (43)
20. Note that kt in Stage II of Regime II may decline below k. In this case, conditional dynamics are described
by (38). However, bP is non-decreasing in Stage II of Regime II, that is, bP is above the threshold level b = 0(b, k) of (38).
1018
FROM PHYSICAL TO HUMAN CAPITAL ACCUMULATION 1019
The evolution of output per worker, Yt, in Stage II of Regime II, as follows from (1), (15), (16), noting that eR = et and ef = bf, is therefore
Since et = argmax[wt+lh(et) - Rt+let] = argmax Yt+l (and since therefore aYt+li/et = 0), it follows that
Yt+l _ Y(Yt, bp), (45) where aY(Yt, bp)/aYt > 0 and aY(Yt, bp)/abf > 0, noting that as follows from (2) and (10), h'(bp) > h'(et) = a/[(l- a)kt+l].
Lemma 2. Under (A2)-(A4), Yt increases monotonically over Stage II.
The lemma follows from (43) and Corollary 3 (in Appendix C).
Proposition 2. (The effect of inequality on economic growth in Stage II of Regime II.) Consider two economies (or two alternative initial states of the same economy). Suppose that the economies are identical in all respects except for their degree of inequality. Under Assumptions (A2)-(A4), the more egalitarian economy would be characterized by a superior path of output per worker.
Proof: See Appendix C.
Inequality negatively affects the process development in Stage II of Regime II. A lower concentration of wealth among members of group R and a higher concentration of wealth among members of group P would not affect aggregate consumption, and aggregate intergenerational transfers, but due to liquidity constraints of members of group P would allow for a more efficient allocation of aggregate investment between physical and human capital.
Remark 2. If income is distributed less equally within groups, then it would not affect the aggregate level of intergenerational transfers as long as the marginal propensity to transfer, ,B, is equal among all members of the economy. However, an unequal distribution of income among members of group P would generate a less efficient allocation of human capital, due to the liquidity constraints and the concavity of h (eP), and thus would lower the path of output per worker. An unequal distribution among members of group R, as long as all the members of sub- groups of R remain unaffected by credit constraint, will not affect output. If however an unequal distribution is associated with some members of sub-groups of R being credit constrained, it would be associated with a lower path of output per worker.
3.2.3. Stage III-unconstrained investment in human capital. Stage III of Regime II is defined as t > t* where credit constraints are no longer binding (i.e. bf >_ bf > et). In this time interval the marginal rate of return on investment in human capital is equal to the marginal rate of return on investment in physical capital for all individuals.
As follows from (0 and 0), in Stage III of Regime II ep = etR = et. Hence, given (18) and (43) it follows that kt+l is given by
k p[Y -0] - e(kt+) (46) kt+l = ? (46) h(e(kt+l))
Since e'(kt+l) > 0, it follows that kt+l = k(Yt) where k'(Yt) > 0 and limy,too kt+l = oo.
GALOR & MOAV
REVIEW OF ECONOMIC STUDIES
The dynamics of transfers and output per worker. The evolution of the economy in Stage III of Regime II, as follows from (24) and (26), is given by
The evolution of output per worker, Yt, in Stage III of Regime II, is independent of the distribution of intergenerational transfers. As follows from (1) and (43)
Yt+l = A[3(Yt - 0) - et]a[h(et)]l1-a. (48)
Since et = argmax Yt+l, it follows that aYt+l/let = 0 and therefore
Yt+l = YIII(Y), (49)
where YIII(Yt) = faAkt-1 > 0, yIll (Yt) < 0 and limytoo YIII(Yt) = 0 since limytoo kt+l = o.
As established in Appendix D, in Stage III of Regime II, Yt increases monotonically and converges to a unique, locally stable, steady-state equilibrium Y > 0, where intergenerational
-P -R transfers are positive and equal across all individuals, i.e. b = b > 0.
Redistribution and the dynamics of output per worker
Proposition 3. (The effect of inequality on economic growth when credit constraints are no longer binding.) Consider two economies (or two alternative initial states of the same economy). Suppose that the economies are identical in all respects except for their degree of inequality. The two economies would be characterized by an identical path of output per worker
The proposition follows from the fact that Yt+i in (49) is independent of the distribution of output per worker in period t between the two groups.
Inequality has no effect on the growth process in Stage III of Regime II, since in the absence of credit constraints investment in human capital is optimal and since the marginal propensity to save is equal across individuals.
4. INEQUALITY AND DEVELOPMENT
Theorem 1. Under Assumptions (A1)-(A4)
(a) In the early stage of development when the process of development is driven by capital accumulation, inequality raises the rate of growth of output per worker over the entire stage.
(b) In the mature stage of development when the process of development is driven by universal human capital accumulation and credit constraints are binding, equality raises the growth rate of output per worker over the entire stage.
The theorem is a corollary of Propositions 1 and 2 and Remarks 1 and 2. In the early stage of development inequality is conducive for economic development. In
this stage the rate of return to human capital is lower than the rate of return to physical capital and the process of development is fuelled by capital accumulation. Since capital accumulation is the prime engine of growth and since the marginal propensity to save is an increasing function of the individual's wealth, inequality increases aggregate savings and capital accumulation and enhances the process of development. Inequality enhances the process development in Regime I
1020
FROM PHYSICAL TO HUMAN CAPITAL ACCUMULATION 1021
since a transfer of wealth from members of group R to members of group P (who do not save in this stage) would increase aggregate consumption, decrease aggregate intergenerational transfers, and thus would slow capital accumulation and the process of development.
In mature stages of development, the rate of return to human capital increases sufficiently so as to induce human capital accumulation, and the process of development is fuelled by human capital as well as physical capital accumulation. Since human capital is embodied in individuals and each individual's investment is subjected to diminishing marginal returns, the aggregate return to investment in human capital is maximized if the marginal returns are equalized across individuals. Equality therefore alleviates the adverse effect of credit constraints on investment in human capital and promotes economic growth.
5. CONCLUDING REMARKS
This paper presents a unified approach for the dynamic implications of income inequality on the process of development.21 The proposed theory provides an intertemporal reconciliation for conflicting viewpoints about the effect of inequality on economic growth. The paper argues that the replacement of physical capital accumulation by human capital accumulation as a prime engine of economic growth altered the qualitative impact of inequality on the process of development. In early stages of industrialization, as physical capital accumulation is a prime source of economic growth, inequality enhances the process of development by channelling resources towards the owners of capital whose marginal propensity to save is higher. In later stages of development, however, as the return to human capital increases due to capital-skill complementarity, human capital becomes the prime engine of economic growth. Since human capital is inherently embodied in humans and its accumulation is larger if it is shared by a larger segment of society, equality, in the presence of credit constraints, stimulates investment in human capital and promotes economic growth. As income further increases, credit constraints gradually diminish, differences in saving rates decline, and the effect of inequality on economic growth becomes insignificant.22
The theory generates a testable implication about the effect of inequality on economic growth. In contrast to the credit markets imperfection approach that suggests that the effect of inequality on economic growth depends on the country's level of income (i.e. inequality is beneficial for poor economies and harmful for rich ones), the current research suggests that the effect of inequality on growth depends on the relative return to physical and human capital. As long as credit constraints are largely binding, the higher is the relative return to human capital the more adverse (or the less beneficial) is the effect of inequality on economic growth. Hence, although the replacement of physical capital accumulation by human capital accumulation as a prime engine of economic growth in the currently developed economies is instrumental for the understanding of the role of inequality in their process of development, the main insight of the paper is relevant for the currently less developed economies that may have evolved differently. In some of the current LDCs, the presence of international capital inflow diminishes the role of inequality in stimulating physical capital accumulation. Moreover, the adoption of skill-biased technologies, increases the return to human capital and thus, given credit constraints, strengthens the positive effect of equality on human capital accumulation and economic growth.
21. This unified approach complements the recent unified theories of economic growth (e.g. Galor and Weil (1996, 1999, 2000), Galor and Moav (2002)).
22. If heterogeneity in ability would be incorporated into the analysis, inequality at these mature stages of development may raise the incentives for investment and hence stimulate economic growth (Galor and Tsiddon (1997), Maoz and Moav (1999), Hassler and Rodriguez Mora (2000)).
GALOR & MOAV
REVIEW OF ECONOMIC STUDIES
The inclusion of non-convexities in the production of human capital and physical capital would not alter qualitatively the proposed theory and its testable implications. In early stages of development inequality would remain beneficial for economic growth. The importance of inequality for physical capital accumulation, due to the higher propensity to save among the rich, would be further enhanced since the concentration of resources in poor economies permits at least some individuals to undertake investments. The existence of non-convexities, however, may increase the likelihood for poverty traps and persistent inequality. In advanced stages of development, in the presence of non-convexities in investments, equality will improve the efficiency of resource allocation, as in the existing structure, by equalizing the marginal returns to human capital and physical projects.
The incorporation of endogenous fertility decisions into the basic model would enrich the understanding of the reasons for the changing role of inequality in the process of development. If, for instance, individuals gain utility from the quantity and the wealth of their children, then as long as the income of poor families is insufficient to provide bequests for their children, poor individuals would choose high fertility rates that would negatively affect the capital-labour ratio and hence offspring's income, delaying the timing of universal investment in human capital. However, once wages would increase sufficiently due to capital accumulation and the poor can afford bequeathing, there is an incentive to reduce the number of children, increasing the share of bequest to each child. The second phase of the transition to moder growth would be therefore accelerated.
The introduction of endogenous technological progress that is fuelled by human capital accumulation would not affect the qualitative results. If human capital accumulation is conducive for economic growth, the optimal evolution of the economy would require the fastest capital accumulation in early stages of development so as to raise the incentive to invest in human
capital. Inequality in early stages of development would therefore stimulate the process of development.23
APPENDIX A
This appendix presents some technical results that are needed in order to characterize the dynamical system in Regime I, as well as the proof of Proposition 1.
Lemma 3. Under Assumptions (Al) and (A2), in Regime I and Stage I of Regime II (i.e. for the time interval 0 < t < t), there are no intergenerational transfers among dynasties of group P (the poor), i.e.
bP = O0 for O < t <t.
Proof As follows from the definition of k, if kt < k then w(kt) < 0. Hence, since ko < k it follows from (25) that bP = max[f[w(ko) - 0], 0] = 0. Furthermore, for 1 < t < F, as long as b = 0 the descendents of members of
group P do not invest in human capital in period t - 1, h = 1, and therefore bP = max[[w(kt) - 0], 0] = 0. II
Lemma 4. (The properties of llR (bR, 0).) As depicted in Figure 1, under Assumptions (A2) and (A3), there exists b E (0, b) such that 1R (bR, 0) Ofor b < b. Furthermore, the function R (bR , 0) is increasing and strictly concave in the interval btR E (, b], and fR (b, 0) > b.
23. Finally, it is interesting to note that the effect of inequality on economic growth is qualitatively similar to the effect of assortative marriages on economic growth. In early stages of development since inequality is beneficial for growth, assortative marriages (i.e. sorting of couples by income) raise inequality and promote growth. However, in later stages of development in which equality contributes to economic growth, mixed marriages promote growth. Fernandez, Guner and Knowles (2001) find a significant positive relationship between the skill premium (inequality) and of the degree of correlation of spouses' education (marital sorting).
1022
FROM PHYSICAL TO HUMAN CAPITAL ACCUMULATION 1023
Proof Follows from (2) and (29), noting that b = [O/Aa (1 -a+ca/X)]1/a decreases in A and b = a/[(1-a)Xy] is independent of A. II
Corollary 1. As depicted in Figure 1, under Assumptions (A2) and (A3), the dynamical system pR (bR, O) has two steady-state equilibria in the interval bR E [0, b]; a locally stable steady state, b = 0, and an unstable steady state, b E (b, b).
Proof of Proposition 1. As long as the economy is in Regime I, IP (ItP, Et) < 0, and [IR (IR, ?t)-0] E (b , b). Hence, it follows from (34) that ab /aet = 0 and abtR/aet < . Hence Yt+1 = A[b R]" = A{Xp[IR(ItR, et) - O]}a declines in et, and the growth rate of Yt decreases if income inequality is lower. Moreover, as follows from (32), Yt+2 increases in Yt+1 and output increases in all the subsequent periods of Regime I. II
APPENDIX B
This appendix presents some technical results that are needed in order to characterize the dynamical system in Stage I of
Regime II.
Lemma 5. Under Assumptions (A2) and (A3), the properties of R (b R, 0) in the interval bR E [b, b] are
a*R (btR ,)/abtR > 0 R R
g R(bR, 0)> btR
Proof arR (btR, O)/abR > 0 as follows from the properties of (2). Moreover, Lemma 4 and the condition
P[w(Xb)+bR(Xb)- ] > b, imply that in the absence of investment in human capital fp[w(Xb?R)+bR R(XbR)-6] > bR for bR E [b, b]. Since af R(bR, O)/aeR > 0 for bR E (b, b], and eR E [0, et], it follows therefore that F R(bR, O) >
f[w(XbR) + bRR(XbR) 0] > bR for bR e [b,b]. II
Corollary 2. The dynamical system 1rR (bR, 0) has no steady-state equilibria in the interval bR E [b, b].
APPENDIX C
This appendix presents some technical results that are needed in order to characterize the dynamical system in Stage II of Regime II, as well as the proof of Proposition 2.
Lemma 6. Under Assumptions (A2)-(A4), alli (bR, bP)/ab/ > 0 for all i, j = P, R in the time interval t < t < t*.
Proof Follows from (1), (10), (39) and (40), noting that (i) h'(bP) > a/(l - a)kt+l, and (ii) an increase in bP increases output per worker, and hence aggregate wage income, and decreases et. II
Lemma 7. Under Assumptions (A2)-(A4), bP > 0 in the time interval t < t < t*.
Proof Given Lemma 5 and the definition of t, bR > bR > 0 and bP+ > bP = 0. Hence it follows from (40) t+1 t t+1 t
and the positivity of lri (bR, bP)/abj for all i, j = P, R, that bP > 0 in the time interval t < t < t*.I
Lemma 8. Under (A2)-(A4), there exists no steady-state equilibrium in Stage II of Regime II.
Proof A steady-state equilibrium is a triplet (k, bP, bR) such that bR = (bR, k), bP = (bP, k), and
k = K(bR, bP). If there exists a non-trivial steady state in Stage II of Regime II then Lemmas 1 and 7 imply that (k, bP, bR) > 0. As follows from (31), (38) and (42), for any k there exists at most one bi = 0(bi, k) > 0. Hence, since 0 is independent of i = P, R, if there exists a non-trivial steady state then bP = bR > 0 and therefore bP > et, and the
steady state is not in Stage II of Regime II. II
Corollary 3. Under (A2)-(A4), (bR, bP) increases monotonically in Stage II of Regime II.
GALOR & MOAV
REVIEW OF ECONOMIC STUDIES
Proof Given Lemma 5 and the definition of t, bR > bR > 0 and bP > bP = 0. Hence since as follows i-I- t t+l t
from Lemmas 6-8 li' (bR, bP)/ab/ > 0 for all i, j = P, R, and there exists no steady-state equilibrium in Stage II, (bR, bP) increase monotonically in Stage II of Regime II. II
Proof of Proposition 2. As long as economy E is in Stage II of Regime II (i.e. I P (IP, t) > 0 and
P[IP(ItP, t) - 0] < et) it follows from (34) that abP/ast > 0 and abR/Iat < 0. Hence, as follows from the
properties of the function in (45)
aYt+l aY(Yt,bt ) abtP ' > 0, (50)
aEt abP aEt
and therefore
aYt+2 aYt+2 abt+l ab + aYt+2 aYt+l > (51) -.ab.. > b +i o . (51) aEt abP abP agt aYt+l aEt
Hence, aYt+j /at > 0 for j = 1, 2, 3, 4..., and the proposition follows. II
APPENDIX D
This appendix presents some technical results that are needed in order to characterize the dynamical system in Stage III of Regime II.
Lemma 9. Under (A2)-(A4), Yt increases monotonically in Stage III of Regime II and converges to a unique, locally stable, steady-state equilibrium Y > 0.
Proof. As follows from the properties of the functions in (45), (48) and (49), Yt+l = YI (Yt) = max Y(Yt, bP). Hence, it follows from Lemma 2 that once the system enters Stage III Yt+l > Yt. Moreover, since YIII (Yt) is strictly concave and since limytoo YII '(Yt) = 0, output increases monotonically converging to a unique, locally stable, steady-state equilibrium, Y > 0. II
Lemma 10. Under (A2)-(A4), the economy converges to a steady-state equilibrium where intergenerational transfers are positive and equal across all individuals, i.e.
bP = b > 0.
Proof As follows from the properties of (46) and Lemma 9 the economy converges to a unique steady-state level of the capital-labour ratio, k = k(Y). As follows from (31), (38) and (42), given k it follows that b' = b
where b1 = ((bi, k), otherwise (since aO(bi, k)/ab' > 0) either (b1 decreases (increases) for all i and thus k decreases (increases)) or (bR increases indefinitely and bP decreases to zero, and thus k increases) in contradiction
R R P P R -P to the stationarity of k. Hence, bR = ?(b ,k), = 4(bP, k), and k = K (b , b ). As follows from Lemmas 4 and 5
there is no non-trivial steady-state equilibrium under which bP = 0. Hence the steady-state equilibrium is (b , b ) >> 0, where bP = b since p is independent of i = P, R. ||
Acknowledgements. The authors benefited from comments by the Editor and three anonymous referees and from discussions with Daron Acemoglu, George Akerlof, Abhijit Banerjee, Ana Ferandes, Claudia Goldin, Elhanan Helpman, Larry Katz, Joel Mokyr, and seminar participants at Bar-Ilan University, Ben-Gurion University, BU, Hebrew University, MIT, UBC, the World Bank, the NBER Summer Institute 1999, the EEA meetings 1999, Crisis, Inequality and Growth, Aix 2000, the Canadian Institute of Advanced Research 2000, CEPR ESSIM, Israel 2001, CEPR Conference on the Economics of Education, Bergen 2001, AEA Meetings 2002. Moav gratefully acknowledges financial support from the Falk Institute. Galor gratefully acknowledges financial support from the National Science Foundation Grant SES- 0004304.
REFERENCES ABRAMOVITZ, M. (1993), "The Search of the Sources of Growth: Areas of Ignorance, Old and New", Journal of
Economic History, 53, 217-243. ABRAMOVITZ, M. and DAVID, P. A. (2000), "American Macroeconomic Growth in the Era of Knowledge-Based
Progress: The Long-Run Perspective", in S. L. Engerman and R. E. Gallman (eds.) The Cambridge Economic History of the United States (Cambridge; New York, NY: Cambridge University Press).
1024
FROM PHYSICAL TO HUMAN CAPITAL ACCUMULATION 1025
ACEMOGLU, D. (2002), "Technical Change, Inequality, and the Labor Market", Journal of Economic Literature, 40, 7-72.
AGHION, P. and BOLTON, P. (1997), "A Theory of Trickle-Down Growth and Development", Review of Economic Studies, 64, 151-172.
ALESINA, A. and RODRIK, D. (1994), "Distributive Politics and Economic Growth", Quarterly Journal of Economics, 109,465-490.
AUTOR, D. H., KATZ, L. F and KRUEGER, A. B. (1998), "Computing Inequality: Have Computers Changed the Labor Market?': Quarterly Journal of Economics, 113, 1169-1213.
BANERJEE, A. and DUFLO, E. (2003), "Inequality and Growth: What Can the Data Say?", Journal of Economic Growth, 8, 267-279.
BANERJEE, A. and NEWMAN, A. (1993), "Occupational Choice and the Process of Development'; Journal of Political Economy, 101, 274-298.
BARRO, R. J. (2000), "Inequality, Growth and Investment", Journal of Economic Growth, 5, 5-32. BENABOU, R. (1996a), "Equity and Efficiency in Human Capital Investment: The Local Connection", Review of
Economic Studies, 63, 237-264. BENABOU, R. (1996b), "Inequality and Growth'" NBER Macroeconomics Annual, 11, 11-74. BENABOU, R. (2000), "Unequal Societies: Income Distribution and the Social Contract", American Economic Review,
90, 96-129. BOURGUIGNON, F. (1981), "Pareto Superiority of Unegalitarian Equilibria in Stiglitz' Model of Wealth Distribution
With Convex Saving Function", Econometrica, 49, 1469-1475. CASELLI, F. (1999), "Technological Revolutions", American Economic Review, 89, 78-102. CHECCHI, D. (2001), "Inequality in Incomes and Access to Education. A Cross-Country Analysis (1960-95)" (Mimeo,
University of Milan). CLARK, G. (2003), "The Condition of the Working-Class in England, 1200-2000: Magna Carta to Tony Blair", UC
Davis. COOK, C. (1995), "Saving Rates and Income Distribution: Further Evidence from LDCs", Applied Economics, 27, 71-82. CRAFTS, N. F. R. (1985) British Economic Growth During the Industrial Revolution (Oxford: Clarendon Press). DEATON, A. (1992) Understanding Consumption (Oxford: Clarendon Press). DOLLAR, D. and KRAAY, A. (2002), "Growth is Good for the Poor", Journal of Economic Growth, 7, 195-225. DURLAUF, S. N. (1996), "A Theory of Persistent Income Inequality", Journal of Economic Growth, 1, 75-94. DYNAN, K. E., SKINNER, J. and ZELDES, S. (2000), "Do the Rich Save More?" (NBER Working Paper 7906). EASTERLY, W. (2001), "The Middle Class Consensus and Economic Development", Journal of Economic Growth, 6,
317-335. FERNANDEZ, R., GUNER, N. and KNOWLES, J. (2001), "Love and Money: A Theoretical and Empirical Analysis
of Household Sorting and Inequality" (NBER Working Paper 8580). FERNANDEZ, R. and ROGERSON, R. (1996), "Income Distribution, Communities, and the Quality of Public
Education'" Quarterly Journal of Economics, 111, 135-164. FISHMAN, A. and SIMHON, A. (2002), "The Division of Labor, Inequality and Growth", Journal of Economic Growth,
7, 117-136. FLORA, P., KRAUS, F. and PFENNING, W. (1983) State, Economy and Society in Western Europe 1815-1975, Vol. I
(Chicago: St. James Press). FLUG, K., SPILIMBERGO, A. and WACHTENHEIM, E. (1998), "Investment in Education: Do Economic Volatility
and Credit Constraints Matter?'" Journal of Development Economics, 55, 465-481. FORBES, K. (2000), "A Reassessment of the Relationship Between Inequality and Growth'; American Economic Review,
90, 869-887. GALOR, O. and MOAV, O. (2000), "Ability Biased Technological Transition, Wage Inequality and Growth'" Quarterly
Journal of Economics, 115, 469-98. GALOR, O. and MOAV, O. (2002), "Natural Selection and the Origin of Economic Growth", Quarterly Journal of
Economics, 117, 1133-1192. GALOR, O. and MOAV, O. (2003), "Das Human Kapital: A Theory of the Demise of the Class Structure" (Brown
University). GALOR, O. and TSIDDON, D. (1997), "Technological Progress, Mobility, and Growth", American Economic Review,
87, 363-382. GALOR, O. and WEIL, D. N. (1996), "The Gender Gap, Fertility and Growth", American Economic Review, 86,
374-387. GALOR, O. and WEIL, D. N. (1999), "From Malthusian Stagnation to Modem Growth'; American Economic Review,
89, 150-154. GALOR, O. and WEIL, D. N. (2000), "Population, Technology, and Growth: From the Malthusian Regime to the
Demographic Transition and Beyond", American Economic Review, 90, 806-828. GALOR, O. and ZEIRA, J. (1993), "Income Distribution and Macroeconomics", Review of Economic Studies, 60, 35-52. GOLDIN, C. and KATZ, L. F (1998), "The Origins of Technology-Skill Complementary", Quarterly Journal of
Economics, 113, 693-732. GOLDIN, C. and KATZ, L. F (1999), "The Return to Skill across the Twentieth Century United States" (NBER Working
Paper 7126). GOLDIN, C. and KATZ, L. F (2001), "The Legacy of U.S. Educational Leadership: Notes on Distribution and Economic
Growth in the 20th Century", American Economic Review, 91, 18-23.
GALOR & MOAV
REVIEW OF ECONOMIC STUDIES
GOULD, E. D., MOAV, O. and WEINBERG, B. A. (2001), "Precautionary Demand for Education, Inequality, and Technological Progress", Journal of Economic Growth, 6, 285-315.
GREEN, A. (1990) Education and State Formation (New York: St. Martin's Press). HASSLER, J. and RODRIGUEZ MORA, J. (2000), "Intelligence, Social Mobility, and Growth", American Economic
Review, 90, 888-908. KALDOR, N. (1957), "A Model of Economic Growth", Economic Journal, 67, 591-624. KEYNES, J. M. (1920), "The Economic Consequences of the Peace" (Macmillan). LANDES, D. S. (1969) The Unbound Prometheus. Technological Change and Industrial Development in Western Europe
from 1750 to the Present (Cambridge: Cambridge University Press). LEWIS, W. A. (1954), "Economic Development with Unlimited Supply of Labor", The Manchester School, 22, 139-191. MAOZ, Y. D. and MOAV, O. (1999), "Intergenerational Mobility and the Process of Development", Economic Journal,
109, 677-697. MATTHEWS, R. C., FEINSTEIN, C. H. and ODLING-SMEE, J. C. (1982) British Economic Growth 1856-1973
(Stanford: Stanford University Press). MENCHIK, P. and DAVID, M. (1983), "Income Distribution, Lifetime Savings, and Bequests", American Economic
Review, 73, 672-690. MOAV, O. (2002), "Income Distribution and Macroeconomics: The Persistence of Inequality in a Convex Technology
Framework", Economics Letters, 75, 187-192. MOKYR, J. (1990) The Lever of Riches (New York: Oxford University Press). MOKYR, J. (1993), "The New Economic History and the Industrial Revolution", in J. Mokyr (ed.) The British Industrial
Revolution: an Economic Perspective (Boulder, CO: Westview Press) 1-131. MOOKHERJEE, D. and RAY, D. (2003), "Persistent Inequality", Review of Economic Studies, 70, 369-393. PANIZZA, U. (2002), "Income Inequality and Economic Growth: Evidence from American Data", Journal of Economic
Growth, 7, 25-41. PEROTTI, R. (1996), "Growth, Income Distribution, and Democracy: What the Data Say", Journal of Economic Growth,
1, 149-187. PERSSON, T. and TABELLINI, G. (1994), "Is Inequality Harmful for Growth?", American Economic Review, 84,
600-621. QUAH, D. (2002), "Some Simple Arithmetic on How Income Inequality and Economic Growth Matter" (Mimeo, London
School of Economics). SANDERSON, M. (1995) Education, Economic Change and Society in England 1780-1870 (Cambridge: Cambridge
University Press). SCHMIDT-HEBBEL, K. and SERVEN, L. (2000), "Does Income Inequality Raise Aggregate Saving?", Journal of
Development Economics, 61, 417-446. SMITH, A. (1776) The Wealth of Nations (New York: Modem Library). TOMES, N. (1981), "The Family, Inheritance and the Intergenerational Transmission of Inequality", Journal of Political